Software Equity Group Flash...
43
Public Software Companies By Product Category P bli S SC i Select M&A Transactions and Financial and Stock Market Performance Software Equity Group Flash Report May 2013 [email protected] Copyright © 2013 by Software Equity Group, L.L.C., All Rights Reserved f: (858) 509-2818 12220 El Camino Real, #320 San Diego, CA 92130 p: (858) 509-2800 Public SaaS Companies Public Internet Companies By Product Category Software Equity Group, L.L.C.
Transcript of Software Equity Group Flash...

Public Software Companies By Product CategoryP bli S S C i
Select M&A Transactionsand
Financial and Stock Market Performance
Software Equity Group Flash ReportMay 2013
Copyright © 2013 by Software Equity Group, L.L.C., All Rights Reserved
f: (858) 509-2818
12220 El Camino Real, #320San Diego, CA 92130
p: (858) 509-2800
Public SaaS CompaniesPublic Internet Companies By Product Category
Software Equity Group, L.L.C.

Copyright © 2013 by Software Equity Group, L.L.C., All Rights Reserved

ABOUT OUR FIRM
Software Equity Group is an investment bank and M&A advisory serving the software and technology sectors. Founded in 1992, our firm has represented and guided private companies throughout the United States and Canada, as well as Europe, Asia Pacific, Africa and Israel. We have advised public companies listed on the NASDAQ, NYSE, American, Toronto, London and Euronext exchanges. Software Equity Group also represents several of the world's leading private equity firms. We were recently ranked among the top ten investment banks worldwide for application software mergers and acquisitions.
Our value proposition is unique and compelling. We are skilled and accomplished investment bankers with extraordinary software, internet and technology domainexpertise. Our industry knowledge and experience span virtually every software product category, technology, market and delivery model, including Software-as-a Service (Saas), software on-demand and perpetual license. We have profound understanding of software company finances, operations and valuation. We monitor and analyze every publicly disclosed software M&A transaction, as well as the market, economy and technology trends that impact these deals. We're formidable negotiators and savvy dealmakers who facilitate strategic combinations that enhance shareholder value.
Copyright © 2013 by Software Equity Group, L.L.C., All Rights Reserved
THE SEG SOFTWARE COMPANY MENTORING PROGRAM
As part of our informal mentoring program, we are currently guiding and advising some fifty software companies around the globe that are not yet exit candidates, but aspire to be in the next few years. We meet with them periodically, invite them to call whenever they’d like our opinion on an operational issue that might have exit implications later on, and we keep them apprised of M&A activity and financings in their product category. And the best news – we don’t charge for this mentoring advice. It’s complimentary. It’s our way of building value, and relationships.
We’re looking for a few more such relationships. We begin with an introductory phone call with companies interested in being mentored, followed by a more in-depth telephone conversation. We’ll then invite qualified candidates to meet personally with four or five members of our team at our San Diego office. During this three to four hour sit-down, we’ll discuss the current market, specifically as it relates to valuations, transactions and trends in your product category. We’ll assess the strengths and weakness of your financial performance, how that compares to other software companies your size, and how that relates to buyer expectations. We’ll discuss your market strategy, sales strategy, sales team track record, software and maintenance pricing strategies, equity structure, and a wide array of other factors that can materially impact your salability and valuation down the road. We’re a terrific sounding board. We’ll give you an informed, honest and frank opinion – that’s what we’re known for. And we’ll offer informed and insightful observations, ideas and options based on 17 years of working with countless software companies worldwide.
If you run a profitable software company with revenue in excess of $10 million, and you’re interested in learning more about SEG’s complimentary, no obligation mentoring .2800-509-858or [email protected], please contact Kris Beible at
ADDITIONAL RESEARCH
http://www.softwareequity.com/research_quarterly_reports.aspx, please visit: 03Q1For our complimentary current and archived Quarterly Reports from
http://www.softwareequity.com/research_flash_reports.aspx, please visit: 2008For our complimentary current and archived Monthly Flash Reports from July
http://www.softwareequity.com/research_annual_reports.aspx, please visit: 2011through 2003 For our Annual Reports from

CRM Customer Relationship ManagementEBITDA Earnings before Interest, Taxes, Depreciation, and AmortizationERP Enterprise Resource PlanningEV Enterprise ValueFCF Free Cash FlowFORWARD Current EV / Next Four Quarters' Consensus Financial EstimatesNASDAQ National Association of Securities Dealers Automated Quotation System
List of Commonly Used Acronyms
NASDAQ National Association of Securities Dealers Automated Quotation SystemPLM Product Lifecycle ManagementR&D Research and DevelopmentS&P Standard & Poor'sSaaS Software-as-a-ServiceSEG Software Equity GroupSG&A Selling, General, & AdministrativeSW SoftwareTTM Trailing Twelve MonthYoY Year-over-YearYTD Year-to-date
Copyright © 2013 by Software Equity Group, L.L.C., All Rights Reserved

Select Software Industry M&A TransactionsMay 2013
Copyright © 2013 by Software Equity Group, L.L.C., All Rights Reserved

Select March 2013 Software Industry M&A TransactionsDate
Announced EV/ Revenue
Apr-30-2013 Health Reviser FitPal - - -Apr-30-2013 FleetCor Technologies, Inc. (NYSE:FLT) CardLink Systems Limited - - -Apr-30-2013 Courier Corporation (NasdaqGS:CRRC) FastPencil, Inc. - - -Apr-30-2013 ValueCentric, LLC Global Healthcare Exchange, LLC, - - -Apr-29-2013 Myriad Group AG (SWX:MYRN) Metaswitch Networks, RCS Products and - - -Apr-29-2013 Qiagen NV (NasdaqGS:QGEN) Ingenuity Systems, Inc. $20.0 $105.0 5.3xApr-25-2013 Facebook, Inc. (NasdaqGS:FB) Parse - - -Apr-25-2013 Software AG (XTRA:SOW) Relational Networks, Inc. - $25.0 -Apr-25-2013 Intel Corporation (NasdaqGS:INTC) Aepona Ltd - - -Apr-24-2013 Alegeus Technologies WealthCare Marketplace - - -Apr-24-2013 Peoplefluent, Inc. KZO Innovations, Inc. - - -Apr-24-2013 nCrowd, Inc. Tippr.com LLC - - -Apr-24-2013 nCrowd, Inc. Groupalicious.com - - -Apr-24-2013 Dassault Systemes SA (ENXTPA:DSY) FE-DESIGN GmbH - - -Apr-23-2013 LX Ventures Inc. (TSXV:LXV) Mobio Identity Systems, Inc. - $0.4 -Apr-23-2013 MuleSoft Inc Programmable Web LLC - - -
Acquirer TargetTarget TTM Revenue ($mm)
Implied Enterprise Value ($mm)
Apr-23-2013 MuleSoft, Inc. Programmable Web LLC - - -Apr-23-2013 Binary Tree, Inc. ManageRED Software - - -Apr-23-2013 Google Inc. (NasdaqGS:GOOG) Wavii, Inc. - $30.0 -Apr-23-2013 PricewaterhouseCoopers LLP Key IT Group Ltd - - -Apr-22-2013 International Business Machines Corporation (NYSE:IBM) Starbelly Productions, Inc. - - -Apr-22-2013 CA Technologies (NasdaqGS:CA) Nolio Ltd. - - -Apr-22-2013 CA Technologies (NasdaqGS:CA) Layer 7 Technologies, Inc. - - -Apr-18-2013 Razorfish, Inc. Neev Information Technologies Pvt. Ltd. - - -Apr-17-2013 j2 Global, Inc. (NasdaqGS:JCOM) Backup-Connect International B.V. - - -Apr-17-2013 Intel Corporation (NasdaqGS:INTC) Mashery, Inc. - - -Apr-16-2013 Thomson Reuters Corporation (TSX:TRI) TaxWorks, Inc. - - -Apr-12-2013 ViaSat Inc. (NasdaqGS:VSAT) LonoCloud Inc. - - -Apr-12-2013 Google Inc. (NasdaqGS:GOOG) Behavio, Inc. - - -Apr-11-2013 LinkedIn Corporation (NYSE:LNKD) Alphonso Labs, Inc. - $90.0 -Apr-11-2013 PayPal, Inc. Iron Pearl - - -Apr-10-2013 Solera Holdings Inc. (NYSE:SLH) Eziworks Pty Ltd - - -Apr-09-2013 Proofpoint, Inc. (NasdaqGM:PFPT) Mail Distiller Ltd - - -Apr-08-2013 Ericsson (OM:ERIC B) Microsoft Corporation, Mediaroom IPTV Business - - -Apr-08-2013 DigitalGlobe, Inc. (NYSE:DGI) Tomnod, Inc. - - -Apr-08-2013 Blizzard Entertainment, Inc. IGN Entertainment, Inc., Ign Pro League Assets And Technology - - -Apr-08-2013 Fujitsu Limited (TSE:6702) RunMyProcess SAS $1.01 $20.2 20.0xApr-04-2013 IntraLinks Holdings, Inc. (NYSE:IL) MergerID Limited - - -Apr-04-2013 Xfire, Inc. Jowst Ltd. - - -Apr-03-2013 Experian Finance Plc Decisioning Solutions, Inc. - - -Apr-03-2013 OpenCoin Inc. Simple Honey Inc. - - -Apr-02-2013 Accenture plc (NYSE:ACN) ChangeTrack Research Pty Ltd - - -Apr-02-2013 Rosetta Stone Ltd. LiveMocha, Inc. $3.61 $8.5 2.4xApr-01-2013 The Nasdaq OMX Group, Inc. (NasdaqGS:NDAQ) BGC Partners, Inc., e-speed Platform $100 $1,234.5 12.4x

SEG Software Index Category Performance
Copyright © 2013 by Software Equity Group, L.L.C., All Rights Reserved

SEG Software Index: All Categories
Market Cap EVTTM
Revenue
TTM Gross
Margin
TTM EBITDA Margin
TTM Revenue
Growth EV/ RevenueEV/
EBITDAForward
EV/ Revenue
Forward EV/
EBITDA
YoY Stock Market Return
SEG Software Index $2,089.4 $2,059.4 $578.7 68.9% 19.7% 9.1% 2.8x 12.1x 2.6x 9.5x 7.1% Billing & Service Management $784.6 $685.9 $427.3 59.8% 20.2% 11.3% 1.8x 8.2x 1.4x 7.3x 11.1% Business Intelligence $1,019.2 $840.0 $405.9 73.9% 10.8% 10.8% 2.8x 16.8x 2.2x 10.7x -9.7% Development Platforms $2,778.2 $2,740.7 $1,137.3 77.8% 21.8% 3.6% 2.7x 9.7x 2.7x 8.3x 1.7% Engineering & PLM $3,546.4 $3,240.5 $1,179.4 84.6% 20.2% 9.5% 2.7x 13.4x 2.5x 9.6x 19.5% Enterprise Resource Planning $3,563.4 $3,762.7 $1,390.1 76.0% 22.8% 2.6% 2.4x 10.2x 2.6x 7.3x 12.3% Financial & Accounting $1,771.9 $2,113.4 $703.4 56.9% 24.6% 11.7% 3.2x 12.7x 3.1x 9.3x 17.9% Gaming $2,278.9 $2,100.2 $2,038.8 64.7% 15.5% 4.4% 1.2x 7.9x 1.1x 6.4x 14.5% IT Conglomerates $154,415.4 $141,202.4 $76,012.0 71.6% 33.8% 0.5% 2.9x 8.2x 2.6x 7.3x 3.4% Mobile Solutions/Content $482.5 $411.9 $216.0 55.1% 7.9% 35.2% 2.9x 13.5x 1.8x 16.3x -24.2% Networking & Network Performance Managemen $2,562.6 $2,551.7 $970.7 66.0% 15.3% 5.4% 2.2x 11.8x 1.8x 8.3x -22.8% Security $918.9 $874.3 $341.6 80.1% 15.6% 13.2% 2.7x 10.4x 2.2x 15.0x 10.0% Storage, Data Mgmt & Integration $12,296.3 $8,088.3 $4,680.0 72.3% 21.8% 4.8% 2.4x 8.8x 2.5x 6.7x 2.1% Supply Chain Management & Logistics $1,011.4 $1,183.6 $292.1 66.6% 16.0% 9.3% 3.3x 14.4x 3.5x 13.4x 16.9% Systems Management $9,087.5 $8,208.0 $2,197.5 84.9% 25.2% 15.8% 4.1x 18.1x 3.2x 9.5x 2.1% Vertical - Finance $2,776.3 $3,372.0 $802.2 43.3% 27.3% 7.6% 3.7x 11.0x 3.6x 10.5x 9.8% Vertical - Other $841.1 $1,104.9 $379.9 54.1% 13.8% 21.7% 3.0x 17.8x 2.8x 13.9x 27.3%
Category Name
TTM Revenue Growth 11.3%TTM EBITDA Growth -12.1%TTM Earnings Growth -32.5%Gross Profit Margin 59.8%EBITDA Margin 20.2%Net Income Margin 1.3%SG&A Expenses as a % of Total Revenue 54.1%R&D Expenses as a % of Total Revenue 17.3%
Current Ratio 1.8Quick Ratio 1.7Cash as Percent of Market Cap 10.4%Avg Days Outstanding: Accounts Receivable 62Avg Days Outstanding: Accounts Payable 33Working Capital to TTM Operating Expense Ratio 0.3x
Levered FCF Margin 7.9%Cash from Operations Growth (YoY) 24.6%Cash from Investing Growth (YoY) -208.4%Cash from Financing Growth (YoY) 45.7%Levered FCF Growth (YoY) 13.7%
Copyright © 2013 by Software Equity Group, L.L.C., All Rights Reserved May 2013 Monthly Flash Report
Income Statement Analysis (Median)
Balance Sheet Analysis (Median)
Cash Flow Statement Analysis (Median)
0%
2%
4%
6%
8%
10%
12%
14%
16%SEG SW Index Software Stock Market Return: January - April 2013
DOW S&P NASDAQ SEG SW Index

SEG Software Index Category: Billing and Service Management
Company Name Ticker Market Cap EVTTM
Revenue
TTM Gross
Margin
TTM EBITDA Margin
TTM Revenue
Growth EV/ RevenueEV/
EBITDAForward
EV/ Revenue
Forward EV/
EBITDA
YoY Stock Market Return
Amdocs Limited DOX $5,775.4 $4,797.2 $3,290.3 35.4% 18.6% 1.9% 1.5x 7.8x 1.4x 6.9x 11.6%AsiaInfo Holdings, Inc. ASIA $835.3 $538.3 $567.2 38.0% 11.8% 15.7% 0.9x 8.0x 0.9x 7.3x -8.9%CSG Systems International, Inc. CSGS $733.9 $833.4 $752.5 48.5% 18.6% 2.2% 1.1x 6.0x 1.1x 5.1x 50.1%Evolving Systems, Inc. EVOL $65.5 $56.7 $26.2 68.6% 23.8% 38.0% 2.2x 9.1x 2.0x 7.5x 0.9%MIND C.T.I. Ltd. MNDO $37.0 $18.1 $20.2 61.1% 23.0% 6.9% 0.9x 3.9x n/a n/a 10.7%NeuStar, Inc NSR $2,888.2 $3,131.6 $848.2 77.6% 44.4% 25.9% 3.7x 8.3x 3.5x 7.1x 20.7%Redknee Solutions TSX:RKN $249.0 $223.3 $57.7 67.8% 10.0% -0.6% 3.9x 38.5x 1.1x 13.6x 139.8%Synchronoss Technologies, Inc. SNCR $1,071.5 $1,024.8 $287.4 58.5% 21.8% 19.4% 3.6x 16.3x 3.0x 9.5x -9.5%
Median: $784.6 $685.9 $427.3 59.8% 20.2% 11.3% 1.8x 8.2x 1.4x 7.3x 11.1%
TTM Revenue Growth 11.3%TTM EBITDA Growth 16.8%TTM Earnings Growth 7.5%Gross Profit Margin 59.8%EBITDA Margin 20.2%Net Income Margin 9.9%SG&A Expenses as a % of Total Revenue 19.2%R&D Expenses as a % of Total Revenue 14.9%
Current Ratio 3.1Quick Ratio 2.8Cash as Percent of Market Cap 15.2%Avg Days Outstanding: Accounts Receivable 98Avg Days Outstanding: Accounts Payable 25Working Capital to TTM Operating Expense Ratio 0.7x
Levered FCF Margin 8.2%Cash from Operations Growth (YoY) 12.6%Cash from Investing Growth (YoY) -114.2%Cash from Financing Growth (YoY) 18.1%Levered FCF Growth (YoY) -22.2%
Copyright © 2013 by Software Equity Group, L.L.C., All Rights Reserved May 2013 Monthly Flash Report
Income Statement Analysis (Median)
Balance Sheet Analysis (Median)
Cash Flow Statement Analysis (Median)
0%
2%
4%
6%
8%
10%
12%
14%Billing and Service Management Software Stock Market Return: January - April 2013
Billing & Service Management S&P NASDAQ SEG SW Index

SEG Software Index Category: Business Intelligence
Company Name Ticker Market Cap EVTTM
Revenue
TTM Gross
Margin
TTM EBITDA Margin
TTM Revenue
Growth EV/ RevenueEV/
EBITDAForward
EV/ Revenue
Forward EV/
EBITDA
YoY Stock Market Return
Actuate Corporation BIRT $293.1 $225.8 $138.9 84.1% 14.9% 0.9% 1.6x 10.9x 1.6x 6.6x -13.5%MicroStrategy Incorporated MSTR $1,019.2 $689.0 $586.5 73.9% 6.8% 0.2% 1.2x 17.2x 1.1x 11.7x -35.5%Pegasystems Inc. PEGA $963.0 $840.0 $461.7 65.9% 10.8% 10.8% 1.8x 16.8x 1.7x 9.7x -31.9%Progress Software Corporation PRGS $1,251.8 $930.4 $337.3 87.2% 23.2% 7.5% 2.8x 11.9x 2.7x 8.3x -2.5%PROS Holdings PRO $723.6 $640.0 $124.4 70.7% 7.6% 21.7% 5.1x 67.6x 4.4x 28.9x 31.6%Qlik Technologies QLIK $2,260.8 $2,046.1 $405.9 88.1% 2.8% 20.5% 5.0x 177.5x 4.1x 29.6x -9.7%Verisk VRSK $10,320.9 $11,498.9 $1,591.1 59.9% 44.5% 16.5% 7.2x 16.3x n/a n/a 25.2%
Median: $1,019.2 $840.0 $405.9 73.9% 10.8% 10.8% 2.8x 16.8x 2.2x 10.7x -9.7%
TTM Revenue Growth 10.8%TTM EBITDA Growth -15.3%TTM Earnings Growth 14.9%Gross Profit Margin 73.9%EBITDA Margin 10.8%Net Income Margin 6.8%SG&A Expenses as a % of Total Revenue 53.8%R&D Expenses as a % of Total Revenue 16.8%
Current Ratio 2.0Quick Ratio 1.8Cash as Percent of Market Cap 12.8%Avg Days Outstanding: Accounts Receivable 92Avg Days Outstanding: Accounts Payable 52Working Capital to TTM Operating Expense Ratio 0.4x
Levered FCF Margin 8.5%Cash from Operations Growth (YoY) 9.5%Cash from Investing Growth (YoY) 2.5%Cash from Financing Growth (YoY) -13.6%Levered FCF Growth (YoY) 29.5%
Copyright © 2013 by Software Equity Group, L.L.C., All Rights Reserved May 2013 Monthly Flash Report
Income Statement Analysis (Median)
Balance Sheet Analysis (Median)
Cash Flow Statement Analysis (Median)
0%
5%
10%
15%
20%
25%Business Intelligence Software Stock Market Return: January - April 2013
Business Intelligence S&P NASDAQ SEG SW Index

SEG Software Index Category: Development Platforms
Company Name Ticker Market Cap EVTTM
Revenue
TTM Gross
Margin
TTM EBITDA Margin
TTM Revenue
Growth EV/ RevenueEV/
EBITDAForward
EV/ Revenue
Forward EV/
EBITDA
YoY Stock Market Return
Actuate Corporation BIRT $293.1 $225.8 $138.9 84.1% 14.9% 0.9% 1.6x 10.9x 1.6x 6.6x -13.5%Adobe Systems Incorporated ADBE $22,627.3 $20,498.0 $4,366.3 87.8% 29.7% 3.1% 4.7x 15.8x 4.9x 16.5x 34.4%BSQUARE Corporation BSQR $34.4 $14.6 $101.4 18.8% 2.1% 4.7% 0.1x 6.7x n/a n/a 4.6%Compuware Corporation CPWR $2,546.6 $2,551.7 $970.7 66.0% 16.8% -2.3% 2.6x 15.6x 2.6x 14.3x 37.6%Magic Software Enterprises Ltd. MGIC $198.5 $162.4 $126.4 41.9% 18.9% 11.5% 1.3x 6.8x 1.2x n/a -16.0%Microsoft Corporation MSFT $276,421.6 $217,398.6 $76,012.0 75.3% 40.1% 4.1% 2.9x 7.1x 2.6x 6.4x 3.4%Oracle Corporation ORCL $154,415.4 $141,202.4 $37,149.0 80.4% 46.5% 0.5% 3.8x 8.2x 3.6x 7.3x 11.5%Progress Software Corporation PRGS $1,251.8 $930.4 $337.3 87.2% 23.2% 7.5% 2.8x 11.9x 2.7x 8.3x -2.5%Red Hat, Inc. RHT $9,087.5 $8,208.0 $1,328.8 84.9% 20.4% 17.3% 6.2x 30.3x 5.4x 18.9x -19.6%Software AG XTRA:SOW $3,009.8 $2,929.7 $1,303.9 65.4% 26.2% -5.8% 2.2x 8.6x n/a n/a 0.1%
Median: $2,778.2 $2,740.7 $1,137.3 77.8% 21.8% 3.6% 2.7x 9.7x 2.7x 8.3x 1.7%
TTM Revenue Growth 3.6%TTM EBITDA Growth -3.6%TTM Earnings Growth -4.4%Gross Profit Margin 77.8%EBITDA Margin 21.8%Net Income Margin 14.1%SG&A Expenses as a % of Total Revenue 38.3%R&D Expenses as a % of Total Revenue 13.2%
Current Ratio 2.4Quick Ratio 2.2Cash as Percent of Market Cap 20.5%Avg Days Outstanding: Accounts Receivable 77Avg Days Outstanding: Accounts Payable 26Working Capital to TTM Operating Expense Ratio 0.6x
Levered FCF Margin 15.2%Cash from Operations Growth (YoY) 2.4%Cash from Investing Growth (YoY) 21.6%Cash from Financing Growth (YoY) -7.6%Levered FCF Growth (YoY) -4.8%
Copyright © 2013 by Software Equity Group, L.L.C., All Rights Reserved May 2013 Monthly Flash Report
Income Statement Analysis (Median)
Balance Sheet Analysis (Median)
Cash Flow Statement Analysis (Median)
0%
2%
4%
6%
8%
10%
12%
14%Development Platforms Software Stock Market Return: January - April 2013
Development Platforms S&P NASDAQ SEG SW Index

SEG Software Index Category: Engineering & PLM
Company Name Ticker Market Cap EVTTM
Revenue
TTM Gross
Margin
TTM EBITDA Margin
TTM Revenue
Growth EV/ RevenueEV/
EBITDAForward
EV/ Revenue
Forward EV/
EBITDA
YoY Stock Market Return
ANSYS, Inc. ANSS $7,516.3 $6,992.3 $810.4 87.6% 47.1% 12.8% 8.6x 18.3x 7.8x 15.3x 20.6%Autodesk, Inc. ADSK $8,833.8 $7,625.1 $2,312.2 89.7% 20.7% 4.4% 3.3x 16.0x 3.1x 10.6x 0.0%Cadence Design Systems, Inc CDNS $3,905.3 $3,446.8 $1,364.9 85.9% 23.0% 13.8% 2.5x 11.0x 2.3x 7.4x 18.3%Cimatron Ltd. CIMT $72.9 $61.0 $42.3 87.0% 15.2% 3.9% 1.4x 9.5x n/a n/a 84.2%Dassault Systèmes DSY $15,290.8 $13,384.3 $2,628.3 87.1% 31.0% 11.7% 5.1x 16.4x n/a n/a 25.7%GSE Systems Inc. GVP $34.5 $11.2 $52.2 33.9% 6.2% 2.2% 0.2x 3.5x 0.2x n/a -34.7%Mentor Graphics Corp MENT $2,059.2 $2,072.6 $1,088.7 83.3% 19.7% 7.3% 1.9x 9.7x 1.8x 7.5x 26.4%Parametric Technology Corporation PMTC $2,868.7 $2,936.1 $1,270.0 70.8% 18.8% 1.5% 2.3x 12.3x n/a n/a 11.3%Stratasys, Inc. SSYS $3,187.5 $3,034.1 $215.2 51.1% 23.7% 38.1% 14.1x 59.4x 6.9x 31.0x 62.2%Synopsys Inc SNPS $5,470.6 $5,047.7 $1,805.7 82.3% 19.4% 13.1% 2.8x 14.4x 2.5x 8.7x 18.5%
Median: $3,546.4 $3,240.5 $1,179.4 84.6% 20.2% 9.5% 2.7x 13.4x 2.5x 9.6x 19.5%
TTM Revenue Growth 9.5%TTM EBITDA Growth 11.0%TTM Earnings Growth 13.6%Gross Profit Margin 84.6%EBITDA Margin 20.2%Net Income Margin 10.8%SG&A Expenses as a % of Total Revenue 33.9%R&D Expenses as a % of Total Revenue 17.8%
Current Ratio 2.3Quick Ratio 2.2Cash as Percent of Market Cap 12.5%Avg Days Outstanding: Accounts Receivable 86Avg Days Outstanding: Accounts Payable 53Working Capital to TTM Operating Expense Ratio 0.6x
Levered FCF Margin 12.1%Cash from Operations Growth (YoY) -0.1%Cash from Investing Growth (YoY) 5.7%Cash from Financing Growth (YoY) 39.9%Levered FCF Growth (YoY) -1.8%
Copyright © 2013 by Software Equity Group, L.L.C., All Rights Reserved May 2013 Monthly Flash Report
Income Statement Analysis (Median)
Balance Sheet Analysis (Median)
Cash Flow Statement Analysis (Median)
0%
2%
4%
6%
8%
10%
12%
14%Engineering & PLM Software Stock Market Return: January - April 2013
Engineering & PLM S&P NASDAQ SEG SW Index

SEG Software Index Category: Enterprise Resource Planning
Company Name Ticker Market Cap EVTTM
Revenue
TTM Gross
Margin
TTM EBITDA Margin
TTM Revenue
Growth EV/ RevenueEV/
EBITDAForward
EV/ Revenue
Forward EV/
EBITDA
YoY Stock Market Return
American Software, Inc. AMSW.A $226.3 $174.2 $103.2 54.5% 16.0% 3.3% 1.7x 10.6x 1.6x n/a 0.4%Oracle Corporation ORCL $154,415.4 $141,202.4 $37,149.0 80.4% 46.5% 0.5% 3.8x 8.2x 3.6x 7.3x 11.5%QAD Inc. QADA $183.1 $133.9 $252.2 57.3% 6.7% 2.0% 0.5x 8.0x 0.5x 5.7x -2.2%Sage Group plc LSE:SGE $6,115.4 $6,341.9 $2,160.7 93.7% 29.6% 0.5% 2.9x 9.9x n/a n/a 13.1%SAP SAP $94,853.8 $95,439.9 $21,108.3 71.6% 33.8% 13.2% 4.5x 13.4x 4.0x 10.9x 19.9%Unit 4 ENXTAM:UN $1,011.4 $1,183.6 $619.4 92.4% 14.3% 5.4% 1.9x 13.3x n/a n/a 16.9%
Median: $3,563.4 $3,762.7 $1,390.1 76.0% 22.8% 2.6% 2.4x 10.2x 2.6x 7.3x 12.3%
TTM Revenue Growth 2.6%TTM EBITDA Growth -1.4%TTM Earnings Growth -5.5%Gross Profit Margin 76.0%EBITDA Margin 22.8%Net Income Margin 14.0%SG&A Expenses as a % of Total Revenue 34.2%R&D Expenses as a % of Total Revenue 13.4%
Current Ratio 1.1Quick Ratio 1.0Cash as Percent of Market Cap 13.9%Avg Days Outstanding: Accounts Receivable 70Avg Days Outstanding: Accounts Payable 51Working Capital to TTM Operating Expense Ratio 0.1x
Levered FCF Margin 17.6%Cash from Operations Growth (YoY) -3.1%Cash from Investing Growth (YoY) -55.7%Cash from Financing Growth (YoY) -71.8%Levered FCF Growth (YoY) -12.2%
Copyright © 2013 by Software Equity Group, L.L.C., All Rights Reserved May 2013 Monthly Flash Report
Income Statement Analysis (Median)
Balance Sheet Analysis (Median)
Cash Flow Statement Analysis (Median)
-4%
-2%
0%
2%
4%
6%
8%
10%
12%
14%Enterprise Resource Planning Software Stock Market Return: January - April 2013
Enterprise Resource Planning S&P NASDAQ SEG SW Index

SEG Software Index Category: Financial & Accounting
Company Name Ticker Market Cap EVTTM
Revenue
TTM Gross
Margin
TTM EBITDA Margin
TTM Revenue
Growth EV/ RevenueEV/
EBITDAForward
EV/ Revenue
Forward EV/
EBITDA
YoY Stock Market Return
ACI Worldwide, Inc. ACIW $1,872.8 $2,182.9 $691.0 64.2% 23.0% 38.7% 3.2x 13.8x 2.6x 9.1x 17.9%Bottomline Technologies EPAY $985.3 $838.1 $251.1 53.6% 9.2% 15.7% 3.3x 36.3x 3.1x 16.3x 11.3%DST Systems, Inc. DST $3,049.5 $3,576.2 $2,605.8 15.8% 14.5% 6.4% 1.4x 9.5x 1.8x n/a 23.5%Fair Isaac Corporation FICO $1,670.9 $2,043.8 $715.9 69.5% 26.2% 11.7% 2.9x 10.9x 2.6x 8.2x 8.6%Fiserv FISV $12,122.1 $15,815.1 $4,537.0 41.5% 29.1% 3.4% 3.5x 12.0x 3.2x n/a 29.6%Intuit Inc INTU $17,676.6 $17,497.6 $4,192.0 81.9% 31.3% 6.5% 4.2x 13.3x 3.7x 9.5x 2.9%Model N, Inc MODN $424.0 $416.6 $88.5 54.6% 1.7% n/a 4.7x 275.4x 4.0x n/a n/aNetSol Technologies Inc. KASE:NETS $20.1 $22.2 $29.0 59.3% 51.5% 40.8% 0.8x 1.5x n/a n/a 63.7%Sage Group plc LSE:SGE $6,115.4 $6,341.9 $2,160.7 93.7% 29.6% 0.5% 2.9x 9.9x n/a n/a 13.1%
Median: $1,771.9 $2,113.4 $703.4 56.9% 24.6% 11.7% 3.2x 12.7x 3.1x 9.3x 17.9%
TTM Revenue Growth 11.7%TTM EBITDA Growth -0.1%TTM Earnings Growth 14.4%Gross Profit Margin 56.9%EBITDA Margin 24.6%Net Income Margin 13.1%SG&A Expenses as a % of Total Revenue 34.6%R&D Expenses as a % of Total Revenue 16.7%
Current Ratio 1.3Quick Ratio 0.9Cash as Percent of Market Cap 6.0%Avg Days Outstanding: Accounts Receivable 71Avg Days Outstanding: Accounts Payable 46Working Capital to TTM Operating Expense Ratio 0.1x
Levered FCF Margin 13.9%Cash from Operations Growth (YoY) -10.1%Cash from Investing Growth (YoY) -15.6%Cash from Financing Growth (YoY) -19.4%Levered FCF Growth (YoY) 3.9%
Copyright © 2013 by Software Equity Group, L.L.C., All Rights Reserved May 2013 Monthly Flash Report
Income Statement Analysis (Median)
Balance Sheet Analysis (Median)
Cash Flow Statement Analysis (Median)
0%
2%
4%
6%
8%
10%
12%
14%Financial & Accounting Software Stock Market Return: January - April 2013
Financial & Accounting S&P NASDAQ SEG SW Index

SEG Software Index Category: Gaming
Company Name Ticker Market Cap EVTTM
Revenue
TTM Gross
Margin
TTM EBITDA Margin
TTM Revenue
Growth EV/ RevenueEV/
EBITDAForward
EV/ Revenue
Forward EV/
EBITDA
YoY Stock Market Return
Activision Blizzard ATVI $16,711.1 $12,336.1 $4,856.0 65.8% 32.4% 2.1% 2.5x 7.9x 2.9x 8.6x 16.2%Electronic Arts Inc. EA $5,284.3 $4,346.3 $3,956.0 63.6% 9.9% 2.4% 1.1x 11.1x 1.1x 6.0x 14.5%GameLoft SA ENXTPA:GF $534.1 $460.8 $274.7 84.4% 15.8% 20.9% 1.7x 10.6x n/a n/a 8.0%Konami Corporation TSE: 9766 $3,159.2 $2,920.2 $2,675.1 32.5% 15.3% -12.4% 1.1x 7.1x 1.2x 6.7x n/aTake-Two Interactive TTWO $1,398.5 $1,280.1 $1,063.1 36.2% -6.4% 23.6% 1.2x n/a 0.7x 3.6x 8.2%Ubisoft Entertainment ENXTPA:UB $1,065.5 $1,259.7 $1,402.5 68.9% 24.7% 6.4% 0.9x 3.6x n/a n/a 62.1%
Median: $2,278.9 $2,100.2 $2,038.8 64.7% 15.5% 4.4% 1.2x 7.9x 1.1x 6.4x 14.5%
TTM Revenue Growth 4.4%TTM EBITDA Growth 11.4%TTM Earnings Growth -0.2%Gross Profit Margin 64.7%EBITDA Margin 15.5%Net Income Margin 4.4%SG&A Expenses as a % of Total Revenue 27.3%R&D Expenses as a % of Total Revenue 29.7%
Current Ratio 2.5Quick Ratio 1.7Cash as Percent of Market Cap 24.0%Avg Days Outstanding: Accounts Receivable 37Avg Days Outstanding: Accounts Payable 32Working Capital to TTM Operating Expense Ratio 0.4x
Levered FCF Margin 8.0%Cash from Operations Growth (YoY) -10.4%Cash from Investing Growth (YoY) -7.4%Cash from Financing Growth (YoY) 17.6%Levered FCF Growth (YoY) 48.7%
Copyright © 2013 by Software Equity Group, L.L.C., All Rights Reserved May 2013 Monthly Flash Report
Income Statement Analysis (Median)
Balance Sheet Analysis (Median)
Cash Flow Statement Analysis (Median)
-5%
0%
5%
10%
15%
20%
25%Gaming Software Stock Market Return: January - April 2013
Gaming S&P NASDAQ SEG SW Index

SEG Software Index Category: Healthcare
Company Name Ticker Market Cap EVTTM
Revenue
TTM Gross
Margin
TTM EBITDA Margin
TTM Revenue
Growth EV/ RevenueEV/
EBITDAForward
EV/ Revenue
Forward EV/
EBITDA
YoY Stock Market Return
Accretive Health AH $1,025.2 $828.8 $973.6 20.7% 2.9% 32.2% 0.9x 28.9x 0.8x 10.7x 4.8%Allscripts Healthcare Solutions Inc. MDRX $2,443.3 $2,783.6 $1,446.3 41.9% 8.6% 0.2% 1.9x 22.4x 1.8x 9.9x 24.7%Cerner Corporation CERN $16,632.7 $15,810.0 $2,645.9 80.4% 28.2% 14.7% 6.0x 21.2x 5.1x 16.0x 19.3%Computer Programs and Sys, Inc. CPSI $581.3 $563.8 $188.4 44.3% 24.2% 6.1% 3.0x 12.4x 2.8x 10.6x -12.0%Greenway Medical Technologies, Inc GWAY $399.0 $371.7 $134.7 55.7% 5.9% 27.4% 2.8x 46.9x 2.4x 29.9x -12.5%MedAssets MDAS $1,140.8 $2,021.3 $663.1 78.6% 31.6% 11.0% 3.0x 9.7x 3.0x 9.2x 48.5%Merge Healthcare MRGE $291.6 $498.5 $251.6 59.6% 12.5% 4.5% 2.0x 15.8x 1.8x 8.2x -27.3%Quality Systems, Inc. QSII $1,063.9 $957.2 $457.9 60.0% 23.6% 9.6% 2.1x 8.9x 1.9x 7.3x -52.2%
Median: $1,044.5 $893.0 $560.5 57.7% 18.0% 10.3% 2.4x 18.5x 2.2x 10.3x -3.6%
TTM Revenue Growth 10.3%TTM EBITDA Growth -12.6%TTM Earnings Growth -18.2%Gross Profit Margin 57.7%EBITDA Margin 18.0%Net Income Margin 1.9%SG&A Expenses as a % of Total Revenue 33.7%R&D Expenses as a % of Total Revenue 11.2%
Current Ratio 2.2Quick Ratio 1.6Cash as Percent of Market Cap 6.9%Avg Days Outstanding: Accounts Receivable 69Avg Days Outstanding: Accounts Payable 32Working Capital to TTM Operating Expense Ratio 0.2x
Levered FCF Margin 6.9%Cash from Operations Growth (YoY) 7.3%Cash from Investing Growth (YoY) -17.1%Cash from Financing Growth (YoY) -4.9%Levered FCF Growth (YoY) 19.5%
Copyright © 2013 by Software Equity Group, L.L.C., All Rights Reserved May 2013 Monthly Flash Report
Income Statement Analysis (Median)
Balance Sheet Analysis (Median)
Cash Flow Statement Analysis (Median)
0%
2%
4%
6%
8%
10%
12%
14%
16%
18%Healthcare Software Stock Market Return: January - April 2013
Healthcare S&P NASDAQ SEG SW Index

SEG Software Index Category: IT Conglomerates
Company Name Ticker Market Cap EVTTM
Revenue
TTM Gross
Margin
TTM EBITDA Margin
TTM Revenue
Growth EV/ RevenueEV/
EBITDAForward
EV/ Revenue
Forward EV/
EBITDA
YoY Stock Market Return
Hewlett Packard HPQ $40,046.8 $56,058.8 $118,680.0 23.5% 12.1% -5.0% 0.5x 3.9x 0.5x 4.0x -16.8%IBM IBM $224,575.1 $246,102.1 $103,242.0 48.3% 25.8% -3.5% 2.4x 9.2x 2.4x 8.5x -2.2%Microsoft Corporation MSFT $276,421.6 $217,398.6 $76,012.0 75.3% 40.1% 4.1% 2.9x 7.1x 2.6x 6.4x 3.4%Oracle Corporation ORCL $154,415.4 $141,202.4 $37,149.0 80.4% 46.5% 0.5% 3.8x 8.2x 3.6x 7.3x 11.5%SAP AG SAP $94,853.8 $95,439.9 $21,108.3 71.6% 33.8% 13.2% 4.5x 13.4x 4.0x 10.9x 19.9%
Median: $154,415.4 $141,202.4 $76,012.0 71.6% 33.8% 0.5% 2.9x 8.2x 2.6x 7.3x 3.4%
TTM Revenue Growth 0.5%TTM EBITDA Growth -0.2%TTM Earnings Growth -19.9%Gross Profit Margin 71.6%EBITDA Margin 33.8%Net Income Margin 17.6%SG&A Expenses as a % of Total Revenue 22.3%R&D Expenses as a % of Total Revenue 13.0%
Current Ratio 1.2Quick Ratio 1.1Cash as Percent of Market Cap 21.6%Avg Days Outstanding: Accounts Receivable 64Avg Days Outstanding: Accounts Payable 51Working Capital to TTM Operating Expense Ratio 0.1x
Levered FCF Margin 27.0%Cash from Operations Growth (YoY) 1.9%Cash from Investing Growth (YoY) 15.3%Cash from Financing Growth (YoY) -25.2%Levered FCF Growth (YoY) 25.6%
Copyright © 2013 by Software Equity Group, L.L.C., All Rights Reserved May 2013 Monthly Flash Report
Income Statement Analysis (Median)
Balance Sheet Analysis (Median)
Cash Flow Statement Analysis (Median)
-4%
-2%
0%
2%
4%
6%
8%
10%
12%
14%IT Conglomerates Software Stock Market Return: January - April 2013
IT Conglomerates S&P NASDAQ SEG SW Index

SEG Software Index Category: Mobile Solutions/Content
Company Name Ticker Market Cap EVTTM
Revenue
TTM Gross
Margin
TTM EBITDA Margin
TTM Revenue
Growth EV/ RevenueEV/
EBITDAForward
EV/ Revenue
Forward EV/
EBITDA
YoY Stock Market Return
Bango PLC BGO $143.9 $140.5 $17.6 19.1% -22.1% -34.4% 8.0x n/a n/a n/a 42.4%Glu Mobile, Inc. GLUU $210.9 $188.6 $85.1 90.2% -10.3% 19.3% 2.2x n/a 2.1x n/a -32.3%Gree TSE:3632 $2,990.4 $2,802.3 $1,891.6 88.2% 47.1% 49.5% 1.5x 3.1x n/a n/a n/aMillennial Media Inc MM $549.3 $411.9 $177.7 40.5% -1.0% 71.4% 2.3x n/a 1.5x 23.5x -63.5%Myriad Group AG MYRN $162.0 $164.5 $56.3 19.1% -18.6% -7.8% 2.9x n/a n/a n/a -39.9%NQ Mobile Inc. NQ $442.7 $320.1 $91.8 72.0% 4.2% 125.6% 3.5x 82.1x 1.8x 5.9x -25.8%Opera OB:OPERA $822.2 $767.0 $216.0 44.6% 27.8% 35.2% 3.6x 12.8x n/a n/a 5.2%Qihoo 360 Technology Co. Ltd QIHU $4,211.1 $3,830.4 $329.0 90.0% 20.3% 96.0% 11.6x 57.5x 7.2x 25.9x 39.6%Pandora Media P $2,429.3 $2,340.3 $427.1 31.9% -7.2% 55.7% 5.5x n/a 3.8x 223.0x 62.0%Synchronoss Technologies, Inc. SNCR $1,071.5 $1,024.8 $287.4 58.5% 21.8% 19.4% 3.6x 16.3x 3.0x 9.5x -9.5%Tangoe, Inc. TNGO $482.5 $454.9 $154.5 54.3% 8.5% 47.2% 2.9x 34.6x 2.4x 14.4x -37.2%TeleCommunication Systems TSYS $116.6 $232.7 $482.1 33.5% 7.9% 10.8% 0.5x 6.1x 0.5x 4.9x 0.0%TeleNav TNAV $207.8 $20.3 $209.2 68.9% 11.7% -4.0% 0.1x 0.8x 0.1x n/a -22.6%Velti Plc VELT $132.2 $124.0 $270.3 55.1% 3.2% 42.9% 0.5x 14.2x 0.5x 18.1x -83.3%Zynga, Inc ZNGA $2,532.0 $1,363.3 $1,223.9 72.9% 11.5% 0.5% 1.1x 9.7x 1.4x n/a -61.7%
Median: $482.5 $411.9 $216.0 55.1% 7.9% 35.2% 2.9x 13.5x 1.8x 16.3x -24.2%
TTM Revenue Growth 35.2%TTM EBITDA Growth 10.9%TTM Earnings Growth -28.2%Gross Profit Margin 55.1%EBITDA Margin 7.9%Net Income Margin -3.1%SG&A Expenses as a % of Total Revenue 35.3%R&D Expenses as a % of Total Revenue 15.2%
Current Ratio 1.9Quick Ratio 1.9Cash as Percent of Market Cap 10.4%Avg Days Outstanding: Accounts Receivable 73Avg Days Outstanding: Accounts Payable 41Working Capital to TTM Operating Expense Ratio 0.0x
Levered FCF Margin 5.9%Cash from Operations Growth (YoY) 42.2%Cash from Investing Growth (YoY) 11.1%Cash from Financing Growth (YoY) -28.0%Levered FCF Growth (YoY) 92.5%
Copyright © 2013 by Software Equity Group, L.L.C., All Rights Reserved May 2013 Monthly Flash Report
Income Statement Analysis (Median)
Balance Sheet Analysis (Median)
Cash Flow Statement Analysis (Median)
-2%
0%
2%
4%
6%
8%
10%
12%
14%Mobile Solutions/Content Software Stock Market Return: January - April 2013
Mobile Solutions/Content S&P NASDAQ SEG SW Index

SEG Software Index Category: Networking/Network Performance Mgmt
Company Name Ticker Market Cap EVTTM
Revenue
TTM Gross
Margin
TTM EBITDA Margin
TTM Revenue
Growth EV/ RevenueEV/
EBITDAForward
EV/ Revenue
Forward EV/
EBITDA
YoY Stock Market Return
Allot Communications Ltd. ALLT $368.7 $225.7 $104.8 70.4% 12.3% 34.7% 2.2x 17.5x 1.8x 9.0x -53.9%Aruba Networks, Inc. ARUN $2,562.6 $2,160.3 $571.0 70.9% 7.1% 22.8% 3.8x 53.2x 3.1x 12.7x 6.5%Brocade Communications Systems, BRCD $2,623.1 $2,839.1 $2,265.9 62.3% 21.8% 4.8% 1.3x 5.8x 1.2x 4.8x 5.1%Cisco Systems, Inc. CSCO $111,544.9 $81,469.9 $47,252.0 61.0% 28.3% 5.4% 1.7x 6.1x 1.6x 5.2x 3.8%Compuware Corporation CPWR $2,546.6 $2,551.7 $970.7 66.0% 16.8% -2.3% 2.6x 15.6x 2.6x 14.3x 37.6%F5 Networks, Inc. FFIV $5,990.6 $5,467.7 $1,430.9 82.9% 32.3% 12.9% 3.8x 11.8x 3.6x 9.3x -42.9%Juniper Networks, Inc. JNPR $8,455.7 $6,798.1 $4,392.1 63.7% 15.0% 0.3% 1.5x 10.3x 1.5x 5.7x -22.8%Keynote Systems, Inc. KEYN $204.8 $146.9 $123.9 46.9% 12.4% 5.2% 1.2x 9.5x 1.2x 7.7x -39.1%Riverbed Technology, Inc. RVBD $2,421.2 $2,536.8 $900.6 74.8% 15.3% 20.8% 2.8x 18.5x 2.3x 8.3x -24.7%
Median: $2,562.6 $2,551.7 $970.7 66.0% 15.3% 5.4% 2.2x 11.8x 1.8x 8.3x -22.8%
TTM Revenue Growth 5.4%TTM EBITDA Growth 7.8%TTM Earnings Growth -16.5%Gross Profit Margin 66.0%EBITDA Margin 15.3%Net Income Margin 5.5%SG&A Expenses as a % of Total Revenue 41.4%R&D Expenses as a % of Total Revenue 17.7%
Current Ratio 2.2Quick Ratio 1.9Cash as Percent of Market Cap 21.4%Avg Days Outstanding: Accounts Receivable 47Avg Days Outstanding: Accounts Payable 44Working Capital to TTM Operating Expense Ratio 0.4x
Levered FCF Margin 19.1%Cash from Operations Growth (YoY) 6.3%Cash from Investing Growth (YoY) -40.9%Cash from Financing Growth (YoY) -47.5%Levered FCF Growth (YoY) 2.1%
Copyright © 2013 by Software Equity Group, L.L.C., All Rights Reserved
Income Statement Analysis (Median)
Balance Sheet Analysis (Median)
Cash Flow Statement Analysis (Median)
May 2013 Monthly Flash Report
-25%
-20%
-15%
-10%
-5%
0%
5%
10%
15%Networking/Network Performance Mgmt Software Stock Market Return: January - April 2013
Networking & Network Performance Management S&P NASDAQ SEG SW Index

SEG Software Index Category: Security
Company Name Ticker Market Cap EVTTM
Revenue
TTM Gross
Margin
TTM EBITDA Margin
TTM Revenue
Growth EV/ RevenueEV/
EBITDAForward
EV/ Revenue
Forward EV/
EBITDA
YoY Stock Market Return
AVG Technologies N.V. AVG $882.0 $896.4 $377.7 84.7% 31.4% 28.2% 2.4x 7.6x n/a n/a 17.8%Check Point Software Tech Ltd. CHKP $9,278.7 $7,893.7 $1,352.3 88.4% 56.4% 5.7% 5.8x 10.4x 5.6x 9.5x -19.8%Commtouch Software Ltd. CTCH $77.9 $72.8 $23.9 81.8% 8.1% 3.9% 3.0x 37.7x 2.1x 19.5x 4.9%Fortinet Inc. FTNT $2,912.9 $2,452.6 $552.2 71.8% 19.8% 20.7% 4.4x 22.5x 3.8x 15.0x -31.2%Guidance Software, Inc. GUID $296.3 $264.3 $130.4 70.7% 3.2% 21.8% 2.0x 63.8x 1.8x 15.5x 10.9%Imperva IMPV $955.7 $852.3 $111.3 78.8% -7.1% 33.5% 7.7x n/a 6.4x 105.7x 12.1%Palo Alto Networks, Inc PANW $3,740.0 $3,402.6 $323.8 71.6% -0.4% 74.8% 10.5x n/a 7.2x 64.0x n/aProofpoint, Inc. PFPT $623.8 $537.2 $112.4 69.9% -12.4% 28.2% 4.8x n/a n/a n/a 39.8%Symantec Corporation SYMC $16,747.3 $15,571.3 $6,839.0 84.3% 26.9% 1.7% 2.3x 8.5x 2.2x 6.8x 47.0%Trend Micro TSE:4704 $3,692.8 $2,473.9 $1,084.9 81.3% 31.9% -2.6% 2.3x 7.2x n/a n/a n/aVASCO Data Security International VDSI $329.0 $224.4 $157.1 64.1% 16.0% -4.3% 1.4x 8.9x 1.4x 8.2x 9.2%Websense, Inc. WBSN $649.1 $633.4 $359.4 83.5% 15.1% -1.5% 1.8x 11.6x 1.8x 14.7x -14.0%
Median: $918.9 $874.3 $341.6 80.1% 15.6% 13.2% 2.7x 10.4x 2.2x 15.0x 10.0%
TTM Revenue Growth 13.2%TTM EBITDA Growth -6.0%TTM Earnings Growth -8.6%Gross Profit Margin 80.1%EBITDA Margin 15.6%Net Income Margin 6.3%SG&A Expenses as a % of Total Revenue 49.7%R&D Expenses as a % of Total Revenue 16.9%
Current Ratio 1.6Quick Ratio 1.5Cash as Percent of Market Cap 12.2%Avg Days Outstanding: Accounts Receivable 69Avg Days Outstanding: Accounts Payable 45Working Capital to TTM Operating Expense Ratio 0.4x
Levered FCF Margin 10.2%Cash from Operations Growth (YoY) 22.6%Cash from Investing Growth (YoY) -9.5%Cash from Financing Growth (YoY) 5.5%Levered FCF Growth (YoY) -18.1%
Copyright © 2013 by Software Equity Group, L.L.C., All Rights Reserved May 2013 Monthly Flash Report
Income Statement Analysis (Median)
Balance Sheet Analysis (Median)
Cash Flow Statement Analysis (Median)
-6%
-4%
-2%
0%
2%
4%
6%
8%
10%
12%
14%Security Software Stock Market Return: January - April 2013
Security S&P NASDAQ SEG SW Index

SEG Software Index Category: Storage, Data Management & Integration
Company Name Ticker Market Cap EVTTM
Revenue
TTM Gross
Margin
TTM EBITDA Margin
TTM Revenue
Growth EV/ RevenueEV/
EBITDAForward
EV/ Revenue
Forward EV/
EBITDA
YoY Stock Market Return
Brocade Communications Systems, BRCD $2,623.1 $2,839.1 $2,265.9 62.3% 21.8% 4.8% 1.3x 5.8x 1.2x 4.8x 5.1%CA, Inc. CA $12,296.3 $11,177.3 $4,680.0 86.3% 36.1% -1.6% 2.4x 6.6x 2.4x 6.4x 2.1%Cisco Systems, Inc. CSCO $111,544.9 $81,469.9 $47,252.0 61.0% 28.3% 5.4% 1.7x n/a 1.6x 5.2x 3.8%CommVault Systems, Inc. CVLT $3,394.5 $2,997.2 $471.6 86.9% 16.5% 23.4% 6.4x 38.6x 5.5x 24.1x 41.2%EMC EMC $47,121.8 $43,467.3 $22,006.9 62.7% 23.8% 7.4% 2.0x 8.3x n/a 6.7x -20.5%FalconStor Software, Inc. FALC $79.1 $51.7 $71.3 72.3% -14.9% -14.4% 0.7x n/a n/a n/a -49.8%IBM IBM $224,575.1 $246,102.1 $103,242.0 48.3% 25.8% -3.5% 2.4x 9.2x 2.4x 8.5x -2.2%Informatica Corporation INFA $3,556.7 $2,965.7 $829.9 83.5% 20.4% 2.2% 3.6x 17.5x n/a 12.0x -28.4%Microsoft Corporation MSFT $276,421.6 $217,398.6 $76,012.0 75.3% 40.1% 4.1% 2.9x 7.1x 2.6x 6.4x 3.4%NetApp, Inc. NTAP $12,574.6 $8,088.3 $6,318.4 58.9% 13.6% 6.0% 1.3x 9.4x 1.2x 5.6x -10.1%Oracle Corporation ORCL $154,415.4 $141,202.4 $37,149.0 80.4% 46.5% 0.5% 3.8x 8.2x 3.6x 7.3x 11.5%Splunk, Inc. SPLK $4,202.8 $3,896.9 $198.9 89.2% -8.7% 64.5% 19.6x n/a 14.4x n/a 20.2%TIBCO Software Inc. TIBX $3,185.0 $2,942.7 $1,036.7 72.0% 20.3% 7.9% 2.8x 14.0x 2.7x 10.2x -41.0%
Median: $12,296.3 $8,088.3 $4,680.0 72.3% 21.8% 4.8% 2.4x 8.8x 2.5x 6.7x 2.1%
TTM Revenue Growth 4.8%TTM EBITDA Growth 0.7%TTM Earnings Growth 3.2%Gross Profit Margin 72.3%EBITDA Margin 21.8%Net Income Margin 10.7%SG&A Expenses as a % of Total Revenue 35.0%R&D Expenses as a % of Total Revenue 13.4%
Current Ratio 2.2Quick Ratio 2.0Cash as Percent of Market Cap 21.6%Avg Days Outstanding: Accounts Receivable 64Avg Days Outstanding: Accounts Payable 41Working Capital to TTM Operating Expense Ratio 0.7x
Levered FCF Margin 19.5%Cash from Operations Growth (YoY) 12.1%Cash from Investing Growth (YoY) -2.1%Cash from Financing Growth (YoY) 6.7%Levered FCF Growth (YoY) 9.7%
Copyright © 2013 by Software Equity Group, L.L.C., All Rights Reserved
Income Statement Analysis (Median)
Balance Sheet Analysis (Median)
Cash Flow Statement Analysis (Median)
May 2013 Monthly Flash Report
-2%
0%
2%
4%
6%
8%
10%
12%
14%Storage, Data Management & Integration Software Stock Market Return: January - April 2013
Storage, Data Management & Integration S&P NASDAQ SEG SW Index

SEG Software Index Category: Supply Chain Management & Logistics
Company Name Ticker Market Cap EVTTM
Revenue
TTM Gross
Margin
TTM EBITDA Margin
TTM Revenue
Growth EV/ RevenueEV/
EBITDAForward
EV/ Revenue
Forward EV/
EBITDA
YoY Stock Market Return
American Software, Inc. AMSW.A $226.3 $174.2 $103.2 54.5% 16.0% 3.3% 1.7x 10.6x 1.6x n/a 0.4%Aspen Technology, Inc. AZPN $2,856.3 $2,686.7 $292.1 82.7% 13.8% 26.1% 9.2x 66.7x 7.8x 40.6x 54.1%Manhattan Associates, Inc. MANH $1,366.4 $1,257.9 $381.4 56.3% 23.0% 9.3% 3.3x 14.4x 3.0x 11.5x 40.0%The Descartes Systems Group Inc. TSX:DSG $622.1 $584.8 $126.9 66.6% 28.9% 11.3% 4.6x 16.0x 4.1x 13.4x 15.0%Unit 4 ENXTAM:UN $1,011.4 $1,183.6 $619.4 92.4% 14.3% 5.4% 1.9x 13.3x n/a n/a 16.9%
Median: $1,011.4 $1,183.6 $292.1 66.6% 16.0% 9.3% 3.3x 14.4x 3.5x 13.4x 16.9%
TTM Revenue Growth 9.3%TTM EBITDA Growth 11.6%TTM Earnings Growth -4.7%Gross Profit Margin 66.6%EBITDA Margin 16.0%Net Income Margin 10.5%SG&A Expenses as a % of Total Revenue 31.0%R&D Expenses as a % of Total Revenue 14.2%
Current Ratio 2.0Quick Ratio 1.9Cash as Percent of Market Cap 6.1%Avg Days Outstanding: Accounts Receivable 58Avg Days Outstanding: Accounts Payable 14Working Capital to TTM Operating Expense Ratio 0.3x
Levered FCF Margin 17.2%Cash from Operations Growth (YoY) 35.4%Cash from Investing Growth (YoY) -181.0%Cash from Financing Growth (YoY) 16.8%Levered FCF Growth (YoY) 27.0%
Copyright © 2013 by Software Equity Group, L.L.C., All Rights Reserved May 2013 Monthly Flash Report
Income Statement Analysis (Median)
Balance Sheet Analysis (Median)
Cash Flow Statement Analysis (Median)
0%
2%
4%
6%
8%
10%
12%
14%
16%Supply Chain Management & Logistics Software Stock Market Return: January - April 2013
Supply Chain Management & Logistics S&P NASDAQ SEG SW Index

SEG Software Index Category: Systems Management
Company Name Ticker Market Cap EVTTM
Revenue
TTM Gross
Margin
TTM EBITDA Margin
TTM Revenue
Growth EV/ RevenueEV/
EBITDAForward
EV/ Revenue
Forward EV/
EBITDA
YoY Stock Market Return
BMC Software Inc. BMC $6,498.6 $6,660.1 $2,197.5 72.5% 27.7% 1.3% 3.0x 11.0x 2.9x 7.3x 10.2%CA Technologies CA $12,296.3 $11,177.3 $4,680.0 86.3% 36.1% -1.6% 2.4x 6.6x 2.4x 6.4x 2.1%Citrix Systems, Inc. CTXS $11,599.4 $10,941.5 $2,669.5 87.1% 22.7% 15.8% 4.1x 18.1x 3.6x 11.3x -27.4%Netscout Systems, Inc. NTCT $949.2 $811.9 $350.6 78.9% 25.2% 13.6% 2.3x 9.2x 2.1x 7.7x 10.2%Red Hat, Inc. RHT $9,087.5 $8,208.0 $1,328.8 84.9% 20.4% 17.3% 6.2x 30.3x 5.4x 18.9x -97.7%SolarWinds, Inc. SWI $3,819.4 $3,553.6 $282.2 93.0% 49.3% 31.2% 12.6x 25.6x n/a n/a 8.4%VMWare, Inc. VMW $30,198.8 $25,712.2 $4,741.3 84.5% 24.7% 19.2% 5.4x 21.9x 4.8x 11.8x -36.9%
Median: $9,087.5 $8,208.0 $2,197.5 84.9% 25.2% 15.8% 4.1x 18.1x 3.2x 9.5x 2.1%
TTM Revenue Growth 15.8%TTM EBITDA Growth 7.6%TTM Earnings Growth -2.0%Gross Profit Margin 84.9%EBITDA Margin 25.2%Net Income Margin 15.0%SG&A Expenses as a % of Total Revenue 41.8%R&D Expenses as a % of Total Revenue 17.1%
Current Ratio 1.4Quick Ratio 1.2Cash as Percent of Market Cap 14.5%Avg Days Outstanding: Accounts Receivable 75Avg Days Outstanding: Accounts Payable 44Working Capital to TTM Operating Expense Ratio 0.3x
Levered FCF Margin 21.2%Cash from Operations Growth (YoY) 13.4%Cash from Investing Growth (YoY) 2.6%Cash from Financing Growth (YoY) -1.1%Levered FCF Growth (YoY) -6.0%
Copyright © 2013 by Software Equity Group, L.L.C., All Rights Reserved May 2013 Monthly Flash Report
Income Statement Analysis (Median)
Balance Sheet Analysis (Median)
Cash Flow Statement Analysis (Median)
-10%
-5%
0%
5%
10%
15%
Systems Management Software Stock Market Return: January - April 2013
Systems Management S&P NASDAQ SEG SW Index

SEG Software Index Category: Vertical - Finance
Company Name Ticker Market Cap EVTTM
Revenue
TTM Gross
Margin
TTM EBITDA Margin
TTM Revenue
Growth EV/ RevenueEV/
EBITDAForward
EV/ Revenue
Forward EV/
EBITDA
YoY Stock Market Return
Advent Software, Inc. ADVS $1,470.0 $1,377.7 $364.4 69.3% 22.7% 7.9% 3.8x 16.7x 3.6x 12.7x 7.6%Broadridge Financial BR $3,068.3 $3,333.6 $2,336.3 26.2% 15.1% 3.4% 1.4x 9.5x 1.4x 7.1x 8.5%Fidessa LSE:FDSA $1,035.8 $923.6 $452.9 21.3% 20.4% 0.1% 2.0x 10.0x n/a n/a 11.0%Jack Henry & Associates, Inc. JKHY $3,998.1 $3,934.6 $1,097.8 42.0% 31.9% 8.7% 3.6x 11.2x 3.4x 10.1x 36.6%MSCI, Inc. MSCI $4,114.3 $4,714.8 $973.0 69.6% 45.1% 7.3% 4.8x 10.8x 4.6x 10.5x -6.8%SS&C Corporation SSNC $2,484.4 $3,410.3 $631.4 44.5% 38.5% 68.1% 5.4x 14.0x 4.8x 11.8x 29.1%
Median: $2,776.3 $3,372.0 $802.2 43.3% 27.3% 7.6% 3.7x 11.0x 3.6x 10.5x 9.8%
TTM Revenue Growth 7.6%TTM EBITDA Growth 7.1%TTM Earnings Growth 5.1%Gross Profit Margin 43.3%EBITDA Margin 27.3%Net Income Margin 10.3%SG&A Expenses as a % of Total Revenue 13.3%R&D Expenses as a % of Total Revenue 8.1%
Current Ratio 1.5Quick Ratio 1.3Cash as Percent of Market Cap 7.3%Avg Days Outstanding: Accounts Receivable 64Avg Days Outstanding: Accounts Payable 16Working Capital to TTM Operating Expense Ratio 0.2x
Levered FCF Margin 14.8%Cash from Operations Growth (YoY) 4.9%Cash from Investing Growth (YoY) -7.0%Cash from Financing Growth (YoY) 328.5%Levered FCF Growth (YoY) 4.7%
Copyright © 2013 by Software Equity Group, L.L.C., All Rights Reserved
Cash Flow Statement Analysis (Median)
May 2013 Monthly Flash Report
Income Statement Analysis (Median)
Balance Sheet Analysis (Median)
0%
2%
4%
6%
8%
10%
12%
14%
16%
18%
20%Vertical - Finance Software Stock Market Return:January - April 2013
Vertical - Finance S&P NASDAQ SEG SW Index

SEG Software Index Category: Vertical - Other
Company Name Ticker Market Cap EVTTM
Revenue
TTM Gross
Margin
TTM EBITDA Margin
TTM Revenue
Growth EV/ RevenueEV/
EBITDAForward
EV/ Revenue
Forward EV/
EBITDA
YoY Stock Market Return
Blackbaud, Inc. BLKB $1,302.7 $1,506.0 $468.3 54.1% 15.6% 23.6% 3.2x 20.6x 3.0x 13.7x -5.4%Constellation TSX:CSU $2,893.1 $2,895.7 $952.4 32.3% 19.9% 20.4% 3.0x 15.3x 2.7x 14.1x 43.3%EPIQ Systems, Inc. EPIQ $501.8 $726.4 $379.9 56.3% 19.6% 28.5% 1.9x 9.7x 1.8x 7.2x 23.0%Guidewire Software, Inc. GWRE $2,262.5 $2,096.7 $260.1 57.7% 7.2% 28.2% 8.1x 112.0x 6.8x 57.6x 47.2%Micros Systems MCRS $3,335.9 $2,673.7 $1,242.0 52.8% 21.4% 15.1% 2.2x 10.1x 2.1x 9.1x -25.4%PROS Holdings PRO $723.6 $640.0 $124.4 70.7% 7.6% 21.7% 5.1x 67.6x 4.4x 28.9x 31.6%Sapiens International SPNS $224.0 $195.7 $113.9 41.7% 13.8% 62.9% 1.7x 12.5x n/a n/a 73.4%Silver Spring Networks, Inc. SSNI $841.1 $1,104.9 $196.7 16.1% -41.5% -17.0% 5.6x n/a 3.1x 101.9x n/aThe Active Network, Inc. ACTV $306.6 $253.3 $430.5 54.7% 2.9% 19.9% 0.6x 20.2x 0.5x 4.9x -70.1%
Median: $841.1 $1,104.9 $379.9 54.1% 13.8% 21.7% 3.0x 17.8x 2.8x 13.9x 27.3%
TTM Revenue Growth 21.7%TTM EBITDA Growth 7.6%TTM Earnings Growth -2.5%Gross Profit Margin 54.1%EBITDA Margin 13.8%Net Income Margin 5.6%SG&A Expenses as a % of Total Revenue 29.6%R&D Expenses as a % of Total Revenue 16.7%
Current Ratio 1.4Quick Ratio 1.2Cash as Percent of Market Cap 8.0%Avg Days Outstanding: Accounts Receivable 64Avg Days Outstanding: Accounts Payable 28Working Capital to TTM Operating Expense Ratio 0.2x
Levered FCF Margin 9.9%Cash from Operations Growth (YoY) 8.0%Cash from Investing Growth (YoY) -244.7%Cash from Financing Growth (YoY) -43.4%Levered FCF Growth (YoY) 15.4%
Copyright © 2013 by Software Equity Group, L.L.C., All Rights Reserved May 2013 Monthly Flash Report
Balance Sheet Analysis (Median)
Cash Flow Statement Analysis (Median)
Income Statement Analysis (Median)
0%
5%
10%
15%
20%
25%Vertical - Other Software Stock Market Return: January - April 2013
Vertical - Other S&P NASDAQ SEG SW Index

SEG SaaS Index Category Performance
Copyright © 2013 by Software Equity Group, L.L.C., All Rights Reserved

SEG SaaS Index: All Categories
Market Cap EVTTM
Revenue
TTM Gross
Margin
TTM EBITDA Margin
TTM Revenue
Growth EV/ RevenueEV/
EBITDAForward
EV/ Revenue
Forward EV/
EBITDA
YoY Stock Market Return
SEG SaaS Index $812.9 $735.6 $167.8 69.4% 7.9% 28.7% 5.6x 31.8x 4.1x 16.6x 12.4% CRM & Marketing $454.4 $433.7 $182.2 70.9% 2.8% 34.6% 3.8x 31.8x 3.3x 21.3x -31.2% ERP & Supply Chain $698.1 $625.6 $84.3 68.9% 5.6% 31.5% 6.5x 100.2x 4.9x 34.5x 69.4% Vertically Focused $1,394.7 $1,375.1 $284.0 66.1% 15.7% 20.8% 5.1x 26.4x 4.1x 13.1x 22.6% Workforce Management $2,251.7 $2,182.1 $202.6 57.3% -18.1% 43.1% 10.4x 53.5x 7.9x 23.5x 25.2%
Category Name
TTM Revenue Growth 28.7%TTM EBITDA Growth -12.1%TTM Earnings Growth -32.5%Gross Profit Margin 69.4%EBITDA Margin 7.9%Net Income Margin 1.3%SG&A Expenses as a % of Total Revenue 54.1%R&D Expenses as a % of Total Revenue 17.3%
Current Ratio 1.8Quick Ratio 1.7Cash as Percent of Market Cap 10.4%Avg Days Outstanding: Accounts Receivable 62Avg Days Outstanding: Accounts Payable 33Working Capital to TTM Operating Expense Ratio 0.3x
Levered FCF Margin 7.9%Cash from Operations Growth (YoY) 24.6%Cash from Investing Growth (YoY) -208.4%Cash from Financing Growth (YoY) 45.7%Levered FCF Growth (YoY) 13.7%
Copyright © 2013 by Software Equity Group, L.L.C., All Rights Reserved May 2013 Monthly Flash Report
Income Statement Analysis (Median)
Balance Sheet Analysis (Median)
Cash Flow Statement Analysis (Median)
-4%
-2%
0%
2%
4%
6%
8%
10%
12%
14%
16%SEG SaaS Index Stock Market Return: January - April 2013
DOW S&P NASDAQ SEG SaaS

SEG SaaS Index Category: CRM & Marketing
Company Name Ticker Market Cap EVTTM
Revenue
TTM Gross
Margin
TTM EBITDA Margin
TTM Revenue
Growth EV/ RevenueEV/
EBITDAForward
EV/ Revenue
Forward EV/
EBITDA
YoY Stock Market Return
Constant Contact CTCT $448.5 $351.2 $260.4 70.9% 7.0% 16.1% 1.3x 19.3x 1.2x 7.7x -39.6%ExactTarget, Inc. ET $1,344.6 $1,236.4 $292.3 64.6% 1.4% 40.9% 4.2x n/a 3.3x 169.1x -27.5%LivePerson LPSN $706.1 $602.7 $157.4 77.4% 12.1% 18.3% 3.8x 31.8x 3.3x 18.5x -19.3%Marin Software MRIN $454.4 $433.7 $59.6 58.4% -38.0% 64.9% 7.3x n/a 5.8x n/a n/aResponsys MKTG $381.7 $276.2 $162.8 53.7% 11.8% 20.7% 1.7x 14.3x 1.5x 10.4x -39.2%Salesforce.com CRM $24,222.5 $24,002.8 $3,050.2 77.6% 2.8% 34.6% 7.9x 285.8x 6.2x 35.6x 5.6%Vocus VOCS $177.5 $214.9 $182.2 80.2% 2.2% 48.4% 1.2x 53.1x 1.1x 24.0x -35.0%
Median: $454.4 $433.7 $182.2 70.9% 2.8% 34.6% 3.8x 31.8x 3.3x 21.3x -31.2%
TTM Revenue Growth 34.6%TTM EBITDA Growth -20.7%TTM Earnings Growth -46.7%Gross Profit Margin 70.9%EBITDA Margin 2.8%Net Income Margin -7.2%SG&A Expenses as a % of Total Revenue 55.0%R&D Expenses as a % of Total Revenue 15.2%
Current Ratio 1.9Quick Ratio 1.7Cash as Percent of Market Cap 14.6%Avg Days Outstanding: Accounts Receivable 57Avg Days Outstanding: Accounts Payable 30Working Capital to TTM Operating Expense Ratio 0.3x
Levered FCF Margin 5.9%Cash from Operations Growth (YoY) 11.7%Cash from Investing Growth (YoY) -115.8%Cash from Financing Growth (YoY) -12.1%Levered FCF Growth (YoY) -8.3%
Copyright © 2013 by Software Equity Group, L.L.C., All Rights Reserved
Cash Flow Statement Analysis (Median)
May 2013 Monthly Flash Report
Income Statement Analysis (Median)
Balance Sheet Analysis (Median)
-15%
-10%
-5%
0%
5%
10%
15%CRM & Marketing SaaS Stock Market Return: January - April 2013
CRM & Marketing S&P NASDAQ SEG SaaS

SEG SaaS Index Category: ERP & Supply Chain
Company Name Ticker Market Cap EVTTM
Revenue
TTM Gross
Margin
TTM EBITDA Margin
TTM Revenue
Growth EV/ RevenueEV/
EBITDAForward
EV/ Revenue
Forward EV/
EBITDA
YoY Stock Market Return
E2open, Inc EOPN $356.2 $322.0 $74.9 68.9% 2.1% 25.6% 4.3x 200.3x 4.2x n/a n/aFleetmatics FLTX $812.9 $737.2 $127.5 72.1% 18.6% 38.1% 5.8x 31.1x 4.5x 16.2x n/aNetsuite N $6,443.3 $6,252.7 $331.1 68.5% -6.3% 31.3% 18.9x n/a 14.5x 147.8x 98.2%SciQuest SQI $519.5 $473.4 $72.7 68.8% 5.6% 31.5% 6.5x 116.7x 4.9x 23.9x 53.9%SPS Commerce SPSC $698.1 $625.6 $84.3 70.8% 8.9% 36.3% 7.4x 83.7x 6.0x 45.1x 69.4%
Median: $698.1 $625.6 $84.3 68.9% 5.6% 31.5% 6.5x 100.2x 4.9x 34.5x 69.4%
TTM Revenue Growth 31.5%TTM EBITDA Growth 25.4%TTM Earnings Growth -91.3%Gross Profit Margin 68.9%EBITDA Margin 5.6%Net Income Margin -0.9%SG&A Expenses as a % of Total Revenue 55.7%R&D Expenses as a % of Total Revenue 17.6%
Current Ratio 1.4Quick Ratio 1.2Cash as Percent of Market Cap 10.0%Avg Days Outstanding: Accounts Receivable 62Avg Days Outstanding: Accounts Payable 50Working Capital to TTM Operating Expense Ratio 0.2x
Levered FCF Margin 3.2%Cash from Operations Growth (YoY) 79.3%Cash from Investing Growth (YoY) -141.1%Cash from Financing Growth (YoY) 1324.4%Levered FCF Growth (YoY) 75.4%
Copyright © 2013 by Software Equity Group, L.L.C., All Rights Reserved
Cash Flow Statement Analysis (Median)
May 2013 Monthly Flash Report
Income Statement Analysis (Median)
Balance Sheet Analysis (Median)
-5%
0%
5%
10%
15%
20%
25%ERP & Supply Chain SaaS Stock Market Return: January - April 2013
ERP & Supply Chain S&P NASDAQ SEG SaaS

SEG SaaS Index Category: Vertically Focused
Company Name Ticker Market Cap EVTTM
Revenue
TTM Gross
Margin
TTM EBITDA Margin
TTM Revenue
Growth EV/ RevenueEV/
EBITDAForward
EV/ Revenue
Forward EV/
EBITDA
YoY Stock Market Return
Athenahealth, Inc ATHN $3,534.4 $3,341.3 $451.3 59.8% 8.4% 28.7% 7.4x 88.3x 6.2x 30.3x 32.9%DealerTrack TRAK $1,199.1 $1,183.7 $388.9 43.2% 13.8% 10.1% 3.0x 22.1x 2.6x 10.5x -6.6%Ebix Inc. EBIX $691.3 $735.6 $199.4 80.9% 42.4% 18.0% 3.7x 8.7x 3.4x 7.6x -9.0%Ellie Mae ELLI $684.3 $623.8 $111.8 77.2% 24.8% 69.9% 5.6x 22.5x 4.6x 13.1x 100.8%Medidata Solutions MDSO $1,763.2 $1,642.9 $231.2 71.8% 16.0% 19.2% 7.1x 44.4x n/a n/a 156.1%RealPage RP $1,590.3 $1,566.5 $336.7 60.4% 15.3% 22.5% 4.7x 30.4x 4.1x 17.1x 12.4%
Median: $1,394.7 $1,375.1 $284.0 66.1% 15.7% 20.8% 5.1x 26.4x 4.1x 13.1x 22.6%
TTM Revenue Growth 20.8%TTM EBITDA Growth 3.3%TTM Earnings Growth -4.3%Gross Profit Margin 66.1%EBITDA Margin 15.7%Net Income Margin 6.9%SG&A Expenses as a % of Total Revenue 39.7%R&D Expenses as a % of Total Revenue 13.5%
Current Ratio 2.1Quick Ratio 1.9Cash as Percent of Market Cap 6.1%Avg Days Outstanding: Accounts Receivable 51Avg Days Outstanding: Accounts Payable 25Working Capital to TTM Operating Expense Ratio 0.3x
Levered FCF Margin 12.1%Cash from Operations Growth (YoY) 12.1%Cash from Investing Growth (YoY) -240.3%Cash from Financing Growth (YoY) 61.0%Levered FCF Growth (YoY) 14.5%
Copyright © 2013 by Software Equity Group, L.L.C., All Rights Reserved
Cash Flow Statement Analysis (Median)
May 2013 Monthly Flash Report
Income Statement Analysis (Median)
Balance Sheet Analysis (Median)
-5%
0%
5%
10%
15%
20%Vertically Focused SaaS Stock Market Return: January - April 2013
Vertically Focused S&P NASDAQ SEG SaaS

SEG SaaS Index Category: Workforce Management
Company Name Ticker Market Cap EVTTM
Revenue
TTM Gross
Margin
TTM EBITDA Margin
TTM Revenue
Growth EV/ RevenueEV/
EBITDAForward
EV/ Revenue
Forward EV/
EBITDA
YoY Stock Market Return
Callidus Software Inc. CALD $159.9 $190.9 $98.5 48.1% -14.7% 14.5% 1.9x n/a 1.8x 18.9x -45.8%Cornerstone OnDemand CSOD $1,844.3 $1,773.5 $131.6 70.4% -21.5% 61.9% 13.5x n/a 9.8x n/a 74.6%The Ultimate Software Group, Inc. ULTI $2,659.1 $2,590.7 $351.9 57.3% 13.8% 24.4% 7.4x 53.5x 6.0x 28.1x 25.2%Workday, Inc. WDAY $10,436.5 $9,671.1 $273.7 57.4% -32.5% 103.6% 35.3x n/a 22.4x n/a n/a
Median: $2,251.7 $2,182.1 $202.6 57.3% -18.1% 43.1% 10.4x 53.5x 7.9x 23.5x 25.2%
TTM Revenue Growth 43.1%TTM EBITDA Growth -29.6%TTM Earnings Growth -34.2%Gross Profit Margin 57.3%EBITDA Margin -18.1%Net Income Margin -26.5%SG&A Expenses as a % of Total Revenue 56.5%R&D Expenses as a % of Total Revenue 17.3%
Current Ratio 1.1Quick Ratio 1.0Cash as Percent of Market Cap 5.9%Avg Days Outstanding: Accounts Receivable 83Avg Days Outstanding: Accounts Payable 15Working Capital to TTM Operating Expense Ratio 0.2x
Levered FCF Margin 7.8%Cash from Operations Growth (YoY) 78.0%Cash from Investing Growth (YoY) -328.3%Cash from Financing Growth (YoY) 292.7%Levered FCF Growth (YoY) 2247.7%
Copyright © 2013 by Software Equity Group, L.L.C., All Rights Reserved
Cash Flow Statement Analysis (Median)
May 2013 Monthly Flash Report
Income Statement Analysis (Median)
Balance Sheet Analysis (Median)
-4%
-2%
0%
2%
4%
6%
8%
10%
12%
14%Workforce Management SaaS Stock Market Return: January - April 2013
Workforce Management S&P NASDAQ SEG SaaS

SEG SaaS Index Category: Other Public SaaS Companies
Company Name Ticker Market Cap EVTTM
Revenue
TTM Gross
Margin
TTM EBITDA Margin
TTM Revenue
Growth EV/ RevenueEV/
EBITDAForward
EV/ Revenue
Forward EV/
EBITDA
YoY Stock Market Return
Bazaarvoice, Inc BV $527.7 $422.2 $148.4 65.4% -18.2% 57.9% 2.8x n/a 2.3x n/a -63.4%Concur CNQR $4,066.1 $3,836.5 $481.2 71.7% 7.9% 22.3% 8.0x 101.5x n/a 30.8x 29.3%Demandware, Inc. DWRE $821.9 $720.1 $79.5 69.4% -4.8% 40.5% 9.1x n/a 7.4x n/a 0.2%IntraLinks Holdings IL $313.8 $314.7 $216.7 71.2% 3.2% 1.8% 1.5x 46.1x 1.4x 8.9x 22.7%J2 Global JCOM $1,870.9 $1,792.3 $371.4 82.0% 49.6% 12.5% 4.8x 9.7x 3.5x 8.0x 57.6%Jive Software, Inc JIVE $909.4 $775.8 $122.2 61.3% -35.5% 41.2% 6.3x n/a n/a n/a -42.9%OpenTable, Inc. OPEN $1,266.8 $1,163.3 $167.8 74.5% 28.5% 15.6% 6.9x 24.3x 6.1x 14.3x 23.9%Qualys, Inc. QLYS $348.3 $231.9 $91.4 79.9% 11.3% 20.0% 2.5x 22.4x 2.2x 14.1x n/aService-now.com NOW $5,451.6 $5,112.7 $282.2 59.8% -9.4% 67.0% 18.1x n/a n/a n/a n/aTangoe TNGO $482.5 $454.9 $154.5 54.3% 8.5% 47.2% 2.9x 34.6x 2.4x 14.4x -37.2%Zix Corporation ZIXI $232.4 $208.2 $44.8 82.8% 24.4% 14.4% 4.6x 19.0x 4.1x 14.0x 32.9%
Median: $821.9 $720.1 $154.5 71.2% 7.9% 22.3% 4.8x 24.3x 3.0x 14.1x 22.7%
TTM Revenue Growth 20.0%TTM EBITDA Growth -12.1%TTM Earnings Growth -21.7%Gross Profit Margin 79.9%EBITDA Margin 11.3%Net Income Margin -4.4%SG&A Expenses as a % of Total Revenue 56.8%R&D Expenses as a % of Total Revenue 17.5%
Current Ratio 1.9Quick Ratio 1.7Cash as Percent of Market Cap 13.0%Avg Days Outstanding: Accounts Receivable 65Avg Days Outstanding: Accounts Payable 41Working Capital to TTM Operating Expense Ratio 0.5x
Levered FCF Margin 10.4%Cash from Operations Growth (YoY) 20.2%Cash from Investing Growth (YoY) -203.0%Cash from Financing Growth (YoY) 25.2%Levered FCF Growth (YoY) 17.4%
Copyright © 2013 by Software Equity Group, L.L.C., All Rights Reserved
Cash Flow Statement Analysis (Median)
May 2013 Monthly Flash Report
Income Statement Analysis (Median)
Balance Sheet Analysis (Median)
-4%
-2%
0%
2%
4%
6%
8%
10%
12%
14%
16%Other Public SaaS Companies SaaS Stock Market Return: January - April 2013
Other SaaS S&P NASDAQ SEG SaaS

SEG Internet Index Category Performance
Copyright © 2013 by Software Equity Group, L.L.C., All Rights Reserved
SEG Internet Index: All Categories
Category Name Market Cap EVTTM
Revenue
TTM Gross
Margin
TTM EBITDA Margin
TTM Revenue
Growth EV/ RevenueEV/
EBITDAForward
EV/ Revenue
Forward EV/
EBITDA
YoY Stock Market Return
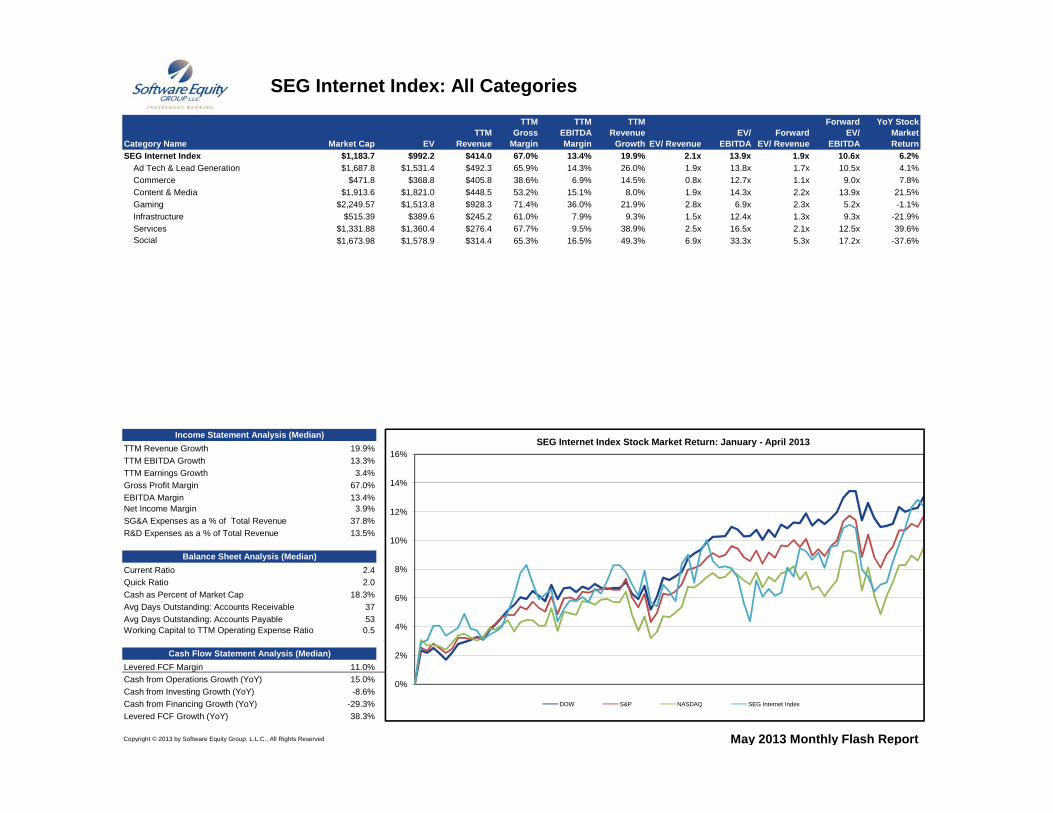
SEG Internet Index $1,183.7 $992.2 $414.0 67.0% 13.4% 19.9% 2.1x 13.9x 1.9x 10.6x 6.2% Ad Tech & Lead Generation $1,687.8 $1,531.4 $492.3 65.9% 14.3% 26.0% 1.9x 13.8x 1.7x 10.5x 4.1% Commerce $471.8 $368.8 $405.8 38.6% 6.9% 14.5% 0.8x 12.7x 1.1x 9.0x 7.8% Content & Media $1,913.6 $1,821.0 $448.5 53.2% 15.1% 8.0% 1.9x 14.3x 2.2x 13.9x 21.5% Gaming $2,249.57 $1,513.8 $928.3 71.4% 36.0% 21.9% 2.8x 6.9x 2.3x 5.2x -1.1% Infrastructure $515.39 $389.6 $245.2 61.0% 7.9% 9.3% 1.5x 12.4x 1.3x 9.3x -21.9% Services $1,331.88 $1,360.4 $276.4 67.7% 9.5% 38.9% 2.5x 16.5x 2.1x 12.5x 39.6% Social $1,673.98 $1,578.9 $314.4 65.3% 16.5% 49.3% 6.9x 33.3x 5.3x 17.2x -37.6%
TTM Revenue Growth 19.9%TTM EBITDA Growth 13.3%TTM Earnings Growth 3.4%Gross Profit Margin 67.0%EBITDA Margin 13.4%Net Income Margin 3.9%SG&A Expenses as a % of Total Revenue 37.8%R&D Expenses as a % of Total Revenue 13.5%
Current Ratio 2.4Quick Ratio 2.0Cash as Percent of Market Cap 18.3%Avg Days Outstanding: Accounts Receivable 37Avg Days Outstanding: Accounts Payable 53Working Capital to TTM Operating Expense Ratio 0.5
Levered FCF Margin 11.0%Cash from Operations Growth (YoY) 15.0%Cash from Investing Growth (YoY) -8.6%Cash from Financing Growth (YoY) -29.3%Levered FCF Growth (YoY) 38.3%
Copyright © 2013 by Software Equity Group, L.L.C., All Rights Reserved May 2013 Monthly Flash Report
Income Statement Analysis (Median)
Balance Sheet Analysis (Median)
Cash Flow Statement Analysis (Median)
0%
2%
4%
6%
8%
10%
12%
14%
16%SEG Internet Index Stock Market Return: January - April 2013
DOW S&P NASDAQ SEG Internet Index

SEG Internet Index Category: Ad Tech and Lead Generation
Company Name Ticker Market Cap EVTTM
Revenue
TTM Gross
Margin
TTM EBITDA Margin
TTM Revenue
Growth EV/ RevenueEV/
EBITDAForward
EV/ Revenue
Forward EV/
EBITDA
YoY Stock Market Return
Angie's List, Inc. ANGI $1,408.4 $1,360.4 $176.9 72.3% -24.3% 70.9% 7.7x n/a 5.1x n/a 73.8%Baidu.com, Inc. BIDU $30,022.6 $26,692.2 $3,863.1 76.7% 53.5% 47.1% 6.9x 12.9x 5.1x 10.8x -35.3%Bankrate, Inc. RATE $1,348.6 $1,453.4 $440.6 67.7% 23.6% -2.1% 3.3x 14.0x 3.1x 12.5x -42.4%Digital Generation, Inc. DGIT $185.4 $554.5 $386.6 64.5% 26.0% 19.2% 1.4x 5.5x 1.4x 4.6x -27.8%eHealth, Inc. EHTH $407.5 $293.9 $161.6 95.9% 13.1% 6.9% 1.8x 13.9x 1.7x 11.9x 18.2%Google Inc. GOOG $273,564.3 $230,842.3 $53,499.0 57.7% 31.4% 33.8% 4.3x 13.7x 3.7x 10.3x 36.3%Groupon GRPN $4,033.5 $2,823.4 $2,334.5 69.2% 6.5% 45.0% 1.2x 18.6x 1.1x 10.5x -43.0%InterActiveCorp IACI $3,939.8 $3,949.4 $2,902.6 64.7% 15.5% 29.6% 1.4x 8.8x 1.2x n/a -2.2%Marchex Inc. MCHX $155.1 $139.1 $139.0 41.1% 1.7% -9.2% 1.0x 57.4x 1.0x 10.7x 18.7%QuinStreet QNST $279.9 $263.5 $315.1 18.4% 12.1% -16.8% 0.8x 6.9x 0.8x 5.3x -37.8%ReachLocal, Inc. RLOC $471.2 $375.7 $455.4 50.1% 1.7% 21.3% 0.8x 49.4x 0.7x 12.3x 120.5%SINA Corporation SINA $3,759.6 $3,055.2 $529.3 53.2% 4.0% 9.6% 5.8x 144.5x 5.0x 44.7x -3.7%Sohu.com Inc. SOHU $1,967.2 $1,609.4 $1,148.2 67.0% 32.0% 27.0% 1.4x 4.4x n/a 5.1x -0.3%Tree.Com, Inc. TREE $238.6 $158.4 $77.4 94.5% -6.0% 41.8% 2.0x n/a 1.4x 9.5x 155.9%ValueClick, Inc. VCLK $2,347.8 $2,353.7 $660.9 62.3% 30.3% 25.0% 3.6x 11.7x 3.1x 9.3x 45.7%Yandex YNDX $8,458.5 $8,110.1 $995.0 75.2% 43.8% 40.3% 8.2x 18.6x 6.4x n/a 8.5%
Median: $1,687.8 $1,531.4 $492.3 65.9% 14.3% 26.0% 1.9x 13.8x 1.7x 10.5x 4.1%
TTM Revenue Growth 26.0%TTM EBITDA Growth 18.3%TTM Earnings Growth 10.3%Gross Profit Margin 65.9%EBITDA Margin 14.3%Net Income Margin 4.8%SG&A Expenses as a % of Total Revenue 34.3%R&D Expenses as a % of Total Revenue 11.1%
Current Ratio 2.4xQuick Ratio 2.0xCash as Percent of Market Cap 18.3%Avg Days Outstanding: Accounts Receivable 40.1xAvg Days Outstanding: Accounts Payable 57.7xWorking Capital to TTM Operating Expense Ratio 0.4x
Levered FCF Margin 11.0%Cash from Operations Growth (YoY) 4.7%Cash from Investing Growth (YoY) 1.6%Cash from Financing Growth (YoY) -90.9%Levered FCF Growth (YoY) -1.5%
Copyright © 2013 by Software Equity Group, L.L.C., All Rights Reserved May 2013 Monthly Flash Report
Income Statement Analysis (Median)
Balance Sheet Analysis (Median)
Cash Flow Statement Analysis (Median)
-10%
-5%
0%
5%
10%
15%Internet Ad Tech and Lead Generation Stock Market Return: January - April 2013
Ad Tech & Lead Generation S&P NASDAQ SEG Internet Index

SEG Internet Index Category: Commerce
Company Name Ticker Market Cap EVTTM
Revenue
TTM Gross
Margin
TTM EBITDA Margin
TTM Revenue
Growth EV/ RevenueEV/
EBITDAForward
EV/ Revenue
Forward EV/
EBITDA
YoY Stock Market Return
1-800-FLOWERS.COM, Inc. FLWS $383.9 $384.9 $746.1 41.4% 6.0% 1.2% 0.5x 8.6x 0.5x 7.7x 99.0%Amazon.com, Inc. AMZN $115,545.2 $110,690.2 $63,978.0 25.4% 4.2% 24.5% 1.7x 40.8x 1.4x 21.1x 9.4%Bitauto Holdings Limited BITA $451.8 $352.8 $169.6 72.4% 17.5% 57.8% 2.1x 11.9x 1.5x 8.7x 152.7%Bluefly, Inc. BFLY $15.4 $22.1 $93.4 17.2% -23.0% -2.9% 0.2x n/a n/a n/a n/aBlueNile NILE $407.0 $320.6 $414.0 18.7% 3.5% 18.0% 0.8x 22.2x 0.7x 13.1x 7.8%DangDang DANG $316.0 $263.8 $833.2 13.9% -8.6% 43.5% 0.3x n/a 0.3x n/a -51.9%Digital River Inc. DRIV $511.3 $115.6 $397.5 81.6% 7.9% -1.2% 0.3x 3.7x 0.3x 1.8x -23.0%eBay Inc. EBAY $67,991.2 $63,105.2 $14,543.0 69.8% 29.6% 17.4% 4.3x 14.6x 3.7x 11.0x 27.7%Liquidity Services, Inc. LQDT $1,038.1 $992.2 $496.1 44.0% 19.3% 25.8% 2.0x 10.4x 1.8x 8.0x -38.3%Mecox Lane Limited MCOX $44.5 $10.6 $151.8 35.8% -13.3% -30.3% 0.1x n/a n/a n/a -42.1%Mercadolibre, Inc. MELI $4,441.4 $4,250.3 $373.6 79.8% 37.1% 25.0% 11.4x 30.7x 9.4x 25.2x 4.0%Overstock.com, Inc. OSTK $491.9 $410.0 $1,148.9 18.3% 2.8% 9.3% 0.4x 12.7x 0.3x 9.0x 244.9%PetMed Express, Inc. PETS $240.6 $195.1 $232.6 33.5% 11.7% -0.3% 0.8x 7.2x 0.8x 7.0x -7.2%Stamps.com STMP $517.7 $460.5 $119.5 76.4% 24.5% 11.6% 3.9x 15.7x 3.5x 12.7x 16.6%
Median: $471.8 $368.8 $405.8 38.6% 6.9% 14.5% 0.8x 12.7x 1.1x 9.0x 7.8%
TTM Revenue Growth 14.5%TTM EBITDA Growth -22.8%TTM Earnings Growth -48.9%Gross Profit Margin 38.6%EBITDA Margin 6.9%Net Income Margin -1.3%SG&A Expenses as a % of Total Revenue 41.6%R&D Expenses as a % of Total Revenue 18.4%
Current Ratio 3.1xQuick Ratio 2.6xCash as Percent of Market Cap 31.6%Avg Days Outstanding: Accounts Receivable 66.4xAvg Days Outstanding: Accounts Payable 42.0xWorking Capital to TTM Operating Expense Ratio 0.6x
Levered FCF Margin 8.0%Cash from Operations Growth (YoY) 7.4%Cash from Investing Growth (YoY) -5.3%Cash from Financing Growth (YoY) -17.7%Levered FCF Growth (YoY) 11.2%
Copyright © 2013 by Software Equity Group, L.L.C., All Rights Reserved May 2013 Monthly Flash Report
Income Statement Analysis (Median)
Balance Sheet Analysis (Median)
Cash Flow Statement Analysis (Median)
-6%
-4%
-2%
0%
2%
4%
6%
8%
10%
12%
14%
Internet Commerce Internet Stock Market Return: January - April 2013
Commerce S&P NASDAQ SEG Internet Index

SEG Internet Index Category: Content & Media
Company Name Ticker Market Cap EVTTM
Revenue
TTM Gross
Margin
TTM EBITDA Margin
TTM Revenue
Growth EV/ RevenueEV/
EBITDAForward
EV/ Revenue
Forward EV/
EBITDA
YoY Stock Market Return
AOL, Inc. AOL $2,983.5 $2,635.9 $2,191.7 30.9% 21.5% -0.5% 1.2x 5.6x 1.2x 6.2x 54.3%DemandMedia DMD $746.0 $644.5 $380.6 52.4% 18.0% 17.1% 1.7x 9.4x 1.5x 5.7x 4.2%InterActiveCorp IACI $3,939.8 $3,949.4 $2,902.6 64.7% 15.5% 29.6% 1.4x 8.8x 1.2x n/a -2.2%Netflix NFLX $12,628.4 $12,302.5 $3,763.5 27.5% 3.5% 12.1% 3.3x 94.7x 2.7x 35.6x 169.6%Pandora P $2,429.3 $2,340.3 $427.1 31.9% -7.2% 55.7% 5.5x n/a 3.8x 223.0x 62.0%Shutterstock, Inc. SSTK $1,397.9 $1,301.8 $169.6 62.0% 18.9% 41.0% 7.7x 40.6x 6.0x 29.6x n/aTheStreet.com, Inc. TST $61.9 $20.0 $50.7 50.9% -4.5% -12.2% 0.4x n/a n/a n/a -7.9%WebMD Health Corp. WBMD $1,183.7 $991.8 $469.9 54.0% 4.9% -15.9% 2.1x 42.7x 2.2x 12.9x 6.2%XO Group XOXO $273.8 $196.4 $129.1 82.5% 14.8% 3.9% 1.5x 10.3x 1.4x 6.8x 21.5%Yahoo! Inc. YHOO $27,235.0 $24,389.4 $4,905.7 68.1% 27.1% -1.7% 5.0x 18.4x 5.4x 14.8x 59.1%
Median: $1,913.6 $1,821.0 $448.5 53.2% 15.1% 8.0% 1.9x 14.3x 2.2x 13.9x 21.5%
TTM Revenue Growth 8.0%TTM EBITDA Growth 18.4%TTM Earnings Growth -6.4%Gross Profit Margin 53.2%EBITDA Margin 15.1%Net Income Margin 1.6%SG&A Expenses as a % of Total Revenue 36.0%R&D Expenses as a % of Total Revenue 9.3%
Current Ratio 1.8xQuick Ratio 1.6xCash as Percent of Market Cap 15.6%Avg Days Outstanding: Accounts Receivable 51.0xAvg Days Outstanding: Accounts Payable 22.5xWorking Capital to TTM Operating Expense Ratio 0.3x
Levered FCF Margin 13.5%Cash from Operations Growth (YoY) 6.6%Cash from Investing Growth (YoY) 18.4%Cash from Financing Growth (YoY) -8.3%Levered FCF Growth (YoY) 39.7%
Copyright © 2013 by Software Equity Group, L.L.C., All Rights Reserved
Income Statement Analysis (Median)
Balance Sheet Analysis (Median)
Cash Flow Statement Analysis (Median)
May 2013 Monthly Flash Report
0%
5%
10%
15%
20%
25%
30%Internet Content & Media Stock Market Return: January - April 2013
Content & Media S&P NASDAQ SEG Internet Index

SEG Internet Index Category: Gaming
Company Name Ticker Market Cap EVTTM
Revenue
TTM Gross
Margin
TTM EBITDA Margin
TTM Revenue
Growth EV/ RevenueEV/
EBITDAForward
EV/ Revenue
Forward EV/
EBITDA
YoY Stock Market Return
ChangYou.com CYOU $1,537.4 $1,418.2 $664.2 83.0% 63.0% 28.6% 2.1x 3.4x n/a n/a 19.7%Giant Interactive GA $1,793.1 $1,370.0 $345.2 90.5% 64.3% 20.1% 4.0x 6.2x 3.4x 5.3x 39.7%Netease NTES $7,321.8 $4,780.2 $1,315.7 68.6% 47.5% 12.5% 3.6x 7.6x 3.1x 6.5x -6.5%NCSoft KOSE:A036 $2,998.1 $2,517.5 $708.5 69.9% 25.0% 23.8% 3.6x 14.2x n/a n/a -41.8%Perfect World PWRD $579.9 $333.3 $444.5 81.2% 27.3% -7.1% 0.7x 2.7x 0.7x 3.2x -1.9%Sohu.com Inc. SOHU $1,967.2 $1,609.4 $1,148.2 67.0% 32.0% 27.0% 1.4x 4.4x n/a 5.1x -0.3%Tencent Holdings SEHK:700 $62,917.1 $60,411.4 $7,041.8 58.5% 40.0% 54.0% 8.6x 21.5x n/a n/a 9.2%Zynga, Inc. ZNGA $2,532.0 $1,363.3 $1,223.9 72.9% 11.5% 0.5% 1.1x 9.7x 1.4x n/a -61.7%
Median: $2,249.6 $1,513.8 $928.3 71.4% 36.0% 21.9% 2.8x 6.9x 2.3x 5.2x -1.1%
TTM Revenue Growth 21.9%TTM EBITDA Growth 14.0%TTM Earnings Growth 13.6%Gross Profit Margin 71.4%EBITDA Margin 36.0%Net Income Margin 24.8%SG&A Expenses as a % of Total Revenue 24.8%R&D Expenses as a % of Total Revenue 15.2%
Current Ratio 2.6xQuick Ratio 2.4xCash as Percent of Market Cap 32.3%Avg Days Outstanding: Accounts Receivable 17.9xAvg Days Outstanding: Accounts Payable 47.2xWorking Capital to TTM Operating Expense Ratio 0.8x
Levered FCF Margin 21.7%Cash from Operations Growth (YoY) 8.3%Cash from Investing Growth (YoY) -8.6%Cash from Financing Growth (YoY) -713.1%Levered FCF Growth (YoY) 29.2%
Copyright © 2013 by Software Equity Group, L.L.C., All Rights Reserved May 2013 Monthly Flash Report
Income Statement Analysis (Median)
Balance Sheet Analysis (Median)
Cash Flow Statement Analysis (Median)
0%
2%
4%
6%
8%
10%
12%
14%
16%Internet Gaming Stock Market Return: January - April 2013
Gaming S&P NASDAQ SEG Internet Index

SEG Internet Index Category: Infrastructure
Company Name Ticker Market Cap EVTTM
Revenue
TTM Gross
Margin
TTM EBITDA Margin
TTM Revenue
Growth EV/ RevenueEV/
EBITDAForward
EV/ Revenue
Forward EV/
EBITDA
YoY Stock Market Return
8x8, Inc. EGHT $519.5 $472.9 $103.2 67.8% 13.4% 29.3% 4.6x 34.3x 3.9x 20.9x 75.1%Akamai Technologies, Inc. AKAM $7,816.0 $7,302.8 $1,422.5 70.9% 37.1% 18.3% 5.1x 13.8x 4.6x 10.6x 34.7%Brightcove Inc. BCOV $169.1 $142.2 $92.8 68.3% -9.9% 31.7% 1.5x n/a 1.3x 166.3x -67.9%BroadSoft, Inc. BSFT $715.8 $639.6 $164.8 80.3% 18.8% 19.4% 3.9x 20.6x 3.5x 14.3x -40.3%Digital River Inc. DRIV $511.3 $115.6 $397.5 81.6% 7.9% -1.2% 0.3x 3.7x 0.3x 1.8x -23.0%Envivio, Inc. ENVI $43.4 -$11.5 $39.1 61.7% -35.7% -22.8% n/a 0.8x n/a n/a -82.7%Harmonic Inc HLIT $646.2 $418.0 $515.7 45.1% 5.9% -5.2% 0.8x 13.7x 0.9x 8.7x 20.3%Interactive Intelligence, Inc. ININ $823.9 $755.0 $237.4 66.5% 4.7% 13.3% 3.2x 68.1x 2.6x 40.8x 39.7%Limelight Networks, Inc. LLNW $185.5 $59.7 $180.2 53.5% -2.8% 5.2% 0.3x n/a 0.3x 5.1x -29.6%Mitel Networks Corp. MITL $187.9 $402.0 $583.6 55.4% 13.9% -3.8% 0.7x 5.0x 0.7x 4.2x -26.3%Polycom, Inc. PLCM $1,811.5 $1,128.7 $1,385.7 58.9% 8.0% -8.9% 0.8x 10.2x 0.8x 4.9x -20.9%Rovi Corporation ROVI $2,356.1 $2,976.8 $633.6 81.7% 34.0% -11.1% 4.7x 13.8x 4.6x 10.1x -18.3%SeaChange International Inc. SEAC $354.2 $241.3 $157.2 53.7% 8.1% -4.6% 1.5x 18.9x 1.4x 8.6x 32.1%ShoreTel, Inc. SHOR $212.0 $193.6 $306.4 60.4% -2.9% 36.4% 0.6x n/a 0.6x 8.7x -24.6%Sonus Networks, Inc SONS $600.0 $377.2 $253.1 54.8% -9.5% -1.4% 1.5x n/a 1.4x n/a -25.7%Synacor, Inc SYNC $79.4 $41.3 $122.0 45.4% 7.9% 34.0% 0.3x 4.3x 0.3x 3.5x -64.9%Tucows Inc. TCX $84.4 $81.7 $114.7 23.5% 6.4% 18.2% 0.7x 11.1x 0.6x 11.5x 45.8%VeriSign VRSN $6,944.8 $6,088.5 $904.3 80.8% 60.7% 13.6% 6.7x 11.1x 6.3x 9.8x 12.1%
Median: $515.4 $389.6 $245.2 61.0% 7.9% 9.3% 1.5x 12.4x 1.3x 9.3x -21.9%
TTM Revenue Growth 9.3%TTM EBITDA Growth -22.8%TTM Earnings Growth -48.9%Gross Profit Margin 61.0%EBITDA Margin 7.9%Net Income Margin -1.3%SG&A Expenses as a % of Total Revenue 41.6%R&D Expenses as a % of Total Revenue 18.4%
Current Ratio 3.1xQuick Ratio 2.6xCash as Percent of Market Cap 31.6%Avg Days Outstanding: Accounts Receivable 66.4xAvg Days Outstanding: Accounts Payable 42.0xWorking Capital to TTM Operating Expense Ratio 0.6x
Levered FCF Margin 8.0%Cash from Operations Growth (YoY) 7.4%Cash from Investing Growth (YoY) -5.3%Cash from Financing Growth (YoY) -17.7%Levered FCF Growth (YoY) 11.2%
Copyright © 2013 by Software Equity Group, L.L.C., All Rights Reserved May 2013 Monthly Flash Report
Income Statement Analysis (Median)
Balance Sheet Analysis (Median)
Cash Flow Statement Analysis (Median)
-4%
-2%
0%
2%
4%
6%
8%
10%
12%
14%
Internet Infrastructure Stock Market Return: January - April 2013
Infrastructure S&P NASDAQ SEG Internet Index

SEG Internet Index Category: Services
Company Name Ticker Market Cap EVTTM
Revenue
TTM Gross
Margin
TTM EBITDA Margin
TTM Revenue
Growth EV/ RevenueEV/
EBITDAForward
EV/ Revenue
Forward EV/
EBITDA
YoY Stock Market Return
Angie's List, Inc. ANGI $1,408.4 $1,360.4 $176.9 72.3% -24.3% 70.9% 7.7x n/a 5.1x n/a 73.8%Bankrate RATE $1,348.6 $1,453.4 $440.6 67.7% 23.6% -2.1% 3.3x 14.0x 3.1x 12.5x -42.4%Carbonite, Inc. CARB $276.3 $221.0 $90.0 65.4% -6.0% 35.9% 2.5x n/a 2.1x 237.7x 33.2%LifeLock, Inc. LOCK $780.5 $646.3 $276.4 71.1% 7.5% 42.5% 2.3x 31.3x 1.9x 15.8x n/aMonster Worldwide, Inc. MWW $486.7 $502.8 $868.6 54.7% 15.6% -15.2% 0.6x 3.7x 0.6x 3.1x -49.2%Qihoo QIHU $4,211.1 $3,830.4 $329.0 90.0% 20.3% 96.0% 11.6x 57.5x 7.2x 25.9x 39.6%Shutterfly SFLY $1,617.8 $1,372.7 $666.0 54.0% 12.5% 31.3% 2.1x 16.5x 1.8x 9.8x 42.9%Tree.Com, Inc. TREE $238.6 $158.4 $77.4 94.5% -6.0% 41.8% 2.0x n/a 1.4x 9.5x 155.9%VistaPrint VPRT $1,331.9 $1,519.1 $1,137.8 65.7% 9.5% 16.3% 1.3x 14.0x 1.2x 8.9x 9.4%Zillow Z $2,028.3 $1,834.2 $116.9 88.0% 10.6% 76.9% 15.7x 148.3x 10.7x 55.6x 68.7%Xoom XOOM $608.5 $497.9 $87.4 67.0% -2.2% n/a 5.7x n/a 4.4x n/a n/a
Median: $1,331.9 $1,360.4 $276.4 67.7% 9.5% 38.9% 2.5x 16.5x 2.1x 12.5x 39.6%
TTM Revenue Growth 38.9%TTM EBITDA Growth 31.6%TTM Earnings Growth 23.6%Gross Profit Margin 67.7%EBITDA Margin 9.5%Net Income Margin 2.9%SG&A Expenses as a % of Total Revenue 53.0%R&D Expenses as a % of Total Revenue 16.7%
Current Ratio 2.2xQuick Ratio 1.9xCash as Percent of Market Cap 13.7%Avg Days Outstanding: Accounts Receivable 22.4xAvg Days Outstanding: Accounts Payable 60.5xWorking Capital to TTM Operating Expense Ratio 0.3x
Levered FCF Margin 9.0%Cash from Operations Growth (YoY) 82.5%Cash from Investing Growth (YoY) -35.0%Cash from Financing Growth (YoY) -44.2%Levered FCF Growth (YoY) 95.4%
Copyright © 2013 by Software Equity Group, L.L.C., All Rights Reserved May 2013 Monthly Flash Report
Income Statement Analysis (Median)
Balance Sheet Analysis (Median)
Cash Flow Statement Analysis (Median)
0%
5%
10%
15%
20%
25%
Internet Services Stock Market Return: January - April 2013
Services S&P NASDAQ SEG Internet Index

SEG Internet Index Category: Social
Company Name Ticker Market Cap EVTTM
Revenue
TTM Gross
Margin
TTM EBITDA Margin
TTM Revenue
Growth EV/ RevenueEV/
EBITDAForward
EV/ Revenue
Forward EV/
EBITDA
YoY Stock Market Return
Facebook FB $67,084.3 $59,814.3 $5,489.0 72.7% 23.9% 35.9% 10.9x 45.7x 9.0x 17.2x n/aFriendFinder Networks Inc FFN $14.7 $498.8 $314.4 65.3% 23.3% -4.9% 1.6x 6.8x 1.6x 5.6x -58.7%LinkedIn LNKD $21,197.0 $20,447.4 $1,108.6 87.1% 13.5% 79.8% 18.4x 136.8x 13.6x 57.2x 77.1%Mail.ru Group LSE:MAIL $5,645.8 $4,697.3 $680.8 55.1% 42.8% 40.2% 6.9x 16.1x n/a n/a -37.6%Renren Inc RENN $1,060.6 $156.4 $176.1 62.2% -42.9% 49.3% 0.9x n/a 0.6x n/a -54.1%Yelp, Inc. YELP $1,674.0 $1,578.9 $137.6 92.8% -8.3% 65.2% 11.5x n/a 7.5x 74.5x 13.9%YY, Inc. YY $948.1 $723.1 $131.6 52.9% 16.5% 156.5% 5.5x 33.3x 3.2x 14.6x n/a
Median: $1,674.0 $1,578.9 $314.4 65.3% 16.5% 49.3% 6.9x 33.3x 5.3x 17.2x -37.6%
TTM Revenue Growth 49.3%TTM EBITDA Growth 15.3%TTM Earnings Growth 19.6%Gross Profit Margin 65.3%EBITDA Margin 16.5%Net Income Margin 1.2%SG&A Expenses as a % of Total Revenue 37.3%R&D Expenses as a % of Total Revenue 22.9%
Current Ratio 5.2xQuick Ratio 5.0xCash as Percent of Market Cap 16.8%Avg Days Outstanding: Accounts Receivable 45.5xAvg Days Outstanding: Accounts Payable 47.9xWorking Capital to TTM Operating Expense Ratio 1.7x
Levered FCF Margin 13.6%Cash from Operations Growth (YoY) 34.7%Cash from Investing Growth (YoY) -25.3%Cash from Financing Growth (YoY) 26.2%Levered FCF Growth (YoY) n/a
Copyright © 2013 by Software Equity Group, L.L.C., All Rights Reserved
Balance Sheet Analysis (Median)
Cash Flow Statement Analysis (Median)
May 2013 Monthly Flash Report
Income Statement Analysis (Median)
-10%
-5%
0%
5%
10%
15%
20%Internet Social Stock Market Return: January - April 2013
Social S&P NASDAQ SEG Internet Index

SEG Internet Index Category: Travel
Company Name Ticker Market Cap EVTTM
Revenue
TTM Gross
Margin
TTM EBITDA Margin
TTM Revenue
Growth EV/ RevenueEV/
EBITDAForward
EV/ Revenue
Forward EV/
EBITDA
YoY Stock Market Return
Ctrip CTRP $2,852.3 $2,345.4 $667.2 75.0% 18.1% 18.9% 3.5x 19.5x 2.9x 15.1x 1.4%Expedia EXPE $7,546.3 $7,172.7 $4,226.2 77.5% 15.1% 19.5% 1.7x 11.2x 1.5x n/a 30.9%HomeAway AWAY $2,594.8 $2,280.4 $295.8 83.7% 19.1% 22.0% 7.7x 40.5x 6.4x 22.2x 17.3%Kayak Software Corp KYAK $1,551.9 $1,362.1 $292.7 93.3% 17.6% 30.4% 4.7x 26.5x 3.8x 16.0x n/aMakeMyTrip MMYT $477.1 $404.2 $220.6 24.9% -3.0% 21.9% 1.8x n/a 4.1x 76.3x -33.8%Orbitz OWW $630.1 $940.2 $778.8 81.0% 13.6% 1.6% 1.2x 8.9x 1.2x 6.8x 63.8%Priceline PCLN $34,841.3 $31,275.3 $5,261.0 77.6% 36.4% 20.8% 5.9x 16.3x 4.8x 12.6x -8.5%Travelzoo TZOO $392.2 $326.7 $154.0 89.8% 19.2% 2.2% 2.1x 11.1x 2.0x 10.2x -1.7%
Median: $2,073.4 $1,821.3 $481.5 79.3% 17.8% 20.1% 2.8x 16.3x 3.4x 15.1x 1.4%
TTM Revenue Growth 20.1%TTM EBITDA Growth 2.8%TTM Earnings Growth -9.4%Gross Profit Margin 79.3%EBITDA Margin 17.8%Net Income Margin 6.4%SG&A Expenses as a % of Total Revenue 52.0%R&D Expenses as a % of Total Revenue 13.8%
Current Ratio 2.0xQuick Ratio 1.7xCash as Percent of Market Cap 15.6%Avg Days Outstanding: Accounts Receivable 34.7xAvg Days Outstanding: Accounts Payable 184.3xWorking Capital to TTM Operating Expense Ratio 0.6x
Levered FCF Margin 17.9%Cash from Operations Growth (YoY) 25.8%Cash from Investing Growth (YoY) -25.0%Cash from Financing Growth (YoY) -7.7%Levered FCF Growth (YoY) 52.6%
Copyright © 2013 by Software Equity Group, L.L.C., All Rights Reserved May 2013 Monthly Flash Report
Income Statement Analysis (Median)
Balance Sheet Analysis (Median)
Cash Flow Statement Analysis (Median)
0%
2%
4%
6%
8%
10%
12%
14%
16%
18%
20%Internet Travel Stock Market Return: January - April 2013
Travel S&P NASDAQ SEG Internet Index

, our firm has guided and advised companies on five 1992is an investment bank and M&A advisory serving the software and technology sectors. Founded in Software Equity Groupcontinents, including privately-held software and technology companies in the United States, Canada, Europe, Asia Pacific, Africa and Israel. We have represented public companies listed on the NASDAQ, NYSE, American, Toronto, London and Euronext exchanges. Software Equity Group also advises several of the world's leading private equity firms. We are ranked among the top ten investment banks worldwide for application software mergers and acquisitions.
Our value proposition is unique and compelling. We are skilled and accomplished investment bankers with extraordinary software, internet and technology domain expertise. Our industry knowledge and experience span virtually every software product category, technology, market and delivery model, including Software-as-a-Service (Saas), software on-demand and perpetual license. We have profound understanding of software company finances, operations and valuation. We monitor and analyze every publicly disclosed software M&A transaction, as well as the market, economy and technology trends that impact these deals. We're formidable negotiators and savvy dealmakers who facilitate strategic combinations that enhance shareholder value.
Perhaps most important are the relationships we've built and the industry reputation we enjoy. Software Equity Group is known and respected by publicly traded and privately owned are read and relied upon by more than Quarterly and Annual Software Industry Equity Reportssoftware and technology companies worldwide, and we speak with them often. Our
eighteen thousand industry executives, entrepreneurs and equity investors in sixty-one countries, and we have been quoted widely in such leading publications as The Wall Street Journal, Barrons, Information Week, The Daily Deal, The Street.com, U.S. News & World Report, Reuters, Mergers & Acquisitions, USA Today, Arizona Republic, Detroit Free
Copyright © 2012 by Software Equity Group, L.L.C., All Rights Reserved
.Annual and Quarterly Research ReportsTo keep your finger on the pulse of the software equity markets, subscribe to our
ligation, please contact Kris obis an investment bank and M&A advisory serving the software and technology sectors. For a confidential consultation without Software Equity Group)[email protected], 2800-858 509Beible, Director, Business Development (
CONTACT INFORMATION:
Software Equity Group, L.L.C.12220 El Camino Real, Suite 320San Diego, CA 92130www.softwareequity.com
p: (858) 509-2800f: (858) 509-2818
The information contained in this Report is obtained from sources we believe to be reliable, but no representation or guarantee is made about the accuracy or completeness of such information, or the opinions expressed herein. Nothing in this Report is intended to be a recommendation of a specific security or company or intended to constitute an offer to buy or sell, or the solicitation of an offer to buy or sell, any security. Software Equity Group LLC may have an interest in one or more of the securities or companies discussed herein. Financial data provided by Capital IQ.
This Report may not be reproduced in whole or in part without the expressed prior written authorization of Software Equity Group, L.L.C.Software Equity Group registers each Report with the U.S. Copyright Office and vigorously enforces its intellectual property rights.
Press, Entrepreneur Magazine, Softletter, Software Success, Software CEO Online and Software Business Magazine. Software Equity Group’s senior bankers have keynoted and spoken at more than one hundred software industry conferences and seminars, including Software Business, SoftExpo, Culpepper, VAR Conference, ACETECH, and the Arizona, Colorado, Chicago, Southern California, Denver, San Diego, Washington State and Boulder Software Associations.