Metrics for Effort/Cost Estimation of Mobile apps development
Upload
sophia-newtonCategory
view
218download
0
Software Cost Estimation
Main issues: What factors determine cost/effort? How to relate effort to development time?

SE, Cost estimation, Hans van Vliet, ©2008 2
Cost estimation, topics
Quantitative models (E = 2.5 KLOC1.05)Qualitative models (e.g. expert estimation)Agile cost estimation
Relate cost to development time
SE, Cost estimation, Hans van Vliet, ©2008 3
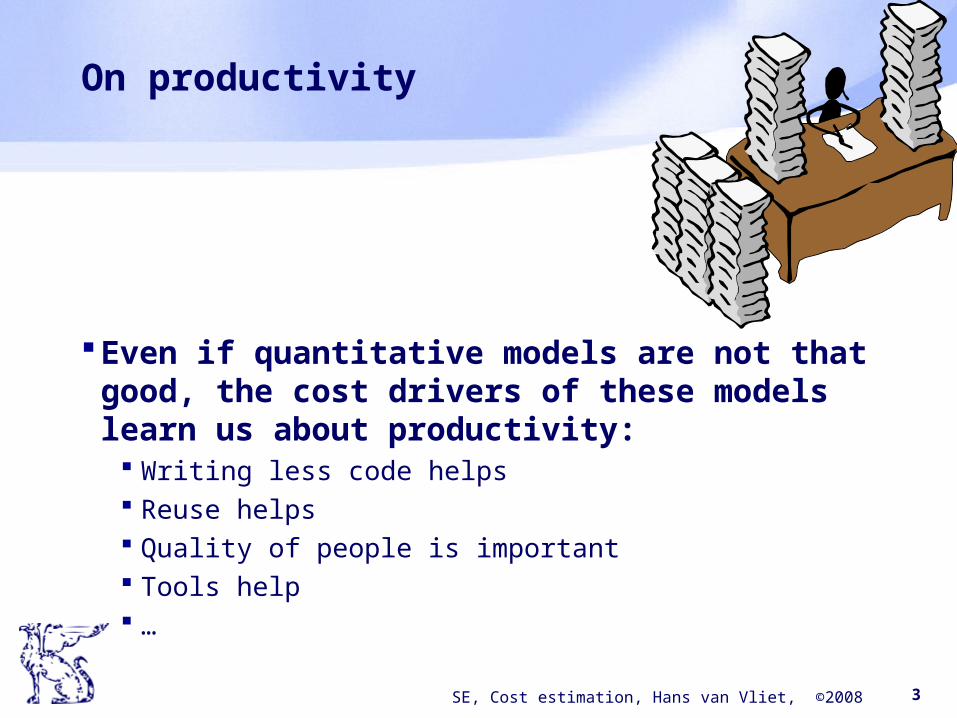
On productivity
Even if quantitative models are not that good, the cost drivers of these models learn us about productivity:
Writing less code helps Reuse helps Quality of people is important Tools help …
SE, Cost estimation, Hans van Vliet, ©2008 4
Algorithmic models
Base formula: E = a + bKLOCc
C usually is around 1C > 1: diseconomy of scaleC < 1: economy of scale
This nominal cost is multiplied by a number of cost drivers (volatility of requirements, amount of documentation required, CMM level, quality of people, …)

SE, Cost estimation, Hans van Vliet, ©2008 5
Walston-Felix
One of the early algorithmic models (1977)Many factors (29 out of 51 projects)Only three alternatives (high, medium, low) per
factor
Its form influenced many later models
SE, Cost estimation, Hans van Vliet, ©2008 6
COCOMO (COnstructive COst MOdel)
Very well-documented (Boehm book, 1981)Basic form: E = bKLOCc, where b (~3) and c (1+ε)
depend on the type of project (mode): Organic: relatively small and well-known Embedded: inflexible environment with many constraints Semidetached: somewhere in between
More complex form: takes into account 15 multiplicative cost drivers
SE, Cost estimation, Hans van Vliet, ©2008 7
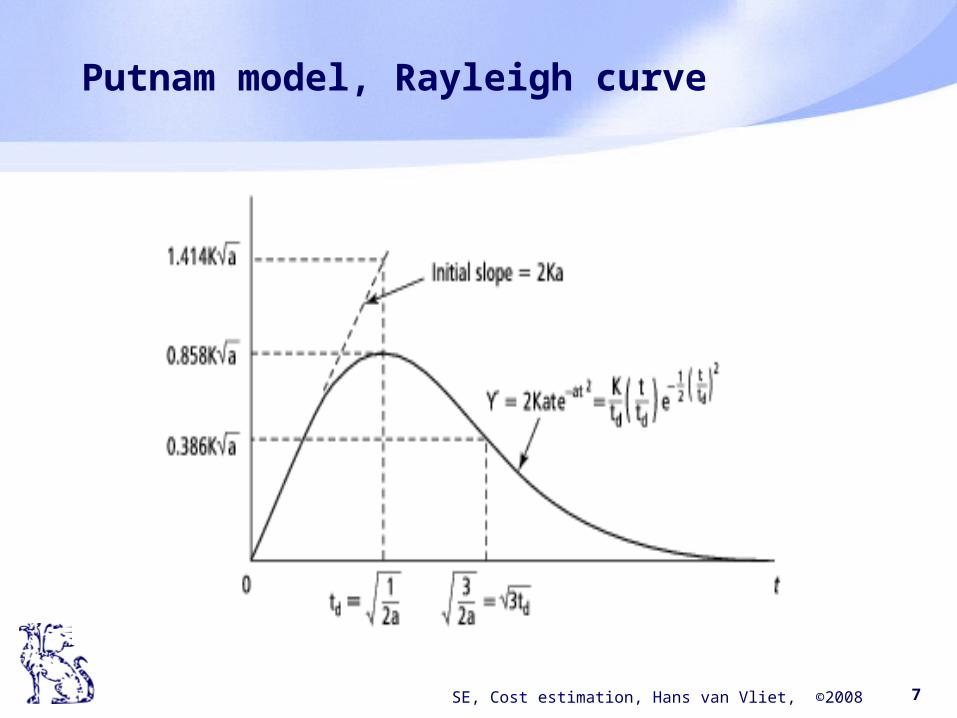
Putnam model, Rayleigh curve
SE, Cost estimation, Hans van Vliet, ©2008 8
Function Point Analysis (FPA)
Size (=cost) is based on number of data structures used:
I: number of input types O: number of output types E: number of enquiry types L: number of logical internal types F: number of interfaces
Then, magically, UFP = 4I + 5O + 10E + 4L + 7F
SE, Cost estimation, Hans van Vliet, ©2008 9
FPA cnt’d
Somewhat more complex model: constants depend on complexity level (simple, average, complex)
Cost drivers (application characteristics) next adjust the value of UFP by at most +/- 40%
Extensive guidelines for counting Function Points
Reflects data-centric world of the 1970’s
Widely used
SE, Cost estimation, Hans van Vliet, ©2008 10
COCOMO2
Successor to COCOMOThree, increasingly complex models:
Application composition model; counting components of large granularity, using object points (objects are: screens, reports, and the like); FPA-like, with 3 levels of complexity for each object.
Early design model: same, but uses 7 cost drivers (project characteristics, combinations of cost drivers from the post-architecture version) instead of 3 simple complexity levels
Post-architecture model: like COCOMO, with updated set of 17 cost drivers
Rather than having 3 modes (COCOMO), COCOMO2 has a more elaborate scaling model
SE, Cost estimation, Hans van Vliet, ©2008 11
Use Case Points
FPA-like model, starting from use casesCounting depends on the use case
How many steps in success scenario How many classes in the implementation Complexity of the actors involved
Next, corrections for the technical and environmental complexity
SE, Cost estimation, Hans van Vliet, ©2008 12
Difficulties with applying these models
People do not collect numbers, so: This project costs the same as the last project We have 6 months, so it will take 6 months …and other political estimates
These models require calibration
SE, Cost estimation, Hans van Vliet, ©2008 13
Guidelines
Estimation planning biddingCombine methodsAsk justificationSelect experts with similar experienceAccept and assess uncertaintyProvide earning opportunitiesTry to avoid, or postpone, effort estimation
SE, Cost estimation, Hans van Vliet, ©2008 14
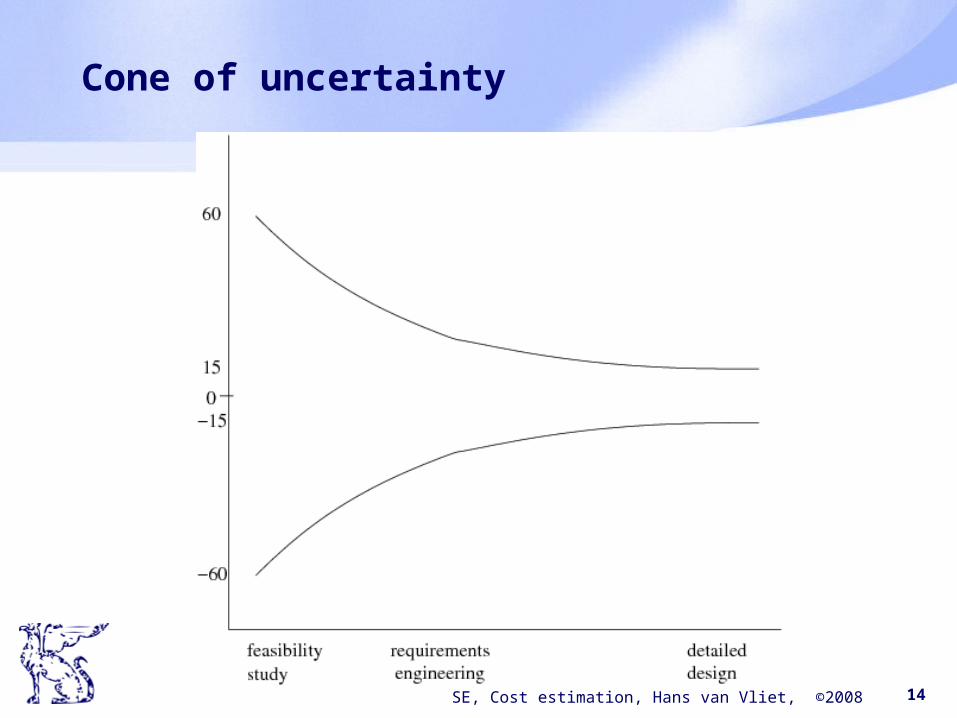
Cone of uncertainty
SE, Cost estimation, Hans van Vliet, ©2008 15
From total effort to number of months
A lot of consensus between models: T 2.5E1/3
Compressing this value has a price: Team larger more communication New people first slows down productivity
Combined: Brooks’ law:
Adding manpower to a late project makes it later
SE, Cost estimation, Hans van Vliet, ©2008 16
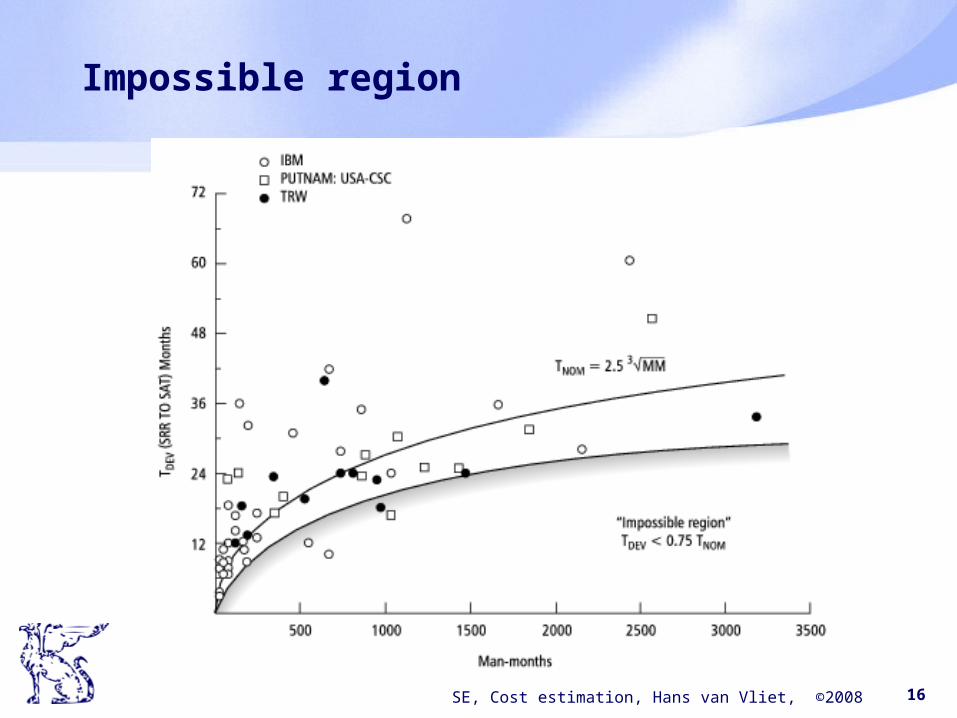
Impossible region
SE, Cost estimation, Hans van Vliet, ©2008 17
Agile cost estimation
Estimate size of features in story points
These are relative sizes: one feature is twice as large as another one, etc.
Use a few simple relative sizes, e.g., 1, 2, 4, and 8
Use a Delphi-like procedure to get consensus
SE, Cost estimation, Hans van Vliet, ©2008 18
Agile cost estimation, cnt’d
Translation of story points to real time: velocity: number of function points completed in one iteration
Start: yesterday’s weather: productivity is the same as that for the last project
If the outcome is wrong: adjust the velocity, not the story points