Soft tissue response to mandibular advancement using · PDF fileOral Maxillofac Surg ......
7
YIJOM-2009; No of Pages 7 Please cite this article in press as: R.C. Almeida, et al., Soft tissue response to mandibular advancement using 3D CBCT scanning, Int J Oral Maxillofac Surg (2011), doi:10.1016/j.ijom.2010.11.018 Leading Clinical Paper Orthognathic Surgery Soft tissue response to mandibular advancement using 3D CBCT scanning R. C. Almeida, L. H. S. Cevidanes, F. A. R. Carvalho, A. T. Motta, M. A. O. Almeida, M. Styner, T. Turvey, W. R. Proffit, C. Phillips: Soft tissue response to mandibular advancement using 3D CBCT scanning. Int. J. Oral Maxillofac. Surg. 2010; xxx: xxx– xxx. # 2010 International Association of Oral and Maxillofacial Surgeons. Published by Elsevier Ltd. All rights reserved. R. C. Almeida a , L. H. S. Cevidanes b , F. A. R. Carvalho a , A. T. Motta c , M. A. O. Almeida a , M. Styner d , T. Turvey e , W. R. Proffit b , C. Phillips b a Department of Orthodontics, State University of Rio de Janeiro, School of Dentistry, Rio de Janeiro, Brazil; b Department of Orthodontics, University of North Carolina, School of Dentistry, Chapel Hill, North Carolina, United States; c Department of Orthodontics, Fluminense Federal University, School of Dentistry, Rio de Janeiro, Brazil; d Department of Computer Science, University of North Carolina, School of Dentistry, Chapel Hill, North Carolina, United States; e Department of Oral Maxillofacial Surgery, University of North Carolina, School of Dentistry, Chapel Hill, North Carolina, United States Abstract. This prospective longitudinal study assessed the 3D soft tissue changes following mandibular advancement surgery. Cranial base registration was performed for superimposition of virtual models built from cone beam computed tomography (CBCT) volumes. Displacements at the soft and hard tissue chin (n = 20), lower incisors and lower lip (n = 21) were computed for presurgery to splint removal (4–6-week surgical outcome), presurgery to 1 year postsurgery (1- year surgical outcome), and splint removal to 1 year postsurgery (postsurgical adaptation). Qualitative evaluations of color maps illustrated the surgical changes and postsurgical adaptations, but only the lower lip showed statistically significant postsurgical adaptations. Soft and hard tissue chin changes were significantly correlated for each of the intervals evaluated: presurgery to splint removal (r = 0.92), presurgery to 1 year postsurgery (r = 0.86), and splint removal to 1 year postsurgery (r = 0.77). A statistically significant correlation between lower incisor and lower lip was found only between presurgery and 1 year postsurgery (r = 0.55). At 1 year after surgery, 31% of the lower lip changes were explained by changes in the lower incisor position while 73% of the soft tissue chin changes were explained by the hard chin. This study suggests that 3D soft tissue response to mandibular advancement surgery is markedly variable. Keywords: soft tissue changes; mandibular advancement surgery; 3D analysis. Accepted for publication 22 November 2010 For the surgeon, the ability to plan accurate skeletal movements to correct a mandibular deficiency is critical. Clinicians have assumed that the soft tissue must adapt and follow the hard tissue movements, but even after decades of study, the associa- tion between the skeletal and soft tissue movements following mandibular advance- ment is not well defined. Previous studies have reported that the soft tissue chin tended to follow the movement of the hard tissue chin closely but that the lower lip position was much more difficult to predict 10,13,18 . Assessments of soft tissue changes dur- ing and after surgery require three dimen- sional (3D) analysis and superimposition due to the complexity of the behavior of the soft tissue and the inability to measure asymmetries in two-dimensional (2D) images. Technologies such as 3D photo- grammetry 2,3,8,19,24 and laser scan- ning 11,12,17,21 of the face have been used for 3D soft tissue superimposition, but their major limitation has been the inabil- ity to standardize registration of the images over time. Current procedures to integrate 3D facial images have reported significant errors in head positioning 11,12 , and potential errors in facial expression have not been assessed 6 . Int. J. Oral Maxillofac. Surg. 2010; xxx: xxx–xxx doi:10.1016/j.ijom.2010.11.018, available online at http://www.sciencedirect.com 0901-5027/000001+07 $36.00/0 # 2010 International Association of Oral and Maxillofacial Surgeons. Published by Elsevier Ltd. All rights reserved.
-
Upload
trinhkhanh -
Category
Documents
-
view
218 -
download
2
Transcript of Soft tissue response to mandibular advancement using · PDF fileOral Maxillofac Surg ......
YIJOM-2009; No of Pages 7
Leading Clinical Paper
Orthognathic Surgery
Int. J. Oral Maxillofac. Surg. 2010; xxx: xxx–xxxdoi:10.1016/j.ijom.2010.11.018, available online at http://www.sciencedirect.com
Soft tissue response tomandibular advancement using3D CBCT scanningR. C. Almeida, L. H. S. Cevidanes, F. A. R. Carvalho, A. T. Motta, M. A. O. Almeida,M. Styner, T. Turvey, W. R. Proffit, C. Phillips: Soft tissue response to mandibularadvancement using 3D CBCT scanning. Int. J. Oral Maxillofac. Surg. 2010; xxx: xxx–xxx. # 2010 International Association of Oral and Maxillofacial Surgeons. Publishedby Elsevier Ltd. All rights reserved.
Please cite this article in press as: R.C. Almeida, et al., Soft tissue response to mandibular ad
Oral Maxillofac Surg (2011), doi:10.1016/j.ijom.2010.11.018
0901-5027/000001+07 $36.00/0 # 2010 International Association of Oral and Maxillofacial Surge
R. C. Almeidaa, L. H. S. Cevidanesb,F. A. R. Carvalhoa, A. T. Mottac,M. A. O. Almeidaa, M. Stynerd,T. Turveye, W. R. Proffitb,C. Phillipsb
aDepartment of Orthodontics, State Universityof Rio de Janeiro, School of Dentistry, Rio deJaneiro, Brazil; bDepartment of Orthodontics,University of North Carolina, School ofDentistry, Chapel Hill, North Carolina, UnitedStates; cDepartment of Orthodontics,Fluminense Federal University, School ofDentistry, Rio de Janeiro, Brazil; dDepartmentof Computer Science, University of NorthCarolina, School of Dentistry, Chapel Hill,North Carolina, United States; eDepartmentof Oral Maxillofacial Surgery, University ofNorth Carolina, School of Dentistry, ChapelHill, North Carolina, United States
Abstract. This prospective longitudinal study assessed the 3D soft tissue changesfollowing mandibular advancement surgery. Cranial base registration wasperformed for superimposition of virtual models built from cone beam computedtomography (CBCT) volumes. Displacements at the soft and hard tissue chin(n = 20), lower incisors and lower lip (n = 21) were computed for presurgery tosplint removal (4–6-week surgical outcome), presurgery to 1 year postsurgery (1-year surgical outcome), and splint removal to 1 year postsurgery (postsurgicaladaptation). Qualitative evaluations of color maps illustrated the surgical changesand postsurgical adaptations, but only the lower lip showed statistically significantpostsurgical adaptations. Soft and hard tissue chin changes were significantlycorrelated for each of the intervals evaluated: presurgery to splint removal(r = 0.92), presurgery to 1 year postsurgery (r = 0.86), and splint removal to 1 yearpostsurgery (r = 0.77). A statistically significant correlation between lower incisorand lower lip was found only between presurgery and 1 year postsurgery (r = 0.55).At 1 year after surgery, 31% of the lower lip changes were explained by changes inthe lower incisor position while 73% of the soft tissue chin changes were explainedby the hard chin. This study suggests that 3D soft tissue response to mandibularadvancement surgery is markedly variable.
Keywords: soft tissue changes; mandibularadvancement surgery; 3D analysis.
Accepted for publication 22 November 2010
For the surgeon, the ability to plan accurateskeletal movements to correct a mandibulardeficiency is critical. Clinicians haveassumed that the soft tissue must adaptand follow the hard tissue movements,but even after decades of study, the associa-tion between the skeletal and soft tissuemovements following mandibular advance-ment is not well defined. Previous studieshave reported that the soft tissue chin tended
to follow the movement of the hard tissuechin closely but that the lower lip positionwas much more difficult to predict10,13,18.
Assessments of soft tissue changes dur-ing and after surgery require three dimen-sional (3D) analysis and superimpositiondue to the complexity of the behavior ofthe soft tissue and the inability to measureasymmetries in two-dimensional (2D)images. Technologies such as 3D photo-
grammetry2,3,8,19,24 and laser scan-ning11,12,17,21 of the face have been usedfor 3D soft tissue superimposition, buttheir major limitation has been the inabil-ity to standardize registration of theimages over time. Current procedures tointegrate 3D facial images have reportedsignificant errors in head positioning11,12,and potential errors in facial expressionhave not been assessed6.
vancement using 3D CBCT scanning, Int J
ons. Published by Elsevier Ltd. All rights reserved.
2 Almeida et al.
YIJOM-2009; No of Pages 7
This study assessed the stability of 3Dsoft tissue changes following mandibularadvancement, and evaluated the associa-tion between soft and hard tissue changesusing registration on the cranial base forthe superimposition of 3D virtual modelsbuilt from cone beam computed tomogra-phy (CBCT) volumes.
Patients and methods
Twenty-five patients (7 men, 18 women;mean age 30.8 � 13.08 years) scheduledfor mandibular advancement surgery wererecruited for this prospective observa-tional study. The protocol was approvedby the Biomedical Institutional ReviewBoard, and informed consent was obtainedfrom all subjects. All patients had skeletalClass II discrepancies with>5 mm overjetthat was severe enough to warrant orthog-nathic surgery. All patients had pre- andpost-surgical orthodontic treatment andhad mandibular advancement surgery withbilateral sagittal split osteotomy. Nineparticipants also had genioplasty as anadjunctive procedure. Patients with ante-rior open bite, cleft lip or palate, or ske-letal disharmonies from trauma ordegenerative conditions such as rheuma-toid arthritis were excluded.
CBCT scans were taken before surgery,at splint removal (4–6 weeks postsurgery),and 1 year postsurgery (after orthodontictreatment) with the NewTom 3G (AFPImaging, Elmsford, NY, USA). The ima-ging protocol involved a 36 s head CBCTscan with a 12 in field of view. All CT scanswere acquired with the patient biting on a
Please cite this article in press as: R.C. Almei
Oral Maxillofac Surg (2011), doi:10.1016/j
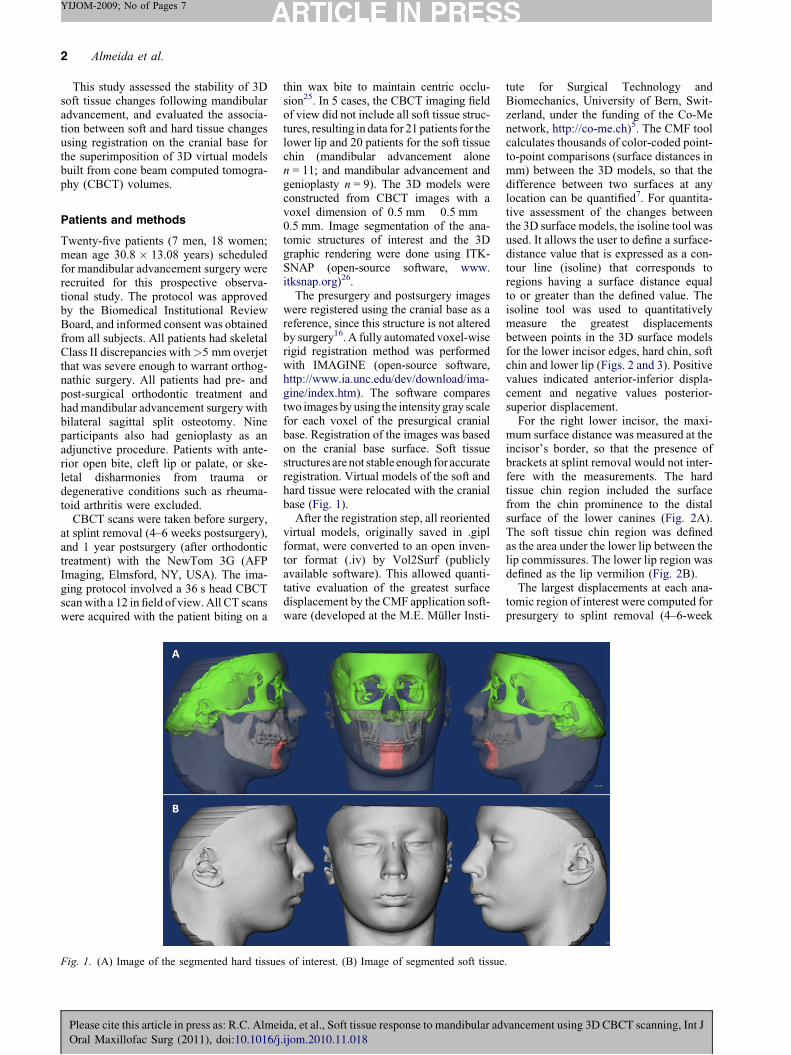
Fig. 1. (A) Image of the segmented hard tissue
thin wax bite to maintain centric occlu-sion25. In 5 cases, the CBCT imaging fieldof view did not include all soft tissue struc-tures, resulting in data for 21 patients for thelower lip and 20 patients for the soft tissuechin (mandibular advancement alonen = 11; and mandibular advancement andgenioplasty n = 9). The 3D models wereconstructed from CBCT images with avoxel dimension of 0.5 mm � 0.5 mm �0.5 mm. Image segmentation of the ana-tomic structures of interest and the 3Dgraphic rendering were done using ITK-SNAP (open-source software, www.itksnap.org)26.
The presurgery and postsurgery imageswere registered using the cranial base as areference, since this structure is not alteredby surgery16. A fully automated voxel-wiserigid registration method was performedwith IMAGINE (open-source software,http://www.ia.unc.edu/dev/download/ima-gine/index.htm). The software comparestwo images by using the intensity gray scalefor each voxel of the presurgical cranialbase. Registration of the images was basedon the cranial base surface. Soft tissuestructures are not stable enough for accurateregistration. Virtual models of the soft andhard tissue were relocated with the cranialbase (Fig. 1).
After the registration step, all reorientedvirtual models, originally saved in .giplformat, were converted to an open inven-tor format (.iv) by Vol2Surf (publiclyavailable software). This allowed quanti-tative evaluation of the greatest surfacedisplacement by the CMF application soft-ware (developed at the M.E. Muller Insti-
da, et al., Soft tissue response to mandibular ad
.ijom.2010.11.018
s of interest. (B) Image of segmented soft tissue
tute for Surgical Technology andBiomechanics, University of Bern, Swit-zerland, under the funding of the Co-Menetwork, http://co-me.ch)5. The CMF toolcalculates thousands of color-coded point-to-point comparisons (surface distances inmm) between the 3D models, so that thedifference between two surfaces at anylocation can be quantified7. For quantita-tive assessment of the changes betweenthe 3D surface models, the isoline tool wasused. It allows the user to define a surface-distance value that is expressed as a con-tour line (isoline) that corresponds toregions having a surface distance equalto or greater than the defined value. Theisoline tool was used to quantitativelymeasure the greatest displacementsbetween points in the 3D surface modelsfor the lower incisor edges, hard chin, softchin and lower lip (Figs. 2 and 3). Positivevalues indicated anterior-inferior displa-cement and negative values posterior-superior displacement.
For the right lower incisor, the maxi-mum surface distance was measured at theincisor’s border, so that the presence ofbrackets at splint removal would not inter-fere with the measurements. The hardtissue chin region included the surfacefrom the chin prominence to the distalsurface of the lower canines (Fig. 2A).The soft tissue chin region was definedas the area under the lower lip between thelip commissures. The lower lip region wasdefined as the lip vermilion (Fig. 2B).
The largest displacements at each ana-tomic region of interest were computed forpresurgery to splint removal (4–6-week
vancement using 3D CBCT scanning, Int J
.

Soft tissue response to mandibular advancement 3
YIJOM-2009; No of Pages 7
Please cite this article in press as: R.C. Almeida, et al., Soft tissue response to mandibular ad
Oral Maxillofac Surg (2011), doi:10.1016/j.ijom.2010.11.018
Fig. 2. Demonstration of the areas measured. (A) Blue is where the lower incisors weremeasured and yellow where the hard chin was measured. (B) Green is where the lower lip wasmeasured and brown where the soft chin was measured. (For interpretation of the references tocolor in this figure legend, the reader is referred to the web version of the article.)
Fig. 3. Illustrations of isolines as a measurement tool on a superimposition of pre- and post-surgery segmentations. (A) Representation of the hard chin and the lower incisors. (B)Representation of the soft chin and the lower lip. The qualitative changes were visualizedwith color maps that indicate inward (blue) or outward (red) displacement between overlaidstructures. An absence of change is indicated by green20. (For interpretation of the references tocolor in this figure legend, the reader is referred to the web version of the article.)
Fig. 4. Example of a case showing improvement of the surgery outcomes 1 year after surgerypresurgery and splint removal superimposition. (B) Color maps and semi-transparencies of postsuRed indicates outward displacement, green no displacement and blue inward displacement. (Forfigure legend, the reader is referred to the web version of the article.)
surgical outcome), presurgery to 1 yearpostsurgery (1 year surgical outcome), andsplint removal to 1 year postsurgery (post-surgical adaptation).
The greatest displacement for eachregion of 10 randomly selected superim-positions was measured twice, at a 2-weekinterval. Agreement between the displace-ments of the replicates was assessed byusing intraclass correlations (ICC). Pairedt-tests were used to assess if the averagechange from splint removal to 1 yearpostsurgery as well as the average differ-ence in hard and soft tissue displacementfor each time interval was zero. Pearsoncorrelation coefficients were used toassess the association between the softand hard chin as well as lower incisorsand lower lip changes. Level of signifi-cance was set at 0.05. The percent ofpatients for whom the difference in thehard and soft tissue displacement wasgreater than 2 mm was calculated anddisplayed graphically.
Results
Agreement between the replicated mea-surements was excellent (P < 0.001) forall anatomic regions: hard chin(ICC = 0.98); lower incisor (ICC = 0.94);soft chin (ICC = 0.98); lower lip(ICC = 0.96).
Soft tissue facial results varied regardlessof whether they had genioplasty. Someswelling was still present at splint removal,even in cases with mandibular advance-ment only and no genioplasty. Soft tissue
vancement using 3D CBCT scanning, Int J
. (A) Color maps and semi-transparencies ofrgery and 1 year postsurgery superimposition.interpretation of the references to color in this

4 Almeida et al.
YIJOM-2009; No of Pages 7
Fig. 5. Example of a case showing relapse of surgery outcomes 1 year after surgery. (A) Color maps and semi-transparencies of presurgery andsplint removal superimposition. The noise in the perifery of the CBCT generates artifacts in the soft tissue surface model in this patient. (B) Colormaps and semi-transparencies of postsurgery and 1 year postsurgery superimposition. Red indicates outward displacement, green no displacementand blue inward displacement. (For interpretation of the references to color in this figure legend, the reader is referred to the web version of thearticle.)
facial results in the 1 year follow-upimproved for some patients (Fig. 4), partialrelapse was observed in some (Fig. 5) andmost remained stable (Fig. 6).
Color maps of the mandibular changesallowed clear visual analysis of the ante-rior-inferior displacement of the hard chinat splint removal as an outcome of surgery.The color maps also revealed a tendency forslight superior-posterior adaptation of thehard chin in the post-splint removal period.The qualitative evaluation of the soft tissuechin showed that this region had the samebehavior as the hard tissue chin at all timepoints, but changes in soft tissue were in
Please cite this article in press as: R.C. Almei
Oral Maxillofac Surg (2011), doi:10.1016/j
Fig. 6. Example of a case that maintained the supostsurgery superimposition. (B) Color maps aoutward displacement, green no displacement andreader is referred to the web version of the artic
general slightly more marked than skeletalchanges.
Color map observation indicated thatdental changes were less marked thanskeletal changes. The lower incisoredges were also displaced anterior-infer-iorly as a result of the mandibularadvancement surgery, with slight post-surgical adaptation in the opposite direc-tion. The lower lip anterior-inferiormovement at splint removal was greaterthan the lower incisor movement, andthe postsurgical posterior-superior adap-tation was also more marked than thelower incisor changes.
da, et al., Soft tissue response to mandibular ad
.ijom.2010.11.018
rgery outcomes 1 year after surgery. (A) Color mnd semi-transparencies of postsurgery and 1 yea
blue inward displacement. (For interpretation ofle.)
The average difference in the changefrom presurgery to splint removal com-pared with the change from splint removalto 1 year postsurgery was only statisticallysignificantly different from zero for theinferior lip displacements (P = 0.01).
The correlation between the soft andhard tissue chin displacements were sta-tistically significant (P < 0.0001) for pre-surgery to splint removal (r = 0.92), splintremoval to 1 year postsurgery (r = 0.77)and presurgery to 1 year postsurgery(r = 0.86) (Table 1). The average displa-cement of the soft tissue chin was greaterthan that of the hard tissue chin for all
vancement using 3D CBCT scanning, Int J
aps and semi-transparencies of presurgery andr postsurgery superimposition. Red indicatesthe references to color in this figure legend, the

Soft tissue response to mandibular advancement 5
YIJOM-2009; No of Pages 7
Table 1. Correlation of hard and soft tissue changes within each time interval.
Time intervalHard/soft tissue chin Lower incisor/lower lip
r* P Variability explained** r* P Variability explained
Presurgery to splint removal 0.92 <0.001 85% 0.12 0.62 1.4%Splint removal to 1 year postsurgery 0.77 <0.001 59% 0.21 0.36 4.4%Presurgery to 1 year postsurgery 0.86 <0.001 74% 0.55 0.01 30%
* Pearson’s correlation coefficient (r).** Coefficient of determination.
Table 2. Difference in mm between hard and soft tissue chin displacements within each time interval.
nHard tissue Soft tissue Difference
Mean Std Min/Max Mean Std Min/Max Mean Std P
Presurgery to splint removal 20 6.36 2.39 2.5/15.8 7.06 2.27 3.5/10.0 0.72 0.92 0.002Splint removal to 1 year postsurgery 20 �0.69 2.28 �4.8/4.2 �0.70 3.10 �5/5.2 �0.01 1.97 0.98Presurgery to 1 year postsurgery 20 5.83 2.42 1.9/15.6 6.68 2.16 2.3/10.5 0.85 1.25 0.007
Table 3. Difference in mm between lower incisors and lower lip displacements within each time interval.
Time interval nLower incisor Lower lip Difference
Mean Std Min/Max Mean Std Min/Max Mean Std P
Presurgery to splint removal 21 2.83 1.60 �0.5/5.1 3.49 1.91 1.4/8 0.66 2.34 0.21Splint removal to 1 year postsurgery 21 0.76 0.85 �0.5/2.5 �0.12 2.46 �3.5/4.5 �0.89 2.43 0.11Presurgery to 1 year postsurgery 20 2.59 1.43 0.4/5.1 2.72 1.78 0.4/6.6 0.13 1.55 0.71
three time intervals, but the average dif-ference between the hard and soft tissuedisplacements from splint removal to 1year after surgery was not statisticallysignificant (P = 0.98, Table 2).
For 10% of the subjects, the soft tissuechin changes between presurgery andsplint removal in an anterior inferiordirection were more than 2 mm largerthan the hard tissue chin changes.Between splint removal and 1 year, aslightly higher percentage (15%) of thesubjects had a soft tissue displacementthat exceeded the hard tissue displace-ment by 2 mm or more, while 15% hadsoft tissue changes that were more than2 mm smaller than the hard tissue change(Fig. 7). The chin displacement from pre-
Please cite this article in press as: R.C. Almei
Oral Maxillofac Surg (2011), doi:10.1016/j
Fig. 7. Percentage of patients with differences ingreater than 2 mm.
surgery to 1 year postsurgery explained73% of the variability in the soft tissuechin changes, which is less than the 85%that was observed for presurgery to splintremoval (Table 1).
The correlation between the displace-ment of the lower incisor and the lower lipwas statistically significant for changesbetween presurgery and 1 year postsur-gery (r = 0.55), which means that only30% of the variability of the lower lipdisplacement was explained by changesin the lower incisor position (Table 1). Theaverage difference between the lower inci-sor and lower lip displacements was notstatistically significant (Table 3).
Between presurgery and splint removal,approximately 20% of patients showed
da, et al., Soft tissue response to mandibular ad
.ijom.2010.11.018
displacements of the hard and soft tissue chin
lower incisor changes more than 2 mmlarger than the inferior lip changes, whilemore than 30% had a significant greaterdisplacement of the lip compared with thelower incisor. From splint removal to 1year postsurgery, approximately 20% ofthe patients had more than 2 mm differ-ence between the amount of lower lip andlower incisor displacements. Between pre-surgery to 1 year postsurgery over 50% ofthe sample had more than 2 mm differencebetween the lower lip and lower incisordisplacement (Fig. 8). Figure 9 givesexamples of the three different periodsanalyzed.
Discussion
CBCT images display the soft-tissue sur-faces accurately, but noise in the imagecan negatively affect the quality of the softtissue in the CBCT volume (Fig. 5)15. 3Dphotographs provide additional informa-tion about color and surface texture, aswell as higher resolution7. No soft tissuestructures are stable enough to allow regis-tration between before- and after-treat-ment images, because the soft tissueschange with growth, treatment, head pos-ture, weight gain or loss, aging and facialexpression. 3D photographs provide nohard tissue information and an assessmentof the associations between soft and hardtissue changes would not be possible.Alternatively, the use of 3D photographsregistered to CBCT images could improve
vancement using 3D CBCT scanning, Int J

6 Almeida et al.
YIJOM-2009; No of Pages 7
Fig. 8. Percentage of patients with differences in displacements of the lower incisor and lowerlip greater than 2 mm.
soft tissue assessments. MAAL et al.14
reported �1.9 mm registration errorsbetween 3D photographs and CBCT atthe lateral neck, mouth and around theeyes.
An important step toward overcomingthese problems would be simultaneousacquisition of CBCT and 3D photographs,but that is not possible at present. Problemsthat need to be overcome with 3D photo-graph superimposition include inadequateuse of fiducials, head position in acquisi-tion, soft tissue capture errors, and current
Please cite this article in press as: R.C. Almei
Oral Maxillofac Surg (2011), doi:10.1016/j
Fig. 9. Example of the three different periods aimages at splint removal. Right: images at 1 yearof the surgery outcomes at 1 year postsurgery. (B)postsurgery.
use of non-rigid registration deformation ofsoft tissue contours to allow matching of 3Dphotographs to CBCT soft tissues.
Between presurgery and splint removal,over 10% of patients had a displacement ofmore than 2 mm in the soft tissue chin inrelation to the hard tissue chin. This per-centage was even higher (15%) for theperiod between splint removal and 1 yearpostsurgery, but in the same period another15% had a smaller soft tissue than hardtissue change. There was a general ten-dency, supported by the moderately high
da, et al., Soft tissue response to mandibular ad
.ijom.2010.11.018
nalyzed. Left: images are presurgery. Center:postsurgery. (A) Patient who had some relapsePatients with stable soft tissue results at 1 year
correlations, for the soft tissue chin changeduring all intervals to be directionally thesame as the hard tissue chin, which agreeswith previous studies using lateral cephalo-metrics1,4,9,22. Several studies using cepha-lometric examinations have found that thehard chin and the soft chin would have adisplacement ratio of 1:19,22,23, however,ratios should not be used as predictors.Ratios are simplistic mathematical repre-sentations of the relation of the anatomicregions of interest displacements that donot reflect the individual variability inresponse. Individual variability in theresponse of the soft tissues must be takeninto account when simulating and planningthe soft tissue surgical outcomes.
The larger displacement, on average, ofthe lower incisors relative to the lower lipduring all time intervals observed in thisstudy must be interpreted with caution.Between presurgery and 1 year postsur-gery, almost 40% of patients in this studyhad 2 mm or more of larger displacementsof the incisors compared with lower lipchanges. This could be explained by fourfactors: the presence of brackets on theteeth at the pre- and 6-week postsurgeryscans, and their absence at 1 year post-surgery when orthodontics had been com-pleted and braces had been removed; someedema and swelling is often still present atsplint removal; slight variation in facialexpression since it is difficult to reproducethe same facial mimics for all time points;and compensatory movement of the inci-sors. SIMMONS et al.20 reported that evenwith postsurgical relapse of 2–4 mm in theposition of the mandible at 5 year recall,the overjet did not change significantlybecause the incisors moved forward asthe mandible moved back. Previous stu-dies using cephalometric radiographs havealso indicated that the lip position is not aspredictable as the soft tissue chin whencompared with the underlying hard tissuechanges. Those studies reported ratiosbetween lower incisors and lower lip ran-ging from 0.26:1 to 0.85:113,18.
For all the time intervals studied, thelarge standard deviations relative to themean reflect the individual variability ofboth hard and soft tissue changes postsur-gically. In recent years, a growing numberof commercially available programs for 3Dvirtual surgery and visualization haveappeared. The biggest drawback to theseprograms is the lack of validation of out-comes. Soft tissue predictions lack valida-tion and are difficult to predict accurately inthree dimensions. The current commer-cially available programs utilize springdeformation and morphing programs forsoft tissue surgical predictions. This is
vancement using 3D CBCT scanning, Int J

Soft tissue response to mandibular advancement 7
YIJOM-2009; No of Pages 7
not biomechanically accurate, nor has itbeen validated. Validation of soft tissueoutcomes would greatly improve patientpresentation and understanding of surgicaloutcomes.
In general, this evaluation using 3Dimages has supported previous findingsfrom 2D radiographs that the soft chinchanges following mandibular advance-ment are more predictable when comparedwith the hard tissue chin than the lower lipchanges relative to the lower incisor.Further investigation is needed to under-stand and allow simulation and planningof the actual soft tissue surgical outcomesof the craniofacial components.
Funding
NIH grants DE-017727, DE-018962 andDE-005215 from NIDCR, and grantUL1RR025747 from NCRR.
Competing interests
None declared.
Ethical approval
The work has been approved by the Uni-versity’s IRB Office, Study #03-1642.Subjects gave informed consent to parti-cipate in the study.
References
1. Albrechtsen LL, BE. Changes in lowerlip cross-sectional area subsequent tomandibular advancement surgery. Int JAdult Orthod Orthognath Surg 1997:12: 287–296.
2. Aldridge K, Boyadjiev SA, Capone
GT, DeLeon VB, Richtsmeier JT. Pre-cision and error of three-dimensional phe-notypic measures acquired from 3dMDphotogrammetric images. Am J MedGenet A 2005: 138A: 247–253.
3. Ayoub AF, Xiao Y, Khambay B, Sie-
bert JP, Hadley D. Towards building aphoto-realistic virtual human face forcraniomaxillofacial diagnosis and treat-ment planning. Int J Oral Maxillofac Surg2007: 36: 423–428.
4. Bailey LJ, Collie FM, White Jr RP.Long-term soft tissue changes afterorthognathic surgery. Int J Adult Ortho-don Orthognath Surg 1996: 11: 7–18.
5. Chapuis J, Schramm A, Pappas I, Hal-
lermann W, Schwenzer-Zimmerer K,Langlotz F, Caversaccio M. A newsystem for computer-aided preoperative
Please cite this article in press as: R.C. Almei
Oral Maxillofac Surg (2011), doi:10.1016/j
planning and intraoperative navigationduring corrective jaw surgery. IEEETrans Inf Technol Biomed 2007: 11:274–287.
6. Curry SBS, Carlson S, Beers A, Boyd
R. Integrated three-dimensional craniofa-cial mapping at the Craniofacial ResearchInstrumentation Laboratory/University ofthe Pacific. Semin Orthod 2001: 7: 258–265.
7. Gerig GJM, Chakos M. Valmet: a newvalidation tool for assessing and improv-ing 3D object segmentation. MICCAI:Proceedings of the International Societyand Conference Series on MedicalImage Computing and Computer-Assisted Intervention, vol. 2208. 2001:516–528.
8. Goos MI, Alberink IB, Ruifrok AC.2D/3D image (facial) comparison usingcamera matching. Forensic Sci Int 2006:163: 10–17.
9. Hamada T, Motohashi N, Kawamoto
T, Ono T, Kato Y, Kuroda T. Two-dimensional changes in soft tissue profilefollowing surgical mandibular advance-ment in Japanese retrognathic adults. Int JAdult Orthodon Orthognath Surg 2001:16: 272–279.
10. Hershey HG, Smith LH. Soft-tissue pro-file change associated with surgical cor-rection of the prognathic mandible. Am JOrthod 1974: 65: 483–502.
11. Kau CH, Cronin AJ, Richmond S. Athree-dimensional evaluation of post-operative swelling following orthog-nathic surgery at 6 months. PlastReconstr Surg 2007: 119: 2192–2199.
12. Kau CH, Richmond S, Savio C, Mall-
orie C. Measuring adult facial morphol-ogy in three dimensions. Angle Orthod2006: 76: 773–778.
13. Lines PA, Steinhauser EW. Diagnosisand treatment planning in surgical ortho-dontic therapy. Am J Orthod 1974: 66:378–397.
14. Maal TJ, Plooij JM, Rangel FA, Mol-
lemans W, Schutyser FA, Berge SJ.The accuracy of matching three-dimen-sional photographs with skin surfacesderived from cone-beam computed tomo-graphy. Int J Oral Maxillofac Surg 2008:37: 641–646.
15. Mah JHJ, Bumann A. The cone-beamdecision in orthodontics. In: McNamara
Jr JA, Kapila SD, eds: Digital Radio-graphy and Three-dimensional Imaging,32nd Annual Moyers Symposium, vol.43Ann Arbor, 2006: 17.
16. Melsen B. The cranial base. Acta Odon-tol Scand 1974: 32.
17. Nishii Y, Nojima K, Takane Y, Isshiki
Y. Integration of the maxillofacial three-
da, et al., Soft tissue response to mandibular ad
.ijom.2010.11.018
dimensional CT image and the three-dimensional dental surface image. J JapanOrthod Soc 1998: 57: 189–194.
18. Quast DC, Biggerstaff RH, Haley JV.The short-term and long-term soft-tissueprofile changes accompanying mandibu-lar advancement surgery. Am J Orthod1983: 84: 29–36.
19. Sawyer AR, See M, Nduka C. 3Dstereophotogrammetry quantitative lipanalysis. Aesth Plast Surg 2009: 33:497–504.
20. Simmons KE, Turvey TA, Phillips C,Proffit WR. Surgical-orthodontic cor-rection of mandibular deficiency: five-year follow-up. Int J Adult OrthodonOrthognath Surg 1992: 7: 67–79.
21. Terai H, Shimahara M, Sakinaka Y,Tajima S. Accuracy of integration ofdental casts in three-dimensional models.J Oral Maxillofac Surg 1999: 57: 662–665 [discussion 666].
22. Thuer U, Ingervall B, Vuillemin T.Stability and effect on the soft tissueprofile of mandibular advancement withsagittal split osteotomy and rigid internalfixation. Int J Adult Orthodon OrthognathSurg 1994: 9: 175–185.
23. Veltkamp T, Buschang PH, English
JD, Bates J, Schow SR. Predicting lowerlip and chin response to mandibularadvancement and genioplasty. Am JOrthod Dentofac Orthop 2002: 122:627–634.
24. Weinberg SM, Naidoo S, Govier DP,Martin RA, Kane AA, Marazita ML.Anthropometric precision and accuracyof digital three-dimensional photogram-metry: comparing the Genex and 3dMDimaging systems with one another andwith direct anthropometry. J CraniofacSurg 2006: 17: 477–483.
25. The Academy of Prosthodontics.Glossary of prosthodontic terms, 7thed.. J Prosthet Dent 1999: 81: 39–110.
26. Yushkevich PA, Piven J, Hazlett HC,Smith RG, Ho S, Gee JC, Gerig G. User-guided 3D active contour segmentation ofanatomical structures: significantlyimproved efficiency and reliability. Neu-roimage 2006: 31: 1116–1128.
Address:Lucia H.S. CevidanesDepartment of OrthodonticsUNC School of DentistryChapel HillNC 27599-7450United StatesTel. +1 919 357 8603fax: +1 919 843 8864E-mail: [email protected]
vancement using 3D CBCT scanning, Int J