Soft Red Winter Production, Quality and Overseas …...Soft Red Winter Production, Quality and...
26
Soft Red Winter Production, Quality and Overseas Markets Steve Wirsching Vice President and Director of the West Coast Office US Wheat Associates
Transcript of Soft Red Winter Production, Quality and Overseas …...Soft Red Winter Production, Quality and...
Soft Red Winter
Production, Quality and
Overseas Markets
Steve Wirsching
Vice President and Director of the
West Coast Office
US Wheat Associates
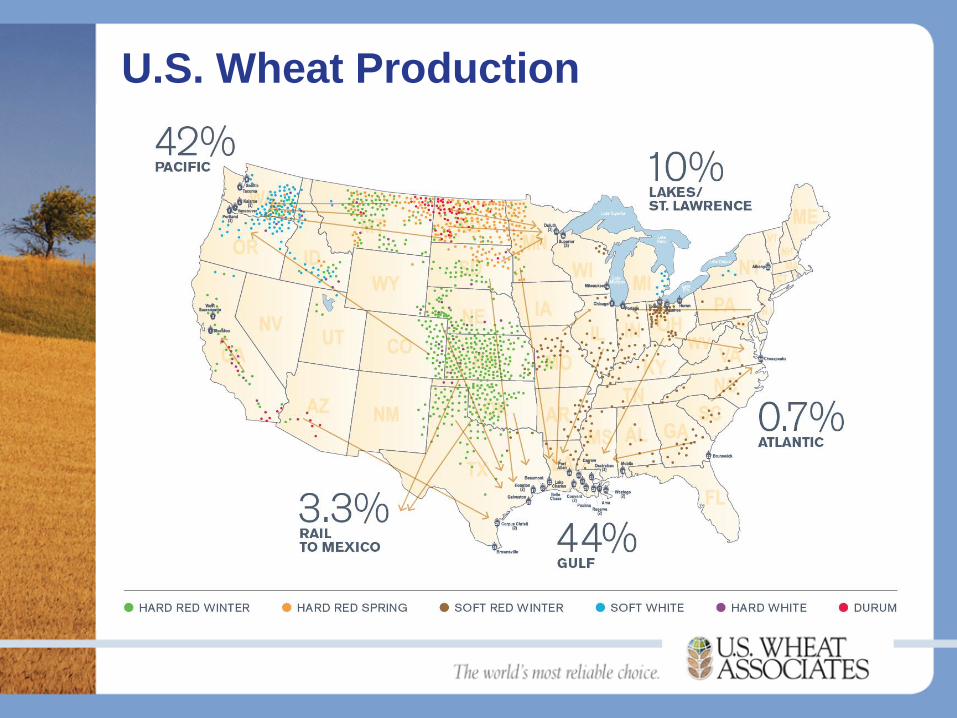
U.S. Wheat Production
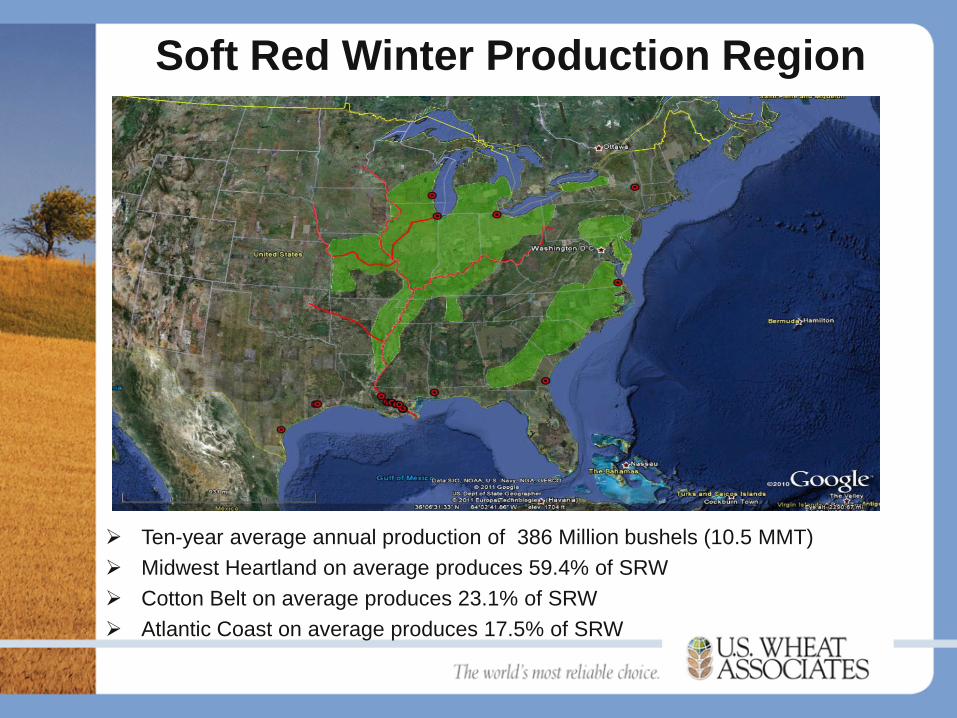
Soft Red Winter Production Region
Ten-year average annual production of 386 Million bushels (10.5 MMT)
Midwest Heartland on average produces 59.4% of SRW
Cotton Belt on average produces 23.1% of SRW
Atlantic Coast on average produces 17.5% of SRW

Soft Red Winter Exports
• US regions exporting SRW:
• 68% of SRW is exported via the Mississippi River.
• 16% of SRW is exported via the Atlantic Seaboard (largely Norfolk).
• 7% of SRW is exported via the Texas Gulf.
• 5% of SRW is exported via the Interior.
• 4% of SRW is exported via the Great Lakes and Saint Lawrence Seaway.
• Conveyance for SRW exports:
• 93% of SRW exports leave the country via bulk ship.
• 5% of SRW exports leave the country via rail (largely to Mexico).
• 2% of SRW exports leave the country via container (largely to China).
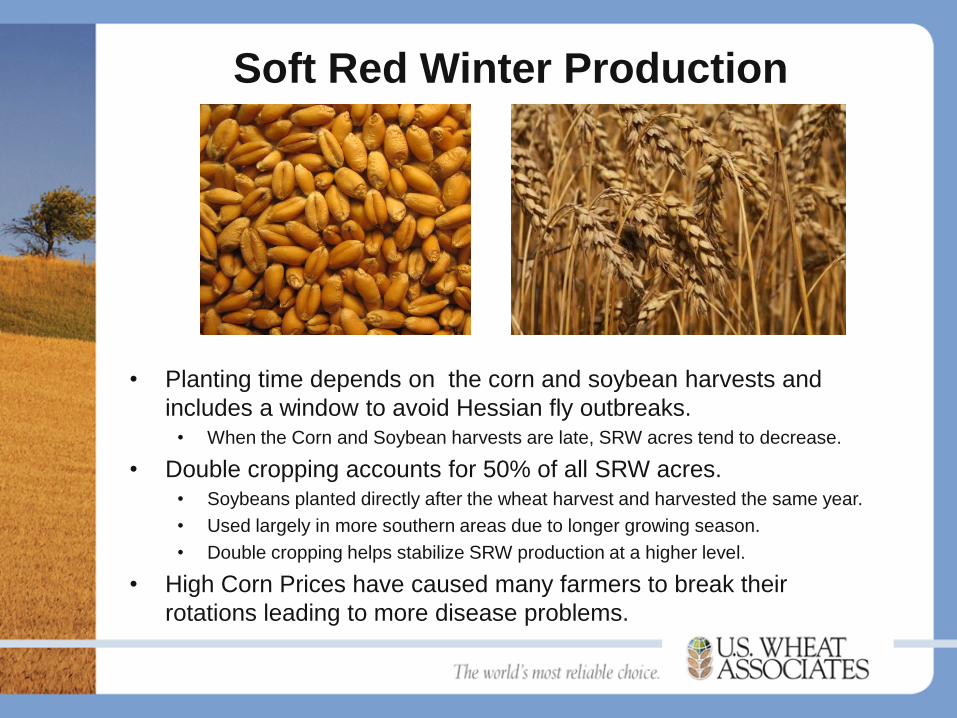
Soft Red Winter Production
• Planting time depends on the corn and soybean harvests and
includes a window to avoid Hessian fly outbreaks. • When the Corn and Soybean harvests are late, SRW acres tend to decrease.
• Double cropping accounts for 50% of all SRW acres. • Soybeans planted directly after the wheat harvest and harvested the same year.
• Used largely in more southern areas due to longer growing season.
• Double cropping helps stabilize SRW production at a higher level.
• High Corn Prices have caused many farmers to break their
rotations leading to more disease problems.
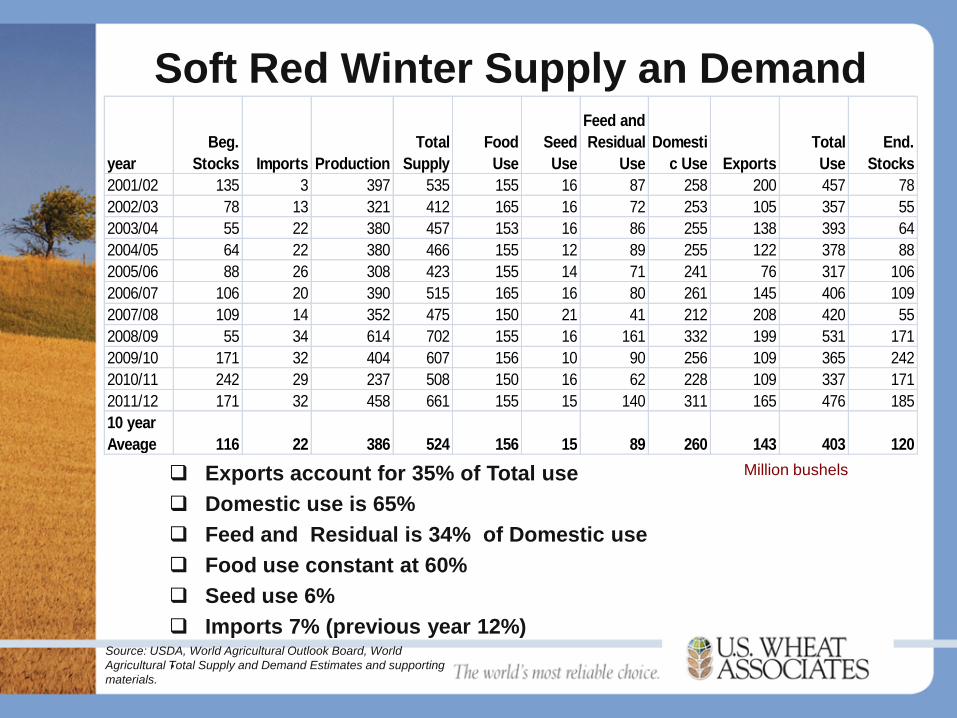
Soft Red Winter Supply an Demand
Exports account for 35% of Total use
Domestic use is 65%
Feed and Residual is 34% of Domestic use
Food use constant at 60%
Seed use 6%
Imports 7% (previous year 12%)
.
year
Beg.
Stocks Imports Production
Total
Supply
Food
Use
Seed
Use
Feed and
Residual
Use
Domesti
c Use Exports
Total
Use
End.
Stocks
2001/02 135 3 397 535 155 16 87 258 200 457 78
2002/03 78 13 321 412 165 16 72 253 105 357 55
2003/04 55 22 380 457 153 16 86 255 138 393 64
2004/05 64 22 380 466 155 12 89 255 122 378 88
2005/06 88 26 308 423 155 14 71 241 76 317 106
2006/07 106 20 390 515 165 16 80 261 145 406 109
2007/08 109 14 352 475 150 21 41 212 208 420 55
2008/09 55 34 614 702 155 16 161 332 199 531 171
2009/10 171 32 404 607 156 10 90 256 109 365 242
2010/11 242 29 237 508 150 16 62 228 109 337 171
2011/12 171 32 458 661 155 15 140 311 165 476 185
10 year
Aveage 116 22 386 524 156 15 89 260 143 403 120
Million bushels
Source: USDA, World Agricultural Outlook Board, World
Agricultural Total Supply and Demand Estimates and supporting
materials.
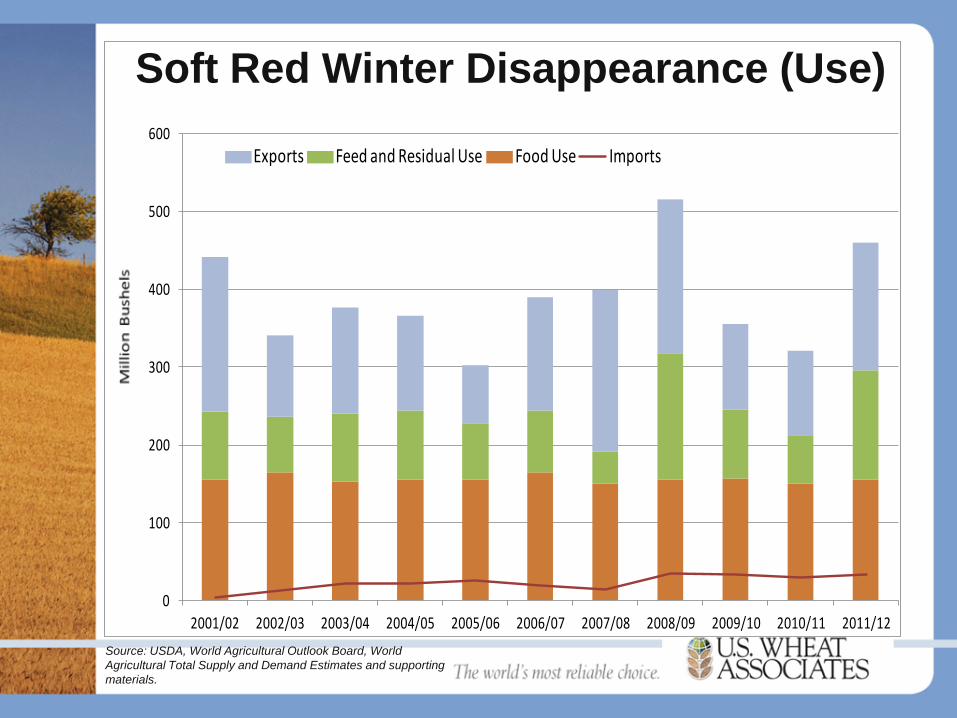
0
100
200
300
400
500
600
2001/02 2002/03 2003/04 2004/05 2005/06 2006/07 2007/08 2008/09 2009/10 2010/11 2011/12
Exports Feed and Residual Use Food Use Imports
Soft Red Winter Disappearance (Use)
Source: USDA, World Agricultural Outlook Board, World
Agricultural Total Supply and Demand Estimates and supporting
materials.
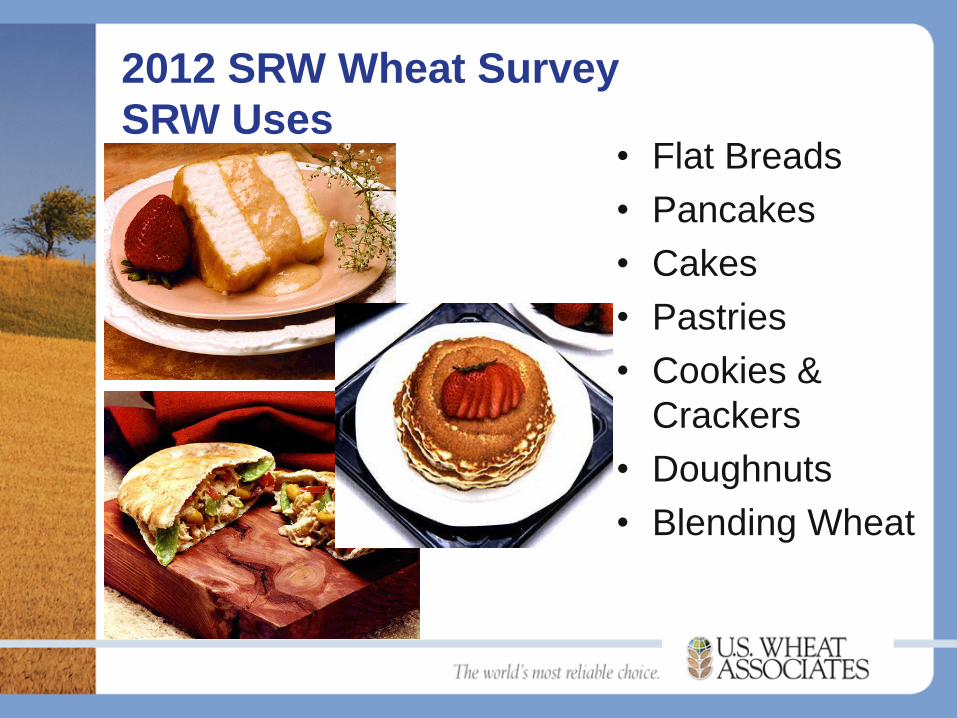
2012 SRW Wheat Survey
SRW Uses • Flat Breads
• Pancakes
• Cakes
• Pastries
• Cookies &
Crackers
• Doughnuts
• Blending Wheat
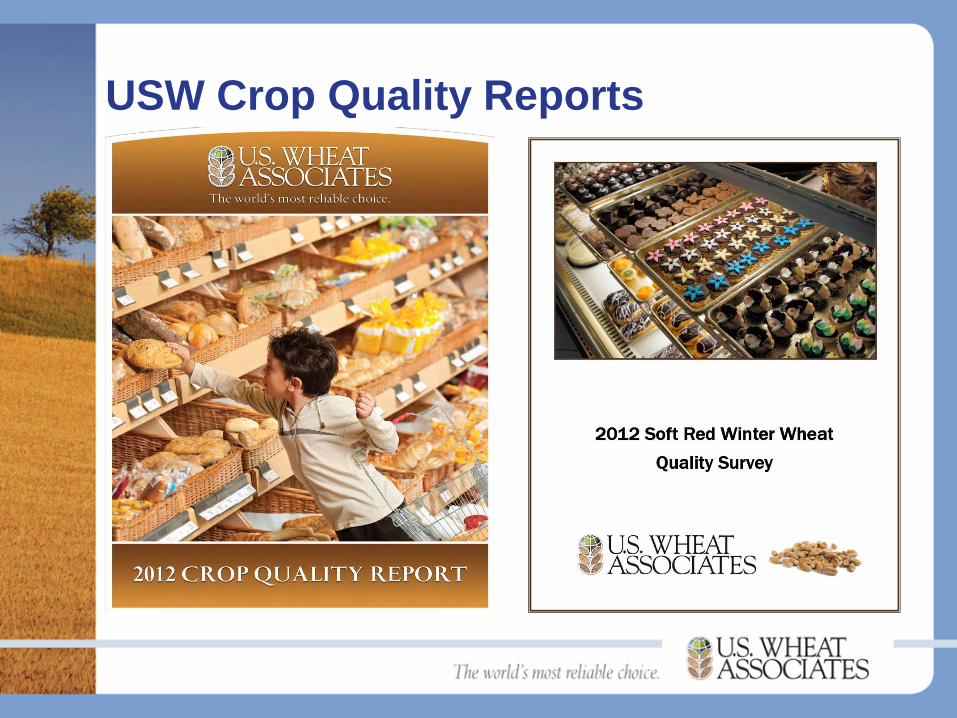
USW Crop Quality Reports
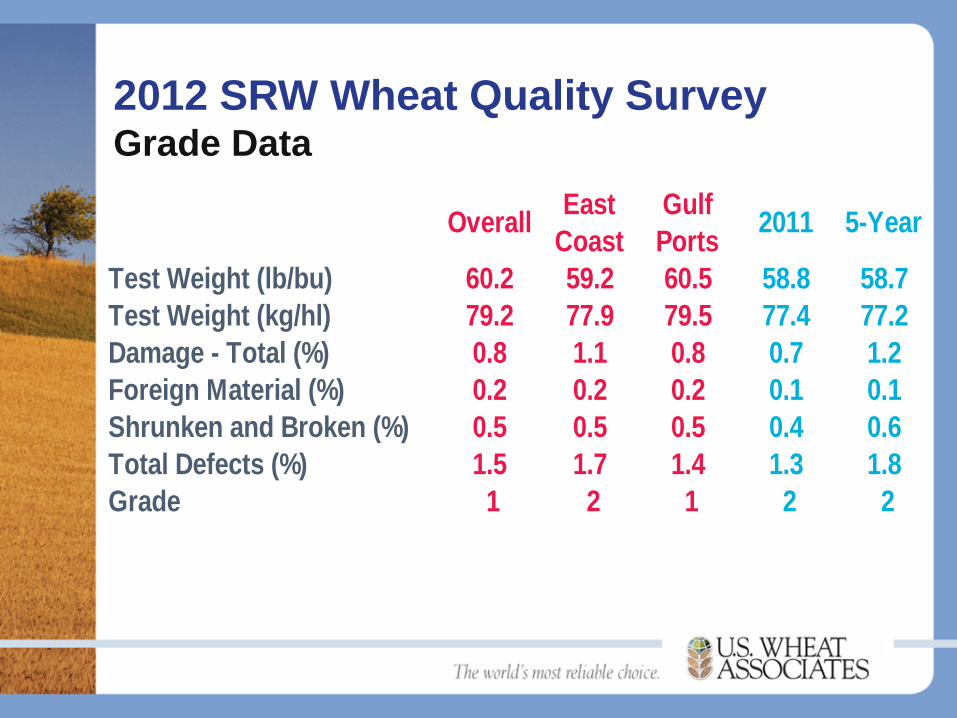
2012 SRW Wheat Quality Survey Grade Data
OverallEast
Coast
Gulf
Ports2011 5-Year
Test Weight (lb/bu) 60.2 59.2 60.5 58.8 58.7
Test Weight (kg/hl) 79.2 77.9 79.5 77.4 77.2
Damage - Total (%) 0.8 1.1 0.8 0.7 1.2
Foreign Material (%) 0.2 0.2 0.2 0.1 0.1
Shrunken and Broken (%) 0.5 0.5 0.5 0.4 0.6
Total Defects (%) 1.5 1.7 1.4 1.3 1.8
Grade 1 2 1 2 2
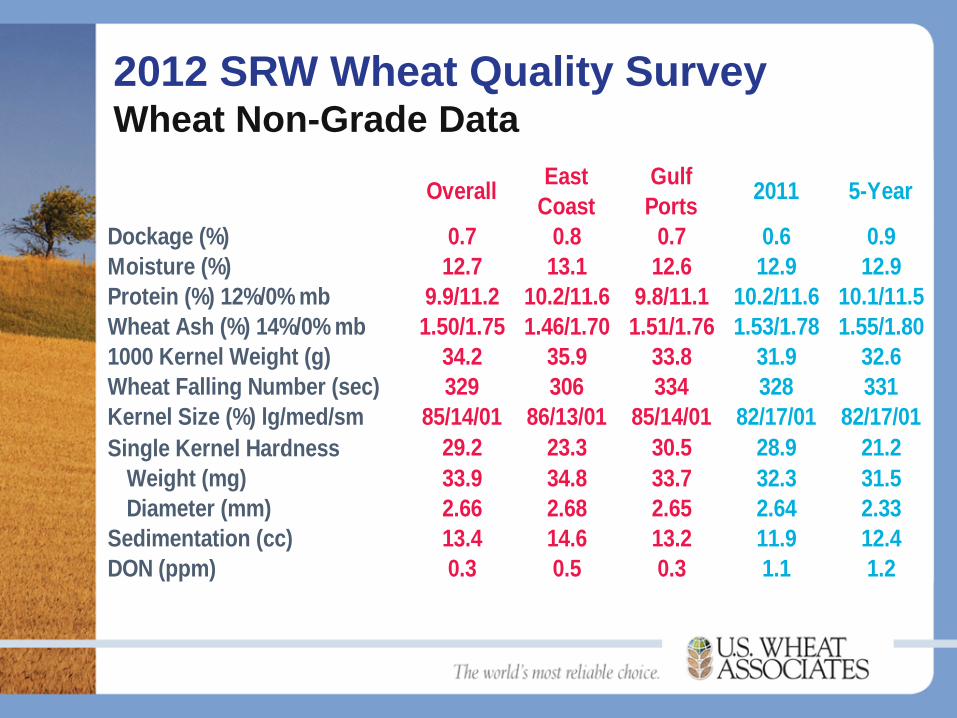
2012 SRW Wheat Quality Survey Wheat Non-Grade Data
OverallEast
Coast
Gulf
Ports2011 5-Year
Dockage (%) 0.7 0.8 0.7 0.6 0.9
Moisture (%) 12.7 13.1 12.6 12.9 12.9
Protein (%) 12%/0% mb 9.9/11.2 10.2/11.6 9.8/11.1 10.2/11.6 10.1/11.5
Wheat Ash (%) 14%/0% mb 1.50/1.75 1.46/1.70 1.51/1.76 1.53/1.78 1.55/1.80
1000 Kernel Weight (g) 34.2 35.9 33.8 31.9 32.6
Wheat Falling Number (sec) 329 306 334 328 331
Kernel Size (%) lg/med/sm 85/14/01 86/13/01 85/14/01 82/17/01 82/17/01
Single Kernel Hardness 29.2 23.3 30.5 28.9 21.2
Weight (mg) 33.9 34.8 33.7 32.3 31.5
Diameter (mm) 2.66 2.68 2.65 2.64 2.33
Sedimentation (cc) 13.4 14.6 13.2 11.9 12.4
DON (ppm) 0.3 0.5 0.3 1.1 1.2
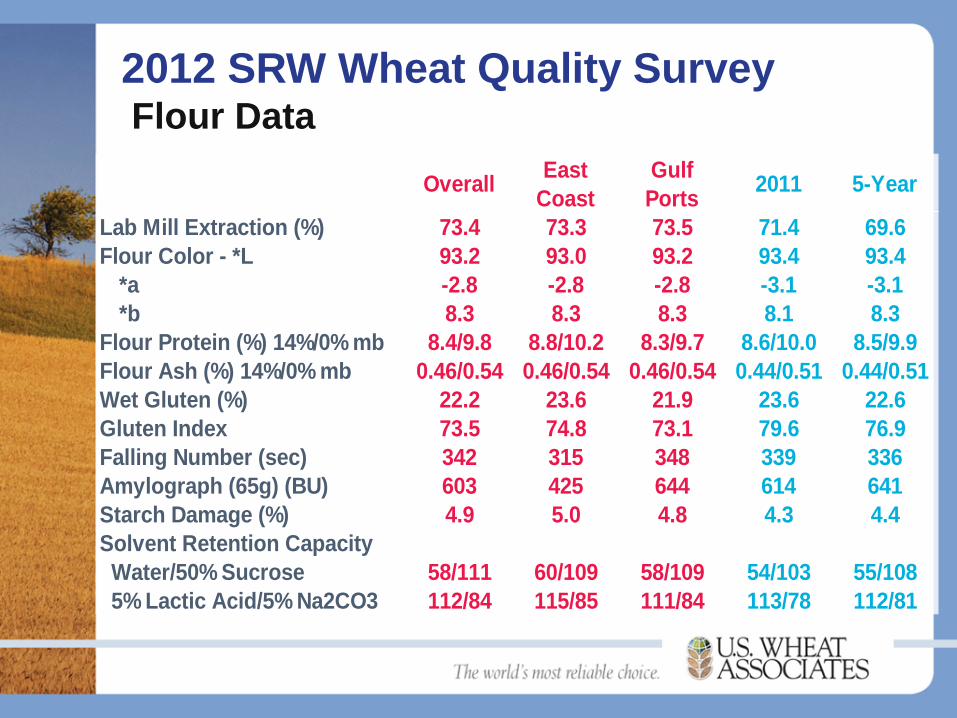
2012 SRW Wheat Quality Survey Flour Data
OverallEast
Coast
Gulf
Ports2011 5-Year
Lab Mill Extraction (%) 73.4 73.3 73.5 71.4 69.6
Flour Color - *L 93.2 93.0 93.2 93.4 93.4
*a -2.8 -2.8 -2.8 -3.1 -3.1
*b 8.3 8.3 8.3 8.1 8.3
Flour Protein (%) 14%/0% mb 8.4/9.8 8.8/10.2 8.3/9.7 8.6/10.0 8.5/9.9
Flour Ash (%) 14%/0% mb 0.46/0.54 0.46/0.54 0.46/0.54 0.44/0.51 0.44/0.51
Wet Gluten (%) 22.2 23.6 21.9 23.6 22.6
Gluten Index 73.5 74.8 73.1 79.6 76.9
Falling Number (sec) 342 315 348 339 336
Amylograph (65g) (BU) 603 425 644 614 641
Starch Damage (%) 4.9 5.0 4.8 4.3 4.4
Solvent Retention Capacity
Water/50% Sucrose 58/111 60/109 58/109 54/103 55/108
5% Lactic Acid/5% Na2CO3 112/84 115/85 111/84 113/78 112/81
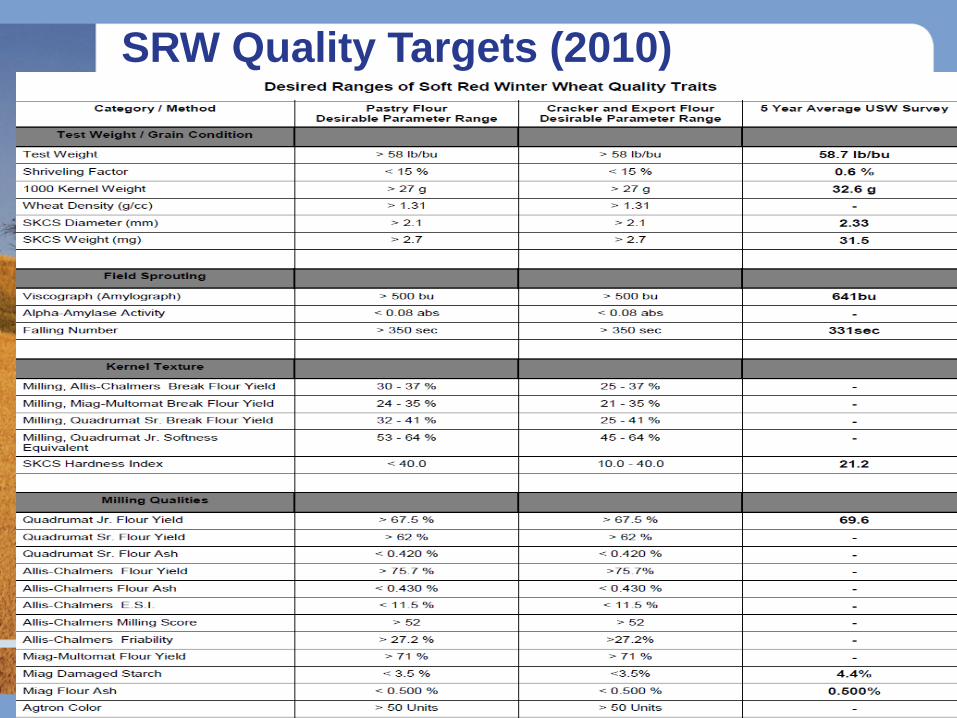
SRW Quality Targets (2010)
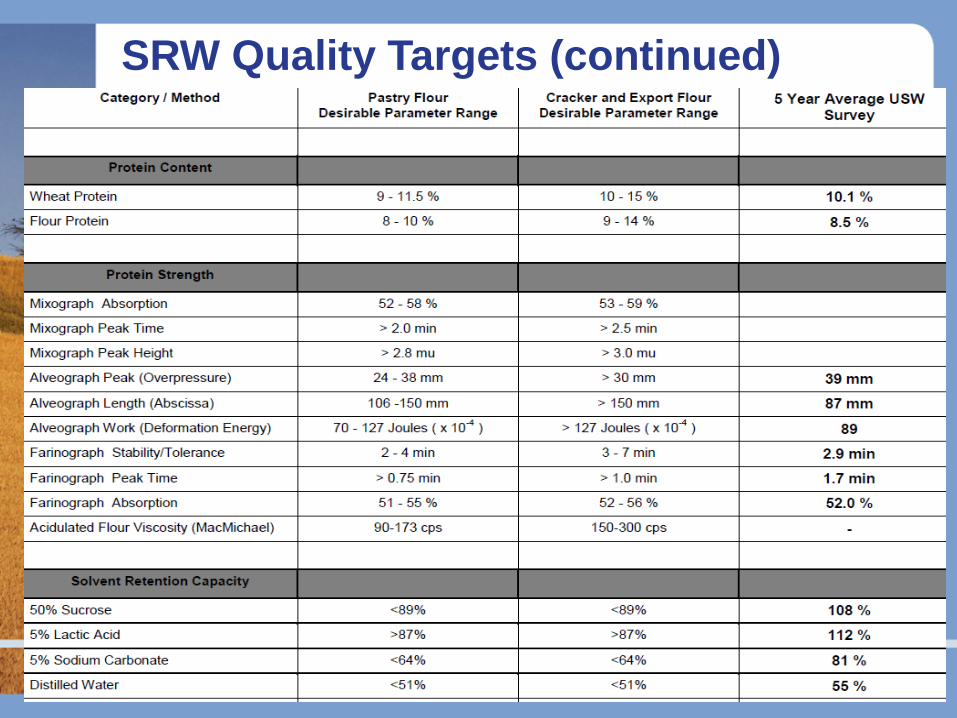
SRW Quality Targets (continued)
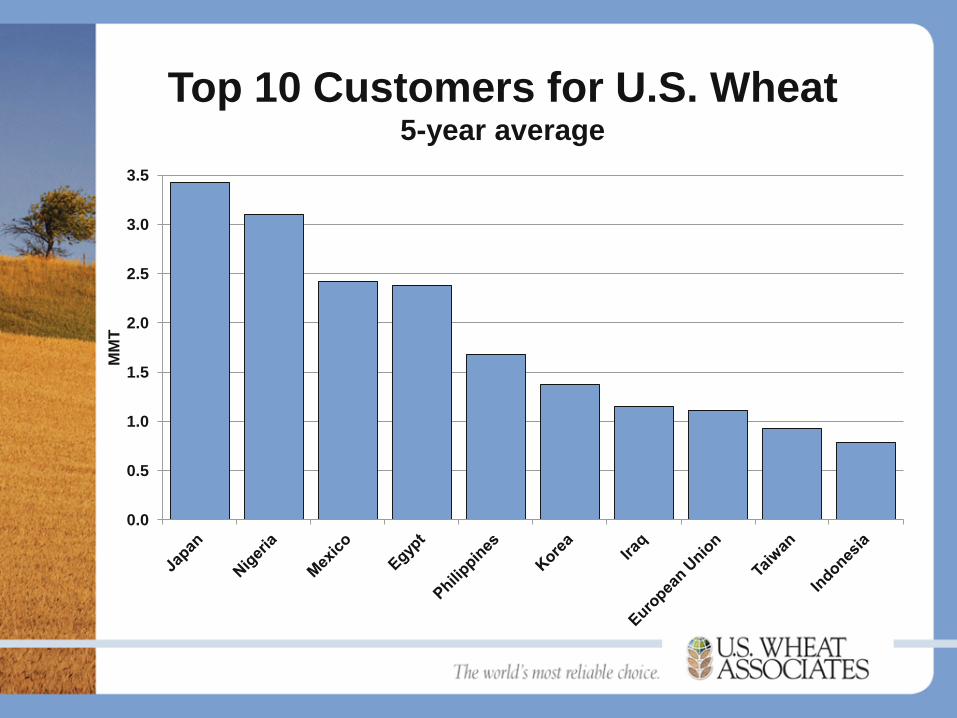
Top 10 Customers for U.S. Wheat 5-year average
0.0
0.5
1.0
1.5
2.0
2.5
3.0
3.5
MM
T
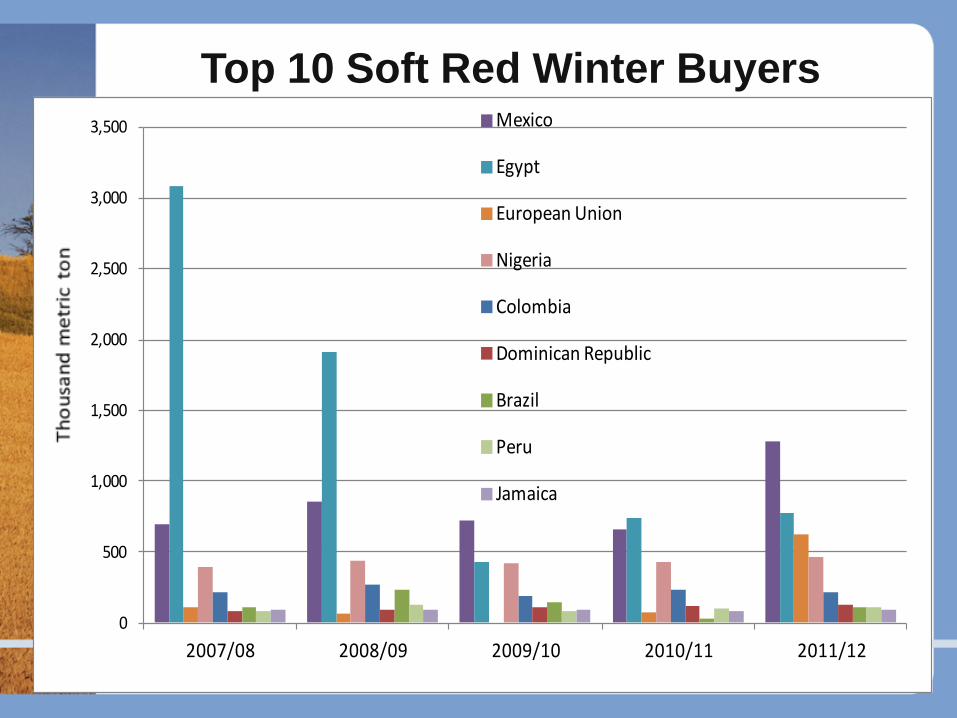
Top 10 Soft Red Winter Buyers
0
500
1,000
1,500
2,000
2,500
3,000
3,500
2007/08 2008/09 2009/10 2010/11 2011/12
Mexico
Egypt
European Union
Nigeria
Colombia
Dominican Republic
Brazil
Peru
Jamaica
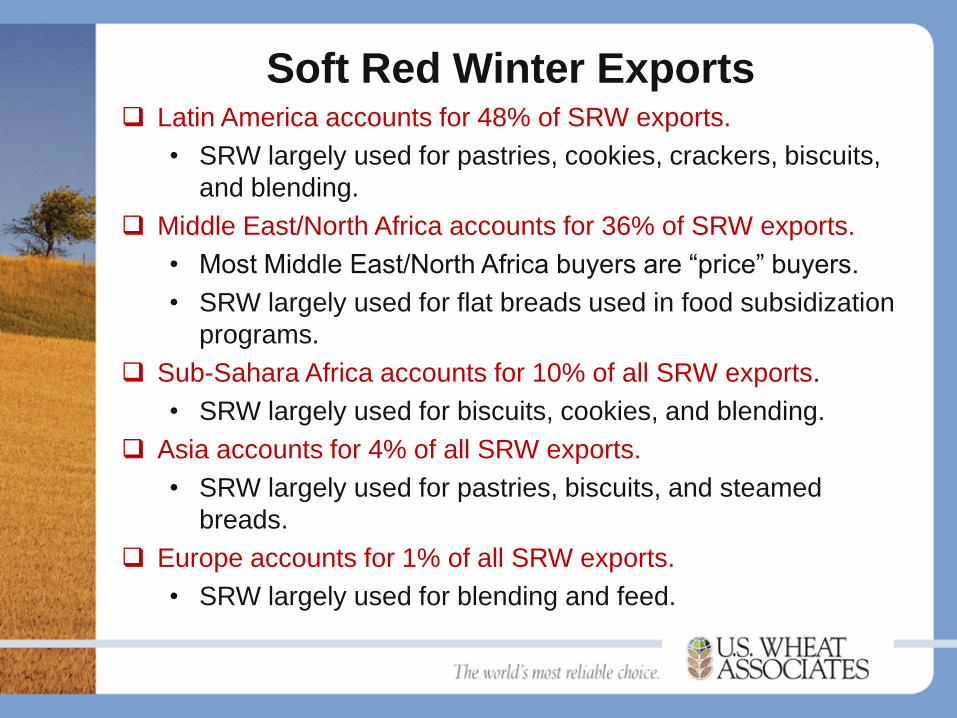
Soft Red Winter Exports Latin America accounts for 48% of SRW exports.
• SRW largely used for pastries, cookies, crackers, biscuits,
and blending.
Middle East/North Africa accounts for 36% of SRW exports.
• Most Middle East/North Africa buyers are “price” buyers.
• SRW largely used for flat breads used in food subsidization
programs.
Sub-Sahara Africa accounts for 10% of all SRW exports.
• SRW largely used for biscuits, cookies, and blending.
Asia accounts for 4% of all SRW exports.
• SRW largely used for pastries, biscuits, and steamed
breads.
Europe accounts for 1% of all SRW exports.
• SRW largely used for blending and feed.
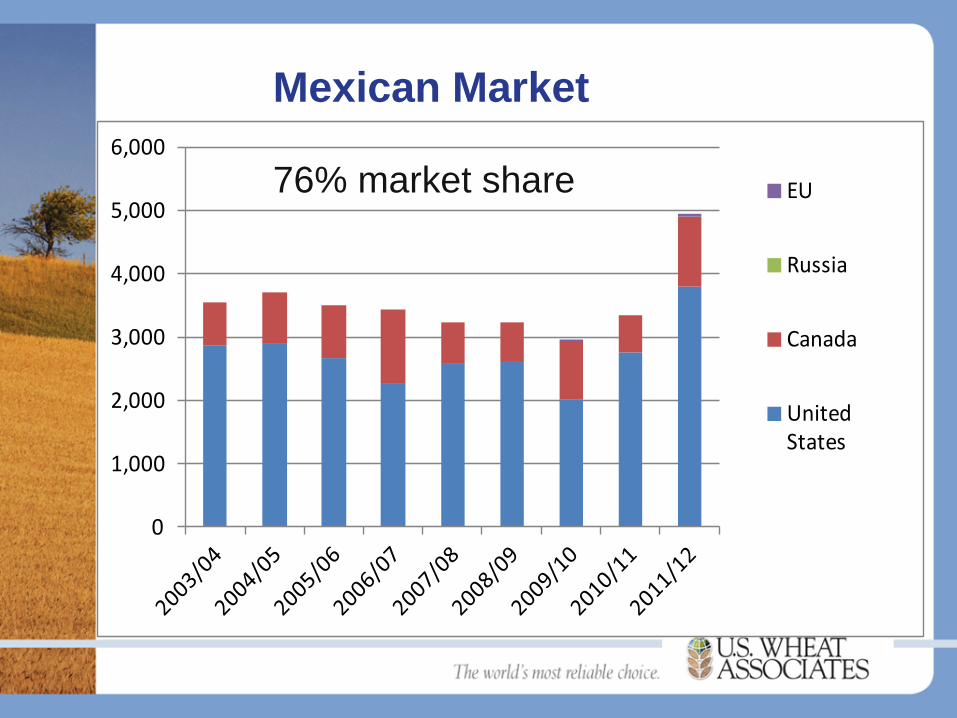
0
1,000
2,000
3,000
4,000
5,000
6,000
EU
Russia
Canada
United States
Mexican Market
76% market share
0
500
1,000
1,500
2,000
2,500
3,000
3,500
4,000
4,500
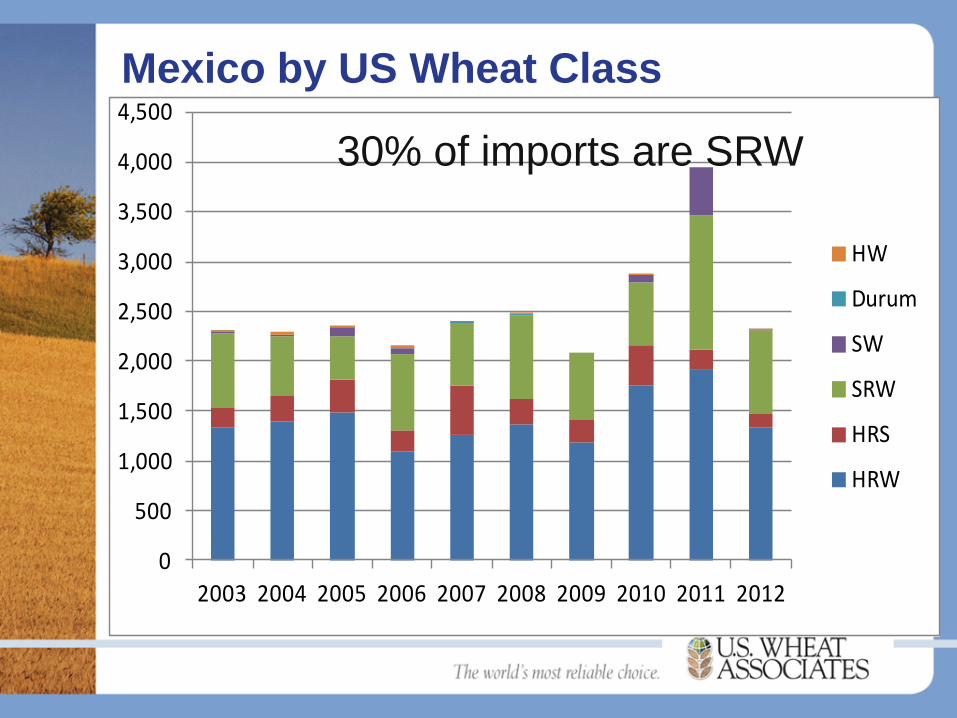
2003 2004 2005 2006 2007 2008 2009 2010 2011 2012
HW
Durum
SW
SRW
HRS
HRW
Mexico by US Wheat Class
30% of imports are SRW
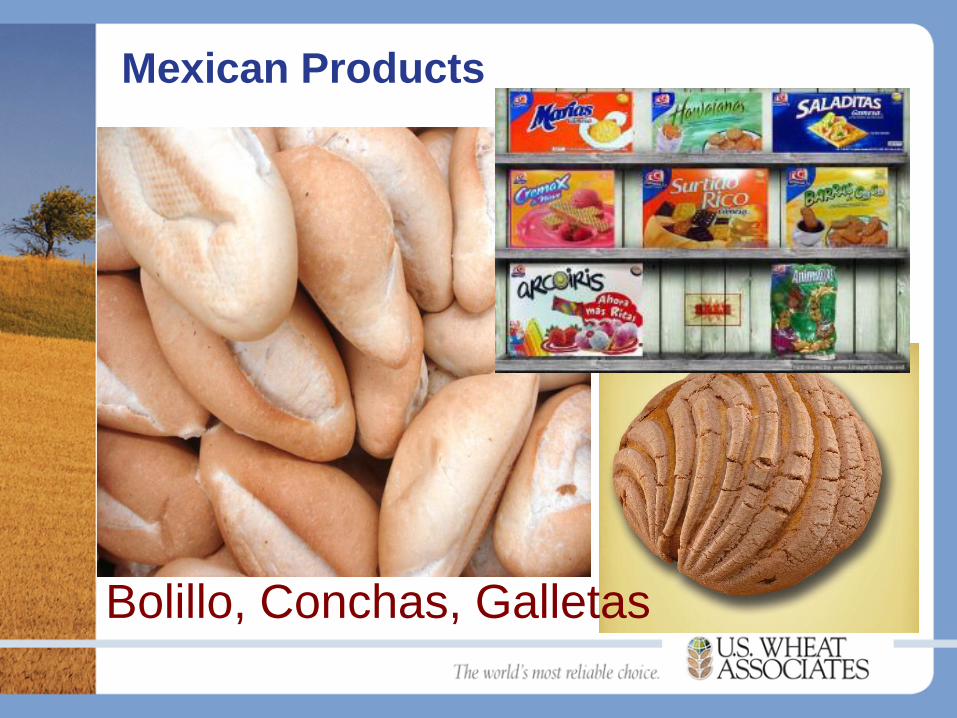
Mexican Products
Bolillo, Conchas, Galletas
0
2000
4000
6000
8000
10000
12000
14000
Uruguay
Turkey
Brazil
Canada
Argentina
Australia
EU
United States
Ukraine
Kazakhstan
Russia
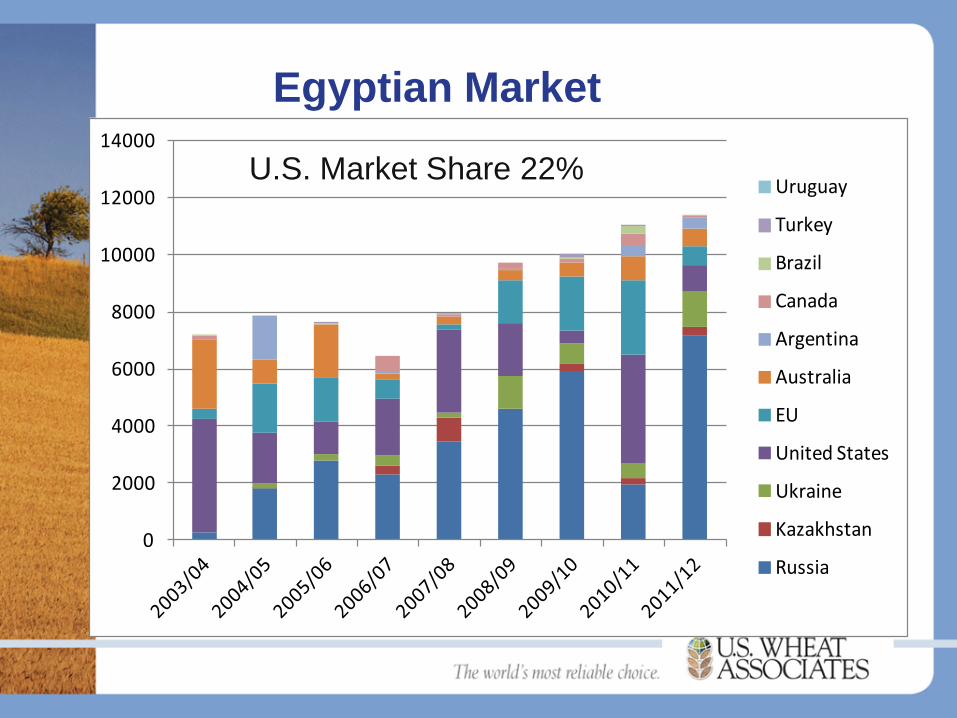
Egyptian Market
U.S. Market Share 22%
0.00
500.00
1,000.00
1,500.00
2,000.00
2,500.00
3,000.00
3,500.00
4,000.00
4,500.00
White
HRS
SRW
HRW
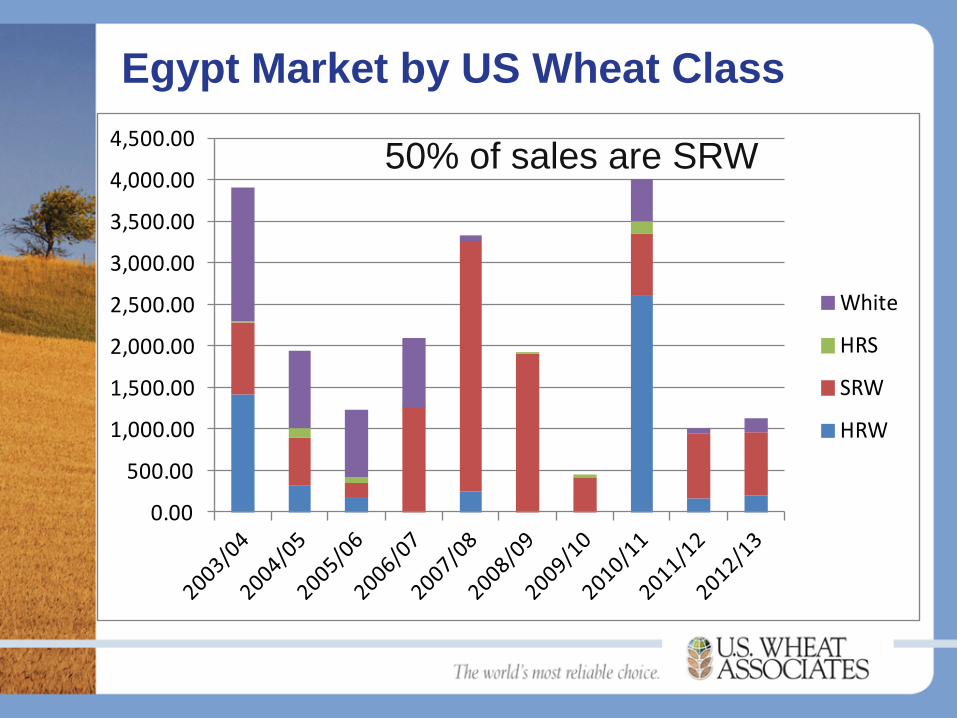
Egypt Market by US Wheat Class
50% of sales are SRW
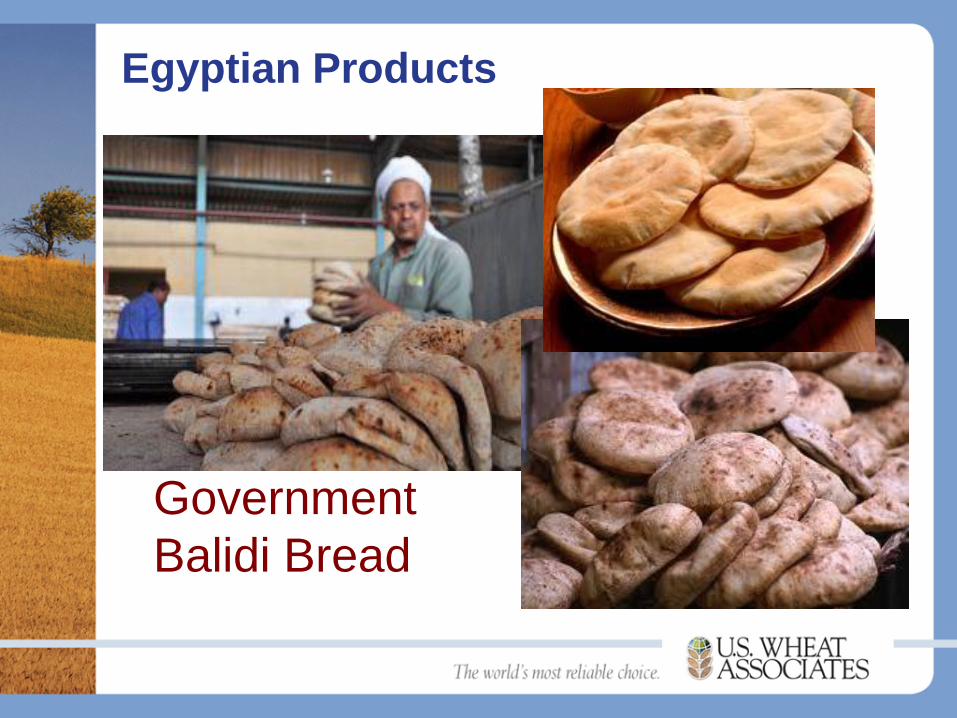
Egyptian Products
Government
Balidi Bread
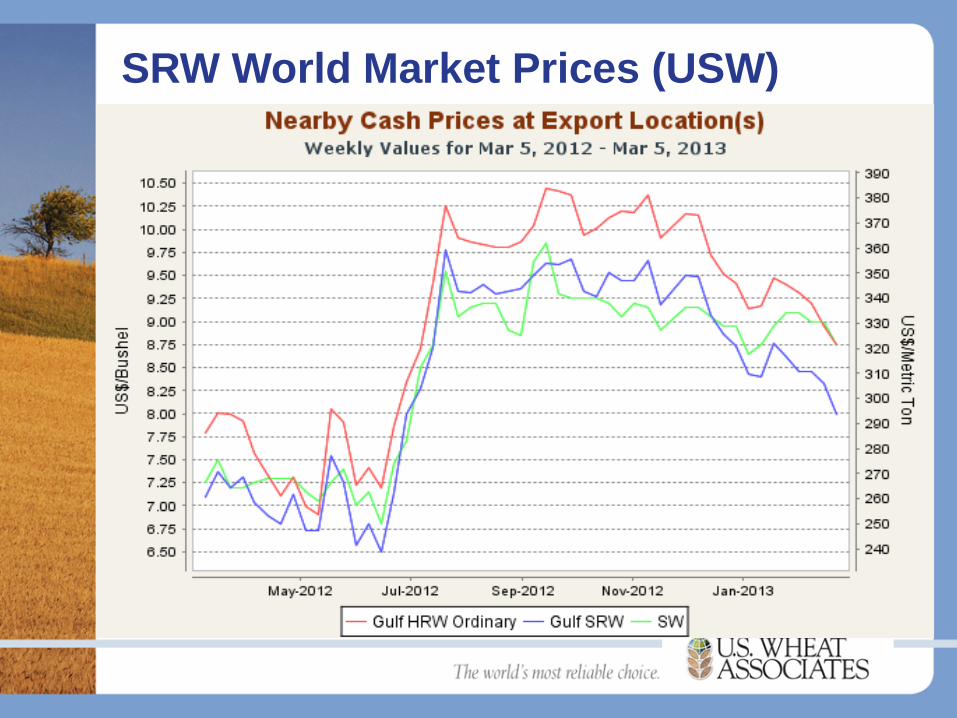
SRW World Market Prices (USW)
USW Resources
• Price Reports:
http://www.uswheat.org/reports/prices
• Wheat Letter:
http://www.uswheat.org/newsEvents/wheatLetter
• USW Home Page:
http://www.uswheat.org
• Email:
Thank You For Your
Support