Soft-Linking a TIMES Model and Sectoral Simulation Model for Individual Policy Measures
23
Soft-Linking a TIMES Model and Sectoral Simulation Model for Individual Policy Measures Eamonn Mulholland, Fionn Rogan, Alessandro Chiodi, Brian Ó Gallachóir UN City Copenhagen | IEA-ETSAP Meeting 2014 18 th Sept ‘14
-
Upload
iea-etsap -
Category
Data & Analytics
-
view
170 -
download
0
Transcript of Soft-Linking a TIMES Model and Sectoral Simulation Model for Individual Policy Measures
Soft-Linking a TIMES Model and Sectoral Simulation Model for Individual Policy Measures
Eamonn Mulholland, Fionn Rogan, Alessandro Chiodi, Brian Ó Gallachóir
UN City Copenhagen | IEA-ETSAP Meeting 2014
18th Sept ‘14
Acknowledgements
• Funding – Environmental Protection Agency
• …. Modelling on the shoulder of giants
• Irish TIMES model development – Alessandro Choidi1
• CarSTOCK model development – Hannah Daly2,3
1 Chiodi, A., Gargiulo, M., Rogan, F., Deane, J.P., Lavigne, D., Rout, U.K., Ó Gallachóir, B.P., 2013. Modelling the impacts of challenging 2050 European climate mitigation targets on Ireland’s energy system. Energy Policy 53, 169-189.
2 Daly, H.E. & Ó Gallachóir, B.P. (2011), ‘Modelling private car energy demand using a technological car stock model’, Transportation Research Part D: Transport and Environment 16(2), 93–101.
3 Daly, H.E. & Ó Gallachóir, B.P. (2011), ‘Modelling future private car energy demand in Ireland’, Energy Policy 39, 7815–7824.

Overview
• TIMES provides cost-optimal scenarios and technology pathways
• However, the results in certain sectors may be difficult (or infeasible) to achieve
• Simulation models can provide more detail for these sectors and hence can be used to inform individual policies and measures
• Creating a soft-link between these two models can be used to test and inform possible future policies
• A combination of the Irish TIMES model and a model of the Irish private car fleet (CarSTOCK) is presented
CarSTOCK Model
• The CarSTOCK model is a simulation model of the private car fleet in Ireland projected forwards to 2050
• The model takes inputs of percentage share of car sales and drivers and projects the private car fleet stock and energy on an annual basis to 2050
• Vehicles are disaggregated into a range of variables with given specific energy consumption for each type
• This allows for the calculation of total energy and emissions in the private transport sector

CarSTOCK Model
• The CarSTOCK model provides a higher level of detail of the transport sector than the Irish TIMES model
• Disaggregated by fuel type, engine band and age Variable
name Unit Fuel type Engine band Age 2008 2009 2010 2011 2012 2013 2014 2015 2016 2017 2018 2019 2020
Stock Vehicles Petrol <900cc All
6,563
5,916
5,662
5,497
5,315
5,200
5,066
4,960
4,814
4,659
4,511
4,369
4,229
Stock Vehicles Petrol 900-1200cc All
284,670
261,123
256,807
256,228
254,680
256,137
256,573
258,295
257,795
256,643
255,600
254,725
253,719
Stock Vehicles Petrol 1200-1500cc All
703,671
653,653
655,108
665,800
673,768
689,696
702,940
719,848
730,566
739,275
748,143
757,335
765,969
Stock Vehicles Petrol 1500-1700cc All
278,796
260,627
263,643
270,499
276,335
285,734
294,286
304,739
312,788
320,109
327,638
335,456
343,163
Stock Vehicles Petrol 1700-1900cc All
122,448
112,879
111,850
112,504
112,773
114,496
115,872
117,980
119,163
120,097
121,141
122,322
123,495
Stock Vehicles Petrol 1900-2100cc All
96,959
89,038
87,715
87,732
87,462
88,333
88,947
90,135
90,626
90,946
91,363
91,901
92,450
Stock Vehicles Petrol >2100cc All
40,699
37,462
37,037
37,181
37,208
37,733
38,159
38,848
39,247
39,578
39,957
40,396
40,845
Stock
Million Vehicles Petrol All All 1.53 1.42 1.42 1.44 1.45 1.48 1.50 1.53 1.55 1.57 1.59 1.61 1.62
Variable name Unit Fuel type Engine band Age 2008 2009 2010 2011 2012 2013 2014 2015 2016 2017 2018 2019 2020
Stock Vehicles Petrol <900cc 0
9
10
15
15
15
15
15
15
16
16
16
16
16
Stock Vehicles Petrol <900cc 1
28
33
53
69
72
74
70
68
64
60
58
55
56
Stock Vehicles Petrol <900cc 2
36
51
76
107
125
130
128
123
116
107
101
97
95
Stock Vehicles Petrol <900cc 3
110
59
93
128
161
181
182
179
169
158
147
139
135
Stock Vehicles Petrol <900cc 4
128
133
101
146
183
218
235
234
225
212
199
186
178
Stock Vehicles Petrol <900cc 5
131
149
173
152
198
236
268
282
276
264
249
234
222
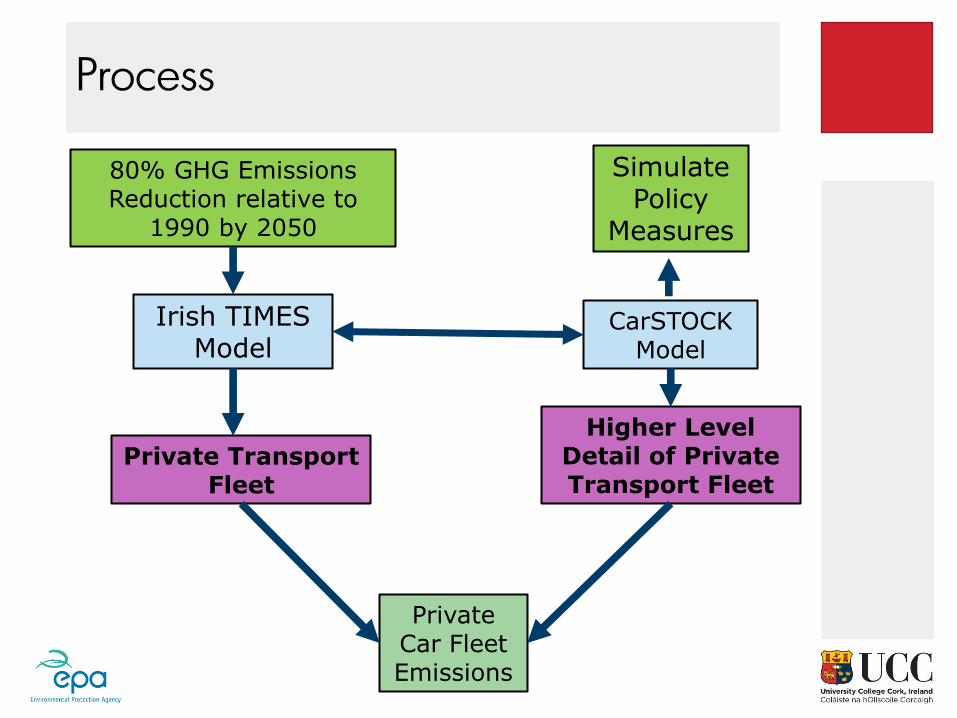
Process
Irish TIMES Model
80% GHG Emissions Reduction relative to
1990 by 2050
Higher Level Detail of Private Transport Fleet
Private Car Fleet Emissions
CarSTOCK Model
Simulate Policy
Measures
Private Transport Fleet

The Low Carbon Roadmap – Irish TIMES Private Transport (80% overall GHG Emissions Reduction by 2050 relative to 1990)
170
0
1000
2000
3000
4000
5000
6000
7000
2008 2010 2015 2020 2025 2030 2035 2040 2045 2050
kt
CO
2
Year
Private Car Fleet Emissions
TIMES 80% GHG Reduction
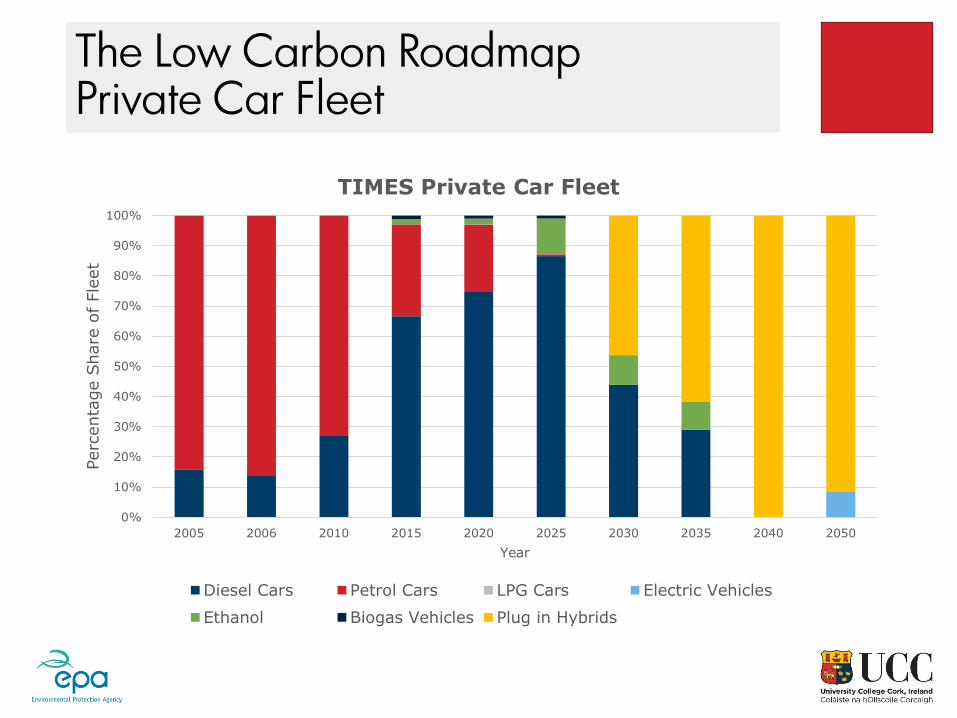
The Low Carbon Roadmap Private Car Fleet
0%
10%
20%
30%
40%
50%
60%
70%
80%
90%
100%
2005 2006 2010 2015 2020 2025 2030 2035 2040 2050
Perc
enta
ge S
hare
of Fle
et
Year
TIMES Private Car Fleet
Diesel Cars Petrol Cars LPG Cars Electric Vehicles
Ethanol Biogas Vehicles Plug in Hybrids

The Efficiency Trend in TIMES
0.0
0.5
1.0
1.5
2.0
2.5
3.0
2010 2020 2030 2040 2050
MJ/
km
Cars
CO2-80

CarSTOCK BaU
170
7,430
0
1000
2000
3000
4000
5000
6000
7000
8000
2008 2010 2015 2020 2025 2030 2035 2040 2045 2050
kt
CO
2
Year
Private Car Fleet Emissions
TIMES 80% GHG Reduction CarSTOCK BaU

BaU Private Car Efficiency
0%
10%
20%
30%
40%
50%
60%
70%
80%
90%
100%
2010 2015 2020 2025 2030 2035 2040 2045 2050
Perc
enta
ge S
hare
of Carb
on B
ands
Year
Carbon Emissions Band
A B C D E F G

More Efficient Vehicles Scenario
0%
10%
20%
30%
40%
50%
60%
70%
80%
90%
100%
2010 2015 2020 2025 2030 2035 2040 2045 2050
Perc
enta
ge S
hare
of Carb
on B
ands
Year
Efficient Carbon Emissions Band
A B C D E F G
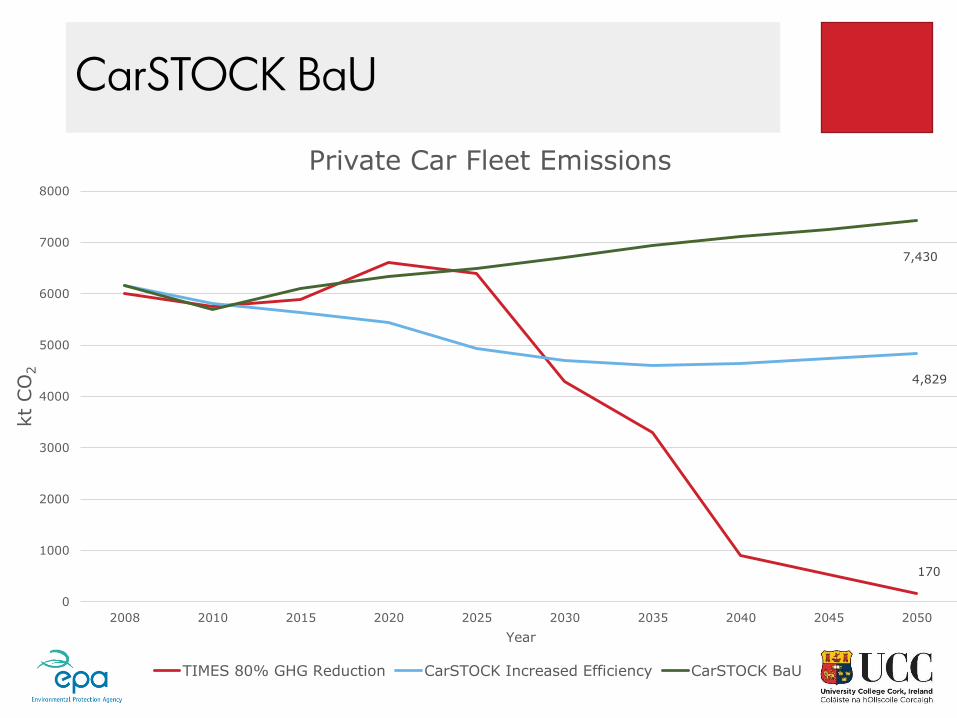
CarSTOCK BaU
170
4,829
7,430
0
1000
2000
3000
4000
5000
6000
7000
8000
2008 2010 2015 2020 2025 2030 2035 2040 2045 2050
kt
CO
2
Year
Private Car Fleet Emissions
TIMES 80% GHG Reduction CarSTOCK Increased Efficiency CarSTOCK BaU
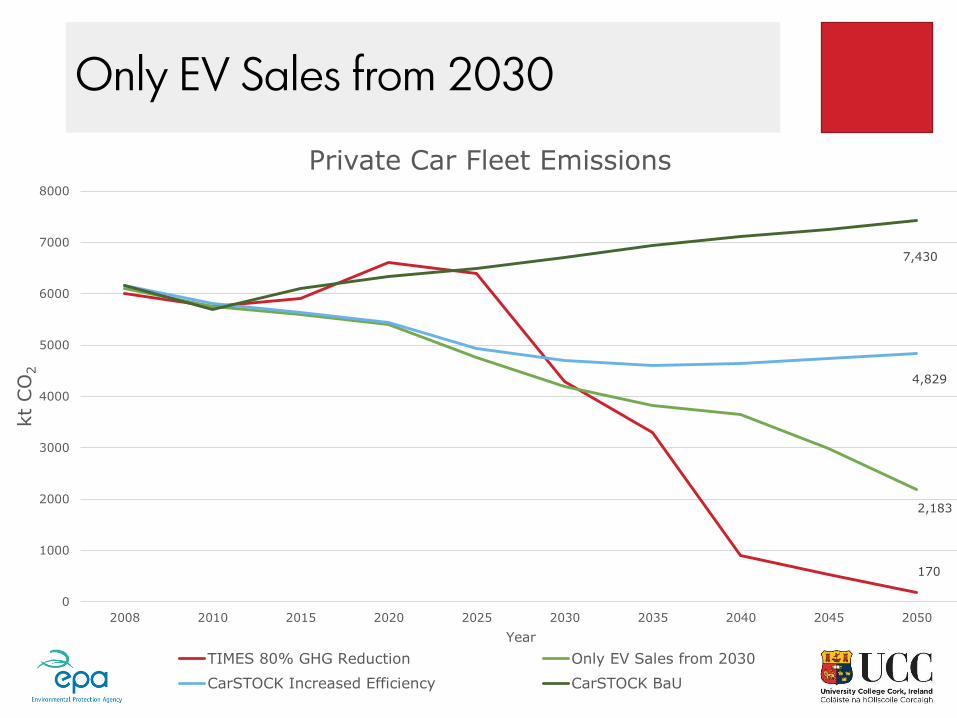
Only EV Sales from 2030
170
2,183
4,829
7,430
0
1000
2000
3000
4000
5000
6000
7000
8000
2008 2010 2015 2020 2025 2030 2035 2040 2045 2050
kt
CO
2
Year
Private Car Fleet Emissions
TIMES 80% GHG Reduction Only EV Sales from 2030
CarSTOCK Increased Efficiency CarSTOCK BaU
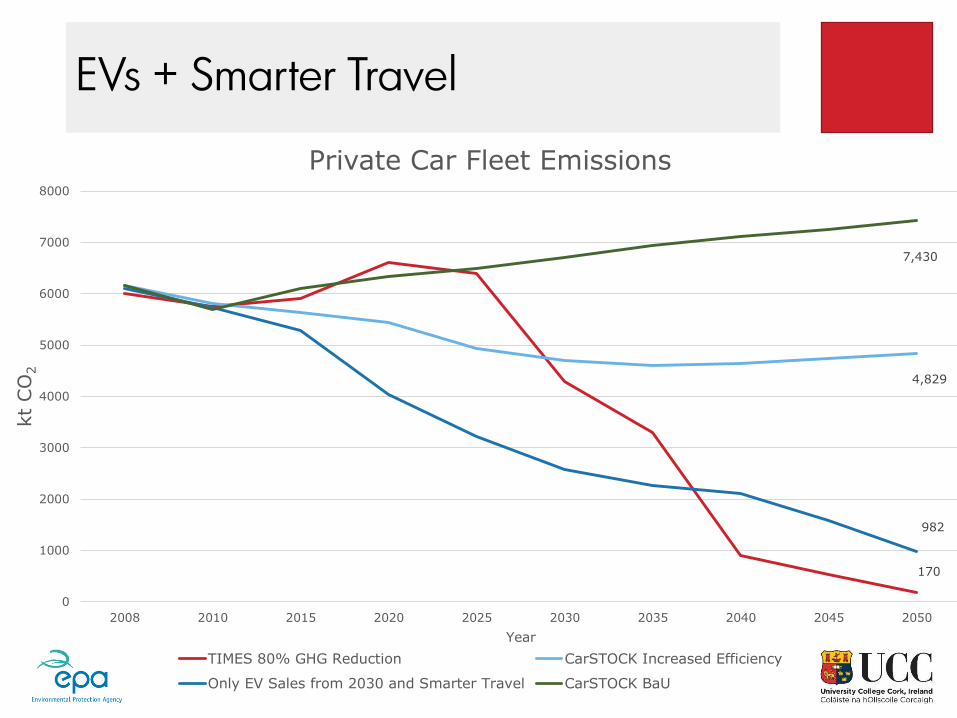
EVs + Smarter Travel
170
4,829
982
7,430
0
1000
2000
3000
4000
5000
6000
7000
8000
2008 2010 2015 2020 2025 2030 2035 2040 2045 2050
kt
CO
2
Year
Private Car Fleet Emissions
TIMES 80% GHG Reduction CarSTOCK Increased Efficiency
Only EV Sales from 2030 and Smarter Travel CarSTOCK BaU

CarSTOCK and TIMES Private Car Fleet Comparison
0%
10%
20%
30%
40%
50%
60%
70%
80%
90%
100%
CarS
TO
CK
Iris
h T
IMES
CarS
TO
CK
Iris
h T
IMES
CarS
TO
CK
Iris
h T
IMES
CarS
TO
CK
Iris
h T
IMES
CarS
TO
CK
Iris
h T
IMES
CarS
TO
CK
Iris
h T
IMES
CarS
TO
CK
Iris
h T
IMES
CarS
TO
CK
Iris
h T
IMES
2010 . 2015 . 2020 . 2025 . 2030 . 2035 . 2040 . 2050
% S
hare
of
Fle
et
Year
CarSTOCK vs. Irish TIMES Car Fleet
Petrol Diesel EV Ethanol

Insights into Individual Policy Measures
• These results can be used to give several insights into individual policy measures:
• Only selling Electric Vehicles from 2030 onwards
• Introduction of incentives to create a shift towards public transport use or for better bicycle infrastructure
• After that, introducing a scrappage scheme may be necessary to meet our 80% GHG reduction by 2050 according to TIMES
• Otherwise it may be required to change the inputs for Irish TIMES.
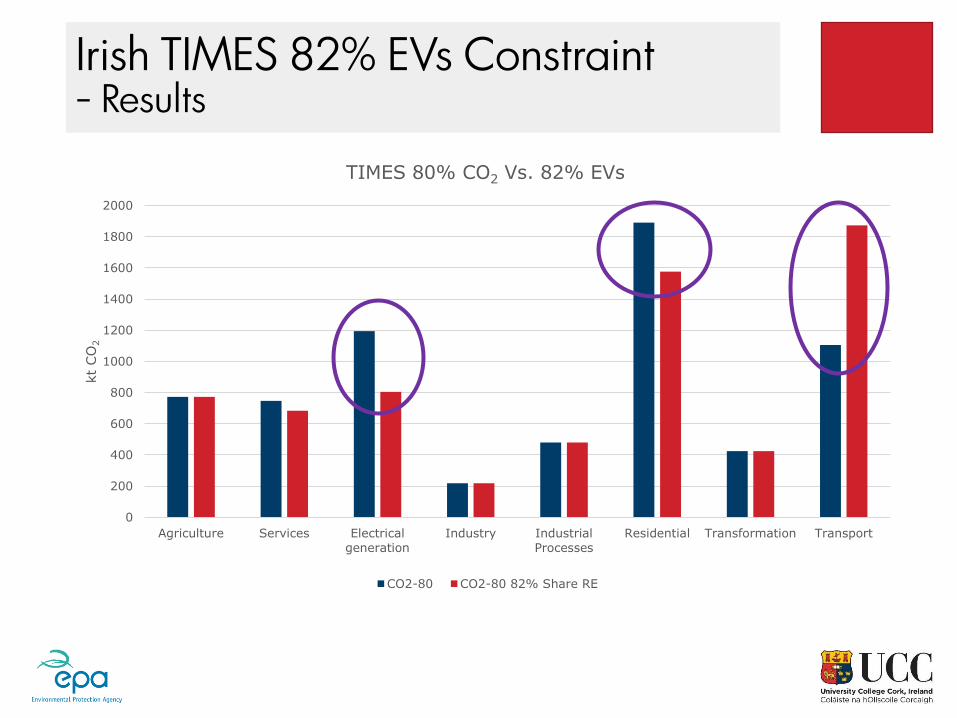
Irish TIMES 82% EVs Constraint - Results
0
200
400
600
800
1000
1200
1400
1600
1800
2000
Agriculture Services Electrical
generation
Industry Industrial
Processes
Residential Transformation Transport
kt
CO
2
TIMES 80% CO2 Vs. 82% EVs
CO2-80 CO2-80 82% Share RE

Conclusion
• Creating a soft-link between a sectoral simulation model with an optimisation model can provide insights into individual policy measures
• It can test a range of possible policies which could inform on the paths to be taken in reaching given targets
• It also creates an iterative methodology whereby the constraints of the optimisation model can be changed according to the sectoral simulation model
• This soft-linking methodology can be used with any sector in order to create effective policies4
4Deane, J.P., Dineen, D., Chiodi, A., Gargiulo, P. Gallagher, Ó Gallachóir, B.P., 2013. The Electrification of Residential Heating in Ireland Using Heat Pumps. Working Paper
Thank You
www.ucc.ie/energypolicy

Survival Rates in CarSTOCK
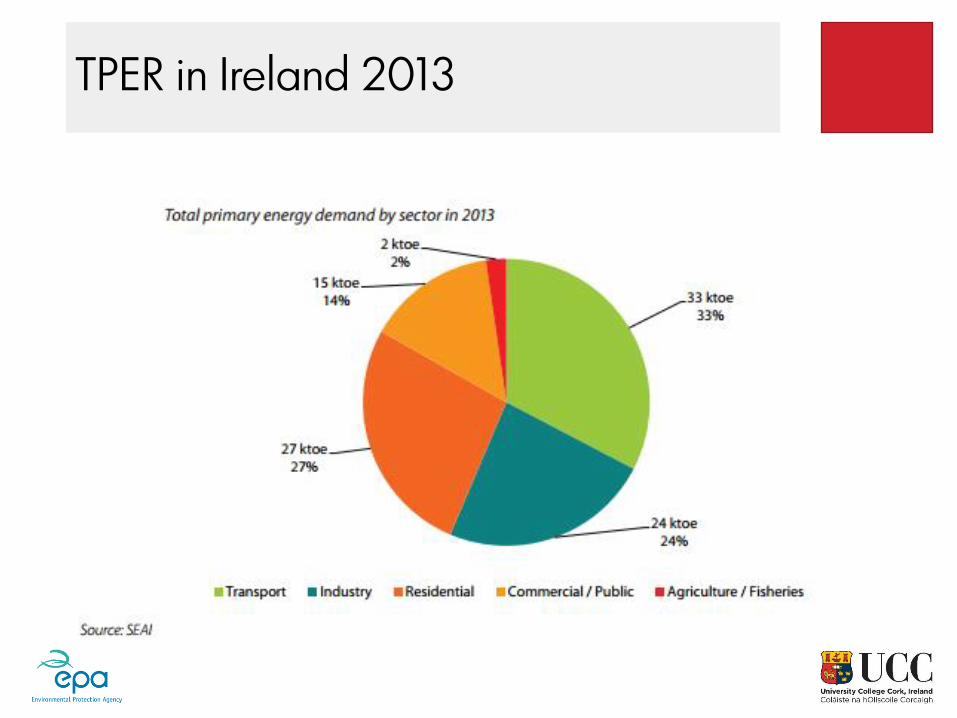
TPER in Ireland 2013

Transport Energy Demand 2013