Soft Handover Performance study in the Direct Sequence ... · PDF fileSoft Handover...
40
1 Soft Handover Performance study in the Direct Sequence WCDMA Radio network Simulator Author: Yang Fang / Communication Laboratory Supervisor: Professor Sven-Gustav Häggman Instructor: PH.D Michael Hall
-
Upload
truongkhuong -
Category
Documents
-
view
227 -
download
2
Transcript of Soft Handover Performance study in the Direct Sequence ... · PDF fileSoft Handover...
1
Soft Handover Performance study in the Direct Sequence WCDMA Radio network Simulator
Author: Yang Fang / Communication Laboratory
Supervisor: Professor Sven-Gustav Häggman Instructor: PH.D Michael Hall

2
Table of Content
• Handover Introduction
• NETSIM Introduction– “NETSIM” Structure and modules Introduction
– Channel Simulator
– Network Simulator
• Soft Handover algorithms Introduction– “Window-average” algorithm
– “Real-time” algorithm
• Simulation result and Performance study
• Drop call trace tool
• Future work

3
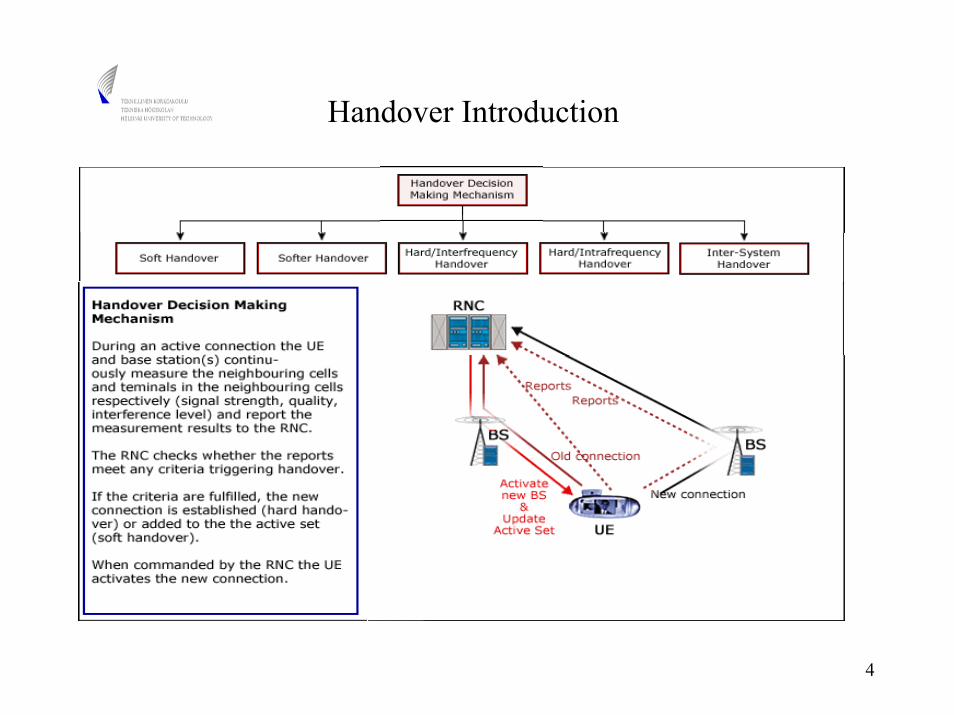
Handover Introduction
4
Handover Introduction

5
Handover Introduction --- Interfrequency Handover

6
Handover Introduction --- Intrafrequency Handover

7
Handover Introduction --- Intersystem Handover

8
Handover Introduction --- Soft Handover

9
Handover Introduction --- Softer Handover

10
NETSIM Introduction

11
NETSIM Introduction
• NETSIM - simulation tool for study of planning methods and control algorithm for WCDMA cellular Radio Network
• Platform: Unix
• Language: C
• NETSIM can simulate: Voice and data service, packet switched traffic, circuit switched traffic, different user behavior,Radio network control functions (HO, Admission, Power Control)
• Simulation result: System capacity as a function of traffic, performance of network control algorithm, etc.

12
NETSIM Structure and Modules --- Structure
Traffic Model
Network Performance Analysis
Network Model
WCDMA Simulation
1. Uplink algorithm;2. Downlink algorithm;3. Access Control4. Admission control;5. Soft handover 6. Power control
Channel Simulator
Net
wor
k S i
mul
ator
NETSIM

13
Channel Simulator of NETSIM
∑−
=
−=1
0)exp()()(
K
kkkk jttath θδ
• Advantage: Model considered as accurate• Disadvantages: Computing intensive (large Memory and long simulation time required)
• Current version using Raytracingmodel
• Impulse response is
Map of simulation environment

14
Network Simulator of NETSIM
Traffic Model Network Model
WCDMA Simulation
1. Uplink algorithm;2. Downlink algorithm;3. Access Control4. Admission control;5. Soft handover 6. Power controlN
etw
ork
S im
ulat
or
Network Performance Analysis

15
NETSIM Structure and Modules --- Modules
Initialization Module
Generation Module
Traffic Module
Mobility Module
Propagation Module
Interference Module
Average Module
Access Module
Admission Module
Active set Module
Quality Module
Power Module
Mobile Station
Radio Channel
Base
Station

16
Soft Handover algorithms Introduction

17
Handover Introduction --- Soft Handover
18
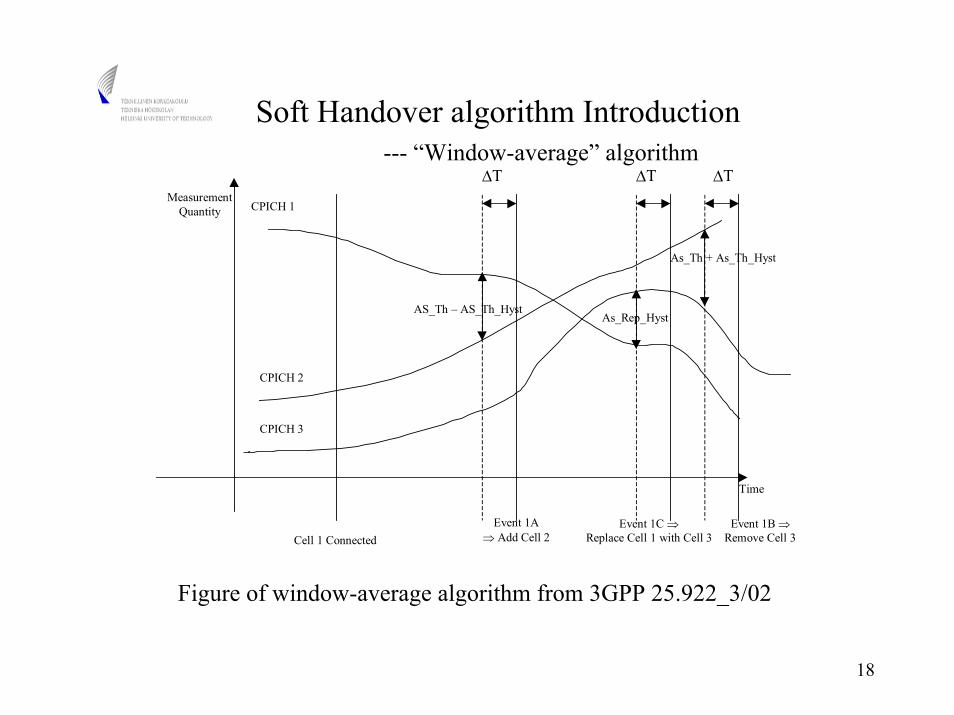
Soft Handover algorithm Introduction--- “Window-average” algorithm
AS_Th – AS_Th_HystAs_Rep_Hyst
As_Th + As_Th_Hyst
Cell 1 ConnectedEvent 1A
⇒ Add Cell 2Event 1C ⇒
Replace Cell 1 with Cell 3Event 1B ⇒
Remove Cell 3
CPICH 1
CPICH 2
CPICH 3
Time
MeasurementQuantity
∆T ∆T ∆T
Figure of window-average algorithm from 3GPP 25.922_3/02

19
M e a s_ S ig n > B e st_ S s– A s_ T h –
a s_ T h _ H y st for a p er iod o f ∆ T
Y e s
N o(E ve n t 1B )
R e m o ve W or st_ B s inth e A ctive S e t
M e a s_ S ig n > B e st_ S s – A s_ T h+ a s_ T h _H y st
for a p er iod o f ∆ T
N o
Y e s(E ve n t 1 A )
A d d B e st_B s in th e A ctiveS e t
B e st_ C a n d _ S s > W or st_ O ld _ S s +A s_ R e p _ H y st
for a p er iod o f ∆ T
Y e s(E ve n t 1 C )
N o
A c tive Se t F u ll
N oY e s
A d d B e st B S in A c tiveS e t a n d R e m ove W or stB s fr om th A c tive S et
B e g in
Soft Handover algorithm Introduction--- “Window-average” algorithm flow chart
Flow chart of window-average algorithm from 3GPP 25.922_3/02

20
Parameters for “Window-average” algorithm
Parameters:
• AS_Th Threshold of Marco-diversity gain in “Window-average” algorithm• AS_Th_hyst Hysteresis of AS_Th• AS_Rep_hyst Replacing Hysteresis in “Window-average” algorithm• HO_Add_time Evaluating window size to add candidate to active set list• HO_Drop_time Evaluating window size to drop one from active set list

21
Soft Handover algorithm Introduction--- “Real-time” algorithm
• Always connect to the cells with better or best signal quality
• Swap the cells in the active set frequently
• Response quickly to the change of the communication channel
• No window to evaluate the receiving signal
• Soft handover gain is fixed (equal to the Marco-diversity gain)
22
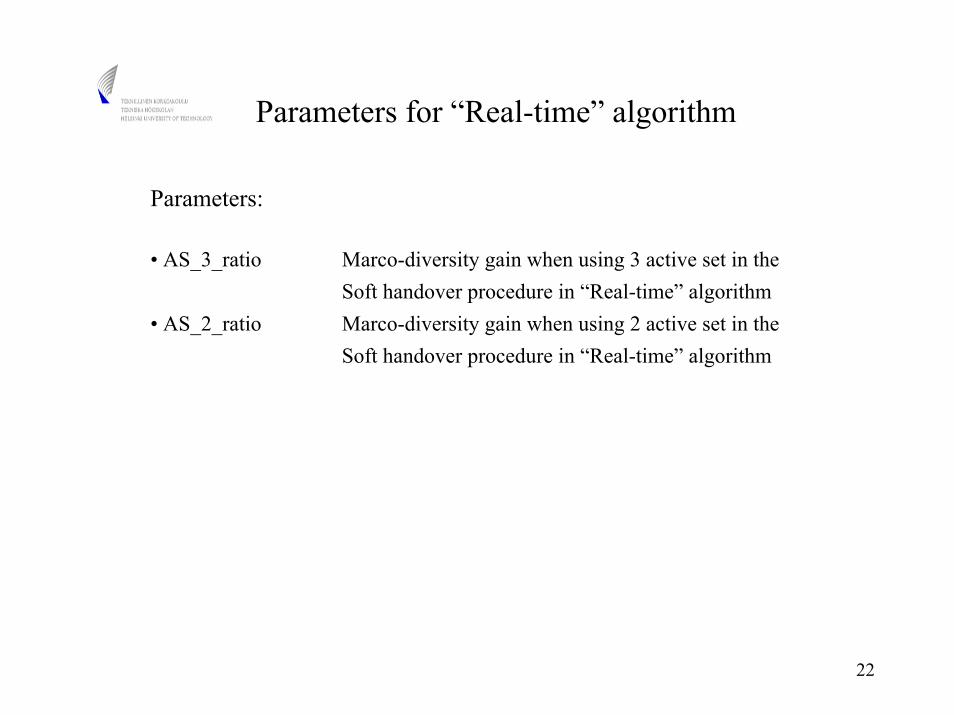
Parameters for “Real-time” algorithm
Parameters:
• AS_3_ratio Marco-diversity gain when using 3 active set in the Soft handover procedure in “Real-time” algorithm
• AS_2_ratio Marco-diversity gain when using 2 active set in the Soft handover procedure in “Real-time” algorithm

23
Simulation result and Performance study

24
Performance study for different algorithms--- “Window-average” algorithm (1-1)
AS active Threshold 3.98(equal to 6 dB)
AS active Threshold Hysteresis 1.58(equal to 2 dB)
AS active Replacement Threshold Hysteresis 3.98(equal to 6 dB)
AS active Handover add window size 0.5(second)
AS active Handover drop window size 0.5(second)
Group 1 Parameters set

25
Performance study for different algorithms--- “Window-average” algorithm (1-2)
Successful call vs. drop call(Window size = 0.5 s, AS_Th = 6 dB, AS_Rep_Th = 6dB)
79.50% 79.19%
20.50% 20.81%
0.00%
10.00%
20.00%
30.00%
40.00%
50.00%
60.00%
70.00%
80.00%
90.00%
100.00%
AS=3 AS=2
Maximum active set size
Perc
enta
ge (%
)
Calls ended normallyNr. of quality fail calls
Percentage of acting different radio links in the SHO procedure(Window size = 0.5 s, AS_TH = 6 dB, As_Rep_Th = 6 dB)
0.03%1.75% 0.83%
98.23% 99.17%
0.00%
10.00%
20.00%
30.00%
40.00%
50.00%
60.00%
70.00%
80.00%
90.00%
100.00%
AS=3 AS=2
Maximum active set size
Perc
enta
ge(%
) Acting 3 radio link case in thissimulation loopActing 2 radio link case in thissimulation loopActing 1 radio link case in thissimulation loop
Simulation result of parameter set group1

26
Performance study for different algorithms--- “Window-average” algorithm (2-1)
AS active Threshold 2.512(equal to 4 dB)
AS active Threshold Hysteresis 1.58(equal to 2 dB)
AS active Replacement Threshold Hysteresis 2.512(equal to 4 dB)
AS active Handover add window size 0.5(second)
AS active Handover drop window size 0.5(second)
Group 2 Parameters set

27
Performance study for different algorithms--- “Window-average” algorithm (2-2)
Successful call vs. Drop call(Window size = 0.5 s, AS_Th = 4 dB, AS_Rep_Th = 4 dB )
79.22% 81.65%
20.78% 18.35%
0.00%
10.00%
20.00%
30.00%
40.00%
50.00%
60.00%
70.00%
80.00%
90.00%
100.00%
AS=3 AS=2
Maximum Active set size
Perc
enta
ge (%
)
Calls ended normallyNr. quality failures ul
Percentage of acting different radio links case in SHO procedure(Window size = 0.5 s, AS_Th = 4 dB,AS_Rep_Th = 4 dB)
0.01%0.69% 1.03%
99.31% 98.97%
0.00%
10.00%
20.00%
30.00%
40.00%
50.00%
60.00%
70.00%
80.00%
90.00%
100.00%
AS=3 AS=2
Maximum Active Set size
Perc
enta
ge (%
) Acting 3 radio link case in thissimulation loopActing 2 radio link case in thissimulation loopActing 1 radio link case in thissimulation loop
Simulation result of parameter set group2

28
Performance study for different algorithms--- “Window-average” algorithm (3-1)
AS active Threshold 2.512(equal to 4 dB)
AS active Threshold Hysteresis 1.58(equal to 2 dB)
AS active Replacement Threshold Hysteresis 2.512(equal to 4 dB)
AS active Handover add window size 0.1(second)
AS active Handover drop window size 0.1(second)
Group 3 Parameters set

29
Performance study for different algorithms--- “Window-average” algorithm (3-2)
Successful calls vs. Drop calls(Window size = 0.1 s AS_Th = 4dB, AS_Rep_Th= 4 dB)
72.83%80.95%
27.17%19.05%
0.00%
10.00%
20.00%
30.00%
40.00%
50.00%
60.00%
70.00%
80.00%
90.00%
AS=3 AS=2
Maximum active set size
Perc
enta
ge (%
)
Calls ended normallyNr. quality failures ul
Percentage of acting different radio links case(Window size = 0.1 s AS_Th = 4dB, AS_Rep_Th= 4 dB)
0.07%1.96% 3.18%
97.97% 96.82%
0.00%
20.00%
40.00%
60.00%
80.00%
100.00%
120.00%
AS=3 AS=2
Maximum active set size
Perc
enta
ge (%
) Acting 3 radio link case in thissimulation loopActing 2 radio link case in thissimulation loopActing 1 radio link case in thissimulation loop
Simulation result of parameter set group3

30
Performance study for different algorithms--- “Window-average” algorithm summary(1)
Comparison table of successful calls and drop calls(Maximum Active set size is 3)
79.50% 79.22%72.83%
20.50% 20.78%27.17%
0.00%
10.00%
20.00%
30.00%
40.00%
50.00%
60.00%
70.00%
80.00%
90.00%
WS = 0.5; As_Th= 6db
WS = 0.5; As_Th= 4db
WS = 0.1; As_Th= 4db
Different Parameters sets
Perc
enta
ge
Calls ended normallyNr. of quality failures
Percentage of acting different radio links case with different parameters sets (Maximum active set size is 3)
0.03% 0.01% 0.07%1.75% 0.69% 1.96%
98.23% 99.31% 97.97%
0.00%
20.00%
40.00%
60.00%
80.00%
100.00%
120.00%
WS = 0.5; As_Th= 6db
WS = 0.5; As_Th= 4db
WS = 0.1; As_Th= 4db
Different parameters sets
Perc
enta
ge
Acting 3 radio link case in thissimulation loopActing 2 radio link case in thissimulation loopActing 1 radio link case in thissimulation loop
Simulation result of different parameter sets of “Window-average algorithm” (AS=3)

31
Performance study for different algorithms--- “Window-average” algorithm summary(2)
Percentage of acting different radio links case with different parameters sets (Maximum active set size is 2)
0.83% 1.03% 3.18%
99.17% 98.97% 96.82%
0.00%
20.00%
40.00%
60.00%
80.00%
100.00%
120.00%
WS = 0.5; As_Th= 6db
WS = 0.5; As_Th= 4db
WS = 0.1; As_Th= 4db
Differnt parameters sets
Perc
enta
ge (%
)
Acting 2 radio link case in thissimulation loopActing 1 radio link case in thissimulation loop
Comparison Table of successful call and drop call (Maximum active set size is 2)
79.19% 81.65% 80.95%
20.81% 18.35% 19.05%
0.00%
10.00%
20.00%
30.00%
40.00%
50.00%
60.00%
70.00%
80.00%
90.00%
WS = 0.5; As_Th= 6db
WS = 0.5; As_Th= 4db
WS = 0.1; As_Th= 4db
Different parameters sets
Perc
ennt
age
(%)
Calls ended normallyNr. of quality failures
Simulation result of different parameter sets of “Window-average algorithm” (AS=2)

32
Performance study for different algorithms--- “Window-average” algorithm summary(3)
Conclusion:
• The performance is a little better when the active set size is 2
• In most time of the call procedure, the communication between the MS and BS only using one radio link
• It’s difficult for find the optimal parameters set for the “Window-average” algorithm, we have to try a lot of parameters sets to get one better solution for the “Window-average” algorithm

33
Performance study for different algorithms--- “Real-time” algorithm simulation result
Successful call rate vs. drop call rate (Real-time algorithm)
99.11% 100.00%
0.89% 0.00%0.00%
10.00%
20.00%
30.00%
40.00%
50.00%
60.00%
70.00%
80.00%
90.00%
100.00%
AS=3 AS=2
Maximum Active set size
perc
enta
ge(%
)
Calls ended normallyNr. of quality fail calls
Percentage of acting radio links in the simulation loop(Real-time algorithm)
4.09%8.62% 11.76%
87.29% 88.24%
0.00%
10.00%
20.00%
30.00%
40.00%
50.00%
60.00%
70.00%
80.00%
90.00%
100.00%
AS=3 AS=2
Maximum active set size
Perc
enta
ge(%
) Acting 3 radio link case in thissimulation loopActing 2 radio link case in thissimulation loopActing 1 radio link case in thissimulation loop
Simulation result of “Real-time” algorithm

34
Performance study for different algorithms--- “comparison between two algorithms
Conclusion:
• The “Real-time” algorithm is better than “Window-average” algorithm
• The “Real-time” algorithm always adopt the better channel for the conversation. But the “window-average” algorithm need some average window to adopt the optimal link

35
Drop call trace tool

36
Drop call Trace tool--- Network drop call situation in Time 510
Relatioinship between Base Station SIR and Drop call
0 0 0 0 0 0 00 0 0 0 0 0 001
2
01
0 0
-10.0525
-8.06245
-11.0327
-3.01484
-8.51664-7.44165
-10.1732-12
-10
-8
-6
-4
-2
0
2
4
The 0Base
station
The 1Base
station
The 2Base
station
The 3Base
station
The 4Base
station
The 5Base
station
The 6Base
station
Base station
Rx
valu
e (d
B)
Val
ue
Dro
p ca
ll N
r.
The drop call in SHO with 3AS The drop call in SHO with 2ASThe drop call in SHO with 1AS The Base station's average SIR
Time:510

37
Relationship between Base Station and Drop call
0 0 0 0 0 0 00 0 0 0 0 0 00 1 20
20 0
-6.78302 -6.90614
-11.7081
-5.74579
-14.02674
-9.8939
-29.3006-35
-30
-25
-20
-15
-10
-5
0
5
The 0Base
station
The 1Base
station
The 2Base
station
The 3Base
station
The 4Base
station
The 5Base
station
The 6Base
station
Base station
Rx
valu
e (d
B)
Val
ue
Drop
cal
l Nr.
The drop call in SHO with 3AS The drop call in SHO with 2ASThe drop call in SHO with 1AS The Base station's average SIR
Time:520
Drop call Trace tool--- Network drop call situation in Time 520

38
Future Work

39
Future work
• More simulations with different parameters set are needed
• The Packet data service performance with different SHO algorithms is need to be investigated
• More drop call trace analysis tool need to be integrated in NETSIM

40
Thank you!
Questions?