SOFIE Spectral Response Mark Hervig, GATS Inc. Drivers: Filter Response Preceding Optics Detector...
37
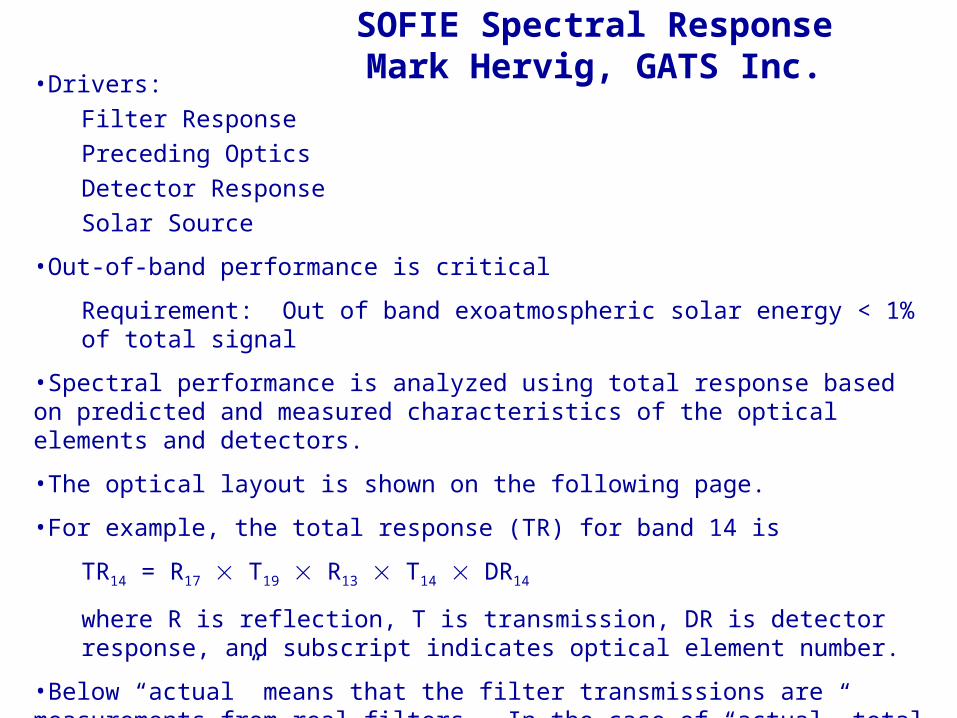
SOFIE Spectral Response Mark Hervig, GATS Inc. •Drivers: Filter Response Preceding Optics Detector Response Solar Source •Out-of-band performance is critical Requirement: Out of band exoatmospheric solar energy < 1% of total signal •Spectral performance is analyzed using total response based on predicted and measured characteristics of the optical elements and detectors. •The optical layout is shown on the following page. •For example, the total response (TR) for band 14 is TR 14 = R 17 T 19 R 13 T 14 DR 14 where R is reflection, T is transmission, DR is detector response, and subscript indicates optical element number. •Below “actual” means that the filter transmissions are measurements from real filters. In the case of “actual” total
-
Upload
cordelia-baldwin -
Category
Documents
-
view
214 -
download
0
Transcript of SOFIE Spectral Response Mark Hervig, GATS Inc. Drivers: Filter Response Preceding Optics Detector...
SOFIE Spectral ResponseMark Hervig, GATS Inc.•Drivers:
Filter Response
Preceding Optics
Detector Response
Solar Source
•Out-of-band performance is critical
Requirement: Out of band exoatmospheric solar energy < 1% of total signal
•Spectral performance is analyzed using total response based on predicted and measured characteristics of the optical elements and detectors.
•The optical layout is shown on the following page.
•For example, the total response (TR) for band 14 is
TR14 = R17 T19 R13 T14 DR14
where R is reflection, T is transmission, DR is detector response, and subscript indicates optical element number.
•Below “actual” means that the filter transmissions are measurements from real filters. In the case of “actual” total response a number of other optical elements could be based on predictions.

Detector Optics
and Detector
OpticalElement #
CollimatedInput Beam
2.577 -2.632
2.427 -2.475
2.907-2.967
2.740 -2.793
3.472 -3.546
3.333 -3.401
3.160 -3.226
3.030 -3.091
4.255 -4.444
4.951 -5.051
4.630 -4.740
5.263 -5.376
0.286 -0.294
0.323 -0.333
0.848 -0.877
1.010 -1.053
Dichroic B S: Reflect UV, NIR;Transmit IR
Dichroic B S: Reflect <2.967Transmit > 3.030
Dichroic B S: Reflect .286-.333;Reflect .848-1.053 & 4.255-5.376: Transmit 2.427-3.546
Metal Mirror
Channel SeparationModule Filter Layoutas ordered April 2004
6 5
8 7
17
18B12
10
9
13
1514
16
11
19
4
2
3
1
Detector at 208K
Detector at 233K
Detector at 260K
SOFIE CSM layout

Notes and Definitions
•Half-power points (HPP) are the wavelengths where the filter bandpass transmission is 50% of the peak transmission value.
•The HPP on the short wavelength side of the bandpass is known as the cuton wavelength, or lower HPP (LHPP). The HPP on the long wavelength side is known as the cutoff wavelength, or upper HPP (UHPP).
•The bandpass is generally defined as the wavelength region between cuton and cutoff.
•Bandpass center is defined as the average of cuton and cutoff wavelengths
•Bandpass (filter) width is given in percent as:
200*(cutoff-cuton)/(cutoff+cuton).
•For the out-of-band (OOB) analysis, the in-band region was defined as the wavelength region 3 filter widths wide centered on the band center wavelength
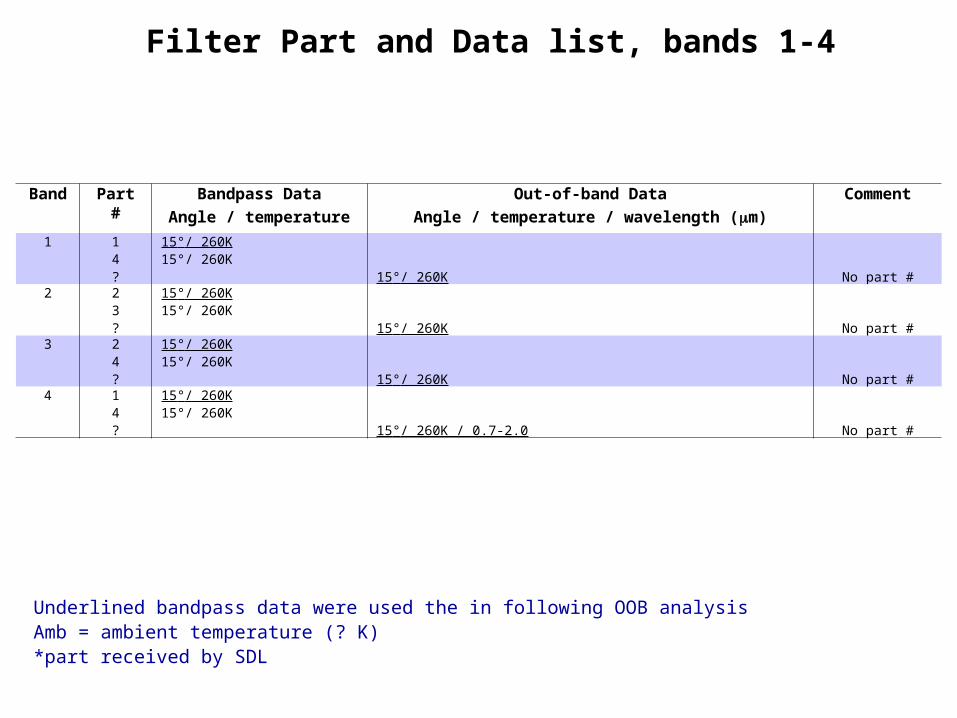
Filter Part and Data list, bands 1-4
Band Part # Bandpass Data
Angle / temperature
Out-of-band Data
Angle / temperature / wavelength (m)
Comment
1 14?
15°/ 260K15°/ 260K
15°/ 260K No part #2 2
3?
15°/ 260K15°/ 260K
15°/ 260K No part #3 2
4?
15°/ 260K15°/ 260K
15°/ 260K No part #4 1
4?
15°/ 260K15°/ 260K
15°/ 260K / 0.7-2.0 No part #
Underlined bandpass data were used the in following OOB analysisAmb = ambient temperature (? K)*part received by SDL
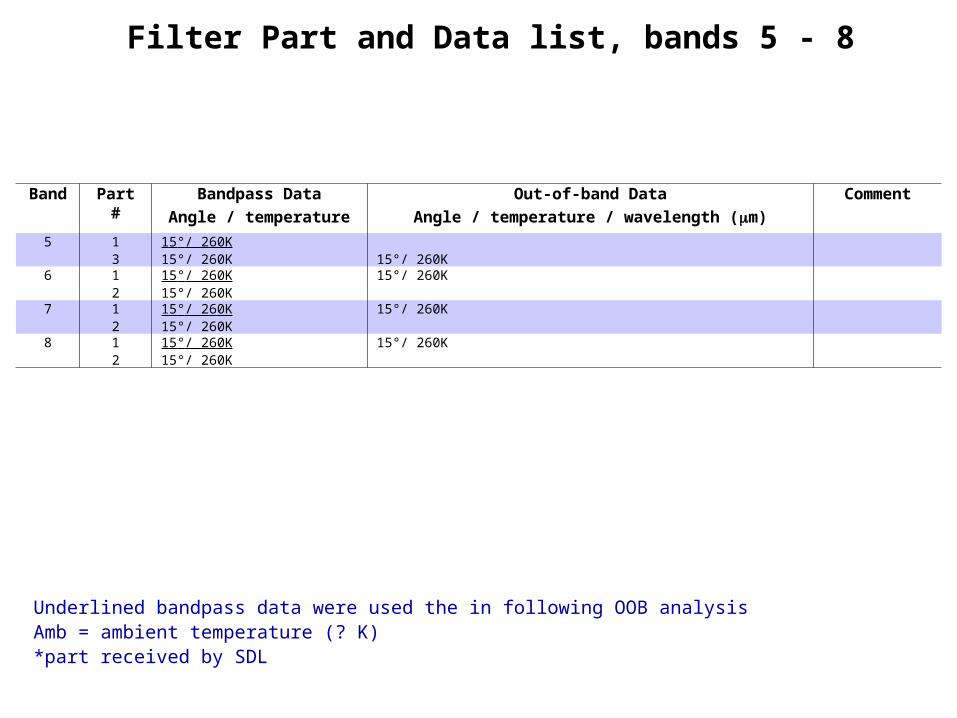
Filter Part and Data list, bands 5 - 8
Band Part # Bandpass Data
Angle / temperature
Out-of-band Data
Angle / temperature / wavelength (m)
Comment
5 13
15°/ 260K15°/ 260K 15°/ 260K
6 12
15°/ 260K15°/ 260K
15°/ 260K
7 12
15°/ 260K15°/ 260K
15°/ 260K
8 12
15°/ 260K15°/ 260K
15°/ 260K
Underlined bandpass data were used the in following OOB analysisAmb = ambient temperature (? K)*part received by SDL

Filter Part and Data list, bands 9-12
Band Part # Bandpass Data
Angle / temperature
Out-of-band Data
Angle / temperature / wavelength (m)
Comment
9 12
15°/ 260K15°/ 260K
15°/ 260K
10
11 1(wit)2*3*456?
0°/ amb, 15°/ 260K, 15°/amb0°/ amb0°/ amb0°/ amb0°/ amb0°/ amb
15°/ 260K/ 2.0–3.32
15°/ 260K/ 1.0–2.0, 15°/ 260K/ 3.42–5.5 No part #12 7*
89
10*11(wit)
?
0°/ amb0°/ amb0°/ amb0°/ amb0°/ 260K, 15°/ 260K, 15°/amb
15°/ 260K/ 1.0–2.0, 15°/ 260K/ 2.0–3.44, 15°/ 260K/ 3.54–6.0 No part #
Underlined bandpass data were used the in the following analysisAmb = ambient temperature (? K)*part received by SDL

Filter Part and Data list, bands 13-16
Band Part # Bandpass Data
Angle / temperature
Out-of-band Data
Angle / temperature / wavelength range (m)
Comment
13 12*34*5
wit?
0°/ amb, 15°/ 260K, 15°/200K0°/ amb0°/ amb0°/ amb0°/ amb15°/ 260K, 15°/ 200K
15°/ 260K/ 1.0–2.0, 15°/ 260K/ 2.0–4.2, 15°/ 260K/ 4.6–6.0No part #No part #
14 2*3*5
15°/ 260K, 15°/ amb15°/ 260K, 15°/ amb
15°/ 260K/ 2.0–3.26, 15°/ 260K/ 4.79–6.0 no OOB 3.3-cuton15 2
3*5*?
15°/ 260K, 15°/ amb0°/ amb0°/ amb
15°/ amb/ 1.0–2.0, 15°/ 260K/ 2.0-4.85, 15°/ 260K/ 5.24-6.0 No part #16 2*
3*5
Wit
0°/ amb0°/ amb15°/ 260K0°/ amb, 15°/ amb, 15°/ 260K 15°/ 260K/ 1.0-3.0, 15°/ 260K/ 3.0-6.0 No part #
Underlined bandpass data were used the in following analysisAmb = ambient temperature (? K)*part received by SDL

SOFIE Bandpass PerformanceBand Measurement Center (m)
spec /
actual filter
Width (%)
spec /
actual filter
Cuton – Cutoff (m)
spec / actual filter
Cuton – Cutoff (cm-1)
spec / actual filter
1 O3 strong 0.290 / 0.292 2.9 / 4.1 0.2857-0.2941 / 0.285- 0.298 34000-35000 / 33605 – 35033
2 O3 weak 0.328 / 0.327 3.3 / 4.2 0.3226-0.3333 / 0.320– 0.333
30000-31000 / 29988 - 31274
3 particle strong 0.862 / 0.864 3.4 / 3.7 0.8475-0.8772 / 0.848- 0.880 11400-11800 / 11363 - 11786
4 particle weak 1.03 / 1.03 4.4 / 4.3 1.0101-1.0526 / 1.009-1.054 9500-9900 / 9487-9908
5 H2O weak 2.45 / 2.46 2.0 / 2.2 2.427-2.475 / 2.432 - 2.486 4040-4120 / 4022- 4111
6 H2O strong 2.60 / 2.61 2.1 / 2.0 2.577-2.632 / 2.587 - 2.640 3800-3880 / 3787 - 3865
7 CO2 strong 2.77 / 2.78 2.0 / 2.1 2.740-2.749 / 2.750 - 2.809 3580-3650 / 3560 - 3636
8 CO2 weak 2.94 / 2.94 2.1 / 2.0 2.907-2.967 / 2.910 - 2.970 3370-3440 / 3366 - 3435
9 particle strong 3.06 / 3.07 2.0 / 2.0 3.030-3.091 / 3.037 - 3.098 3235-3300 / 3228 - 3292
10 particle weak 3.19 / 3.19 2.1 / 2.2 3.160-3.226 / 3.150 - 3.220 3100-3165 / 3106 - 3174
11 CH4 strong 3.37 / 3.38 2.2 / 2.3 3.333-3.401 / 3.341 - 3.418 2940-3000 / 2926 - 2993
12 CH4 weak 3.51 / 3.49 2.1 / 2.0 3.472-3.546 / 3.454 - 3.523 2820-2880 / 2838 - 2894
13 CO2 strong 4.35 / 4.36 4.3 / 4.8 4.255-4.444 / 4.257 - 4.465 2250-2350 / 2239 - 2348
14 CO2 weak 4.68 / 4.66 2.3 / 2.8 4.630-4.740 / 4.592 - 4.721 2110-2160 / 2118 - 2177
15 NO weak 4.98 / 5.02 2.0 / 1.9 4.951-5.051 / 4.976 - 5.069 1980-2020 / 1972 - 2009
16 NO strong 5.32 / 5.34 2.1 / 3.1 5.263-5.376 / 5.259 - 5.422 1860-1900 / 1844 - 1901
•All values based on total response curves, not just filter transmission curves.•Filter width is defined from the half-power points (cuton to cutoff).•Band center is the average of the cuton and cutoff wavelengths.
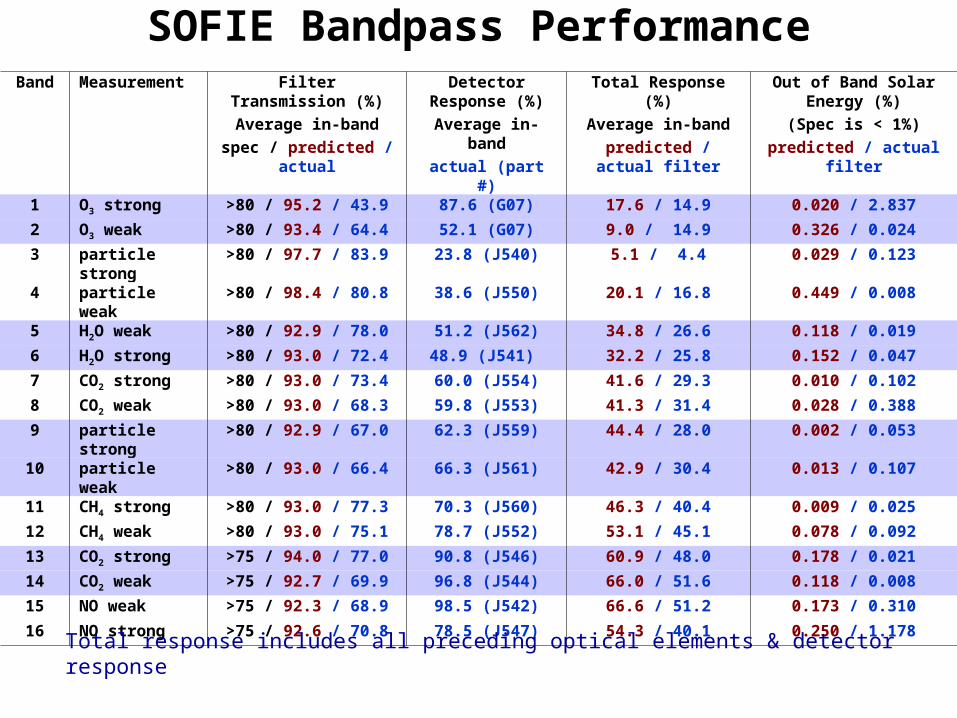
SOFIE Bandpass PerformanceBand Measurement Filter Transmission (%)
Average in-band
spec / predicted / actual
Detector Response (%)
Average in-band
actual (part #)
Total Response (%)
Average in-band
predicted / actual filter
Out of Band Solar Energy (%)
(Spec is < 1%)
predicted / actual filter1 O3 strong >80 / 95.2 / 43.9 87.6 (G07) 17.6 / 14.9 0.020 / 2.837
2 O3 weak >80 / 93.4 / 64.4 52.1 (G07) 9.0 / 14.9 0.326 / 0.024
3 particle strong >80 / 97.7 / 83.9 23.8 (J540) 5.1 / 4.4 0.029 / 0.123
4 particle weak >80 / 98.4 / 80.8 38.6 (J550) 20.1 / 16.8 0.449 / 0.0085 H2O weak >80 / 92.9 / 78.0 51.2 (J562) 34.8 / 26.6 0.118 / 0.019
6 H2O strong >80 / 93.0 / 72.4 48.9 (J541) 32.2 / 25.8 0.152 / 0.047
7 CO2 strong >80 / 93.0 / 73.4 60.0 (J554) 41.6 / 29.3 0.010 / 0.102
8 CO2 weak >80 / 93.0 / 68.3 59.8 (J553) 41.3 / 31.4 0.028 / 0.388
9 particle strong >80 / 92.9 / 67.0 62.3 (J559) 44.4 / 28.0 0.002 / 0.053
10 particle weak >80 / 93.0 / 66.4 66.3 (J561) 42.9 / 30.4 0.013 / 0.107
11 CH4 strong >80 / 93.0 / 77.3 70.3 (J560) 46.3 / 40.4 0.009 / 0.025
12 CH4 weak >80 / 93.0 / 75.1 78.7 (J552) 53.1 / 45.1 0.078 / 0.092
13 CO2 strong >75 / 94.0 / 77.0 90.8 (J546) 60.9 / 48.0 0.178 / 0.021
14 CO2 weak >75 / 92.7 / 69.9 96.8 (J544) 66.0 / 51.6 0.118 / 0.008
15 NO weak >75 / 92.3 / 68.9 98.5 (J542) 66.6 / 51.2 0.173 / 0.310
16 NO strong >75 / 92.6 / 70.8 78.5 (J547) 54.3 / 40.1 0.250 / 1.178
Total response includes all preceding optical elements & detector response

Band 1 analysis
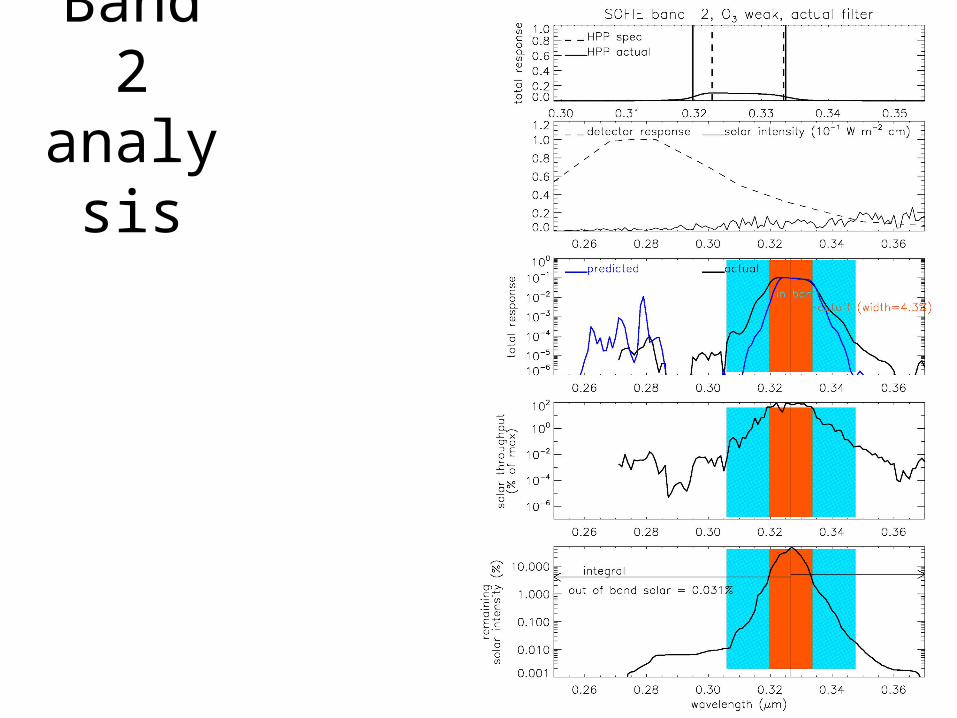
Band 2 analysis

Band 3 analysis
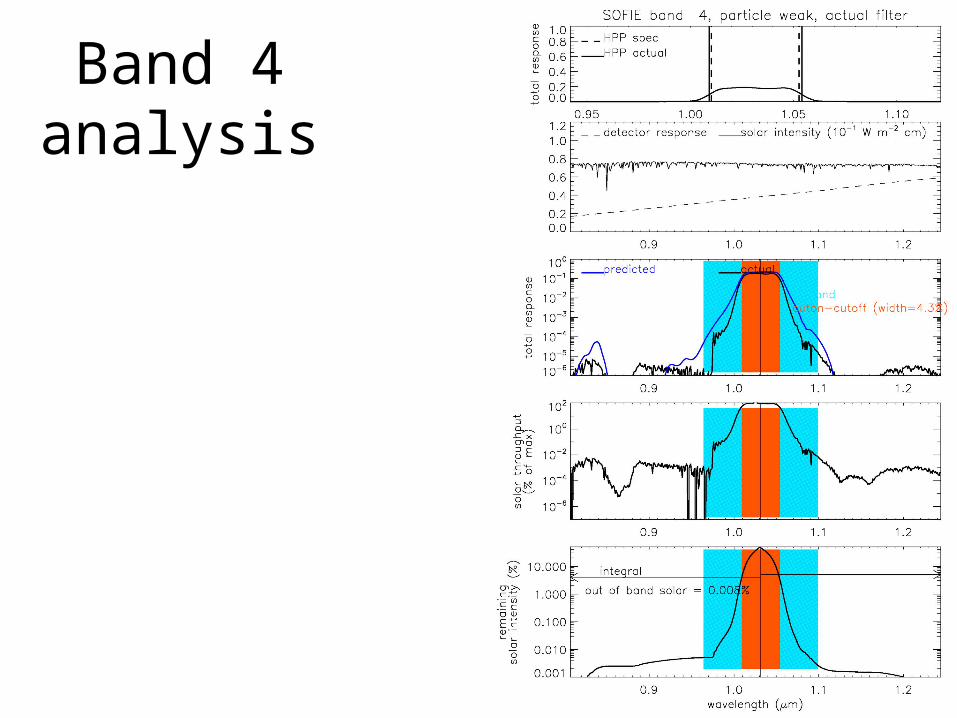
Band 4 analysis

Band 5 Analysis
Notes:

Band 6 Analysis
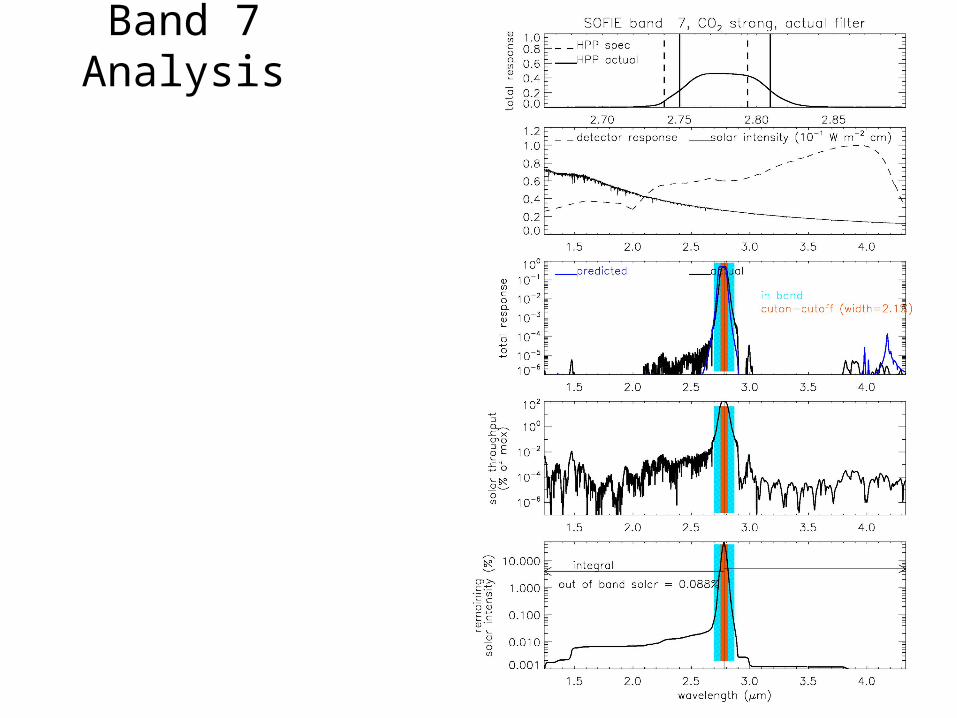
Band 7 Analysis
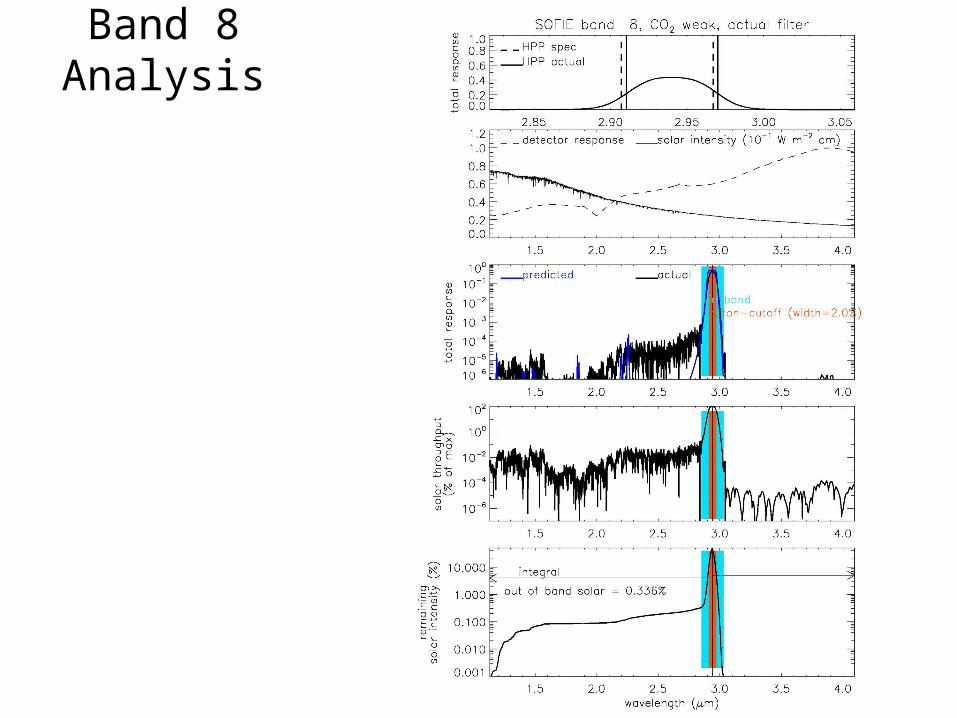
Band 8 Analysis

Band 9 Analysis
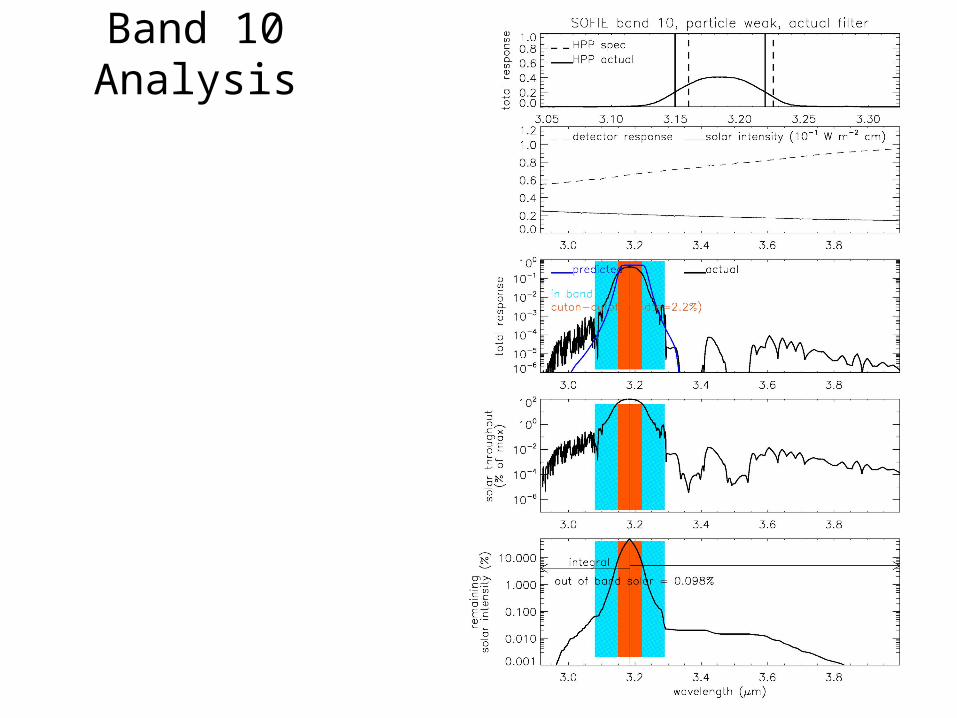
Band 10 Analysis
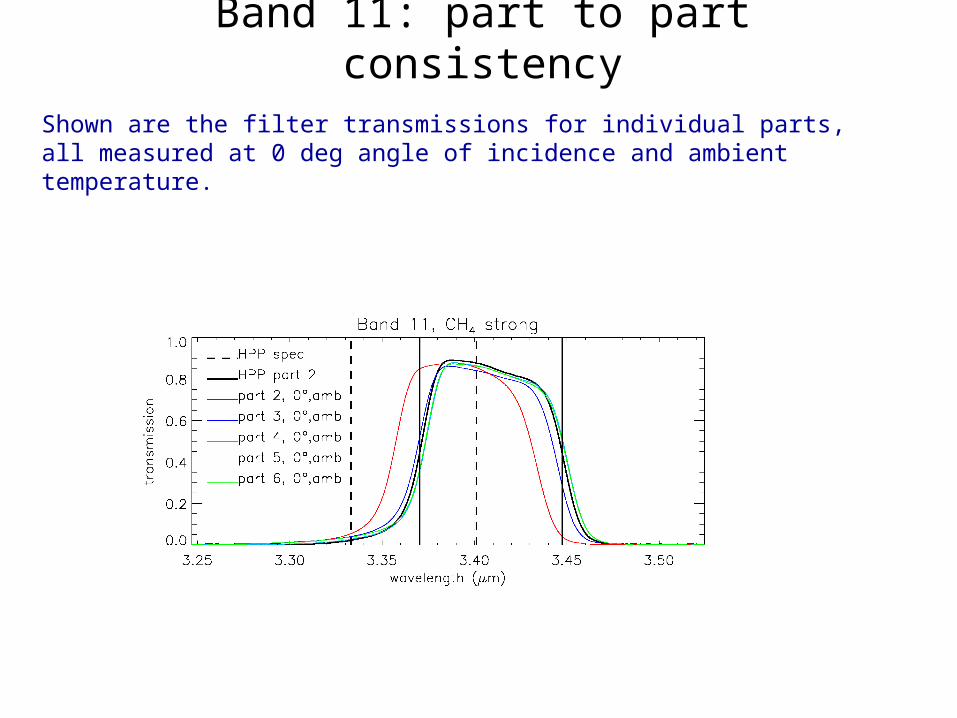
Band 11: part to part consistency
Shown are the filter transmissions for individual parts, all measured at 0 deg angle of incidence and ambient temperature.

Band 11 Analysis
Notes:
•Filter location shift
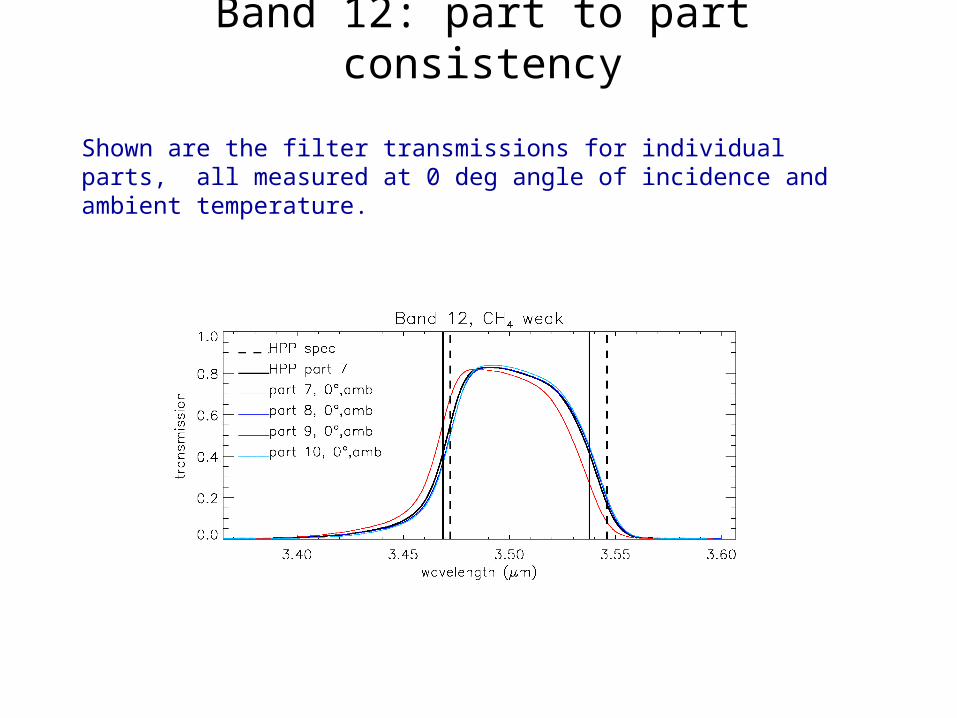
Band 12: part to part consistency
Shown are the filter transmissions for individual parts, all measured at 0 deg angle of incidence and ambient temperature.
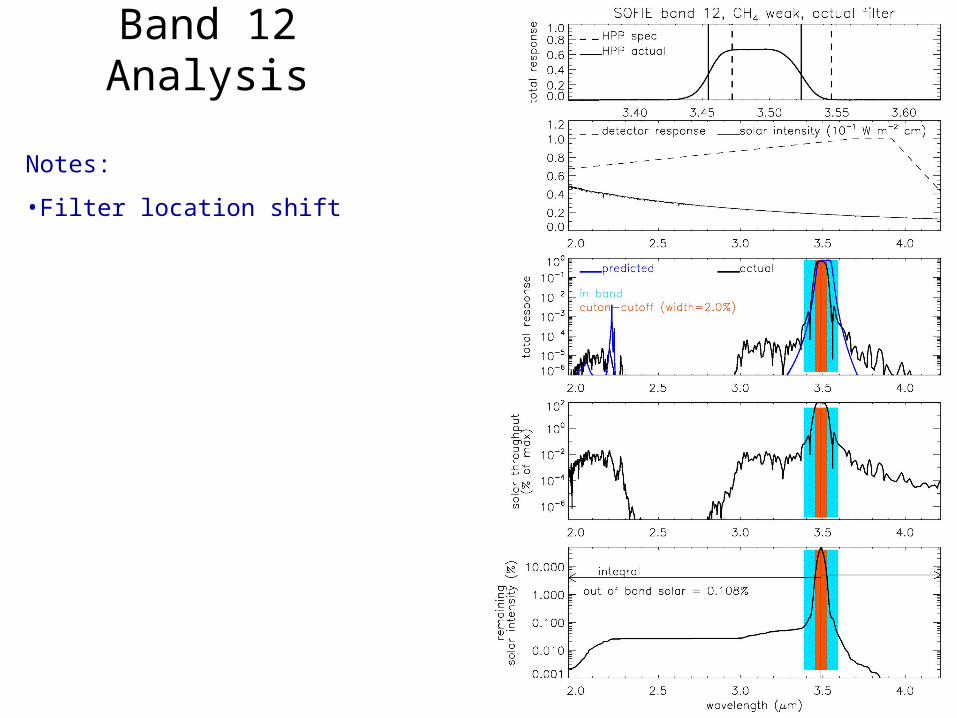
Band 12 Analysis
Notes:
•Filter location shift
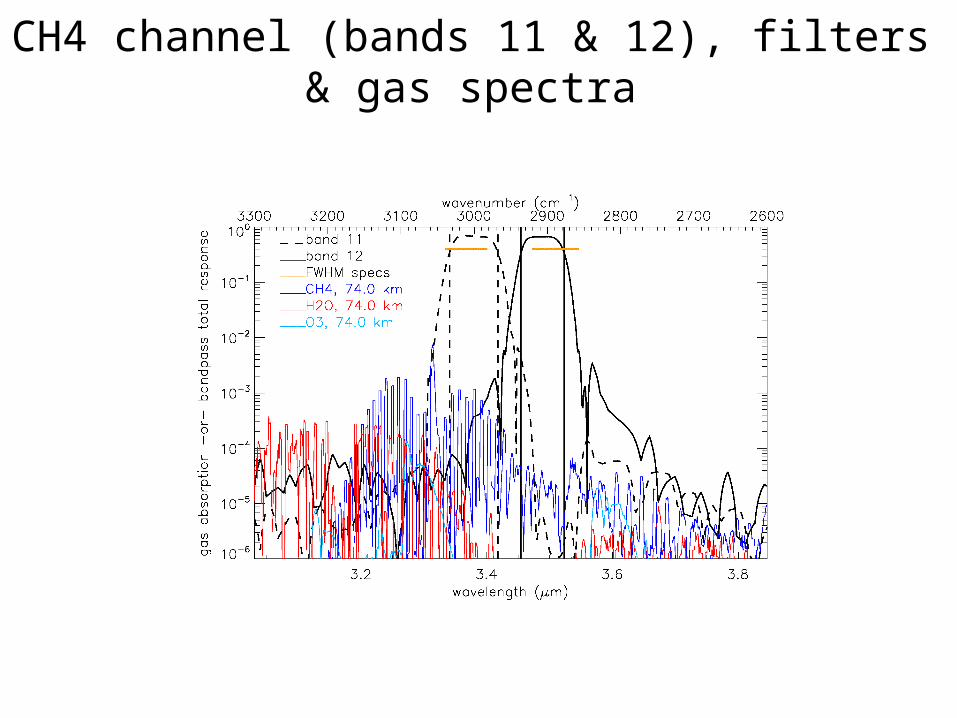
CH4 channel (bands 11 & 12), filters & gas spectra

Band 13: part to part consistency
Shown are the filter transmissions for individual parts, all measured at 0 deg angle of incidence and ambient temperature.

Band 13 Analysis
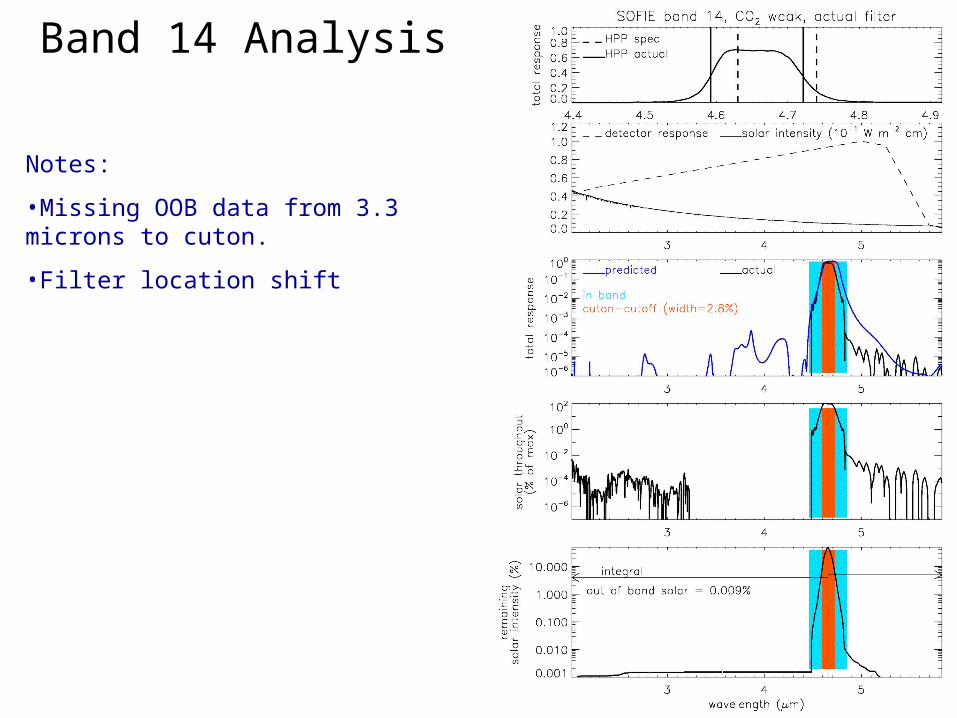
Band 14 Analysis
Notes:
•Missing OOB data from 3.3 microns to cuton.
•Filter location shift
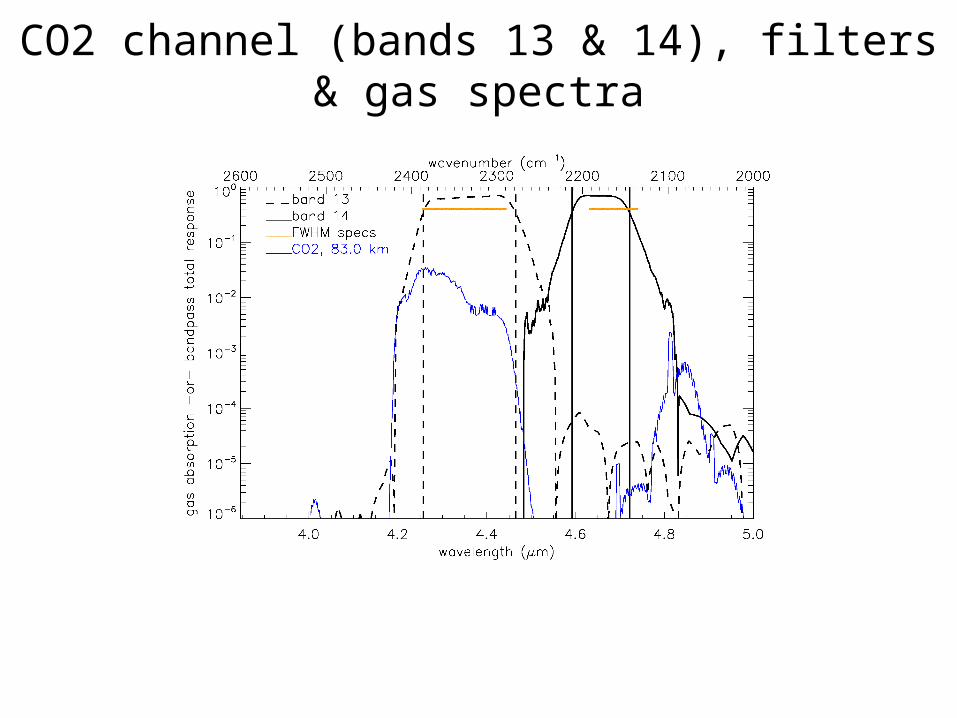
CO2 channel (bands 13 & 14), filters & gas spectra

Band 15 Analysis
Notes:
•Filter location shift

Band 16 Analysis
Notes:
•Filter location shift, broader
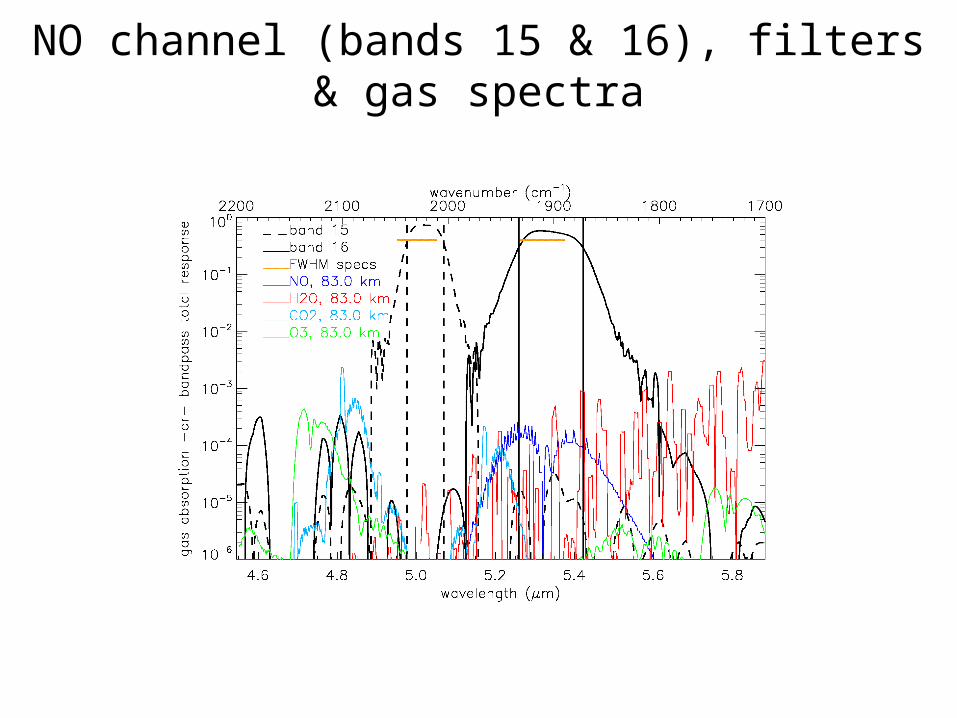
NO channel (bands 15 & 16), filters & gas spectra
Extra slides follow
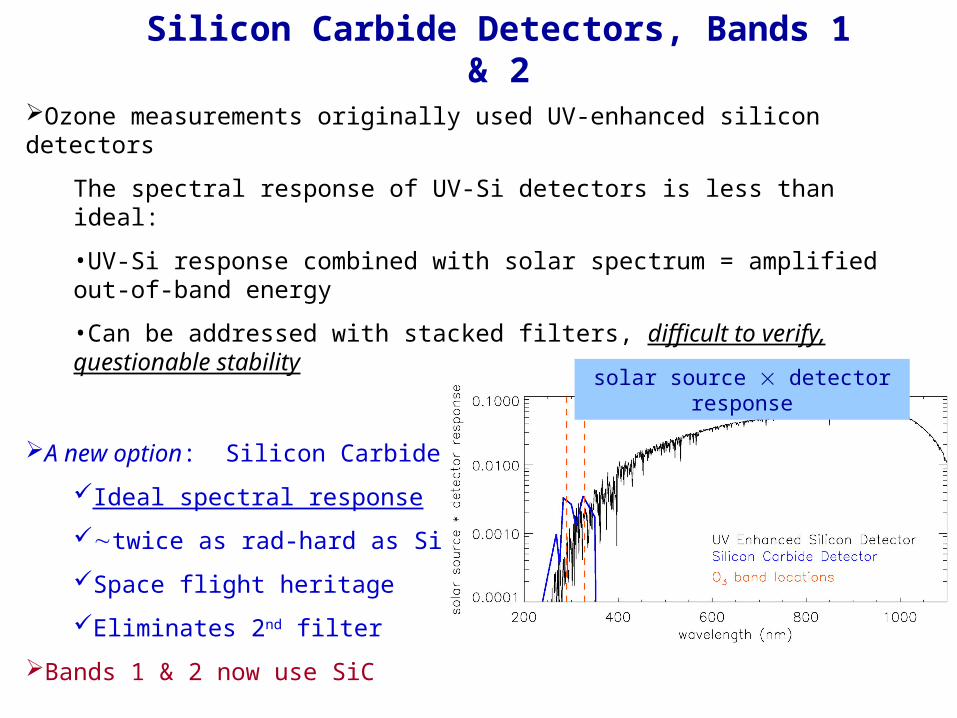
Silicon Carbide Detectors, Bands 1 & 2
Ozone measurements originally used UV-enhanced silicon detectors
The spectral response of UV-Si detectors is less than ideal:
•UV-Si response combined with solar spectrum = amplified out-of-band energy
•Can be addressed with stacked filters, difficult to verify, questionable stability
A new option: Silicon Carbide (SiC) detectors
Ideal spectral response
twice as rad-hard as Si
Space flight heritage
Eliminates 2nd filter
Bands 1 & 2 now use SiC
solar source detector response

Band 1 Spectral Response with SiC detector
Predictions indicate excellent performance using silicon carbide detector
Solar out-of-band = 0.02%
Backup slides follow

SOFIE Out of Band PerformanceAs hardware arrives at SDL, the measured characteristics are used to predict performance and ensure that all parts meet our requirements.
Requirement: Out of band exoatmospheric solar energy < 1% of total signal
Band Measurement Center (m)
Out of Band Solar Energy (%), Predicted
Out of Band Solar Energy (%), Actual Filter
& Detector1 O3 strong 0.290 0.0202 O3 weak 0.328 0.3263 particle strong 0.862 0.4494 particle weak 1.03 0.0165 H2O weak 2.45 0.125 0.0156 H2O strong 2.60 0.167 0.0467 CO2 strong 2.77 0.260 0.0888 CO2 weak 2.94 0.236 0.3369 particle strong 3.06 0.003 0.042
10 particle weak 3.19 0.01511 CH4 strong 3.37 0.012 0.02012 CH4 weak 3.51 0.116 0.09313 CO2 strong 4.25 0.177 0.01414 CO2 weak 4.63 0.123 0.00815 NO weak 4.98 0.179 0.19916 NO strong 5.32 0.256 0.693
Here, in-band is defined as a region 3 filter widths wide centered on the band center wavelength
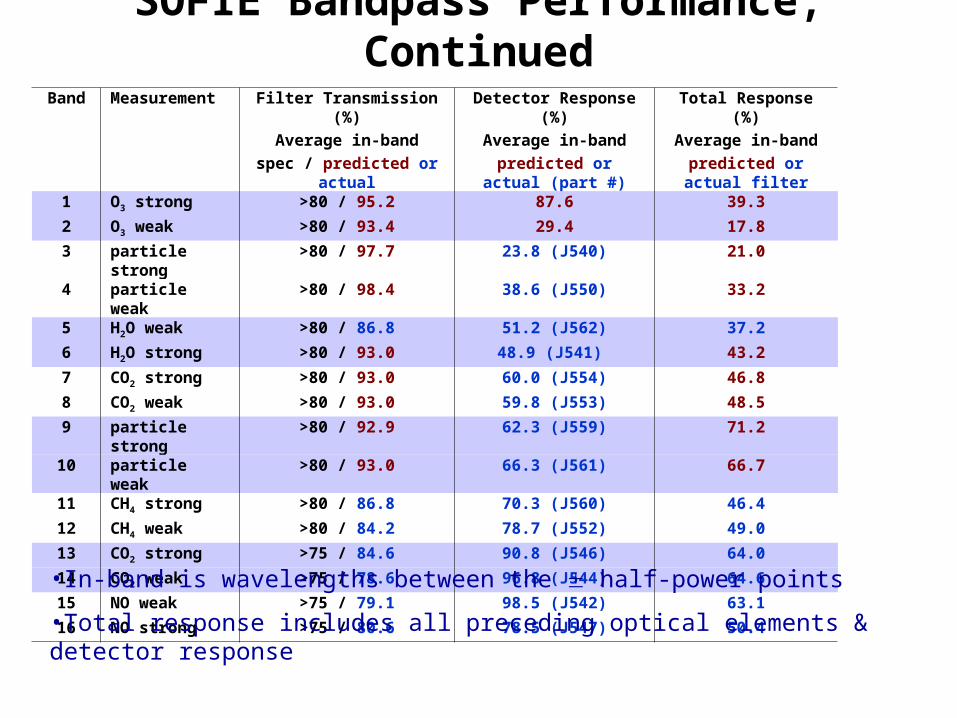
SOFIE Bandpass Performance, Continued
Band Measurement Filter Transmission (%)
Average in-band
spec / predicted or actual
Detector Response (%)
Average in-band
predicted or actual (part #)
Total Response (%)
Average in-band
predicted or actual filter
1 O3 strong >80 / 95.2 87.6 39.3
2 O3 weak >80 / 93.4 29.4 17.8
3 particle strong >80 / 97.7 23.8 (J540) 21.0
4 particle weak >80 / 98.4 38.6 (J550) 33.25 H2O weak >80 / 86.8 51.2 (J562) 37.2
6 H2O strong >80 / 93.0 48.9 (J541) 43.2
7 CO2 strong >80 / 93.0 60.0 (J554) 46.8
8 CO2 weak >80 / 93.0 59.8 (J553) 48.5
9 particle strong >80 / 92.9 62.3 (J559) 71.2
10 particle weak >80 / 93.0 66.3 (J561) 66.7
11 CH4 strong >80 / 86.8 70.3 (J560) 46.4
12 CH4 weak >80 / 84.2 78.7 (J552) 49.0
13 CO2 strong >75 / 84.6 90.8 (J546) 64.0
14 CO2 weak >75 / 78.6 96.8 (J544) 64.6
15 NO weak >75 / 79.1 98.5 (J542) 63.1
16 NO strong >75 / 80.6 78.5 (J547) 50.4
•In-band is wavelengths between the half-power points
•Total response includes all preceding optical elements & detector response