Société Générale Presentation to Debt Investors Winter...
33
Société Générale Presentation to Debt Investors Winter 2008
Transcript of Société Générale Presentation to Debt Investors Winter...
Société Générale
Presentation to Debt Investors
Winter 2008

2Presentation to Debt investors Winter 2008
DisclaimerThe following presentation contains a number of forwardThe following presentation contains a number of forward--looking statements relating to looking statements relating to SocieteSociete Generale’sGenerale’s targets and strategy. These targets and strategy. These forecasts are based on a series of assumptions, both general andforecasts are based on a series of assumptions, both general and specific. As a result, there is a risk that these projections wspecific. As a result, there is a risk that these projections will not be met. ill not be met. Readers are therefore advised not to rely on these figures more Readers are therefore advised not to rely on these figures more than is justified as the Group’s future results are liable to bethan is justified as the Group’s future results are liable to be affected by a affected by a number of factors and may therefore differ from current estimatenumber of factors and may therefore differ from current estimates. Readers should take into account elements of uncertainty and s. Readers should take into account elements of uncertainty and risk when risk when basing their investment decisions on information provided in thibasing their investment decisions on information provided in this presentation. Neither s presentation. Neither SocieteSociete GeneraleGenerale nor its representatives shall have any nor its representatives shall have any liability whatsoever for any loss arising from any use of this pliability whatsoever for any loss arising from any use of this presentation or its contents or otherwise arising in connection wresentation or its contents or otherwise arising in connection with this presentation ith this presentation or any other information or material discussed. or any other information or material discussed.
The Group’s consolidated financial statements were examined by tThe Group’s consolidated financial statements were examined by the Board of Directors on November 2nd 2008.he Board of Directors on November 2nd 2008.
The quarterly results at March 31st 2007, June 30th 2007, SeptemThe quarterly results at March 31st 2007, June 30th 2007, September 30th 2007 and December 31st 2007, presented for comparative ber 30th 2007 and December 31st 2007, presented for comparative purposes, have been adjusted to restate the accounting consequenpurposes, have been adjusted to restate the accounting consequences of the fictitious transactions recorded in 2007 and 2008 relces of the fictitious transactions recorded in 2007 and 2008 relating to ating to unauthorised, concealed market activities discovered in January unauthorised, concealed market activities discovered in January 2008. This information is appended on pages 6 to 8. However, in 2008. This information is appended on pages 6 to 8. However, in order to order to provide more relevant information on the Group’s performance, thprovide more relevant information on the Group’s performance, the figures in this document correspond to reported historic data.e figures in this document correspond to reported historic data. The comments The comments are also based on these reported historic data. The consolidatedare also based on these reported historic data. The consolidated financial statements for the third quarter of 2008 and comparatfinancial statements for the third quarter of 2008 and comparative data for the ive data for the third quarter of 2007 (reported and restated) have been reviewedthird quarter of 2007 (reported and restated) have been reviewed by the Statutory Auditors. The Basel II data in this presentatiby the Statutory Auditors. The Basel II data in this presentation were not on were not audited by the Statutory Auditors.audited by the Statutory Auditors.
The figures provided for the nine months ended September 30th 20The figures provided for the nine months ended September 30th 2008 have been prepared in accordance with IFRS (International Fin08 have been prepared in accordance with IFRS (International Financial ancial Reporting Standards) adopted by the European Union. On October 1Reporting Standards) adopted by the European Union. On October 15th 2008, the European Union adopted the amendments to IAS 39 5th 2008, the European Union adopted the amendments to IAS 39 “Financial Instruments: Recognition and Measurement” and IFRS 7 “Financial Instruments: Recognition and Measurement” and IFRS 7 “Financial Instruments: Disclosures” published on October 13th 2“Financial Instruments: Disclosures” published on October 13th 2008 by the 008 by the IASB. Under these amendments, from July 1st 2008, businesses areIASB. Under these amendments, from July 1st 2008, businesses are entitled to reclassify nonentitled to reclassify non--derivative financial assets out of the fair valuederivative financial assets out of the fair value--throughthrough--profitprofit--oror--loss and availableloss and available--forfor--sale categories, under certain conditions or rare circumstances.sale categories, under certain conditions or rare circumstances. None of the reclassifications permitted None of the reclassifications permitted by these amendments have been applied to the Group’s consolidateby these amendments have been applied to the Group’s consolidated financial statements presented for the nine months ended d financial statements presented for the nine months ended Sept.emberSept.ember30th 2008. This option will be used from October 1st 2008.30th 2008. This option will be used from October 1st 2008.
This financial information does not constitute interim financialThis financial information does not constitute interim financial statements as defined by IAS 34 “Interim Financial Reporting”. statements as defined by IAS 34 “Interim Financial Reporting”. SocieteSociete Generale’sGenerale’sManagement will publish complete consolidated financial statemenManagement will publish complete consolidated financial statements for the financial year 2008.ts for the financial year 2008.
Unless otherwise specified, the sources for the business rankingUnless otherwise specified, the sources for the business rankings are internal. s are internal.

3Presentation to Debt investors Winter 2008
SG Strategy and Q3 2008 Results
Group funding strategy
Supplements
4Presentation to Debt investors Winter 2008
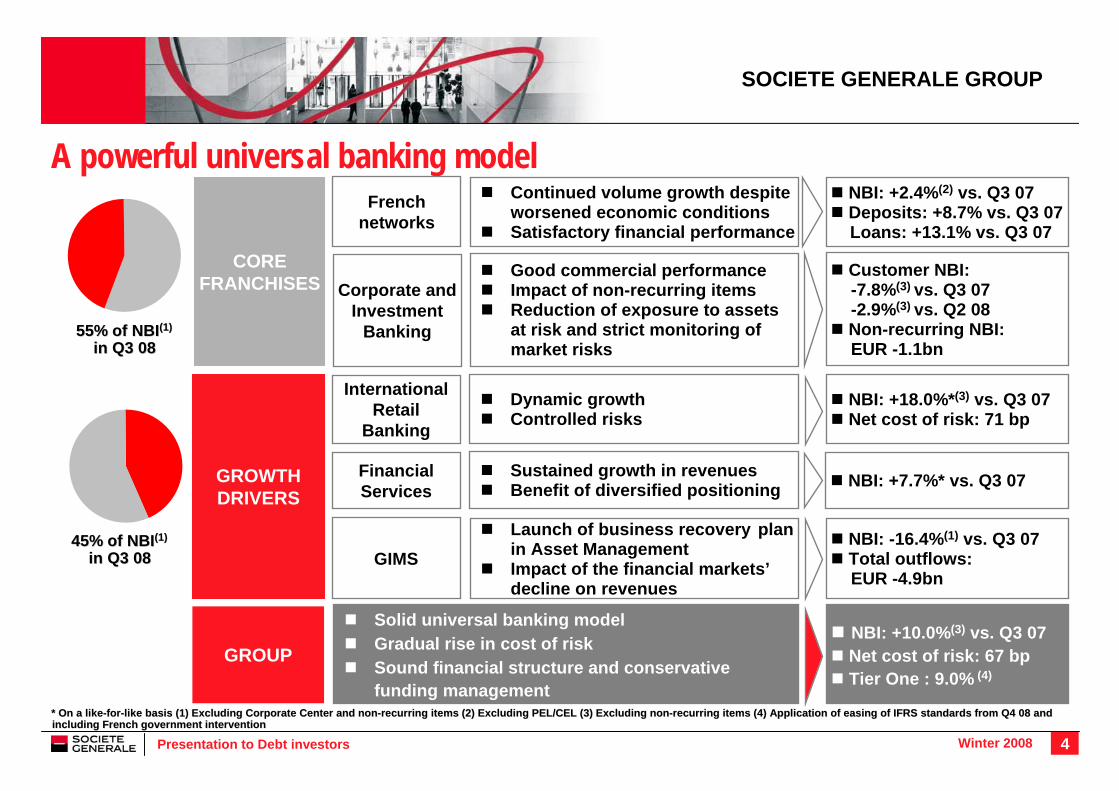
A powerful universal banking model
CORE FRANCHISES
GROWTH DRIVERS
Corporate and Investment
Banking
InternationalRetail
Banking
FinancialServices
GIMS
French networks
55% of NBI55% of NBI(1)(1)
in Q3 08in Q3 08
* On a like* On a like--forfor--like basis (1) Excluding Corporate like basis (1) Excluding Corporate CenterCenter and nonand non--recurring items (2) Excluding PEL/CEL (3) Excluding nonrecurring items (2) Excluding PEL/CEL (3) Excluding non--recurring items (4) Application of easing of IFRS standards fromrecurring items (4) Application of easing of IFRS standards from Q4 08 and Q4 08 and including French government interventionincluding French government intervention
45% of NBI45% of NBI(1)(1)
in Q3 08in Q3 08
Continued volume growth despite worsened economic conditions Satisfactory financial performance
NBI: +2.4%(2) vs. Q3 07 Deposits: +8.7% vs. Q3 07 Loans: +13.1% vs. Q3 07
Good commercial performance Impact of non-recurring itemsReduction of exposure to assets at risk and strict monitoring of market risks
Customer NBI:-7.8%(3) vs. Q3 07-2.9%(3) vs. Q2 08Non-recurring NBI:EUR -1.1bn
Dynamic growth Controlled risks
NBI: +18.0%*(3) vs. Q3 07Net cost of risk: 71 bp
NBI: +7.7%* vs. Q3 07Sustained growth in revenues Benefit of diversified positioning
Launch of business recovery plan in Asset ManagementImpact of the financial markets’ decline on revenues
NBI: -16.4%(1) vs. Q3 07 Total outflows:EUR -4.9bn
GROUP NBI: +10.0%(3) vs. Q3 07Net cost of risk: 67 bpTier One : 9.0% (4)
Solid universal banking model Gradual rise in cost of risk Sound financial structure and conservative funding management
SOCIETE GENERALE GROUP

5Presentation to Debt investors Winter 2008
Revenues of core businessesIn EUR mIn EUR m
SOCIETE GENERALE GROUP
Corporate and InvestmentBanking
Global Investment and Management Services
Retail Bankingand Financial Services
Group (including Corporate Centre)
+14.7%(1)
Chg Q3/Q3 Chg Q3/Q2
(1) Excluding non-recurring items (restatements in the supplementary data, page 30)The French Network changes do not include PEL/CEL
Financial Services
International RetailBanking
French Networks
+14.9%( 1)
+13.7%
Non-recurring items
+2.4%(1)
+40.8%(1)
+13.7%
-16.4%(1)
+20.9%(1)
+0.6%(1)
+1.5%(1)
+1.2%(1)
-2.4%
-12.9%(1)
-8.5%(1)1,947 2,077
1,159 1,563 663 647
919 1,116 854 852 597 870 746
645 688 707 798 775 824 804 763 860 871 950 1,116 1,212 1,301
1,736 1,789 1,746 1,787 1,739 1,754 1,781
-661
3,886 3,790 3,144 3,337 3,324 3,535 3,630
5,108 6,046 6,622 5,375 3,880 5,679 5,584
Q1 07 Q2 07 Q3 07 Q4 07 Q1 08 Q2 08 Q3 08
In absolute terms
6Presentation to Debt investors Winter 2008
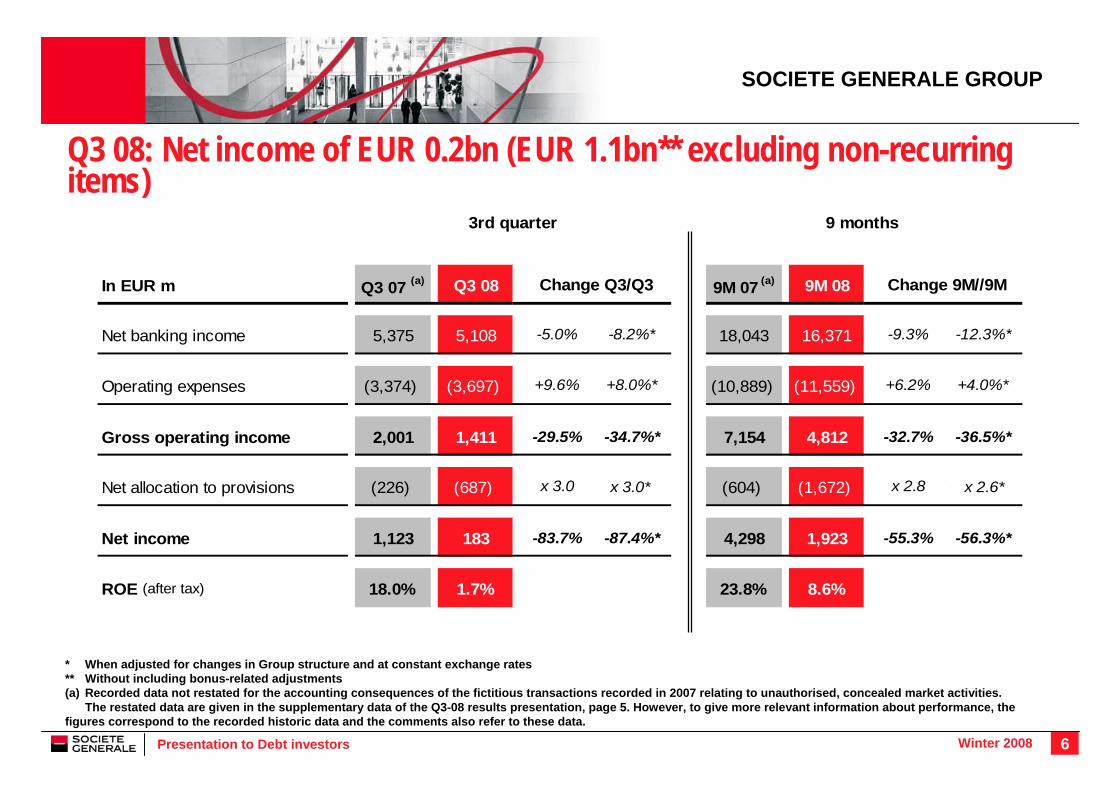
Q3 08: Net income of EUR 0.2bn (EUR 1.1bn** excluding non-recurring items)
SOCIETE GENERALE GROUP
* When adjusted for changes in Group structure and at constant exchange rates** Without including bonus-related adjustments(a) Recorded data not restated for the accounting consequences of the fictitious transactions recorded in 2007 relating to unauthorised, concealed market activities.
The restated data are given in the supplementary data of the Q3-08 results presentation, page 5. However, to give more relevant information about performance, the figures correspond to the recorded historic data and the comments also refer to these data.
3rd quarter 9 months
In EUR m Q3 07 (a) Q3 08 9M 07 (a) 9M 08
Net banking income 5,375 5,108 -5.0% -8.2%* 18,043 16,371 -9.3% -12.3%*
Operating expenses (3,374) (3,697) +9.6% +8.0%* (10,889) (11,559) +6.2% +4.0%*
Gross operating income 2,001 1,411 -29.5% -34.7%* 7,154 4,812 -32.7% -36.5%*
Net allocation to provisions (226) (687) x 3.0 ####### (604) (1,672) x 2.8 #######
Net income 1,123 183 -83.7% -87.4%* 4,298 1,923 -55.3% -56.3%*
ROE (after tax) 18.0% 1.7% 23.8% 8.6%
Change Q3/Q3 Change 9M//9M
x 3.0* x 2.6*

7Presentation to Debt investors Winter 2008
Moderate increase in cost of riskAllocation to provisions (in EUR m)Allocation to provisions (in EUR m)
Financial Services
FrenchNetworks
Corporate and Investment
Banking
International Retail Banking
SOCIETE GENERALE GROUP
Group
French NetworksLimited increase in cost of risk
International Retail BankingCost of risk excluding Rosbank: 57 bp
Financial ServicesStructure effect (recent acquisitions)Effect of business mix
Corporate and Investment BankingAllocation to provisions of EUR 270m• of which increase in collective provisions for non-
incurred losses: EUR 132m • of which allocation to provisions for financial institutions:
EUR 40m
Group cost of risk: 67 bp in Q3 08
102 102 113 134
44 49 88 78
68 105 87 93 116
270
77
312
-5
9
149
127
687387598301226
96 bp
101 bp127 bp
71 bp42 bp
33 bp25 bp
Q3 07 Q4 07 Q1 08 Q2 08 Q3 08

8Presentation to Debt investors Winter 2008
Financial support for the economy: application to France of the Eurogroup countries’ concerted action plan (October 2008)
Measures to strengthen capitalEquity or quasi-equity security issues by financial institutions subscribed by the Government up to a maximum of EUR 40bn - Contribution by 31/12/2008 of EUR 10.5bn of deeply subordinated debt to six major banksSociété Générale’s share: EUR 1.7bn, Basel II Tier One ratio increased by 50 bp to 9.0%
Measures to facilitate medium- and long-term refinancing Medium-term bond issues (maximum maturity 5 years) guaranteed by the Government, up to an amount of EUR 265bn
Commitment by the banks to increase credit volumes in the French economy by 3% to 4% per year
Central Bank measures aimed at restoring the interbank markets’ liquidity
SOCIETE GENERALE GROUP

9Presentation to Debt investors Winter 2008
Sound financial structure: proforma Basel II Tier One Ratio of 9.0%Improvement in Tier One ratio of 35 bp vs. June 30th 2008
Provisions for dividends at Sept. 30th 2008 ≈25 bp of Tier One
Share of Tier One consisting of hybrid capital: 19.8% at Sept. 30th 2008
Issuing of deeply subordinated debt to the Société de Prises de Participations de l’Etat:EUR 1.7bn by December 31st 2008
Proforma** Tier One Ratio of 9.0% and Core Tier One Ratio of 6.8% at Sept. 30th 2008
High quality Tier One capital: 24% hybrids
SOCIETE GENERALE GROUP
Change in Basel II Tier One Ratio* Change in Basel II Tier One Ratio*
* Calculated on the basis of a pay-out ratio of 45%** Subject to the approval of the European Commission(1) Solvency ratio: Tier One + Tier Two + other deductions (2) Core Tier One: Tier One capital - hybrid capital
6.6% 6.8% 6.8%
1.6% 1.7% 2.2%
2.7%3.2% 3.2%
12.2%10.9% 11.7%
9.0%8.2% 8.5%
June 30th 08 Sept 30th 08 ProformaSept 30th 08
Tier 2
Tier 1
Solvency ratio(1)
Tier One ratio
Hybrid capital
Core Tier 1(2)

10Presentation to Debt investors Winter 2008
SOCIETE GENERALE GROUP
Tier One Ratio appropriate to a scenario of intense credit stress in 2009(All the data appearing in this slide correspond to stress-tests and are provided for information purposes. They should not be viewed as forecasts)
Stress assumptions applied2009 Gross Operating Income of ≈ EUR 7.9bn (not an income forecast but the lowest analyst consensus at October 31st 2008)10% organic growth of RWAs (no external growth, volume effect and rating migration)Stress-tested Group cost of risk at 110 bp• Inclusion of assumptions specific to each core business2009 Net Income of ≈ EUR 1.6bn (not an income forecast)
Basel II Tier One Ratio of 9.0% and Basel II Core Tier One of 6.6% at end-2009 Issuance in 2009 of additional Tier One-eligible deeply subordinated notes subscribed by the Government (totalling EUR 3.4bn) (1)(1)
2009 Tier One Ratio sensitivity: EUR +/- 500m of Gross Operating Income ≈ +/- 5 bp of Tier One RatioFinancial flexibility: lowering of pay-out ratio (central assumption 45%) would have a maximum impact of 40 bp of Tier One at end-2009
1) Percentage of hybrids in Tier One of around 27% (depending on pay-out ratio)

11Presentation to Debt investors Winter 2008
Robust performance in a challenging environment Satisfactory development of activity
Individual customers: good resilience • Personal current accounts: gradual return to a sustained rate of
new account openings (+27,100 in Q3 08)Stock of 6.3 million
• Rise in outstanding housing loans: +10.1% vs. Q3 07Business customers: continued growth • Sustained growth of balance sheet deposits: +32.4%* vs. Q3 07• Increase in outstanding loans:
Investment loans: +19.5% vs. Q3 07Operating loans: +13.8% vs. Q3 07
Resilient NBINBI: EUR 1,781m, +2.4%(b) vs. Q3 07• Interest margin: +1.5%(b)
Negative impact of rise in regulated savings account rate• Commissions: +3.5% vs. Q3 07
Improvement in C/I ratio excluding PEL/CEL: 63.3% vs. 63.7% in Q3 07
FRENCH NETWORKS
No. of personal current accounts
(in millions)
Housing loans(in EUR bn)
Business customer
loans (in EUR bn)
Outstanding deposits
(in EUR bn)
6.206.23
6.256.28
6.30
Q3 07 Q4 07 Q1 08 Q2 08 Q3 08
67.265.7
64.362.5
61.1
Q3 07 Q4 07 Q1 08 Q2 08 Q3 08
132.4 136.8 141.9 146.6 149.8
Q3 07 Q4 07 Q1 08 Q2 08 Q3 08
89.7 90.2 90.4 92.097.5
Q3 07 Q4 07 Q1 08 Q2 08 Q3 08
* Not including EUR 8.4bn of medium-term notes issued to French Network customers in Q3 08 vs. EUR 10.5bn in Q3 07b) Excluding PEL/CEL provision (EUR 0m in Q3 08 vs. a reversal of EUR 7m in Q3 07)
12Presentation to Debt investors Winter 2008
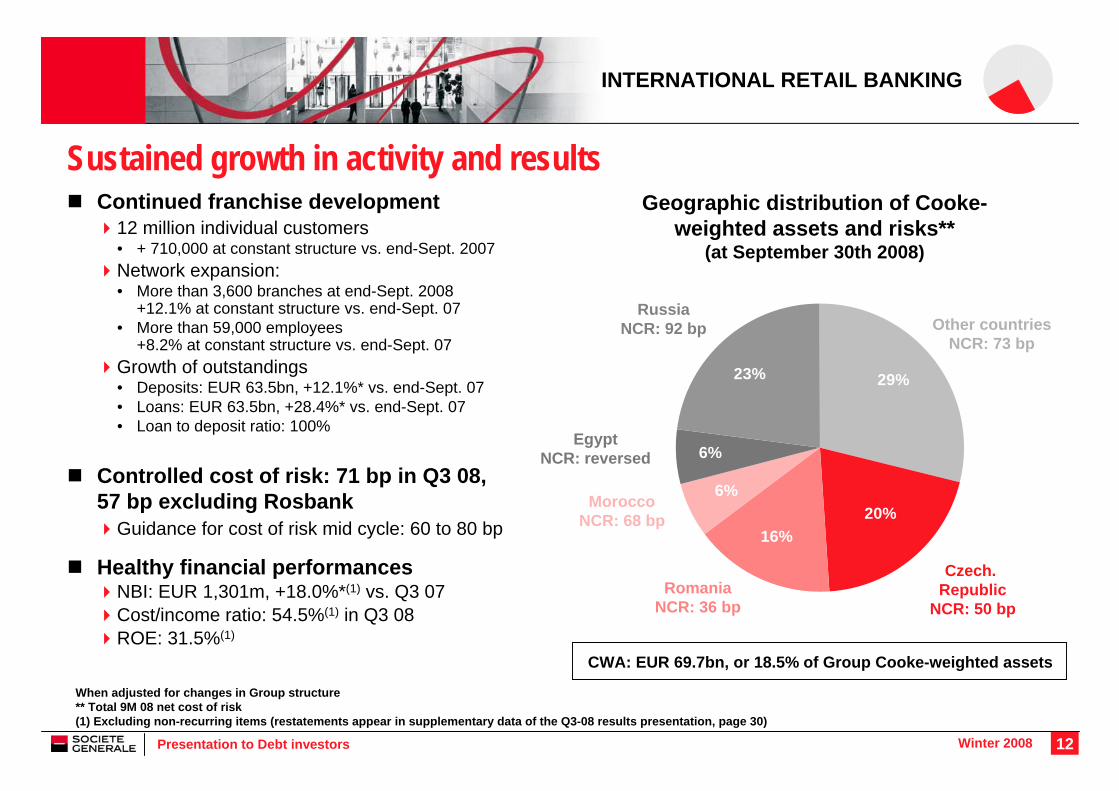
INTERNATIONAL RETAIL BANKING
Sustained growth in activity and resultsContinued franchise development
12 million individual customers• + 710,000 at constant structure vs. end-Sept. 2007Network expansion: • More than 3,600 branches at end-Sept. 2008
+12.1% at constant structure vs. end-Sept. 07• More than 59,000 employees
+8.2% at constant structure vs. end-Sept. 07Growth of outstandings • Deposits: EUR 63.5bn, +12.1%* vs. end-Sept. 07• Loans: EUR 63.5bn, +28.4%* vs. end-Sept. 07• Loan to deposit ratio: 100%
Controlled cost of risk: 71 bp in Q3 08,57 bp excluding Rosbank
Guidance for cost of risk mid cycle: 60 to 80 bp
Healthy financial performancesNBI: EUR 1,301m, +18.0%*(1) vs. Q3 07Cost/income ratio: 54.5%(1) in Q3 08ROE: 31.5%(1)
When adjusted for changes in Group structure** Total 9M 08 net cost of risk(1) Excluding non-recurring items (restatements appear in supplementary data of the Q3-08 results presentation, page 30)
Geographic distribution of Cooke-weighted assets and risks**
(at September 30th 2008)
EgyptNCR: reversed
Czech.Republic
NCR: 50 bp
Other countriesNCR: 73 bp
RomaniaNCR: 36 bp
MoroccoNCR: 68 bp
RussiaNCR: 92 bp
6%
6%
16%20%
23% 29%
CWA: EUR 69.7bn, or 18.5% of Group Cooke-weighted assets

13Presentation to Debt investors Winter 2008
FINANCIAL SERVICES
* When adjusted for changes in Group structure and at constant exchange rates** Excluding factoring
Sustained, diversified revenue growthDiversified development of SG Equipment Finance
Activity still growing: EUR 18.5bn of outstandings** at end-Sept. 2008, +10.8%* vs. end-Sept. 2007
Continued growth of SG Consumer FinanceHigh growth in loan origination (+30.6%* vs. Q3 07)and outstandings (+20.5%* vs. end-Sept. 2007)Rise in overall cost of risk linked to the growing importance ofemerging countries
Continued growth of vehicle leasing business despite the decline in the car market
773,000 vehicles, + 8.4% at constant structure vs. end-Sept. 2007Impact of second-hand vehicle market decline
Satisfactory performancesNBI: EUR 804m, + 7.7%* vs. Q3 07• Specialised financing: EUR 685m, +9.1%* vs. Q3 07• Insurance: EUR 119m, +0.8%* vs. Q3 07Cost of risk: 127 bp in Q3 08
Outstanding loansOutstanding loans(End of period data (End of period data -- in EUR in EUR bnbn ))
Equipmentfinance**
Consumercredit
Cost of risk Cost of risk (in (in bpbp))
14.3 15.6 17.3
12.5 15.018.3 21.0
18.2
2005 2006 2007 Sept 08
140 bp173 bp
198 bp229 bp
7 bp 1 bp 20 bp 31 bp
0 bp50 bp
100 bp150 bp200 bp250 bp
2005 2006 2007 9M 08
Consumercredit
Equipmentfinance

14Presentation to Debt investors Winter 2008
Global franchises in Investment Management and Services
GLOBAL INVESTMENT MANAGEMENT AND SERVICES
Asset Management
AuM : EUR 298.0 bnRecovery plan
Enhancing cost and revenue synergies, both with the GIMS business lines and the Group’s other divisions (launch of the SGAM AI and Lyxor merger project) Refocusing on target customers (retail networks and institutionals) Streamlined, innovative product range
Private Banking
AuM: EUR 73.0bnNet inflows: EUR 1.8bn
7.3% of assets on an annualised basisContinued business development Stable gross margin at 109 bp vs. 108 bp in Q3 07
Securities Services
Three leading businessesNewedge: a world leader in brokerage servicesTop 3 in securities custody and administration in Europe with EUR ~2,700bn of assets under custodyBoursorama: a major online brokerage player in France, Spain, UK, and Germany

15Presentation to Debt investors Winter 2008
Good revenue levels
NBI restated for non-recurring items(1):EUR 1,726m
+20.9% vs. Q3 07 and -8.5% vs. Q2 08Non-restated NBI: EUR 647m
Non-recurring items(1): EUR -1,079m
Reduction of riskier exposures and increasing of provisioning levels
Stable operating expenses over 9 months (-2.9%*) including expenditures linked to tighter control procedures
CORPORATE AND INVESTMENT BANKING
Impact of nonImpact of non--recurring items on total NBI recurring items on total NBI (in EUR m) (in EUR m)
NBI excl. nonNBI excl. non--recurring vs. accounting NBI recurring vs. accounting NBI (in EUR m) (in EUR m)
NBI excluding non-recurring items
Non-recurring items
1,428 1,472 1,532 1,886 1,726
-269
-2,133
31
-1,223 -1,079
6471,563 663-6611,159
Q3 07 Q4 07 Q1 08 Q2 08 Q3 08
Total non-recurring items: EUR -1,079m
+647
+262 +68 +606-1580
-4351,726
NBIexcl. Nonrecurring
items
MtM CDS
Reval.of fin.
liabilities& own shares
Early liquidation
of CDOs
Write-downs**
Lehman Book NBI(1) Non-recurring items are provided in the supplementary data, page 30* When adjusted for changes in Group structure and at constant exchange rates ** o.w. EUR -291m in unhedged CDOs, EUR -453m in monoline reserves,
EUR -57m in PACE, EUR -382m in assets purchased from SGAM,EUR -370m in the exotic credit derivatives portfolio,EUR -14m financial counterparties (excl. Lehman’s) andEUR -13m on the syndication book

16Presentation to Debt investors Winter 2008
Significant reduction of exposures at risk since Q1 08
Exotic credit derivatives
5-year equivalent net exposure: EUR -0.5bnvs. EUR -1.8bn at end-March 2008
• Reduction in size of hedged cash instrument portfolio:EUR 1.1bn of disposals in Q3 08
• Lower convexity risk
Reduced size of hedged portfolio: -3% vs. end-June 2008• Increase in residual exposure linked to more conservative
assumptions for hedged asset valuation and foreign exchangeeffects
• Coverage level maintained at 73%
Unhedged CDOs Net exposure: -36% vs. end-March 2008• Early unwinding of portfolio #1
ABS*(including ABS portfolio
bought from SGAM)
Net exposure: -30% vs. end-March 2008*• Disposals: EUR 0.6bn in Q3 08
31/03/2008 30/06/2008 30/09/2008
CORPORATE AND INVESTMENT BANKING
* The exposures at 31/03 and 30/06 do not include the Reserve Policy. Impact of including reserves on exposure at 30/09: EUR -0.3bn on at risk ABS’ and -0.3bn on ABS portfolio bought from SGAM.
Monolines
2,9 2,8
1,9
0,8 0,90,6
-1,8-1,1 -0,5
11,59,7
8,0
In EUR bn

17Presentation to Debt investors Winter 2008
452 432 321 407 350
355 327 439 44538292
390 270 299
569 432 367 487 499166 167
284 161
-72
112
75%71%66%83%98%1,428 1,472 1,532 1,886 1,726
322406281427437
744709717447310
660771534598681
Q3 07 Q4 07 Q1 08 Q2 08 Q3 08
Good commercial performance and prudent management of market risks
Equities: solid quarterGood commercial performanceResilient trading activities(1)
Fixed Income, Currencies and Commodities: sustained customer franchise growth
Record customer revenuesRise in trading income(1)
Financing and Advisory: a mixed performance
Good performance of infrastructure and natural resource financing; conditions unfavourable for leverage and property finance activitiesEuro capital market (primary market): global fall in volumes
CORPORATE ANDINVESTMENT BANKING
Distribution of NBIDistribution of NBI1)1) by divisionby division(in EUR m)(in EUR m)
(1) Excluding non-recurring items (restatements appear in supplementary data, page 33)
Equities
Fixed Income, Currencies and Commodities
Financing and Advisory
-14.4%-3.1%
SG CIB total
Share of client revenues
Change
Q3 / Q3 Q3 / Q2
+4.9%x2.4
-20.7%-26.3%
Client NBI Trading NBI
18Presentation to Debt investors Winter 2008
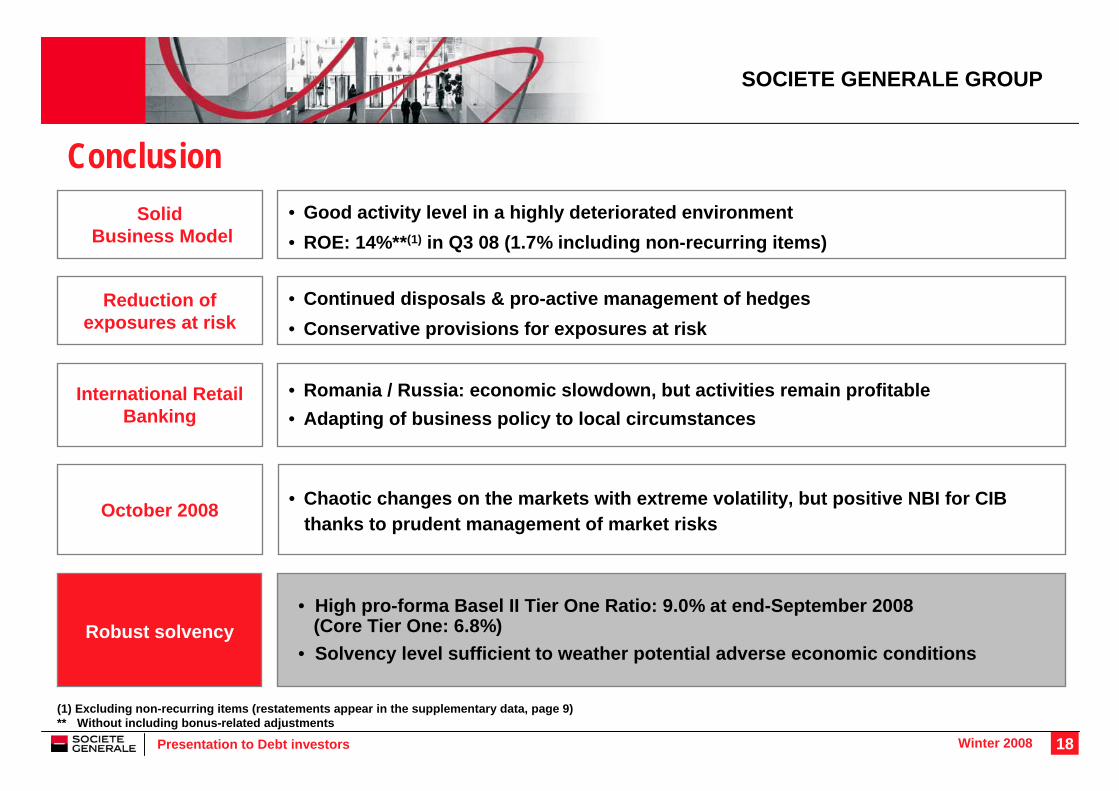
Conclusion
SOCIETE GENERALE GROUP
• Good activity level in a highly deteriorated environment• ROE: 14%**(1) in Q3 08 (1.7% including non-recurring items)
SolidBusiness Model
• Romania / Russia: economic slowdown, but activities remain profitable • Adapting of business policy to local circumstances
International Retail Banking
• Continued disposals & pro-active management of hedges• Conservative provisions for exposures at risk
Reduction of exposures at risk
• Chaotic changes on the markets with extreme volatility, but positive NBI for CIBthanks to prudent management of market risks
October 2008
• High pro-forma Basel II Tier One Ratio: 9.0% at end-September 2008 (Core Tier One: 6.8%)
• Solvency level sufficient to weather potential adverse economic conditionsRobust solvency
(1) Excluding non-recurring items (restatements appear in the supplementary data, page 9)** Without including bonus-related adjustments

19Presentation to Debt investors Winter 2008
SG Strategy and Q3 2008 Results
Group funding strategy
Supplements
20Presentation to Debt investors Winter 2008
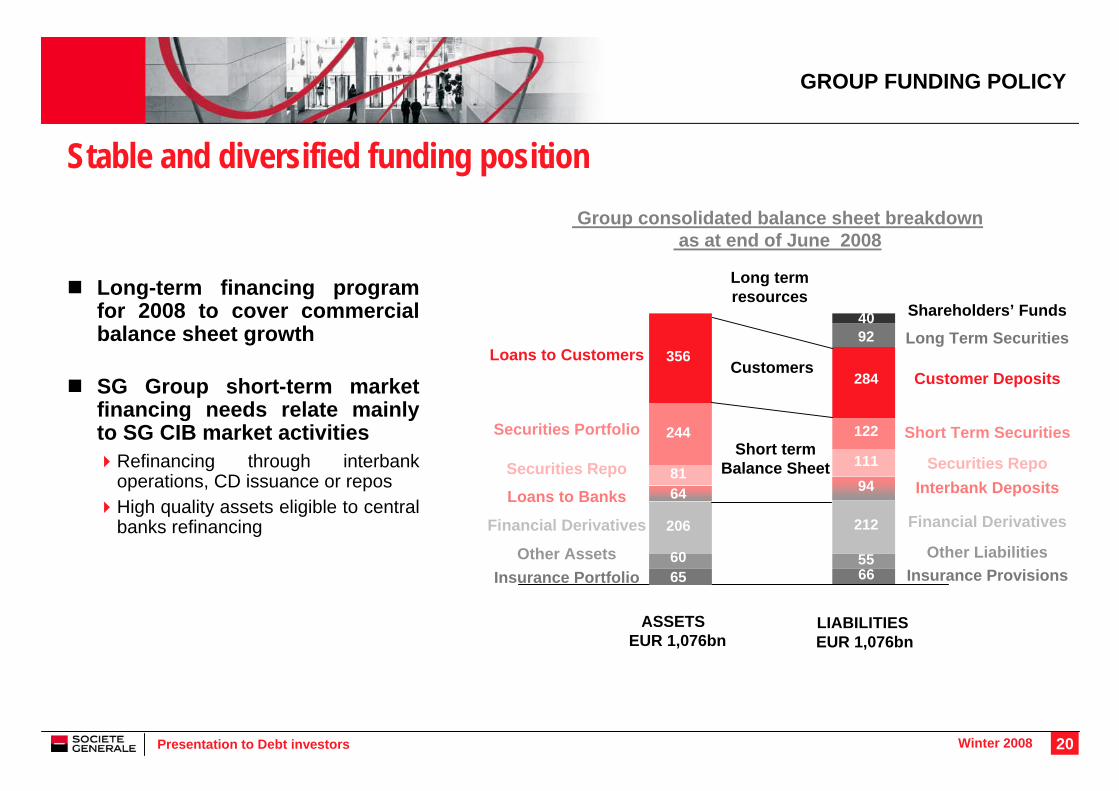
Stable and diversified funding position
Financial Derivatives
Shareholders’ Funds
Financial Derivatives
Other LiabilitiesInsurance Provisions
Group consolidated balance sheet breakdownas at end of June 2008
GROUP FUNDING POLICY
Loans to Customers
Loans to Banks
Securities Repo
Securities Portfolio
Customers
Short term Balance Sheet
6655
212
94111
122
284
9240
LIABILITIES EUR 1,076bn
Long-term financing program for 2008 to cover commercial balance sheet growth
SG Group short-term market financing needs relate mainly to SG CIB market activities
Refinancing through interbank operations, CD issuance or reposHigh quality assets eligible to central banks refinancing
Securities RepoInterbank Deposits
Customer Deposits
Long Term Securities
Short Term Securities
Other AssetsInsurance Portfolio
ASSETS EUR 1,076bn
Long term resources
60
6481
244
356
65
206
60
21Presentation to Debt investors Winter 2008
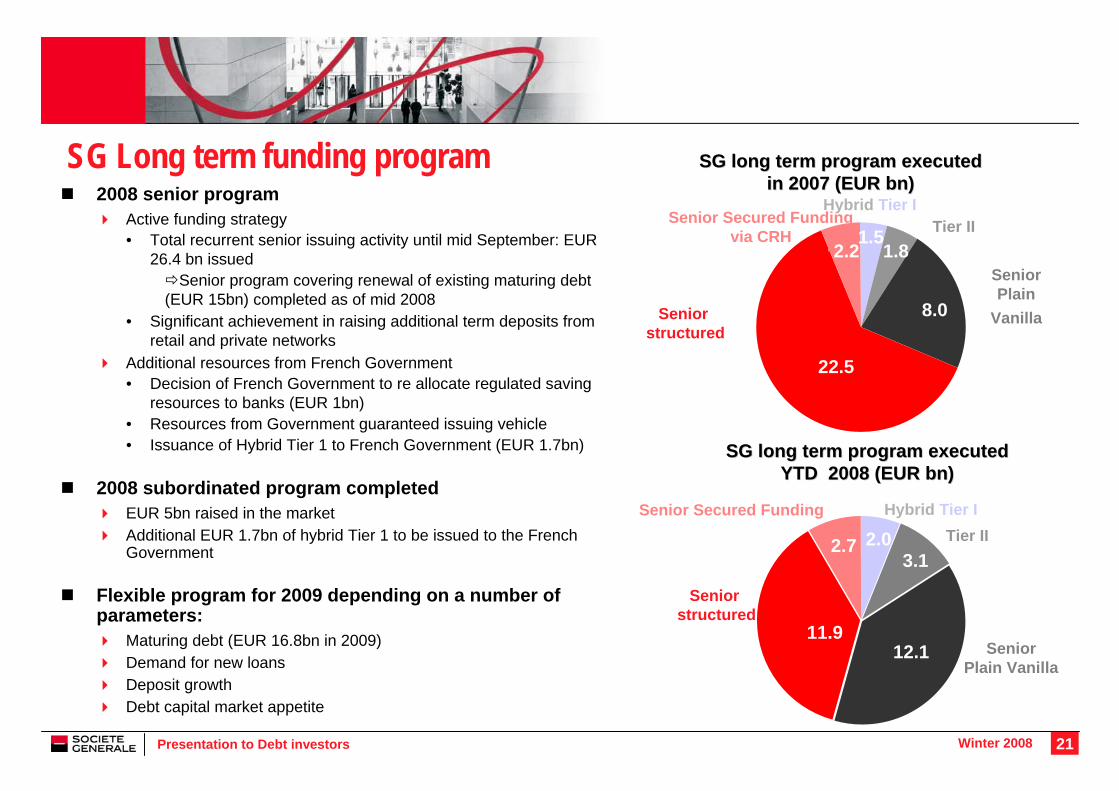
SG Long term funding program2008 senior program
Active funding strategy• Total recurrent senior issuing activity until mid September: EUR
26.4 bn issuedSenior program covering renewal of existing maturing debt
(EUR 15bn) completed as of mid 2008 • Significant achievement in raising additional term deposits from
retail and private networksAdditional resources from French Government• Decision of French Government to re allocate regulated saving
resources to banks (EUR 1bn)• Resources from Government guaranteed issuing vehicle• Issuance of Hybrid Tier 1 to French Government (EUR 1.7bn)
2008 subordinated program completedEUR 5bn raised in the marketAdditional EUR 1.7bn of hybrid Tier 1 to be issued to the FrenchGovernment
Flexible program for 2009 depending on a number of parameters:
Maturing debt (EUR 16.8bn in 2009)Demand for new loansDeposit growthDebt capital market appetite
SG long term program executed SG long term program executed in 2007 (EUR in 2007 (EUR bnbn))
22.5
2.2
8.0
1.81.5
SG long term program executed SG long term program executed YTD 2008 (EUR YTD 2008 (EUR bnbn))
Senior Plain
Vanilla
Tier IIHybrid Tier I
Senior Secured Funding via CRH
Seniorstructured
11.9
2.7
12.1
3.12.0
Seniorstructured
Senior Secured Funding Hybrid Tier ITier II
Senior Plain Vanilla

22Presentation to Debt investors Winter 2008
SG enjoys a well-balanced repayment scheduleMore than 50% of the outstanding securities issued are longer than 3 years
Our repayment schedule is well-balanced over time
Long Long TermTerm Securities Securities OutstandingOutstanding by by MaturitiesMaturities (as end of Sept 2008)(as end of Sept 2008)
2.4%3.2%1.0%
5.7%4.4%4.6%5.0%
12.4%12.3%11.7%
15.7%16.2%
5.3%
2009
2010
2011
2012
2013
2014
2015
2016
2017
2018
2019
between 10 et 15 years
over 15 yrs
subordinated liquidity senior benchmarks liquidity senior structured liquidity
GROUP FUNDING POLICY

23Presentation to Debt investors Winter 2008
SG Strategy and Q3 2008 Results
Group funding strategy
Supplements

24Presentation to Debt investors Winter 2008
Financing the economy: the French planFrench law of 16th October 2008 states that up to EUR 360bn is to be made through the establishment of 2 « corporations »
The State shareholding corporation (SPPE): up to EUR 40bn available to strengthen the capital ratios of credit institutions to restore confidence in their financial strength• On 21st October SPPE underwrote EUR 10.5bn of deeply subordinated debt issued by the 6 largest French
banks
French Financing Corporation (SFEF): up to EUR 265bn available to be injected into the French banking system• The SFEF will issue debt directly to the market, which will be guaranteed by the French state• The proceeds from SFEF debt raising will be used to provide funding to French credit institutions• To access this liquidity, credit institutions must pledge assets as collateral
SFEF working principlesSFEF will issue bonds to the market with maturity up to 5 yearsSFEF benefits• Explicit French State guarantee• Ratings: Aaa (Moody’s) / AAA (S&P) / AAA (Fitch)• Eligibility for ECB monetary policy operations• 0% RWA• Liquidity ensured
WORKING PRINCIPLES OF THE SFEF

25Presentation to Debt investors Winter 2008
A strong legal frameworkRobust Capital: a total of EUR 50m of capital raised by SFEF when it was established
34% of which came from the French state and66% from the banking sector, split equally between Banques Populaires, BNP Paribas, Caisse d’Epargne, Crédit Agricole, Crédit Mutuel, HSBC France and Société Générale, with 9.43% each
Strong Governance10 Administrators: 2 State Administrators, 1 Administrator from each of the 7 shareholders banks, 1 independent Administrator,1 Government Commissioner (the Head of French Treasury and Economic Policy or his representative) and1 censor (the Governor of the Banque de France or his representative)
State ControlThe State approved the SFEF’s executives and statutes.The State has a blocking minority. The Government Commissioner has a veto right in order to protect the French State financial interests . The issuer is also subject to supervision by the Banking Commission
State Guarantee: bonds issued by SFEF are explicitly guaranteed by the French Republic
WORKING PRINCIPLES OF THE SFEF

26Presentation to Debt investors Winter 2008
Financing mechanismAll French credit institutions will be allowed to borrow from the SFEF on the following terms:
They meet regulatory obligations on capital ratiosThey pledge eligible assets as collateralThey abide by a series of ethical guidelinesThey commit to granting new loans to the broader economy
Eligibility criteria for collateral pledged by French banks:Real estate loans made in France, under the form of a loan or pledge from a credit institution or insurance companyFirst tier French mortgages or guaranteed mortgagesLoans to local authoritiesLoans to well-rated corporatesLoans to French consumersLoans to credit export agenciesa controller will check the quality of collateral posted by banks
WORKING PRINCIPLES OF THE SFEF

27Presentation to Debt investors Winter 2008
Bond programme and inaugural transaction
The inaugural debt programme established by the SFEF is €25bn in size and will last until the end of Q1 2009. A second programme of a similar amount is expected after this date
The inaugural transaction off the first programme will be in benchmark size: terms indicative and conditions
Issuer: Société de Financement de l’Economie Française (SFEF)Rating: Aaa (Moody’s) / AAA (S&P) / AAA (Fitch)Status: Guaranteed senior debtNature of the guarantee: Autonomous, at first demand, unconditional and irrevocableGuarantor: French RepublicMaturity: 3 YearsAmount: EUR [3-5]bnRisk weighting: 0%Bookrunners: BNP Paribas, Calyon, HSBC, Natixis and SG CIBECB Eligibility: Yes – Category 3 under examinationLegal framework: French lawListing: Euronext Paris
WORKING PRINCIPLES OF THE SFEF
28Presentation to Debt investors Winter 2008
Market-making
Commitment between SFEF and the banks: the five largest French banks (BNP Paribas, Calyon, HSBC France, Natixis and Societe Générale) agreed with SFEF to be market-makers and therefore:
Provide optimal liquidity on SFEF’s securities with regards to current market conditionsTrade securities at quoted bid/ask prices and notional
Cash market: secondary bond market
Repo market: AFTB or GMRA agreement framework
Reporting: reports made to the issuer on a quarterly basis
Quotation page: one quotation page for each bank and one aggregated page
Eligible to: MTS France Agence
WORKING PRINCIPLES OF THE SFEF

29Presentation to Debt investors Winter 2008
Well-balanced loan portfolioGood risk profile of individual customer outstandings
Housing loans: 45% of total outstandings vs. 35% in 2001• Structurally low-risk activity• Approval criteria based on solvency • Pooling of risks through Crédit Logement
Good resilience of consumer loans:6% of total outstandings vs. 9% in 2001 • In-depth knowledge of customer behaviour through
current account monitoring
Business customers46% of total outstandings vs. 50% in 2001• In-depth knowledge of French corporates• Good sector diversification of commitments • Improved structuring of operations
Cost of risk mid cycle between 30 and 40 bp
Housing loans ≈ 5 bpConsumer loans and others ≈ 130 bpBusiness customer loans ≈ 50 bp
FRENCH NETWORKS
Housingloans
Businesscustomers
Consumerloans and others
Average loan outstandings(in EUR bn)
Financial Institutions
35% 37% 39%41% 44%
45%46% 45%
7%8%
9%9%
9%9%9%
6%
46%45%
44%
45%46%
48%49%50%
76.681.9
88.294.7
103.5
117.5
131.2
146.1
2001 2002 2003 2004 2005 2006 2007 9M 08

30Presentation to Debt investors Winter 2008
Impact of non-recurring items on pre-tax income
SUPPLEMENT - SOCIETE GENERALE GROUP
EUR m Q1 07 Q2 07 Q3 07 Q1 08 Q2 08 Q3 08 9M 07 9M 08French Networks - 36 - - - - 36 -
Euronext capital gain - 36 - - - - 36 -
International Retail Banking - - - - - 75 - 75 Asiban capital gain - - - - - 75 - 75
Global Investment Management and Services - 165 - 53 - 274 - - 12 112 - 286 Asset Management - - - 53 - 274 - - 12 - 53 - 286
Liquidity support provided to certain funds - - - 53 - 274 - - - 53 - 274 Impact of Lehman - - - - - - 12 - - 12
Private Banking - 1 - - - - 1 - Euronext capital gain - 1 - - - - 1 -
SG SS, Brokers and Online Savings - 164 - - - - 164 - Euronext capital gain at SG SS - 159 - - - - 159 - Euronext capital gain at Fimat - 5 - - - - 5 -
Corporate and Investment Banking - 6 60 - 269 31 -1,223 -1,079 - 215 -2,271Equities 1 20 - 2 200 - 68 - 152 19 - 20
Euronext capital gain at SG CIB - 34 - - - - 34 - Revaluation of financial liabilities + Own shares 1 - 14 - 2 200 - 68 7 - 15 139 Impact of Lehman - - - - 159 - - 159
Fixed Income, Currencies and Commodities 1 26 - 205 - 868 - 661 - 1,123 - 178 - 2,652 Revaluation of financial liabilities - - - 323 - 79 61 - 305 Losses and write-downs on exotic credit derivatives 14 10 - - 417 - 372 - 370 24 - 1,159 Write-down of unhedged CDOs - 5 - 37 - 124 - 350 - 20 315 - 166 - 55 Write-down of monolines - - - - 203 - 98 - 453 - - 754 Write-down of RMBS - 8 - 29 - 64 - 43 - 15 - - 101 - 58 Write-down of European ABS sold by SGAM - - - 17 - 166 - 84 - 382 - 17 - 632 Write-down/Reversal of SIV PACE - - - - 12 7 - 57 - - 62 ICE capital gain - 82 - - - - 82 - Impact of Lehman - - - - - - 223 - - 223 Islandic banks - 14 - 14
Financement et Conseil - 8 14 - 62 699 - 494 196 - 56 401 Mark to Market value of CDS' - 8 14 36 743 - 501 262 42 504 Write-down/Reversal of Non IG transactions in underwriting - - - 98 - 44 7 - 13 - 98 - 50 Impact of Lehman - - - - - - 53 - - 53
Corporate Centre - - - - 306 - 142 - 164 Revaluation of financial liabilities at Crédit du Nord - - - - 44 - - 44 Capital gain on Muscat - - - - 262 - - 262 Write-down of equity portfolio - - - - - - 142 - - 142
Total impact on GROUP NBI - 6 261 - 322 - 243 - 917 -1,158 -67 -2,318Private Banking - - - - - - 10 - - 10
Allocation to Washington Mutual - - - - - 10 - - 10 Corporate and Investment Banking - - - - 282 - - 40 - - 322
Allocations to a few accounts - - - - 282 - - 40 - - 322
Corporate Centre - - - 602 - - - 602 Capital gain on Fimat - - - 602 - - - 602
- 6 261 -322 77 -917 -1,208 -67 -2,048
Non-recurring items in NBI
Net gain on other assets
Total impact on GROUP
Net alloc. to provisions
31Presentation to Debt investors Winter 2008
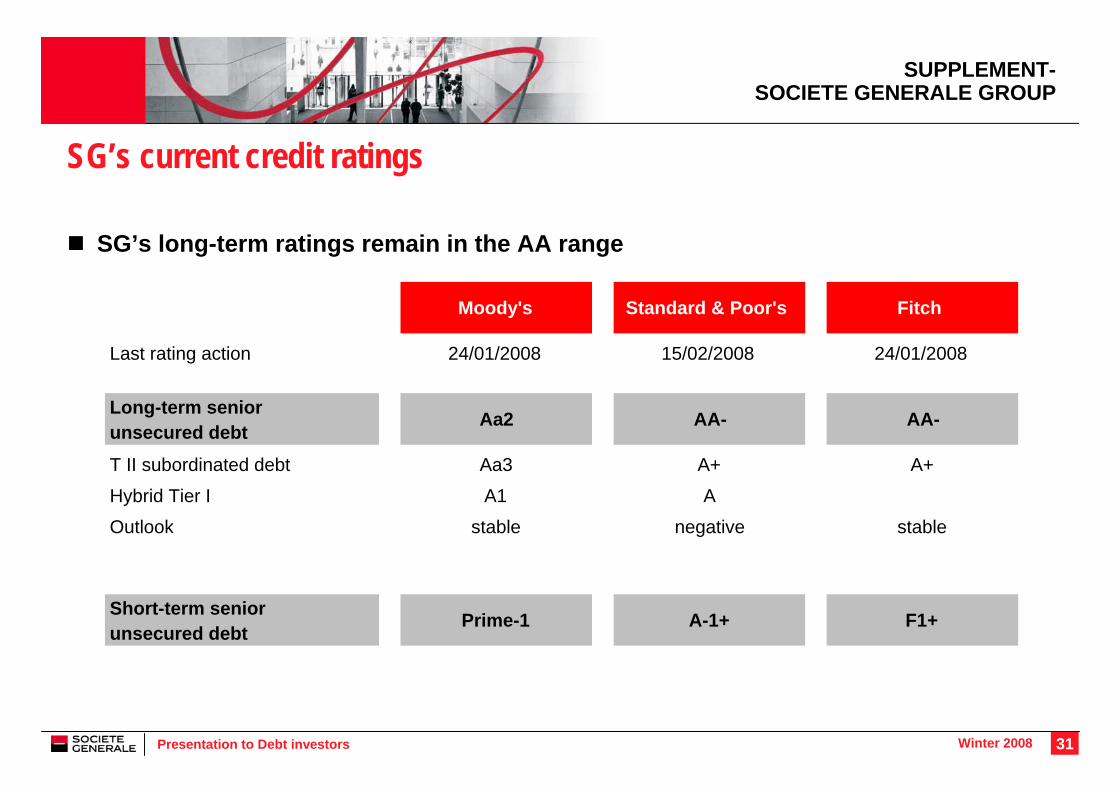
SG’s current credit ratings
SG’s long-term ratings remain in the AA range
Moody's Standard & Poor's Fitch
Last rating action 24/01/2008 15/02/2008 24/01/2008
Long-term seniorunsecured debt
Aa2 AA- AA-
T II subordinated debt Aa3 A+ A+
Hybrid Tier I A1 A
Outlook stable negative stable
Short-term seniorunsecured debt
Prime-1 A-1+ F1+
SUPPLEMENT-SOCIETE GENERALE GROUP

32Presentation to Debt investors Winter 2008
Gro
up b
ook
capi
tal
(afte
r dis
tribu
tion)
OCI
DeeplySub. Notes
Undated Sub.Notes
RO
E ca
pita
l (*)
Goodwill,Fixed Assets
& Other
MinorityInterests
Pref. shares
DeeplySub. Notes
Bas
el I
Tier
One
cap
ital
Basel II deductions
Bas
el II
Tie
r O
ne c
apita
l
29.8 29.9
28.9
+0.8
-4.5
-9.0
+3.2+1.4
+4.5
-0.9
-1.0
34.4
Calculation of ROE Capital and the Tier One ratioData at end-Sept. 2008 in EUR bn
Accounting adjustmentPrudential adjustment Additional prudential adjustment
(*) Data at the end of the period; ROE is calculated based on the average capital at the end of the period
SUPPLEMENT APPLICATION OF THE BASEL II REFORM

Investor RelationsPatrick SOMMELET, Louise DE L’ESTANG, Stéphane MARTY, Nathalie SAND
Tel.: +33 (0) 1 42 14 47 72E-mail: [email protected] - Internet: www.investisseur.socgen.com