
Sociology An Invitation to Sociology An Invitation to Sociology Chapter 01 01.

http://soe.sagepub.com/
Sociology of Education
http://soe.sagepub.com/content/83/3/248The online version of this article can be found at:
DOI: 10.1177/0038040710375689
2010 83: 248Sociology of EducationCatherine Riegle-Crumb and Eric Grodsky
AchievementRacial-Ethnic Differences at the Intersection of Math Course-taking and
Published by:
http://www.sagepublications.com
On behalf of:
American Sociological Association
can be found at:Sociology of EducationAdditional services and information for
http://soe.sagepub.com/cgi/alertsEmail Alerts:
http://soe.sagepub.com/subscriptionsSubscriptions:
http://www.sagepub.com/journalsReprints.navReprints:
http://www.sagepub.com/journalsPermissions.navPermissions:
at Serials Records, University of Minnesota Libraries on October 14, 2010soe.sagepub.comDownloaded from

Racial-Ethnic Differences atthe Intersection of MathCourse-taking andAchievement
Catherine Riegle-Crumb1 and Eric Grodsky2
Abstract
Despite increases in the representation of African American and Hispanic youth in advanced math courses inhigh school over the past two decades, recent national reports indicate that substantial inequality in achieve-ment remains. These inequalities can temper one’s optimism about the degree to which the United Stateshas made real progress toward educational equity. Using data from the Education Longitudinal Study of 2002(ELS), the authors find that the math achievement gap is most pronounced among those students who takethe most demanding high school math classes, such as precalculus and calculus. The authors explore theroles of family socioeconomic status and school composition in explaining this pattern. Findings suggestthat among those students reaching the advanced math high school stratum, Hispanic youth from low-income families and African American youth from segregated schools fare the worst in terms of closingthe achievement gap with their white peers. The authors discuss potential explanations for the achievementdifferences observed and stress the need for more research that focuses explicitly on the factors that inhibitminority/majority parity at the top of the secondary curricular structure.
Keywords
math, course-taking, race-ethnicity, segregation, social class
The legitimacy of the prevailing status hierarchy
among adults in the United States is predicated
on equality of opportunity among children, yet
evidence that minority-majority academic
achievement gaps grow larger as children age
and move through the school system suggests
that educational opportunities are not independent
of racial/ethnic and social origins (Fryer and
Levitt 2006; Jencks and Phillips 1998; Neal and
Johnson 1996). Although such inequalities are
objectionable on moral and social justice grounds
alone, these educational inequalities are also
increasingly problematic from a strictly instru-
mental perspective. White youth as a share of
the population of children in the United States
have been declining since 1980 and are projected
to continue to do so through 2020, while the share
of youth who are of Hispanic origin will continue
to increase until Hispanics account for 1 in 5 of all
children in the country (Federal Interagency
Forum on Child and Family Statistics 2006). In
order for the United States to continue producing
large numbers of highly educated and skilled
workers, we must improve the educational out-
comes for nonwhite youth.
1University of Texas at Austin, Austin, TX, USA2University of Minnesota, Minneapolis, MN, USA
Corresponding Author:
Catherine Riegle-Crumb, Department of Curriculum and
Instruction, College of Education, Austin, TX 78705, USA
Email: [email protected]
Sociology of Education83(3) 248–270
� American Sociological Association 2010DOI: 10.1177/0038040710375689
http://soe.sagepub.com
at Serials Records, University of Minnesota Libraries on October 14, 2010soe.sagepub.comDownloaded from

Previous research on racial/ethnic educational
disparities has focused attention on minority under-
representation in advanced classes, particularly in
the subject of math, as a key marker of inequality
that leads not only to a test score gap (Catsambis
1994; Dauber, Alexander, and Entwisle 1996; Lee
and Bryk 1988; Mickelson and Heath 1999;
Pallas and Alexander 1983) but also contributes
to minority students’ lower rates of college matric-
ulation (C. Adelman 1994). Therefore, scholars of
education and race continue to explore whether
minority youth are given the same opportunities
to reach advanced classes as their majority peers
(Attewell and Domina 2008; Lucas and Berends
2007; Mickelson 2001; Noguera and Wing 2006).
For example, a recent article by Kelly (2009) utiliz-
ing data from the National Education Longitudinal
Study (NELS) of 1988 found that black students
are much less likely to be in high-track math
courses than their majority peers.1
In contrast, research has paid much less atten-
tion to the academic outcomes of minority students
within advanced courses vis-a-vis their white peers.
And while there is evidence that African American
and Hispanic participation in higher-level courses
has markedly increased, inequality in achievement
stubbornly remains. For example, from 1997 to
2005, the share of disadvantaged minority students
taking Advanced Placement (AP) exams almost
doubled, narrowing the gap in test-taking with their
white peers (U.S. Department of Education,
National Center for Education Statistics 2007).
However, while the exam scores of white students
remained stable during this period, the average
scores of minority students declined. Among
Hispanic students, average scores decreased from
3.1 in 1997 to 2.5 in 2005, and the percentage of
black students earning a score of 3 or higher
decreased from approximately 36 percent to 29 per-
cent. These results are consistent with a recent
National Assessment of Educational Progress
(NAEP) report documenting a strong increase since
1990 in the completion of advanced courses in
a range of subjects by African American and
Hispanic youth that is not accompanied by an
increase in achievement test scores (Shettle et al.
2007). At best, trends of increasing minority repre-
sentation in elite academic domains absent a paral-
lel increase in achievement suggest only limited
progress toward educational equity. At worst,
such findings suggest that the advanced courses
available to underrepresented youth are advanced
in name but not in substance. In either case, we
currently know little about the patterns and predic-
tors of minority achievement for those students
who are successful in reaching advanced classes
by the end of high school.
We address two primary research questions in
this article. First, are the racial/ethnic gaps in math
achievement more pronounced among high school
seniors who took advanced classes than among
students who had not taken any math course
beyond algebra 2? Second, if this is the case,
then to what extent do differences in either the
levels or the effects of family socioeconomic re-
sources and school racial/ethnic composition con-
tribute to racial/ethnic gaps in math achievement
among students across different levels of mathe-
matics course-taking? In addressing both of these
questions, we consider the gap between African
American and white students and between
Hispanic and white students. The latter disparity
has received comparatively less attention in the
educational stratification literature. As growth in
the Hispanic share of the population continues to
outpace growth in other racial/ethnic groups,
understanding the sources of the Hispanic/white
achievement gap is increasingly pressing.2
Building on a growing body of recent research
that finds that racial/ethnic inequality is often
most pronounced at the high end of the achieve-
ment distribution (Gandara 2005; Hanushek and
Rivkin 2006; Hedges and Nowell 1999), we expect
to find that minority students in advanced math
courses are actually further behind their white peers
in terms of achievement than are students in lower-
level classes. We argue that racial/ethnic disparities
in family socioeconomic level and school racial/
ethnic composition might be more consequential
for academic achievement and growth at the high
end of the curriculum, leading to a more pro-
nounced test score gap there than at the lower
end of the curriculum. To explore these issues,
we utilize recent survey and high school transcript
data from a nationally representative cohort of high
school seniors available from the Education
Longitudinal Study of 2002 (ELS).
BACKGROUND
Advanced Math Course-taking inHigh School
The hierarchical organization of high school
math courses is a key mechanism of academic
Riegle-Crumb and Grodsky 249
at Serials Records, University of Minnesota Libraries on October 14, 2010soe.sagepub.comDownloaded from

stratification. A highly structured system of pre-
requisites that begins in middle school with alge-
bra or prealgebra dictates that only those students
who have mastered the curriculum and met teach-
ers’ expectations consistently over a period of
many years are given the chance to participate
in advanced math courses such as precalculus
and calculus (Burkam, Lee, and Smerdon 1997;
Dougherty, Mellon, and Jian 2006; Stevenson,
Schiller, and Schneider 1994). Enrollment in
advanced courses, particularly those beyond the
critical threshold of algebra 2, substantially in-
creases the probability that students will attend
college, and in particular that they will attend
a selective college or university (C. Adelman
1999; Schneider, Swanson, and Riegle-Crumb
1998). Advanced math course-taking in high
school is also a strong determinant of degree com-
pletion among those who attend college
(C. Adelman 1994, 1999). Equality of educational
opportunity with respect to enrolling in advanced
math classes is therefore an issue of consequence
well beyond the walls of the high school.
The share of high school students in advanced
math has dramatically increased over the past few
decades. For example, the total percentage of stu-
dents who took math courses above algebra 2
increased by almost 25 percentage points from
1982 to 2004 (Dalton et al. 2007). Growth in partic-
ipation rates during this period was particularly pro-
nounced among minority youth. While about
3 percent of African American and Hispanic high
school graduates in the class of 1982 had completed
a precalculus course, around 15 percent of African
American and Hispanic youth in the class of 2004
had done so. The black/white gap in advanced
course-taking narrowed by 5 percentage points dur-
ing this period, decreasing from approximately 17
to 12 percentage points (Dalton et al. 2007).
The increased movement of students into
higher-level math courses over the past few deca-
des is the result of a myriad of policy recommen-
dations and educational reforms stressing the
importance of math and increasing course require-
ments for high school graduation (Dougherty et al.
2006). Widely disseminated results from the Third
International Mathematics and Science Survey
(TIMSS) in the mid-1990s made starkly apparent
that the math achievement levels of our nation’s
students were far behind those of students in other
industrialized nations. At the same time, the
country’s technological sector was experiencing
exponential growth. These divergent trends led
policymakers to turn their attention to K-12 edu-
cation with a reinvigorated focus reminiscent of
that seen during the years after Sputnik launched
in 1957. Unlike the post-Sputnik period, however,
there has been a heightened focus on minority (as
well as female) youth motivated at least in part by
the need to increase ‘‘America’s talent pool’’
(National Research Council 2009). Attention to
pulling in traditionally underrepresented groups
was driven not only by concerns of equity but
also by the demographic and economic realities
the nation confronts. The future economic well-
being of this country rests on a large scientifically
and technologically trained labor force, and one
where whites will soon comprise a minority.
Thus, alongside a general emphasis toward
improving educational opportunities and achieve-
ment in math there also came a particular empha-
sis on access and encouragement for African
American and Hispanic students to pursue and
excel in math.
Room at the Top . . . but Equity?
As noted previously, the push to give minority youth
access to advanced math courses has increased the
numbers of African American and Hispanic students
taking such classes nationwide. Yet improved
access is a necessary but insufficient component
for providing equal educational opportunities for
all youth. Without levels of achievement compara-
ble to those of their white peers, minority students
taking the most advanced high school math courses
remain in a position of disadvantage. In fact, we
suggest that minority students in advanced math
courses in high school may trail their white counter-
parts in achievement test scores to an even greater
degree than do students in lower-level courses.
We explore whether the achievement gap among
those taking advanced courses is more pronounced
than at lower levels of the curriculum due to major-
ity-minority disparities in two key factors: family
socioeconomic background and school racial/ethnic
composition. Additionally, while most past research
has focused on how differences in levels of these re-
sources contribute to differences in academic
achievement (Catsambis 1994; Lucas 1999; Oakes
1990; Stevenson et al. 1994), some work suggests
racial/ethnic differences in the magnitude of the
association between these attributes and academic
achievement.
In the following sections, we discuss the extant
literature on the relationship between family
250 Sociology of Education 83(3)
at Serials Records, University of Minnesota Libraries on October 14, 2010soe.sagepub.comDownloaded from

socioeconomic background, school racial/ethnic
composition, and students’ patterns of achieve-
ment. We begin by briefly discussing how each
set of factors influences racial/ethnic patterns of
achievement in general. We then consider why
racial/ethnic disparities in these family and school
resources might contribute more to achievement
gaps among those students at the advanced end
of the high school math curriculum than to gaps
among those completing less rigorous courses of
study. Finally, we discuss why we might expect
to observe differential returns of both socioeco-
nomic background and school composition for
the achievement of minority students in advanced
math classes compared to their majority peers.
Socioeconomic background. Social class differ-
ences in students’ families account for a substan-
tial portion of the achievement gap between
majority and minority youth, as African
American and Hispanic parents have historically
had lower levels of education, occupational status,
and income compared to whites (Hedges and
Nowell 1999). The rich existing literature on
how socioeconomic background contributes to
student achievement has pointed to several differ-
ent mechanisms for this transmission of advan-
tage. More advantaged parents tend to have
greater familiarity with the educational system,
thus providing their children with information of
higher quality and certitude that subsequently en-
ables their children to apply themselves more suc-
cessfully than their less advantaged peers to their
academic work (Morgan 2002, 2005). More
advantaged parents have also historically had
higher educational and occupational aspirations
for their children than less advantaged parents,
and these aspirations contribute directly to varia-
tion in academic achievement (Sewell, Haller,
and Ohlendorf 1970). Socioeconomic advantage
may operate through more subtle developmental
pathways as well. Children of middle- and
upper-class parents, for example, learn at an early
age to communicate verbally and nonverbally in
ways that are rewarded in school (Bourdieu and
Passeron 1990; Hart and Risley 1995), affecting
a sense of entitlement in their interactions with
their teachers (Lareau 2003).
Socioeconomic differences between white and
minority students may be particularly important
with regard to students’ achievement at the high
end of the course-taking distribution. For exam-
ple, parents with baccalaureate or advanced de-
grees tend to feel more comfortable than less
educated parents confronting school personnel
about their child’s education, including obtaining
access to advanced courses and requesting timely
and detailed information about their child’s aca-
demic progress and needs (Lareau 2000). They
are also more likely to be able to assist their chil-
dren with coursework and homework or acquire
the assistance of others to help if necessary
(Baker and Stevenson 1986; Davies 2004). Thus,
while differences in the resources that families
of different social origins have at their disposal
are likely contributors to the achievement gap
for students at all levels of the math curriculum,
such class disparities may be even more pro-
nounced or magnified in their academic implica-
tions for students taking advanced courses such
as precalculus.
In addition to differences in levels of socioeco-
nomic resources, the effects of social origins may
vary considerably across racial/ethnic groups.
There is evidence suggesting the academic
achievement of African American youth, and to
a lesser extent Hispanic youth, is less sensitive
to parental education and other aspects measures
of socioeconomic status than the achievement lev-
els of white youth (Gosa and Alexander 2007;
Grodsky, Kalogrides, and Siebens 2007;
Lubienski 2002). For example, analyzing NAEP
reading test scores, a report by the College
Board (1999) found that the black-white test score
gap was indeed largest among youth with college
educated parents.
While the reasons for such disparities are
unclear, Gosa and Alexander (2007) offer several
candidate explanations in their review of the liter-
ature. For example, African American families in
the upper and middle class possess less wealth
than similarly positioned whites and are more
likely to spend their financial and other resources
to help support extended kin who are less well
off. They and others also speculate that the greater
socioeconomic heterogeneity of African American
neighborhoods compared to white neighborhoods
may work to attenuate the association between
parent socioeconomic status and academic
achievement. Even among relatively advantaged
African Americans, median neighborhood income
and housing values are lower than for comparable
whites (Alba, Logan, and Stults 2000; Massey
and Denton 1993), and the share of neighborhood
households in poverty is greater (R. Adelman
2004). As a result of greater intrafamilial and
neighborhood variation in socioeconomic status,
Riegle-Crumb and Grodsky 251
at Serials Records, University of Minnesota Libraries on October 14, 2010soe.sagepub.comDownloaded from

more advantaged African American students
have greater exposure to poor and working-class
peers than do more advantaged white students
(Patillo-McCoy 1999), and may therefore have
less access to community reinforcement of the
academic norms and attitudes typically associ-
ated with higher levels of socioeconomic attain-
ment. Furthermore, while indicators such as
highest degree attained and yearly income are
typical markers of a family’s access to social
and economic resources, they nevertheless fail
to capture important distinctions such as the
selectivity of the postsecondary institution pa-
rents attended or the social networks to which pa-
rents have access, both of which are mechanisms
through which parents can transmit advantage to
their children and areas where minority parents
may be further disadvantaged (Kim and
Schneider 2005; Massey and Fischer 2006;
McNeal 1999). This dilution of middle-class
advantage among African Americans (and poten-
tially among Hispanics) may lead to less benefi-
ciary outcomes for these youth compared to their
white peers, particularly in advanced math
classes where the curriculum becomes the most
demanding and academic effort as well as aca-
demic support from parents and peers assume
greater levels of importance.
Racial/ethnic composition. Although findings
vary to some extent, past research generally shows
that youth attending schools with a higher share of
minority students tend to have lower levels of aca-
demic achievement as measured by scores on
standardized tests (Linn and Welner 2007). A pri-
mary argument for the relationship between
school segregation and achievement focuses on
differences in the quantity and quality of school
resources available to students. The resource argu-
ment was most famously evaluated and rejected
by Coleman and his colleagues (1966), and a spate
of subsequent studies reinforced their conclusion
that schools’ economic resources were not the
cause of inequality in achievement between
minority and majority youth (G. Borman and
Dowling 2006). More recent studies, however,
present strong evidence to the contrary, particu-
larly with regard to characteristics of teachers
(Jencks and Phillips 1998). Teachers in schools
with high percentages of African American and
Hispanic students have fewer years of experience,
are less likely to be fully credentialed, and are
more likely to be teaching out of their field(s) of
expertise, particularly in math, than teachers in
predominately white schools (Clotfelter, Ladd,
and Vigdor 2005; Darling-Hammond 2001;
Mickelson and Heath 1999). Some studies suggest
that teachers expect less in terms of ability and
performance from students in high-concentration
minority schools (Delpit 1992; Flores 2007;
Ream 2003). Thus, to the extent that school segre-
gation exposes minority students to less qualified
teachers who expect less from them, their achieve-
ment is likely to suffer.
A specific aim of the present study is to deter-
mine whether the racial/ethnic composition of
schools contributes more to explaining the gap
between minority and majority students at the
high end of the math course-taking spectrum in
high school compared to the lower end. We pro-
pose that the negative effect of school segrega-
tion on achievement test scores of minority
youth may increase with the assumed demand
of their academic courses. Schools that serve
a large share of minority students may lack the
instructional resources, such as highly qualified
teachers, needed to provide opportunities to learn
for their most advanced students. Teachers and
staff in high-minority schools are likely to be
focused instead on ensuring that less academi-
cally successful students meet the necessary
achievement thresholds to avoid sanctions
(Booher-Jennings 2005). This emphasis may fur-
ther serve to discourage the educational efforts of
those students taking advanced courses in pre-
dominantly minority schools.
Yet while the resource argument may be well
suited to explain why the academic trajectories
of higher-achieving students are constrained by
segregation, it is perhaps less suited to explain
a pattern noted in several recent studies.
Namely, the achievement levels of academically
strong minority students appear to be more sensi-
tive to racial/ethnic composition than the achieve-
ment levels of similar white students (Hanushek
and Rivkin 2006; Hoxby and Weingarth 2006;
K. M. Borman et al. 2004). For example,
Hanushek and Rivkin (2006) find that school seg-
regation has a more detrimental effect on the
growth in achievement between third and eighth
grade of initially high-scoring African American
students than comparable white students. In fact,
Hanushek and Rivkin (2006) report that high-
achieving white students are not impacted one
way or the other by attending high-minority
schools while African American students are
harmed by doing so.
252 Sociology of Education 83(3)
at Serials Records, University of Minnesota Libraries on October 14, 2010soe.sagepub.comDownloaded from

Social-psychological explanations more spe-
cifically address why the negative effects of segre-
gation on achievement could be concentrated on
minority youth. Most notably, Fordham and
Ogbu (1986) argued that high-minority schools
contribute to the development of an oppositional
peer culture where students reject academic norms
of effort, engagement, and performance as ‘‘acting
white,’’ which subsequently leads to under-
achievement.3 Recent studies undermine the dis-
tinctly racial dimension of oppositional culture,
offering evidence that antischool attitudes and be-
haviors are widespread among minority and white
youth alike (Ainsworth-Darnell and Downey
1998; Harris and Robinson 2007; Morgan and
Mehta 2004) and across schools varying widely
in their racial/ethnic composition (Cook and
Ludwig 1998; Tyson 2002; Tyson, Darity, and
Castellino 2005). For example, Kelly (2007)
found no evidence that antischool norms were
more prevalent in predominantly black classrooms
and concluded that lack of school engagement is
not the mantle of any one particular racial/ethnic
group, but rather a characteristic common to all
students with weak prior academic skills. Based
on the existing research, it therefore seems
unlikely that oppositional culture underlies the
association between school segregation and aca-
demic achievement; moreover, it has little to offer
in terms of explaining why high-achieving minor-
ity students may be the most susceptible to the
negative consequences of segregation.
Perhaps a more relevant explanation for such
patterns is stereotype threat. Specifically, minority
students who strongly identify with mathematics
(or academics more generally) may fail to perform
to their potential on an assessment due to anxiety
or distraction caused by invoking a negative
performance stereotype regarding the academic
performance of minority students (Sackett,
Hardison, and Cullen 2004; Steele 1997; Steele
and Aronson 1998). As we would generally expect,
students in advanced math classes to have a rela-
tively strong attachment to academics, it seems log-
ical that minority students in classes such as
calculus and precalculus might be the most vulner-
able to such threats. To the extent that white stu-
dents are overrepresented in the most demanding
classes even within high-minority schools (Tyson
et al. 2005), stereotype threat might well inhibit
the academic performance of African American
and perhaps Latino students. On the other hand,
racial/ethnic stereotypes of inferior academic
performance might be less salient in schools with
a high minority concentration.
Given the limitations of the data on which we
base this research, we can only speculate about the
ultimate causes of any association between segre-
gation and academic achievement that we
observe. It is beyond the scope of this study to
adjudicate between arguments about the negative
social-psychological consequences of segregation
on one hand and the negative consequences of
insufficient financial, structural, and human re-
sources on the other. Instead, a primary focus of
our analyses is to discern whether minority stu-
dents taking the most advanced math courses are
the ones most negatively affected by attending
highly segregated schools.
The Temporal Dimension of theAchievement Gap
As learning new skills and gaining new knowl-
edge in mathematics is necessarily cumulative,
the lower relative achievement levels of African
American and Hispanic students at the end of
high school reflect both recent and more distal in-
equalities in their opportunity to learn. Phillips,
Crouse, and Ralph (1998) find that approximately
one half of both the reading and math test score
gap between blacks and whites at the end of
high school is attributable to the comparatively
lower skill levels of blacks in elementary school.
Yet achievement disparities emerge and continue
to grow during secondary school even once one
conditions on initial school readiness. Therefore,
in this article we distinguish between racial/ethnic
differences in learning over the latter two years of
high school and cumulative racial/ethnic differen-
ces in academic achievement by estimating mod-
els with and without controls for prior academic
achievement.
Neither growth models nor cross-sectional
models alone sufficiently capture the disparities
in achievement we seek to explain. The cross-
sectional models allow us to consider the long-
run associations of social class and school compo-
sition with achievement disparities at different lev-
els of mathematics course-taking. Confining our
attention to changes in knowledge over the last
two years of high school would ignore the extent
to which the inequalities born by black and
Hispanic students have compounded over the pri-
mary and secondary years. On the other hand, anal-
yses that condition on prior achievement lead to an
Riegle-Crumb and Grodsky 253
at Serials Records, University of Minnesota Libraries on October 14, 2010soe.sagepub.comDownloaded from
estimate of the net contribution of social class and
segregation to achievement during the later years of
high school, accounting for the fact that both are
likely tied to students’ achievement at earlier time
points in their educational trajectories. Therefore,
by estimating models with and without controls
for prior academic achievement, we can better dis-
cern whether and when family social background
and school composition exert their influence on
the majority-minority achievement gap among
advanced and nonadvanced students.
DATA
We base our analyses on a nationally representa-
tive sample of students who were high school
sophomores in 2002 and participated in the
ELS. Subsequent follow-ups were conducted in
2004, when most students were seniors, and
2006. We restricted our analytic sample to
students in public schools, as course-taking
requirements and options vary significantly
across school sector (Coleman, Kilgore, and
Hoffer 1982). We further restrict our sample to
students who had complete transcript information
available during the latter two years of high
school.
We draw primarily on data collected from
students, their parents, and school administrators.
Students completed achievement tests in
math and reading as sophomores and math as se-
niors. Additionally, students’ high school tran-
scripts were collected and coded using the
Classification of Secondary School Course
(CSSC) codes. These were developed by the
National Center for Education Statistics (NCES)
and used in prior transcript studies such as the
National Education Longitudinal Study of 1988
(NELS). Using the CSSC codes, we constructed
a dichotomous measure of the highest level of
math that students reached by the end of high
school. Students in advanced math completed at
least one course beyond algebra 2, including trig-
onometry, AP statistics, precalculus, or calculus.
While algebra 2 is generally considered the math
threshold for college admission, students who
take courses beyond algebra 2 score higher on
entrance examinations and have greater likeli-
hoods of attending college in general (and more
selective colleges and universities in particular),
as well as graduating from college, than students
who meet but do not exceed the algebra 2
threshold (C. Adelman 1999). We divide our sam-
ple into two strata based on whether or not stu-
dents completed any math course beyond
algebra 2 and conduct separate analyses for each
group. Stratifying students by this dichotomous
indicator of course level reduces but does not
eliminate heterogeneity in students’ curricular
exposure in math. Therefore, we include a dichot-
omous indicator of whether advanced students
reached calculus and whether nonadvanced stu-
dents took courses beyond the basic or general
math levels.
Our dependent variable is student’s senior year
math achievement test score, scaled as the number
of items the student would have answered cor-
rectly had he or she taken the complete mathemat-
ics test (based on the student’s IRT scale score).
The ELS math tests consist of multiple test forms
varying in average difficulty. Students in the base
year all took a routing test and, based on the out-
come of that assessment, were given one of three
assessment batteries (low, medium, and high diffi-
culty). Assignment to 12th-grade forms was based
on performance on the 10th-grade assessments for
students who participated in both the base year
and first follow-up (Ingels et al. 2007).
The independent variables in our analyses are
taken from the 10th-grade surveys. We distinguish
among Hispanic, African American, and non-
Hispanic white students based on students’ self-
reports. We excluded Asian students and those
who identified as Native American or other from
our analyses. To capture the socioeconomic status
of the student’s family, we include indicators for
both parental education level and family income
from the ELS parent questionnaire.4 Parental edu-
cation is the highest level of education attained by
either of the student’s parents, ranging from the
lowest value of 1 for those with less than a high
school degree to the highest value of 8 for those
with an advanced degree. To measure family
income, we recoded the original ordinal indicator
by taking the midpoint of each income category
and estimating the midpoint of the highest cate-
gory via a modified Pareto formula (Hout 2004;
also see Table A.1 in the appendix for complete
information on the coding of this and all other var-
iables in the analyses; online appendix available at
http://soe.sagepub.com/supplemental).5 To cap-
ture the potentially deleterious effects of school
segregation on achievement, we include a measure
of the percentage of the student body that is either
African American or Hispanic. This information
254 Sociology of Education 83(3)
at Serials Records, University of Minnesota Libraries on October 14, 2010soe.sagepub.comDownloaded from

comes from the Common Core of Data (CCD) via
the school survey in ELS. Additionally, because
we are interested in evaluating the contributions
of differences in levels and associations of family
socioeconomic background and school composi-
tion to the majority-minority achievement gap,
we construct interaction terms between students’
race-ethnicity and parental education, family
income, and school composition.
We adjust for two dimensions of prior academic
preparation: students’ cumulative grade point aver-
age (GPA) in math at the end of their sophomore
year of high school (based on the grades reported
on students’ high school transcripts) and students’
score on the math achievement test administered
by ELS during the 10th-grade year and scaled to
be directly comparable to the senior year math
assessment score. Models excluding prior academic
achievement capture the cumulative process of
racial/ethnic inequality while models conditioning
on prior academic achievement estimate student
learning between 10th and 12th grade. Finally,
we adjust each model for student’s gender, as
well as generational status (indicating whether or
not the student is first generation). Missing values
are imputed.6
Plan of analyses. We begin by presenting the
means and standard deviations of our dependent
and independent variables by race/ethnicity and
math stratum. Next, we estimate separate regres-
sion models by math stratum to examine racial/
ethnic gaps in 12th-grade math achievement and
the extent to which they are accounted for by fam-
ily socioeconomic resources and school racial/
ethnic composition. In addition to models explor-
ing the average effects of these predictors, we also
estimate models that include interaction terms to
evaluate potential differences in the effects of
socioeconomic origins and school racial/ethnic
composition for African American and Hispanic
students relative to white students. Finally, we
estimate models of achievement growth between
10th and 12th grade by controlling for 10th-grade
test scores and math GPA. Because of the clus-
tered nature of the data and our interest in estimat-
ing school effects, we estimate two-level random
effects models with students nested in schools.7
RESULTS
Descriptive analyses. Over half (55 percent) of
the white seniors in our study complete at least
one advanced math course. For black students,
the corresponding percentage is smaller (48
percent).8 Of the three groups, Hispanic
students have the lowest percentage; approxi-
mately one in three Hispanics complete an
advanced math class (37 percent). This confirms
that while minority youth have made significant
inroads to increase their representation in elite
high school courses, they nevertheless remain
underrepresented.
Table 1 shows descriptive statistics by race/
ethnicity and math stratum for our analytic sam-
ple. We denote statistically significant group dif-
ferences by a superscripted letter in each cell of
the table. We find that white students in the
advanced math stratum have significantly higher
average levels of 12th-grade math achievement
than black students (B) and Hispanic students
(H). A significant white advantage in test scores
is also apparent among those in the nonadvanced
math stratum. However, in response to our first
research question, the magnitude of the majority-
minority achievement gap appears larger for
advanced math students. The black-white test
score gap in the advanced stratum is over 13 points
(or around one standard deviation) and the
Hispanic-white gap slightly over 8 points (or
around three-quarters of a standard deviation). In
comparison, respective gaps in the nonadvanced
stratum are just over 7 and almost 6 points.
Subsequent tests confirm that the majority-
minority gap in the advanced stratum is signifi-
cantly greater than that observed in the
nonadvanced stratum.9 Minority students who
have persevered to reach advanced math courses
are no nearer to closing the achievement gap
with their white peers than less accomplished stu-
dents; in fact they are, relatively speaking, further
behind. Our subsequent multivariate analyses will
focus on explaining how differences in levels and
associations of family social class and school
racial/ethnic composition contribute to this more
pronounced inequity among those who reach
advanced math courses.
Returning to the descriptive statistics displayed
in Table 1, as one might expect, those in the
advanced math stratum generally have signifi-
cantly higher means on academic and family
background measures compared to students of
the same racial/ethnic group who fail to advance
beyond algebra 2.10 Among students in the
advanced math stratum, white students are signif-
icantly more likely to take calculus than black and
Riegle-Crumb and Grodsky 255
at Serials Records, University of Minnesota Libraries on October 14, 2010soe.sagepub.comDownloaded from

Hispanic youth. With regard to racial/ethnic dif-
ferences in family socioeconomic resources, white
students in advanced math come from families
with significantly higher levels of parental educa-
tion and income compared to African American
and Hispanic students. We observe a similar but
less pronounced pattern of racial/ethnic inequality
in family resources among nonadvanced students.
Differences in family income between white stu-
dents and their black and Hispanic course-taking
peers are significant, but among those in the non-
advanced stratum, majority-minority differences
in parental education level are significant only
between white and Hispanic students. As would
be expected, significantly fewer black and white
students than Hispanic students are first-
generation immigrants. One-quarter of Hispanic
students in the sample report being born outside
of the United States.
Turning to measures of academic preparation,
at both levels of course-taking, we find that white
students have significantly higher grade point
averages in math and higher 10th-grade math
test scores than black and Hispanic students.
Like differences in social origins, differences in
prior grades and test scores are larger among stu-
dents in advanced courses. For example, while
black students in nonadvanced math trail their
white peers by less than half a grade point, the
gap among advanced students is three-fourths of
a grade point.
On average, white students in our sample
attend a school that is approximately 15 percent
minority. African American and Hispanic students
attend schools whose average composition is over
half minority. Finally we note that there are some
significant differences in family resources
and individual academic histories between
African American and Hispanic students. In both
advanced and nonadvanced strata, black students
have higher levels of parental education than their
Hispanic peers, yet they also have lower levels of
prior academic preparation. Additionally, com-
pared to Hispanic students, black students in the
Table 1. Means and Standard Deviations
Advanced math stratum Nonadvanced math stratum
White Black Hispanic White Black Hispanic
12th-grade math test score 58.19BH 44.85H 49.89 41.92BH 34.57H 35.95SD 11.64 12.92 13.69 12.01 9.77 11.02Female 0.53H 0.55 0.58 0.47B 0.52 0.49SD 0.50 0.49 0.49 0.50 0.49 0.50First-generation immigrant 0.02BH 0.04H 0.22 0.01BH 0.03H 0.25SD 0.16 0.19 0.41 0.12 0.16 0.43Course-taking (advanced 5 calculus;
nonadvanced 5 basic/remedial math)0.26BH 0.11H 0.18 0.07 0.06 0.06
SD 0.44 0.31 0.38 0.26 0.25 0.24Parental education level 4.96BH 4.54H 3.77 3.97H 4.02H 3.18SD 1.90 2.01 2.14 1.89 1.83 1.95Family income (in $10,000 units) 7.83BH 5.05 4.98 5.62BH 3.92 3.87SD 5.68 4.59 4.27 4.19 3.71 3.27Math grade point average 2.64BH 1.90H 2.28 1.80BH 1.43H 1.52SD 0.79 0.84 0.89 0.81 0.77 0.8310th-grade math test score 45.62BH 34.78H 38.51 34.71BH 27.70H 28.91SD 9.20 10.22 10.78 9.84 7.87 9.01Percentage minority in school 15.60BH 57.24H 51.88 14.25BH 53.17 53.89SD 17.78 30.75 30.85 17.83 29.22 30.26N 2,930 630 510 2,375 680 850
B indicates that mean is significantly different than the Black mean within the same math stratum (advanced ornonadvanced), p \ .05. H indicates that mean is significantly different than the Hispanic mean within the same mathstratum, p \ .05.Source: Educational Longitudinal Study (ELS) 2002–2004.
256 Sociology of Education 83(3)
at Serials Records, University of Minnesota Libraries on October 14, 2010soe.sagepub.comDownloaded from

advanced stratum attend schools with a higher
percentage of minority students.
Multivariate regression analyses. Tables 2 and 3
present the results of separate regression analyses
predicting 12th-grade math test score by math
stratum. In addition to controls specified in the
table, each model includes random school effects.
We discuss the results for students completing
advanced math courses first (Table 2) and then
the results for students who take nonadvanced
math courses (Table 3).
The racial/ethnic achievement gap among stu-dents in the advanced math stratum. In the first
model for Table 2, we see again the large test gaps
between African American and Hispanic students
and white students who complete advanced mathe-
matics courses. Comparing results of model 1 to
the group means in Table 1, we find that racial/ethnic
gaps are attenuated when taking account of the var-
iation in mean achievement of the schools our sam-
ple members attend (i.e., conditioning for school
random effects). The attenuation is greater for the
Table 2. Regression Analyses Predicting 12th-Grade Math Scores for Students in Advanced MathStratum (Unstandardized Coefficients with Standard Errors)
Model 1 Model 2 Model 3 Model 4 Model 5 Model 6 Model 7
Black 211.884*** 29.913*** 29.462*** 210.398*** 29.007*** 26.824*** 0.902
SE 0.580 0.512 0.501 1.155 1.190 1.514 0.931
Hispanic 27.803*** 26.230*** 24.959*** 27.055*** 25.575*** 26.513*** 21.214
SE 0.619 0.562 0.555 1.140 1.175 1.527 0.938
Female 22.912*** 22.855*** 22.838*** 22.831*** 22.829** 21.678***
SE 0.318 0.312 0.312 0.311 0.311 0.199
First-generation immigrant 21.849** 21.596* 21.307 21.285 21.304 20.362
SE 0.754 0.741 0.746 0.744 0.744 0.462
Calculus 13.184*** 12.413*** 12.404*** 12.376*** 12.373*** 3.905***
SE 0.391 0.387 0.387 0.386 0.386 0.263
Parental education level 0.885*** 0.895*** 0.898*** 0.899*** 0.192**
SE 0.089 0.108 0.108 0.108 0.067
Family income 0.168*** 0.105** 0.108*** 0.108*** 0.051*
SE 0.033 0.036 0.036 0.036 0.022
Black 3 Parental Education Level 20.234 20.266 20.306 20.185
SE 0.240 0.240 0.240 0.150
Hispanic 3 Parental Education Level 0.066 0.006 0.029 20.188
SE 0.248 0.248 0.249 0.154
Black 3 Family Income 0.348*** 0.317** 0.286** 0.075
SE 0.101 0.101 0.101 0.063
Hispanic 3 Family Income 0.307** 0.261* 0.288* 0.201**
SE 0.118 0.118 0.120 0.075
Percentage minority in school 20.045*** 20.034** 20.004
SE 0.009 0.013 0.007
Black 3 Percentage Minority in School 20.042* 20.032**
SE 0.020 0.011
Hispanic 3 Percentage Minority in School 0.009 0.009
SE 0.020 0.012
Math grade point average 1.906***
SE 0.144
10th-grade math test 0.874***
SE 0.013
Constant 58.087*** 56.195*** 50.749*** 51.204*** 52.133*** 51.956*** 11.908***
SE 0.318 0.349 0.527 0.593 20.622 0.640 0.614
Variance (constant) 23.766 19.749 15.302 15.379 14.597 14.318 2.202
Variance (residual) 122.788 93.051 90.621 90.232 90.042 90.063 36.141
N 5 4,070.
Source: Educational Longitudinal Study (ELS) 2002–2004.
*p \ .05. **p \ .01. ***p \ .001.
Riegle-Crumb and Grodsky 257
at Serials Records, University of Minnesota Libraries on October 14, 2010soe.sagepub.comDownloaded from

Tab
le3.
Reg
ress
ion
Anal
yses
Pre
dic
ting
12th
-Gra
de
Mat
hSc
ore
sfo
rSt
uden
tsin
NonaA
dva
nce
dM
ath
Stra
tum
(Unst
andar
diz
edC
oef
ficie
nts
with
Stan
dar
dErr
ors
)
Model
1M
odel
2M
odel
3M
odel
4M
odel
5M
odel
6M
odel
7
Bla
ck2
7.0
42***
26.8
65***
26.4
41***
25.7
60***
24.8
06***
25.4
94***
21.1
75
SE0.5
23
0.5
02
0.5
00
1.1
56
1.1
88
1.4
13
0.8
60
His
pan
ic2
5.7
44***
25.2
72***
24.5
12***
25.1
09***
23.9
32***
22.7
19*
20.0
08
SE0.4
95
0.5
06
0.5
03
0.9
87
1.0
43
1.2
94
0.7
87
Fem
ale
22.1
75***
22.0
53***
22.0
54***
22.0
41***
22.0
41***
20.8
89***
SE0.3
46
0.3
43
0.3
43
0.3
43
0.3
43
0.2
11
Firs
t-ge
ner
atio
nim
mig
rant
22.0
94**
21.7
62***
21.6
68*
21.5
92*
21.5
47*
20.0
38
SE0.7
53
0.7
46
0.7
51
0.7
50
0.7
50
0.4
58
Low
mat
h2
13.5
64***
213.0
74***
213.1
01***
213.1
81***
213.2
25***
24.3
47***
SE0.6
96
0.6
89
0.6
90
0.6
89
0.6
89
0.4
36
Par
enta
led
uca
tion
leve
l0.4
65***
0.5
44***
0.5
48***
0.5
47***
0.1
32
SE0.0
96
0.1
24
0.1
24
0.1
24
0.0
76
Fam
ilyin
com
e0.2
95***
0.2
40***
0.2
43***
0.2
43***
0.0
48
SE0.0
46
0.0
56
0.0
56
0.0
56
0.0
34
Bla
ck3
Par
enta
lEduca
tion
20.2
99
20.2
83
20.2
95
20.0
33
SE0.2
63
0.2
63
0.2
63
0.1
60
His
pan
ic3
Par
enta
lEduca
tion
20.1
35
20.1
93
20.2
33
0.1
12
SE0.2
35
0.2
35
0.2
37
0.1
44
Bla
ck3
Fam
ilyIn
com
e0.1
04
0.0
72
0.0
89
0.0
92
SE0.1
28
0.1
28
0.1
29
0.0
79
His
pan
ic3
Fam
ilyIn
com
e0.2
45
0.2
16
0.1
99
0.0
82
SE0.1
31
0.1
31
(0.1
32
0.0
80
Perc
enta
gem
inori
tyin
school
20.0
29***
20.0
23
0.0
03
SE0.0
08
(0.0
13
0.0
08
Bla
ck3
Perc
enta
geM
inori
tyin
School
0.0
09
0.0
10
SE0.0
20
0.0
12
(con
tinue
d)
258
at Serials Records, University of Minnesota Libraries on October 14, 2010soe.sagepub.comDownloaded from

Tab
le3.
(co
nti
nu
ed
)
Model
1M
odel
2M
odel
3M
odel
4M
odel
5M
odel
6M
odel
7
His
pan
ic3
Perc
enta
geM
inori
tyin
School
20.0
24
20.0
18
SE0.0
19
0.0
11
Mat
hgr
ade
poin
tav
erag
e0.7
83***
SE0.1
37
10th
-gra
de
mat
hte
st0.9
40***
SE0.0
12
Const
ant
41.8
08***
43.8
36***
40.2
21***
40.2
25***
40.6
91***
40.6
14***
7.8
15***
SE0.2
72
0.3
18
0.5
06
0.5
88
0.6
02
0.6
20
0.5
56
Var
iance
(const
ant)
7.0
46
8.0
17
6.5
75
6.4
64
5.9
49
6.0
15
1.9
65
Var
iance
(res
idual
)123.8
08
110.7
84
109.1
35
109.1
92
109.2
29
109.1
540.5
30
N5
3,9
00.
Sourc
e:Educa
tional
Longi
tudin
alSt
udy
(ELS
)2002–2004.
*p
\.0
5.**p
\.0
1.***p
\.0
01.
259
at Serials Records, University of Minnesota Libraries on October 14, 2010soe.sagepub.comDownloaded from

black-white achievement gap (about 11 percent)
than it is for the Hispanic-white achievement
gap (about 6 percent). This differential is likely
driven by greater segregation of blacks than
Hispanics across schools and potentially lower
average achievement levels in the schools at-
tended by the average black student compared
to the average Hispanic student (a point to which
we return in the following).
We add indicators for gender, immigrant sta-
tus, and calculus course-taking in model 2. The
first two are significantly and negatively associ-
ated with test score, while the last is positively
so. The advanced math achievement gap between
white students and their minority peers decreases
by approximately 15 percent to 20 percent from
that observed in model 1; additional analyses
without gender or generational status included
confirms that this attenuation is mostly due to
racial/ethnic differences in calculus participation.
In model 3, we adjusted for differences in levels
of family socioeconomic resources; with the
inclusion of these measures the magnitude of
the achievement gap between African American
students and their white peers is reduced by about
5 percent. In contrast, the mean achievement dif-
ference between Hispanic and white students is
reduced by 20 percent.
We evaluate potential differences in the associ-
ations between social class background and aca-
demic achievement across racial/ethnic groups in
model 4. While we find no evidence of differential
returns to parental education, we do find signifi-
cant differences in the achievement returns to
family income by race/ethnicity. These differen-
ces run opposite to the effects anticipated by
Gosa and Alexander (2007) and others who have
written on the black middle class. In fact, the ef-
fects of family income for Hispanic and African
American students are about four times what
they are for non-Hispanic white students, holding
constant parental education, immigrant status,
gender, and calculus enrollment. Subsequent cal-
culations indicate that among advanced students,
test score gaps are most pronounced among those
from the lowest family income. For example, at
one standard deviation below the pooled average
family income, the black/white gap is almost 11
points, and the Hispanic/white gap is about 6
points. At one standard deviation above the
mean on family income, the black/white gap is
reduced to approximately 7 points and the
Hispanic/white gap to 3 points. Thus, contrary to
our expectations, we do not find evidence that
minority students in advanced classes benefit
less than their white peers from higher levels of
social class. Rather, their achievement levels suf-
fer comparably more than white students from
lower levels of family income.
In models 5 and 6, we add measures of school
percentage minority and the interaction of per-
centage minority and race/ethnicity. Net of stu-
dent social background, the effect of percentage
minority is negative and significant, indicating
that achievement levels of all students are lower
in schools with higher minority composition
(model 5).11 This effect is very small in magni-
tude; a 10 percentage point increase in percentage
minority is associated with a 0.4 point decline in
math test scores (approximately 3 percent of
a standard deviation). Yet consistent with past lit-
erature, the negative association between percent-
age minority and achievement is stronger for
African American students than it is for white stu-
dents, with African American students experienc-
ing a decline of about eight-tenths of a point for
each third of a point experienced by whites (as
seen in model 6). This is not the case for
Hispanic students; the conditional association
between percentage minority and academic
achievement for Hispanic and non-Hispanic white
students is statistically and substantively indistin-
guishable. Subsequent calculations indicate that
by accounting for both main and interaction ef-
fects of school composition in model 6, the aver-
age black/white test gap among advanced students
is reduced by approximately 20 percent, from
a gap of about nine points when social class was
taken into account, to a reduced gap of just over
seven points. The average Hispanic/white gap
(conditioned on social class and calculated from
model 4) is reduced by only 10 percent.
Finally, model 7 includes measures of prior
academic preparation. Results from this model
reflect how variation in the independent variables
contributes to variation in student learning
between the 10th and 12th grades rather than var-
iation in achievement at a single point in time.12
Although the socioeconomic background coeffi-
cients decline in magnitude, parental education
and family income continue to contribute to aca-
demic achievement over the final two years of
high school. Evidence for differential contribu-
tions of social background across racial/ethnic
groups is mixed. The income interaction for
African American students is very close to 0 and
260 Sociology of Education 83(3)
at Serials Records, University of Minnesota Libraries on October 14, 2010soe.sagepub.comDownloaded from

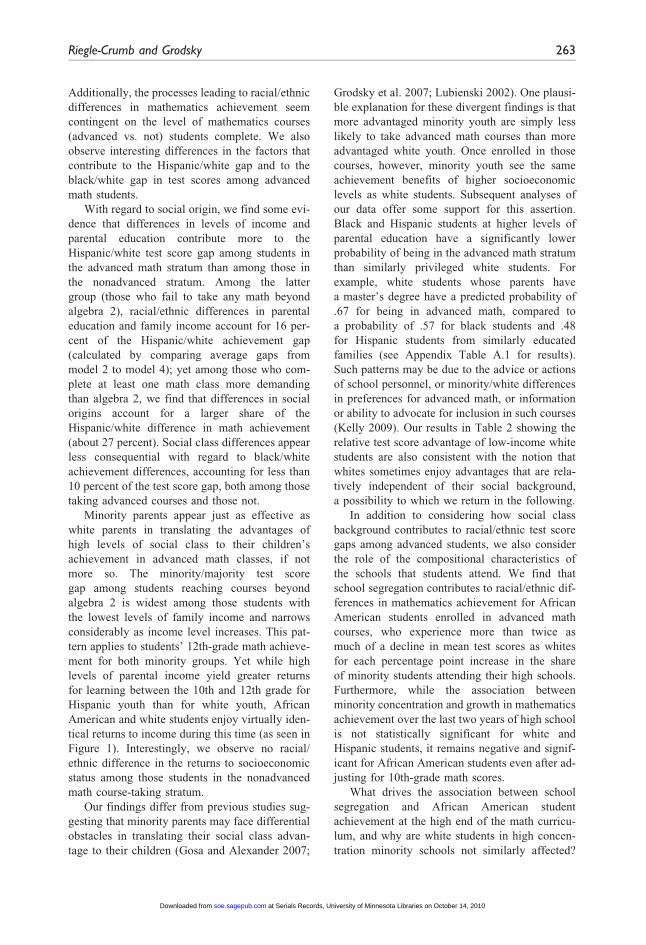
no longer significant, but the returns to family
income for Hispanic students are about five times
as much as those for white students. As seen in
Figure 1, Hispanic students at higher levels of
family income actually enjoy a slightly higher pre-
dicted test score than comparable whites net of
differences in prior achievement and other covari-
ates. At one standard deviation above the mean,
Hispanic students have a predicted test score
that is about half a point higher than whites.
Also in model 7, the main effect for percentage
minority approaches 0 and is not significant in our
final model, suggesting that the amount white and
Hispanic students in advanced math classes learn
between 10th and 12th grade is virtually unaf-
fected by variation in school racial/ethnic compo-
sition. This is not the case for African American
students, who appear to learn slightly less between
10th and 12th grade in schools with a high minor-
ity concentration. Comparing the association
between percentage minority and academic
achievement for African American students in
models 6 and 7, it appears that about 50 percent
of the effect of minority student concentration
for African American students occurs between
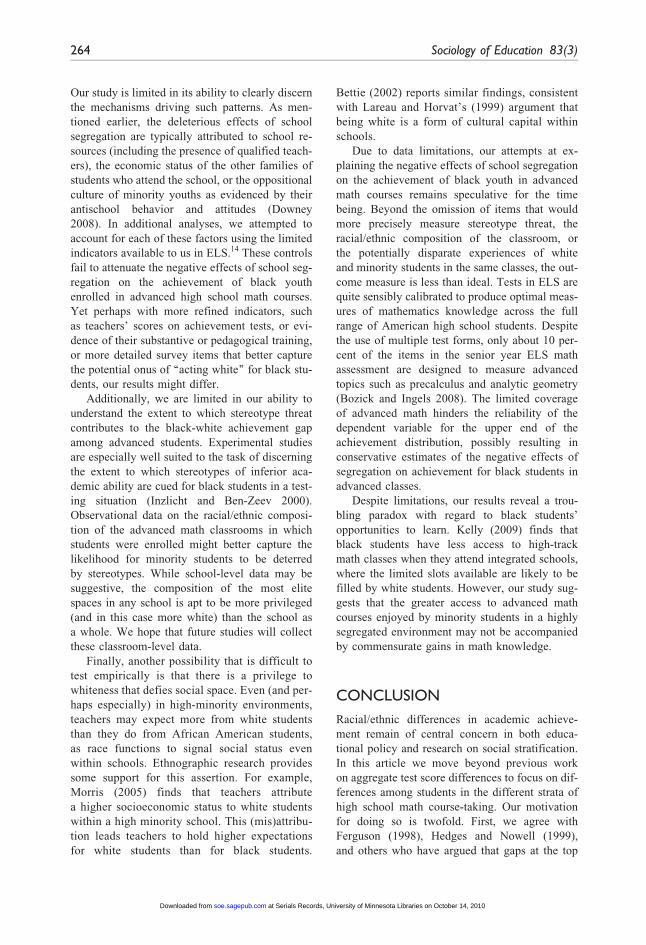
the 10th and 12th grades.13 As seen in Figure 2,
while the predicted achievement scores of white
and Hispanic students remain unchanged as
the percentage minority in the school increases,
the predicted test scores of blacks begin to decline
as the minority school composition increases
upward from 20 percent. Although modest in
magnitude, this divergence in achievement trajec-
tories is troubling and consistent with the assertion
that African American students taking more
demanding math courses in highly segregated en-
vironments simply are not learning the same mate-
rial as their white and African American
counterparts in less racially isolated schools.
This disparity, although slight, is nevertheless
indicative of the deleterious effect of school segre-
gation that remains even after family resources
and prior academic preparation are taken into
account.
The racial/ethnic achievement gap among stu-dents in the nonadvanced math stratum. Table 3
presents the results of regression analyses parallel
to those presented in Table 2 for students who
have not reached any course beyond algebra 2 by
the end of high school. As mentioned previously,
in model 1, we see that racial/ethnic differences
in achievement for students in the nonadvanced
stratum are smaller than the differences for similar
students in more demanding courses. The
PR
ED
ICT
ED
12T
H-G
RA
DE
MA
TH
TE
ST S
CO
RE
FAMILY INCOME
SD SD
Figure 1. Effect of family income on 12th grade achievement among students in advanced math stratum(net of students’ academic background)
Riegle-Crumb and Grodsky 261
at Serials Records, University of Minnesota Libraries on October 14, 2010soe.sagepub.comDownloaded from

coefficients are slightly smaller than the gaps in
achievement tests showed in Table 1.
We find in model 2 that the inclusion of gen-
der, immigrant status, and remedial math partici-
pation (all of which are negatively and
significantly associated with test score) does not
contribute to much reduction in the average
majority/minority gap. Parental education and
income significantly predict test scores (model 3),
and the coefficients for black and Hispanic are
reduced, but more so for Hispanic than for black
students (approximately 14 percent for Hispanics
and only 6 percent for blacks). Additional t-tests
reveal that the coefficient for parental education
level observed in Table 2 for advanced students
is significantly larger than it is here for
nonadvanced students. We allow for differential
effects of social origin measures across racial/
ethnic groups in model 4. In contrast to students
in the advanced math stratum, the association
between social origins and math achievement
among students completing less demanding
math courses appears uniform across racial/eth-
nic groups.
In model 5, we introduce measures of school
racial/ethnic composition. We find that segrega-
tion is negatively associated with math achieve-
ment and mediates a small share of the racial/
ethnic achievement gaps. The net association
between minority concentration and mathematics
achievement is about half of what it is for students
taking advanced classes. Interaction terms in
model 6 suggest that the negative effects of minor-
ity student concentration may be born more by
Hispanics (20.024), but none of the segregation
terms attain statistical significance in that model.
Thus, the negative effects of segregation on
achievement appear to occur primarily among stu-
dents in advanced-level math courses. Finally, in
model 7, with the introduction of the indicators
of students’ prior academic preparation, the
racial/ethnic gap in achievement among nonad-
vanced students becomes statistically indistin-
guishable from zero. Additionally, neither
parental education nor family income is statisti-
cally significant a predictor of learning over the
final two years of high school.
DISCUSSION
In this article, we explore racial/ethnic differences
in math achievement among high school students
completing different levels of mathematics course
work. We find that the mathematics achievement
gap, particularly for African American and white
youth, is most pronounced among students
completing the most demanding courses.
PERCENTAGE MINORITY IN SCHOOL
PR
ED
ICT
ED
12T
H-G
RA
DE
TE
ST S
CO
RE
Figure 2. Effect of school racial/ethnic composition on 12th grade achievement among students inadvanced math stratum (net of students’ academic background)
262 Sociology of Education 83(3)
at Serials Records, University of Minnesota Libraries on October 14, 2010soe.sagepub.comDownloaded from
Additionally, the processes leading to racial/ethnic
differences in mathematics achievement seem
contingent on the level of mathematics courses
(advanced vs. not) students complete. We also
observe interesting differences in the factors that
contribute to the Hispanic/white gap and to the
black/white gap in test scores among advanced
math students.
With regard to social origin, we find some evi-
dence that differences in levels of income and
parental education contribute more to the
Hispanic/white test score gap among students in
the advanced math stratum than among those in
the nonadvanced stratum. Among the latter
group (those who fail to take any math beyond
algebra 2), racial/ethnic differences in parental
education and family income account for 16 per-
cent of the Hispanic/white achievement gap
(calculated by comparing average gaps from
model 2 to model 4); yet among those who com-
plete at least one math class more demanding
than algebra 2, we find that differences in social
origins account for a larger share of the
Hispanic/white difference in math achievement
(about 27 percent). Social class differences appear
less consequential with regard to black/white
achievement differences, accounting for less than
10 percent of the test score gap, both among those
taking advanced courses and those not.
Minority parents appear just as effective as
white parents in translating the advantages of
high levels of social class to their children’s
achievement in advanced math classes, if not
more so. The minority/majority test score
gap among students reaching courses beyond
algebra 2 is widest among those students with
the lowest levels of family income and narrows
considerably as income level increases. This pat-
tern applies to students’ 12th-grade math achieve-
ment for both minority groups. Yet while high
levels of parental income yield greater returns
for learning between the 10th and 12th grade for
Hispanic youth than for white youth, African
American and white students enjoy virtually iden-
tical returns to income during this time (as seen in
Figure 1). Interestingly, we observe no racial/
ethnic difference in the returns to socioeconomic
status among those students in the nonadvanced
math course-taking stratum.
Our findings differ from previous studies sug-
gesting that minority parents may face differential
obstacles in translating their social class advan-
tage to their children (Gosa and Alexander 2007;
Grodsky et al. 2007; Lubienski 2002). One plausi-
ble explanation for these divergent findings is that
more advantaged minority youth are simply less
likely to take advanced math courses than more
advantaged white youth. Once enrolled in those
courses, however, minority youth see the same
achievement benefits of higher socioeconomic
levels as white students. Subsequent analyses of
our data offer some support for this assertion.
Black and Hispanic students at higher levels of
parental education have a significantly lower
probability of being in the advanced math stratum
than similarly privileged white students. For
example, white students whose parents have
a master’s degree have a predicted probability of
.67 for being in advanced math, compared to
a probability of .57 for black students and .48
for Hispanic students from similarly educated
families (see Appendix Table A.1 for results).
Such patterns may be due to the advice or actions
of school personnel, or minority/white differences
in preferences for advanced math, or information
or ability to advocate for inclusion in such courses
(Kelly 2009). Our results in Table 2 showing the
relative test score advantage of low-income white
students are also consistent with the notion that
whites sometimes enjoy advantages that are rela-
tively independent of their social background,
a possibility to which we return in the following.
In addition to considering how social class
background contributes to racial/ethnic test score
gaps among advanced students, we also consider
the role of the compositional characteristics of
the schools that students attend. We find that
school segregation contributes to racial/ethnic dif-
ferences in mathematics achievement for African
American students enrolled in advanced math
courses, who experience more than twice as
much of a decline in mean test scores as whites
for each percentage point increase in the share
of minority students attending their high schools.
Furthermore, while the association between
minority concentration and growth in mathematics
achievement over the last two years of high school
is not statistically significant for white and
Hispanic students, it remains negative and signif-
icant for African American students even after ad-
justing for 10th-grade math scores.
What drives the association between school
segregation and African American student
achievement at the high end of the math curricu-
lum, and why are white students in high concen-
tration minority schools not similarly affected?
Riegle-Crumb and Grodsky 263
at Serials Records, University of Minnesota Libraries on October 14, 2010soe.sagepub.comDownloaded from
Our study is limited in its ability to clearly discern
the mechanisms driving such patterns. As men-
tioned earlier, the deleterious effects of school
segregation are typically attributed to school re-
sources (including the presence of qualified teach-
ers), the economic status of the other families of
students who attend the school, or the oppositional
culture of minority youths as evidenced by their
antischool behavior and attitudes (Downey
2008). In additional analyses, we attempted to
account for each of these factors using the limited
indicators available to us in ELS.14 These controls
fail to attenuate the negative effects of school seg-
regation on the achievement of black youth
enrolled in advanced high school math courses.
Yet perhaps with more refined indicators, such
as teachers’ scores on achievement tests, or evi-
dence of their substantive or pedagogical training,
or more detailed survey items that better capture
the potential onus of ‘‘acting white’’ for black stu-
dents, our results might differ.
Additionally, we are limited in our ability to
understand the extent to which stereotype threat
contributes to the black-white achievement gap
among advanced students. Experimental studies
are especially well suited to the task of discerning
the extent to which stereotypes of inferior aca-
demic ability are cued for black students in a test-
ing situation (Inzlicht and Ben-Zeev 2000).
Observational data on the racial/ethnic composi-
tion of the advanced math classrooms in which
students were enrolled might better capture the
likelihood for minority students to be deterred
by stereotypes. While school-level data may be
suggestive, the composition of the most elite
spaces in any school is apt to be more privileged
(and in this case more white) than the school as
a whole. We hope that future studies will collect
these classroom-level data.
Finally, another possibility that is difficult to
test empirically is that there is a privilege to
whiteness that defies social space. Even (and per-
haps especially) in high-minority environments,
teachers may expect more from white students
than they do from African American students,
as race functions to signal social status even
within schools. Ethnographic research provides
some support for this assertion. For example,
Morris (2005) finds that teachers attribute
a higher socioeconomic status to white students
within a high minority school. This (mis)attribu-
tion leads teachers to hold higher expectations
for white students than for black students.
Bettie (2002) reports similar findings, consistent
with Lareau and Horvat’s (1999) argument that
being white is a form of cultural capital within
schools.
Due to data limitations, our attempts at ex-
plaining the negative effects of school segregation
on the achievement of black youth in advanced
math courses remains speculative for the time
being. Beyond the omission of items that would
more precisely measure stereotype threat, the
racial/ethnic composition of the classroom, or
the potentially disparate experiences of white
and minority students in the same classes, the out-
come measure is less than ideal. Tests in ELS are
quite sensibly calibrated to produce optimal meas-
ures of mathematics knowledge across the full
range of American high school students. Despite
the use of multiple test forms, only about 10 per-
cent of the items in the senior year ELS math
assessment are designed to measure advanced
topics such as precalculus and analytic geometry
(Bozick and Ingels 2008). The limited coverage
of advanced math hinders the reliability of the
dependent variable for the upper end of the
achievement distribution, possibly resulting in
conservative estimates of the negative effects of
segregation on achievement for black students in
advanced classes.
Despite limitations, our results reveal a trou-
bling paradox with regard to black students’
opportunities to learn. Kelly (2009) finds that
black students have less access to high-track
math classes when they attend integrated schools,
where the limited slots available are likely to be
filled by white students. However, our study sug-
gests that the greater access to advanced math
courses enjoyed by minority students in a highly
segregated environment may not be accompanied
by commensurate gains in math knowledge.
CONCLUSION
Racial/ethnic differences in academic achieve-
ment remain of central concern in both educa-
tional policy and research on social stratification.
In this article we move beyond previous work
on aggregate test score differences to focus on dif-
ferences among students in the different strata of
high school math course-taking. Our motivation
for doing so is twofold. First, we agree with
Ferguson (1998), Hedges and Nowell (1999),
and others who have argued that gaps at the top
264 Sociology of Education 83(3)
at Serials Records, University of Minnesota Libraries on October 14, 2010soe.sagepub.comDownloaded from

of the academic achievement distribution have not
been adequately studied in the past, particularly in
light of the relatively modest changes in the
minority-majority achievement gap over time for
high-achieving students. Second, from a purely
instrumental perspective, students who complete
advanced mathematics courses in high school
are more likely than other students to attend col-
lege and complete a four-year college degree
(C. Adelman 1994, 1999). By focusing on stu-
dents in the upper stratum of the secondary math
curriculum, we focus on those students most likely
to replace today’s managers, professionals, and
civic and business leaders.
While our analyses reveal that minority students
in advanced classes fall further behind the achieve-
ment of their white peers (relatively speaking) than
students completing only lower level classes, our
results (as shown in Table 1) are also consistent
with prior research demonstrating that being in
advanced math classes improves mathematics
achievement for all students (Attewell and
Domina 2008; Dauber et al. 1996; Gamoran and
Hannigan 2000; Mickelson and Heath 1999). The
differential achievement returns to advanced math
classes for racial/ethnic groups that we document
should not overshadow the academic benefits that
minority students in such classes receive when
compared to those not participating in advanced
math. To the extent that black and Hispanic stu-
dents still have disproportionately low rates of rep-
resentation in these classes, equality of opportunity
to learn is inhibited (Kelly 2009). Our results sim-
ply take the stratification of learning a step further,
showing that equality of course participation may
not be enough.
Finally, we note that the effects of social ori-
gin and school composition on students’ learning
between 10th and 12th grade are relatively mod-
est. One might then view these results more opti-
mistically as a sign that things are not as bad as
they might be. Alternatively, one might reason-
ably expect that increasing access to advanced-
level courses for minority youth would be the
best strategy for attaining equity in racial/ethnic
achievement patterns. The fact that minority
youth who successfully persevered to reach
advanced math courses are actually further
behind their white peers, relatively speaking, is
indeed troubling from this perspective, as is evi-
dence that this gap is more pronounced for black
students in segregated schools and Hispanic stu-
dents from low-income families. As a nation
we have taken great strides in the past few deca-
des toward providing equality of educational
opportunities to minority youth. Nonetheless,
our analyses suggest that below the surface pat-
terns of mathematics course participation, in-
equalities remain.
AUTHORS’ NOTE
Opinions reflect those of the authors and do not neces-
sarily reflect those of the granting agencies.
FUNDING
This research was supported by Grant 5 R24 HD042849,
Population Research Center, awarded to the Population
Research Center at the University of Texas at Austin by
the Eunice Kennedy Shriver National Institute of Health
and Child Development, as well as a grant from the
National Science Foundation (DUE-0757018), Chandra
Muller, PI, and Catherine Riegle-Crumb, Co-PI.
Grodsky acknowledges support from the Minnesota
Population Center and the College of Liberal Arts at
the University of Minnesota.
NOTES
1. Throughout the text, we alternate usage of the
words black and African American, given the prev-
alence of both terms in the sociological and educa-
tional literatures.
2. We recognize that the Hispanic population in the
United States is a very heterogeneous one. Prior
research indicates that achievement patterns among
Hispanic youth may vary both by generational status
and country of origin and that obstacles to educa-
tional attainment may likewise vary (Kao and
Tienda 1995; Oropesa and Landale 2009; Schmid
2001). It is nevertheless apparent that educational
differences between white and Hispanic students
are generally much larger in magnitude than the
within-group differences observed among Hispanic
youth (Wotjkiewicz and Donato 1995). While an
in-depth consideration of the variation in predictors
of educational achievement within the Hispanic stu-
dent population is outside of the scope of this study,
we do control for students’ generational status in all
analytic models. In exploratory analyses we also con-
trolled on country of origin, but the overwhelming
majority of Hispanic students in the sample are of
Mexican origin and this indicator was never
significant.
3. For a review of this literature, see Downey (2008).
4. In exploratory analyses, we also included indicators
for intact family structure, language spoken at
home, and educational expectations. These
Riegle-Crumb and Grodsky 265
at Serials Records, University of Minnesota Libraries on October 14, 2010soe.sagepub.comDownloaded from

variables did not change any of the primary results
here and in many cases were not statistically signif-
icant predictors. We therefore chose the more parsi-
monious model presented here.
5. In models not shown, we coded parental education
and family income as dummy variables. The coeffi-
cients demonstrate linearity in the conditional rela-
tionship between social origin measures and math
achievement and are substantively similar to those
we present here.
6. The Education Longitudinal Study of 2002 (ELS)
data include imputed values (via sequential hot
deck imputation) for certain key variables, includ-
ing test scores, family income, and parental educa-
tion (Ingels et al. 2007). We therefore used these
imputed values in our analyses. The percentage
of cases in our analytic sample imputed for these
variables includes 23 percent for family income,
9 percent for parental education level, and 12 per-
cent for math test scores. For other missing data for
variables not imputed by ELS, we used the ‘‘im-
pute’’ command in Stata that organizes cases by
patterns of missing data and then runs regressions
to determine predicted values. (We also explored
using mean substitution and multiple imputation
to compensate for item nonresponse. The results
we present are robust to these alternative ap-
proaches.) The percentage missing for these other
variables was as follows: generational status: 13
percent; math grade point average: 12 percent;
and percentage minority in school: 3 percent.
7. We estimate all models in Stata and show
unweighted estimates (with sample sizes rounded to
the nearest 10 in compliance with Institute of
Education Sciences regulations). Stata is not able to
accommodate weights in the mixed models of the
sort we estimate. Weighted estimates for other (sin-
gle-level) models we produce are substantively iden-
tical to those we show here. This is not surprising
since we adjust for the characteristics on which stu-
dent oversampling was based (race/ethnicity) and
restrict our analysis to students in public schools,
thereby implicitly conditioning on school stratum as
well (Winship and Radbill 1994). We also ran our
models using hierarchical linear modeling (HLM).
The results were comparable to those reported here.
8. Percentages can be calculated using the group sam-
ple sizes (Ns) reported in Table 1.
9. Pooled models with race by math stratum interac-
tions predicting 12th-grade test score confirm that
both the black-white gap and the Hispanic-white
gap are significantly larger among students in the
advanced math stratum compared to the nonad-
vanced stratum.
10. There are only three exceptions to this trend. For
African American students, the proportions of fe-
males in both the advanced and nonadvanced
math groups are not statistically different. Also,
among Hispanic students, there is not a statistically
significant difference in the proportion of students
from intact families between students in the two
math groups. Finally, the percentage minority in
the school does not differ between Hispanic stu-
dents in advanced and nonadvanced math; however,
for both black and white students, students in the
advanced stratum attend schools with a statistically
significantly higher percentage minority composi-
tion compared to those in the nonadvanced stratum.
11. In preliminary analyses, we first ran models with
school racial-ethnic composition variables (both
main effects and interactions with student race-
ethnicity) that did not include the indicators of family
socioeconomic background, thereby allowing us to
see the gross contribution of school segregation to
the black-white and Hispanic-white test gap. The co-
efficients for school racial-ethnic composition were
very similar to those shown here in models 5 and 6.
12. We also experimented with estimating change score
models, taking grade 12 – grade 10 test score as the
dependent variable. Results were the same as those
reported here (with the coefficient for 10th-grade
test scores approaching unity).
13. Net of other attributes, model 6 suggests that
African American students lose 0.076 points for
each additional percentage point in the share of stu-
dents at their school who are African American or
Hispanic (0.034 1 0.042). If we confine our atten-
tion to achievement growth over the final two years
of high school (model 7), we see that African
American students lose 0.036 points for each addi-
tional percentage point in the share of students at
their school who are African American or Hispanic.
14. For oppositional culture indicators, we created
a mean scale of how important it was to the stu-
dent’s friends to attend classes regularly, study,
get good grades, finish high school, and continue
past high school. We also included measures of
the importance of good grades and how frequently
the student got into trouble at school. These meas-
ures are consistent with those used by Harris and
Robinson (2007) in their study of oppositional cul-
ture, but arguably do not capture key aspects of
oppositional cultural theory, such as the degree to
which minority students perceive that their future
opportunities will be constrained by their race
(Harris 2008). For teacher quality, we included
measures of whether the student’s 10th-grade
math teacher was new to teaching, new to the
school, certified, had a degree in math, and had
taken five or more math courses in college.
Ideally, we would have data for students’ 11th-
and 12th-grade math teachers, namely, those who
are instructing the advanced courses in which
minority students are trailing their white peers.
266 Sociology of Education 83(3)
at Serials Records, University of Minnesota Libraries on October 14, 2010soe.sagepub.comDownloaded from

Finally, we also included measures of the percent-
age of the student body eligible for free or
reduced-price lunch and school means for family
income and parental education level. None of these
indicators reduced the Black 3 Percentage Minority
coefficient observed in model 7 for the advanced
math stratum in either size or significance. These
results are available upon request from the first
author.
REFERENCES
Adelman, Clifford. 1994. Answers in the Tool Box:
Academic Intensity, Attendance Patterns, and
Bachelor’s Degree Attainment. Washington, DC:
U.S. Department of Education, Office of
Educational Research and Improvement.
———. 1999. Postsecondary Attainment, Attendance,
Curriculum, and Performance: Selected Results
from the NELS:88/2000 Postsecondary Education
Transcript Study (PETS), 2000. NCES 2003-394.
Washington, DC: U.S. Department of Education,
Institute of Education Sciences.
Adelman, Robert M. 2004. ‘‘Neighborhood Opportunities,
Race, and Class: The Black Middle Class and
Residential Segregation.’’ City & Community 3(1):
43–63.
Ainsworth-Darnell, James and Douglas Downey. 1998.
‘‘Assessing the Oppositional Culture Explanation
for Racial/Ethnic Differences in School
Performance.’’ American Sociological Review
63(4):536–53.
Alba, Richard, John Logan, and Brian Stults. 2000.
‘‘How Segregated Are Middle-class African
Americans?’’ Social Problems 47:543–58.
Attewell, Paul and Thurston Domina. 2008. ‘‘Raising
the Bar: Curricular Intensity and Academic
Performance.’’ Educational Evaluation and Policy
Analysis 30(1):51–71.
Baker, David and David Lee Stevenson. 1986.
‘‘Mothers’ Strategies for Children’s School
Achievement: Managing the Transition to High
School.’’ Sociology of Education 59(3):156–66.
Bettie, Julie. 2002. ‘‘Exceptions to the Rule: Upwardly
Mobile White and Mexican American High School
Girls.’’ Gender & Society 16:403–22.
Booher-Jennings, Jennifer. 2005. ‘‘Below the Bubble:
‘Educational Triage’ and the Texas Accountability
System.’’ American Education Research Journal
42:231–68.
Borman, Geoffrey and N. Maritza Dowling. 2006.
‘‘Schools and Inequality: A Multilevel Analysis of
Coleman’s Equality of Educational Opportunity
Data.’’ Presented at the annual meeting of the
American Educational Research Association, April,
San Francisco, CA.
Borman, Kathryn M., Tamela McNulty Eitle, Deanna
Michael, David J. Eitle, Reginald Lee, Larry
Johnson, Deirdre Cobb-Roberts, Sherman Dorn,
and Barbara Shircliffe. 2004. ‘‘Accountability in
a Postdesegregation Era: The Continuing
Significance of Racial Segregation in Florida’s
Schools.’’ American Educational Research Journal
41(3):605–31.
Bourdieu, Pierre and Jean-Claude Passeron. 1990.
Reproduction in Education, Society, and Culture.
London, UK: Sage.
Bozick, Robert and Steven Ingels. 2008. Mathematics
Coursetaking and Achievement at the End of High
School: Evidence from the Education Longitudinal
Study of 2002 (ELS:2002). NCES 2008-319.
Washington, DC: National Center for Education
Statistics, Institute of Education Sciences, U.S.
Department of Education.
Burkam, David, Valerie Lee, and Becky Smerdon. 1997.
‘‘Gender and Science Learning Early in High
School: Subject Matter and Laboratory
Experiences.’’ American Educational Journal 34(2):
297–331.
Catsambis, Sophia. 1994. ‘‘The Path to Math: Gender
and Racial-Ethnic Differences in Mathematics
Participation from Middle School to High School.’’
Sociology of Education 67:199–215.
Clotfelter, Charles, Helen Ladd, and Jacob Vigdor.
2005. ‘‘Who Teaches Whom? Race and the
Distribution of Novice Teachers.’’ Economics of
Education Review 24:377–92.
Coleman, James S., Ernest Q. Campbell, Carol J.
Hobson, James McPartland, Alexander M. Mood,
Frederick D. Weinfall, and Robert L. York. 1966.
Equality of Educational Opportunity. Washington,
DC: Department of Health, Education, and Welfare.
Coleman, James S., Sally Kilgore, and Thomas Hoffer.
1982. ‘‘Public and Private Schools.’’ Society
19(2):4–9.
College Board. 1999. Reaching the Top: A Report of
the National Task Force on Minority High
Achievement. New York: College Entrance
Examination Board.
Cook, Philip and Jens Ludwig. 1998. ‘‘The Burden of
‘Acting White’: Do Black Adolescents Disparage
Academic Achievement.’’ Pp. 375–400 in The
Black-White Test Score Gap, edited by C. Jencks
and M. Phillips. Washington, DC: Brookings
Institution Press.
Dalton, Ben, Steven Ingels, Jane Downing, Robert
Bozick, and Jeffrey Owings. 2007. Advanced
Mathematics and Science Coursetaking in the
Spring High School Senior Classes of 1982, 1992,
and 2004. NCES 2007-312. Washington, DC:
National Center of Education Statistics, Institute
of Education Sciences, U.S. Department of
Education.
Riegle-Crumb and Grodsky 267
at Serials Records, University of Minnesota Libraries on October 14, 2010soe.sagepub.comDownloaded from

Darling-Hammond, Linda. 2001. ‘‘The Challenge of
Staffing Our Schools.’’ Educational Leadership
58(8):12–17.
Dauber, Susan, Karl Alexander, and Doris Entwisle.
1996. ‘‘Tracking and Transitions through the Middle
Grades: Channeling Educational Trajectories.’’
Sociology of Education 69(4):290–307.
Davies, Scott. 2004. ‘‘School Choice by Default?
Understanding the Demand for Private Tutoring
in Canada.’’ American Journal of Education
110(3):233–55.
Delpit, Lisa D. 1992. ‘‘Education in a Multicultural
Society: Our Future’s Greatest Challenge.’’ Journal
of Negro Education 61(3):237–49.
Dougherty, Chrys, Lynn Mellor, and Shuling Jian. 2006.
Orange Juice or Orange Drink? Ensuring that
‘‘Advanced Courses’’ Live Up to Their Labels?
Austin, TX: National Center for Educational
Accountability.
Downey, Douglas B. 2008. ‘‘Black/White Differences in
School Performance: The Oppositional Culture
Explanation.’’ Annual Review of Sociology 34:107–
26.
Federal Interagency Forum on Child and Family Statistics.
2006. America’s Children: Key National Indicators of
Well-Being, 2005. Federal Interagency Forum on
Child and Family Statistics, Washington,DC: U.S.
Government Printing Office.
Ferguson, Ronald. 1998. ‘‘Can Schools Narrow the
Black-White Test Score Gap?’’ Pp 375–400 in The
Black-White Test Score Gap, edited by C. Jencks
and M. Phillips. Washington, DC: Brookings
Institution Press.
Flores, Alfinio. 2007. ‘‘Examining Disparities in
Mathematics Education: Achievement Gap or
Opportunity Gap? The High School Journal
91(4):29–42.
Fryer, Ronald Jr. and Steven D. Levitt. 2004.
‘‘Understanding the Black-White Test Score Gap in
the First Two Years of School.’’ The Review of
Economics and Statistics 86(2):447–64.
Fryer, Ronald Jr. and Steven D. Levitt. 2006. ‘‘The
Black-White Test Score Gap through Third
Grade.’’ American Law and Economics Review
8(2):249–81.
Gamoran, Adam and Eileen Hannigan. 2000. ‘‘Algebra
for Everyone? Benefits of College Preparatory
Mathematics for Students with Diverse Abilities in
Early Secondary School.’’ Educational Evaluation
and Policy Analysis 22(2):241–54.
Gandara, Patricia. 2005. Fragile Futures: Risk and
Vulnerability among Latino High Achievers.
Princeton, NJ: Policy Information Center,
Educational Testing Service (ETS).
Gosa, Travis and Karl L. Alexander. 2007. ‘‘Family
(Dis)Advantage and the Educational Prospects of
Better Off African American Youth: How Race
Still Matters.’’ Teachers College Record
109(2):285–321.
Grodsky, Eric, Demetra Kalogrides, and Julie Siebens.
2007. ‘‘Virtuous Cycle or Perverse Openness?
Race, Ethnicity and Social Class Reconsidered.’’
Presented at the annual meeting of the American
Educational Research Association, April 11,
Chicago, IL.
Hanushek, Eric and Steven G. Rivkin. 2006. ‘‘School
Quality and the Black-White Achievement Gap.’’
NBER Working Papers 12651, National Bureau of
Economic Research, Inc., Chicago, IL.
Harris, Angel. 2008. ‘‘Optimism in the Face of Despair:
Black-White Differences in Beliefs about School as
a Means for Upward Social Mobility.’’ Social
Science Quarterly 89:629–51.
Harris, Angel and Keith Robinson. 2007. ‘‘Schooling
Behaviors or Prior Skills? A Cautionary Tale of
Omitted Variable Bias within Oppositional Culture
Theory.’’ Sociology of Education 80(2):139–57.
Hart, Betty and Todd R. Risley. 1995. Meaningful
Differences in the Everyday Experience of Young
American Children. Baltimore, MD: Brookes
Publishing.
Hedges, Larry and Amy Nowell. 1999. ‘‘Changes in the
Black-White Gap in Achievement Test Scores.’’
Sociology of Education 72(2):111–35.
Hout, Michael. 2004. ‘‘Getting the Most Out of the GSS
Income Measures.’’ GSS Methodological Report
101. Retrieved November 30, 2009 (http://publicdata
.norc.org:41000/gss/DOCUMENTS/REPORTS/Metho-
dological_Reports/MR101.pdf).
Hoxby, Caroline M. and Gretchen Weingarth. 2006.
‘‘Taking Race Out of the Equation: School
Reassignment and the Structure of Peer Effects.’’
Retrieved May 28, 2010 (http://www.hks.harvar-
d.edu/inequality/Seminar/Papers/Hoxby06.pdf).
Ingels, Steven J., Daniel J. Pratt, David Wilson, Laura J.
Burns, Douglas Currivan, D., James E. Rogers, and
Shirley Hubbard-Bednasz. 2007. Education
Longitudinal Study of 2002: Base-Year to
Second Follow-up Data File Documentation.
NCES 2008-347. Washington, DC: U.S. Department
of Education, National Center for Education
Statistics.
Inzlicht, Michael and Talia Ben-Zeev. 2000. ‘‘A
Threatening Intellectual Environment: Why
Females Are Susceptible to Experiencing Problem-
solving Deficits in the Presence of Males.’’
Psychological Science 11:365–71.
Jencks, Christopher and Meredith Phillips. 1998. The
Black-White Test Score Gap. Washington, DC:
Brookings Institution Press.
Kao, Grace and Marta Tienda. 1995. ‘‘Optimism and
Achievement: The Educational Performance of
Immigrant Youth.’’ Social Science Quarterly
76(1):1–19.
268 Sociology of Education 83(3)
at Serials Records, University of Minnesota Libraries on October 14, 2010soe.sagepub.comDownloaded from

Kelly, Sean. 2007. ‘‘Race, Social Class, and Student
Engagement in Middle School English Classrooms.’’
Social Science Research 37:434–48.
———. 2009. ‘‘The Black-White Gap in Mathematics
Course Taking.’’ Sociology of Education 82(1):47–79.
Kim, Doo Hwan and Barbara Schneider. 2005. ‘‘Social
Capital in Action: Alignment of Parental Support
in Adolescents’ Transition to Postsecondary
Education.’’ Social Forces 84(2):1181–206.
Lareau, Annette. 2000. Home Advantage: Social Class
and Parental Intervention in Elementary Education.
2nd ed. Lanham, MD: Rowan and Littlefield.
———. 2003. Unequal Childhoods: Class, Race, and
Family Life. Berkeley, CA: University of
California Press.
Lareau, Annette and Erin McNamara Horvat. 1999.
‘‘Moments of Social Inclusion and Exclusion:
Race, Class, and Cultural Capital in Family-School
Relationships.’’ Sociology of Education 72:37–53.
Lee, Valerie and Anthony S. Bryk. 1988. ‘‘Curriculum
Tracking as Mediating the Social Distribution of
High School Achievement.’’ Sociology of
Education 61(2):78–94.
Linn, Robert and Kevin Welner, eds. 2007. Race-
Conscious Policies for Assigning Students to
Schools: Social Science Research and the Supreme
Court Cases. Washington, DC: National Academy
of Education Committee on Social Science
Research Evidence on Racial Diversity in Schools.
Lubienski, Sarah. 2002. ‘‘A Closer Look at Black-White
Mathematics Gaps: Intersections of Race and SES in
NAEP Achievement and Instructional Practices
Data.’’ Journal of Negro Education 71(4):269–87.
Lucas, Samuel. 1999. Tracking Inequality: Stratification
and Mobility in American High Schools. Columbia,
NY: Teachers College Press.
Lucas, Samuel and Mark Berends. 2007. ‘‘Race and
Track Location in U.S. Public Schools.’’ Research
in Social Stratification and Mobility 25:169–87.
Massey, Douglas S. and Nancy A. Denton. 1993. American
Apartheid: Segregation and the Making of the
Underclass. Cambridge, MA: Harvard University Press.
Massey, Douglas S. and Mary J. Fischer. 2006. ‘‘The
Long Term Consequences of Segregation: Minority
Performance at Selective Academic Institutions.’’
Ethnic and Racial Studies 29(1):1–26.
McNeal, Ralph B. Jr. 1999. ‘‘Parental Involvement as
Social Capital: Differential Effectiveness on
Science Achievement, Truancy, and Dropping
Out.’’ Social Forces 78:117–44.
Mickelson, R. and Damien Heath. 1999. ‘‘The Effects of
Segregation on African American High School
Seniors’ Academic Achievement.’’ Journal of
Negro Education 68(4):566–86.
Mickelson, Roslyn. 2001. ‘‘Subverting Swann: First- and
Second-generation Segregation in the Charlotte-
Mecklenburg Schools.’’ American Educational
Research Journal 8(2):215–52.
Morgan, Stephen. 2002. ‘‘Modeling Preparatory
Commitment and Non-repeatable Decisions:
Information Processing, Preference Formation, and
Educational Attainment.’’ Rationality and Society
14:387–429.
———. 2005. On the Edge of Commitment: Educational
Attainment and Race in the United States. Stanford,
CA: Stanford University Press.
Morgan, Stephen and Jal D. Mehta. 2004. ‘‘Beyond the
Laboratory: Evaluating the Survey Evidence for the
Dis-identification Explanation of Black-White
Differences in Achievement.’’ Sociology of Education
77(1):82–101.
Morris, Edward. 2005. ‘‘From ‘Middle Class’ to ‘Trailer
Trash’: Teachers’ Perceptions of White Students in
a Predominately Minority School.’’ Sociology of
Education 78(2):99–121.
National Research Council. 2009. Rising above the
Gathering Storm Two Years Later: Accelerating
Progress toward a Brighter Economic
Future. Washington, DC: The National Academies
Press.
Neal, Derek and William R. Johnson. 1996. ‘‘The Role
of Pre-market Factors in Black-White Wage
Differences.’’ Journal of Political Economy
104:869–95.
Noguera, Pedro and Jean Yonemura Wing, eds. 2006.
Unfinished Business: Closing the Racial
Achievement Gap in Our Schools. San Francisco,
CA: Jossey-Bass.
Oakes, Jeannie. 1990. ‘‘Opportunities, Achievement, and
Choice: Women and Minority Students in Science
and Mathematics.’’ Review of Research in
Education 16:153–222.
Oropesa, R. S. and Nancy S. Landale. 2009. ‘‘Why Do
Immigrant Youths Who Never Enroll in U.S.
Schools Matters? School Enrollment among
Mexicans and Non-Hispanic Whites.’’ Sociology of
Education 82(3):240–66.
Pallas, Aaron and Karl Alexander. 1983. ‘‘Sex
Differences in Quantitative SAT Performance: New
Evidence on the Differential Coursework
Hypothesis.’’ American Educational Research Journal
20(2):165–82.
Patillo-McCoy, Mary. 1999. Black Picket Fences:
Privilege and Peril among the Black Middle Class.
Chicago, IL: University of Chicago Press.
Phillips, Meredith, James Crouse, and John Ralph. 1998.
‘‘Does the Black-White Test Score Gap Widen after
Children Enter School?’’ Pp. 229–72 in The Black-
White Test Score Gap, edited by C. Jencks and
M. Philips. Washington, DC: Brookings Institution
Press.
Ream, Robert. 2003. ‘‘Counterfeit Social Capital and
Mexican-American Underachievement.’’ Educational
Evaluation and Policy Analysis 25(3):237–62.
Sackett, Paul, Chaitra Hardison, and Michael Cullen.
2004. ‘‘On Interpreting Stereotype Threat as
Riegle-Crumb and Grodsky 269
at Serials Records, University of Minnesota Libraries on October 14, 2010soe.sagepub.comDownloaded from

Accounting for African American–White differences
on Cognitive Tests. American Psychologist 59:7–13.
Schmid, Carol. 2001. ‘‘Educational Achievement,
Language-Minority Students, and the New Second
Generation.’’ Sociology of Education 74:71–87.
Schneider, Barbara, Christopher Swanson, and Catherine
Riegle-Crumb. 1998. ‘‘Opportunities for Learning:
Course Sequences and Positional Advantages.’’
Social Psychology of Education 2:25–53.
Sewell, William, Archibald Haller, and George
Ohlendorf. 1970. ‘‘The Educational and Early
Occupational Attainment Process: Replication and
Revision.’’ American Sociological Review 35:1014–27.
Shettle, Carolyn, Shep Roey, Joy Mordica, Robert
Perkins, Christine Nord, Jelina Teodorovic, Janice
Brown, Marsha Lyons, Chris Averett, and David
Kastberg. 2007. The Nation’s Report Card:
America’s High School Graduates. NCES 2007-
467. Washington, DC: Government Printing Office.
Steele, Claude M. 1997. ‘‘A Threat in the Air: How
Stereotypes Shape Intellectual Identity and
Performance’’. American Psychologist 52:613–29.
Steele, Claude M. and Joshua Aronson. 1998. ‘‘How
Stereotypes Influence the Standardized Test
Performance of Talented African American
Students.’’ Pp. 401–27 in The Black-White Test
Score Gap, edited by C. Jencks and M. Phillips.
Washington, DC: Brookings Institution.
Stevenson, David, Kathryn Schiller, and Barbara
Schneider. 1994. ‘‘Sequences of Opportunities for
Learning.’’ Sociology of Education 67:184–98.
Tyson, Karolyn. 2002. ‘‘Weighing in: Elementary-age
Students and the Debate on Attitudes toward
School among Black Students.’’ Social Forces
80(4):1157–1189.
Tyson, Karolyn, William Darity, Jr., and Domini
Castellino. 2005. ‘‘It’s not a ‘Black Thing’:
Understanding the Burden of Acting White and
Other Dilemmas of High Achievement.’’ American
Sociological Review 70(4):582–605.
U.S. Department of Education, National Center for
Education Statistics. 2007. The Condition of
Education 2007. NCES 2007-064. Washington,
DC: Government Printing Office.
Winship, Christopher and Larry Radbill. 1994.
‘‘Sampling Weights and Regression Analysis.’’
Sociological Methods and Research 23(2):230–57.
Wotjkiewicz, Roger and Katherine Donato. 1995.
‘‘Hispanic Educational Attainment: The Effects of
Family Background and Nativity.’’ Social Forces
74(2):559–74.
BIOS
Catherine Riegle-Crumb is Assistant Professor of
Curriculum and Instruction at the University of Texas
at Austin. Her research focuses on gender and racial/
ethnic inequality in educational experiences and
achievement, particularly in the areas of science and
math. Riegle-Crumb is currently Co-Principal
Investigator on a National Science Foundation grant to
study how various dimensions of academic preparation
in high school predict students’ entry into science, tech-
nology, engineering, and mathematics (STEM) majors in
college, with particular attention to the trajectories of
African American and Hispanic Latino students.
Eric Grodsky is Associate Professor of Sociology at the
University of Minnesota. In his substantive work,
Grodsky seeks to understand the dimension and causes
of racial/ethnic and socioeconomic inequality in educa-
tional achievement, college attendance and completion.
Grodsky has published his work in the American
Sociological Review, the American Journal of
Sociology and Sociology of Education in addition to
other venues.
270 Sociology of Education 83(3)
at Serials Records, University of Minnesota Libraries on October 14, 2010soe.sagepub.comDownloaded from


![TITLE V--NATIONAL FLOOD INSURANCE Insurance … · Sept.23 RIEGLE COMMUNITY DEVELOPMENT ACT Sec. 511 [Riegle Community Development and Regulatory Improvement Act of 1994] P.L. 103-325](https://static.fdocuments.in/doc/165x107/5b54ce247f8b9a5a578dc1e6/title-v-national-flood-insurance-insurance-sept23-riegle-community-development.jpg)