Monitoring Socioeconomics within Collaborative Forestry Projects

ICRISAT is a member of the CGIAR Consortium.
Socioeconomics Discussion Paper Series
3/13/2013 ICRISAT Patancheru, India, [email protected]
Series Paper Number 3
Grain Legumes Production, Consumption and Trade Trends in Developing Countries-An
Assessment and Synthesis
S Nedumaran, P Abinaya, B Shraavya, Parthasarathy Rao and C Bantilan

DISCLAIMER This paper is part of ICRISAT Economics Discussion paper series. This series
disseminates the findings of work in progress to encourage the exchange of ideas about a wide array of issues in the area of agriculture for development. An objective of the series is to get the findings out quickly, even if the presentations are less than fully polished. The papers carry the names of the authors and should be cited accordingly. Any comments and suggestions are more than welcome and should be addressed to the author who’s contact details can be found at the bottom of the cover page. The findings, interpretations, and conclusions expressed in this paper are entirely those of the authors. They do not necessarily represent the views of the International Crops Research Institute for the Semi-Arid Tropics and its affiliated organizations.
ICRISAT - Socioeconomics Discussion Paper Series

Grain Legumes Production, Consumption and Trade Trends in Developing Countries-An Assessment and Synthesis
ICRISAT - Socioeconomics Discussion Paper Series 1
Abstract Over the years, legumes are increasingly recognized for their nutritional
significance and for enhancing the soil fertility yet research in legumes has always lagged behind when compared to cereals. This situation is gradually changing so as to invest more in pulses research for meeting the growing demand for them all over the world. This paper analyses the historical trends in production, consumption and trade. Mostly it has been found that production has not been able to meet demand due to the secondary treatment of pulses in developing economies. Only the marginal rainfed areas are demarcated for pulse production leading to high variability in yields and producer prices, and the inter-regional differences in farm-gate prices reflect the uneven distribution of pulse production and demand–supply mismatch. Developed countries with their enormous resources, have expanded production of food legumes in the case of fababean, chickpea, lentils and soybean and lead in the export of these crops. Developing countries have yet to keep pace with them at least to be able to meet current demand if not future demand.
Keywords: Grain legumes; historic trends; production and consumption; trade JEL classification: Q11, Q17

Grain Legumes Production, Consumption and Trade Trends in Developing Countries-An Assessment and Synthesis
ICRISAT - Socioeconomics Discussion Paper Series 2
Contents Grain Legumes Production, Consumption and Trade Trends in Developing
Countries-An Assessment and Synthesis .................................................................. 1
Abstract [max 500 words] .................................................................................... 1
1 Introduction ....................................................................................................... 4
2 Methodology ..................................................................................................... 4
3 Grain legumes crop area, yield and production: global context ........................ 6
4 Dry bean ........................................................................................................... 8
4.1 Area, production and yield: ......................................................................... 8
4.2 Producer prices ........................................................................................ 13
4.3 Trade ........................................................................................................ 14
4.4 Consumption ............................................................................................ 14
5 Chickpea ......................................................................................................... 15
5.1 Area, production and yield ........................................................................ 15
5.2 Producer prices ........................................................................................ 19
5.3 Trade ........................................................................................................ 20
5.4 Consumption ............................................................................................ 21
6 Cowpea ........................................................................................................... 22
6.1 Area, production and yield trends ............................................................. 23
6.2 Producer prices ........................................................................................ 26
6.3 Trade ........................................................................................................ 27
6.4 Consumption ............................................................................................ 27
7 Pigeonpea ....................................................................................................... 28
7.1 Area, production and yield ........................................................................ 28
7.2 Producer prices ........................................................................................ 31
7.3 Trade ........................................................................................................ 32
7.4 Consumption ............................................................................................ 32
8 Lentil ............................................................................................................... 33
8.1 Area, production and yield ........................................................................ 33
8.2 Producer prices ........................................................................................ 38
8.3Trade ......................................................................................................... 39
8.4 Consumption ............................................................................................ 39
9 Fababean ........................................................................................................ 40
9.1 Area, production and yield ........................................................................ 40

Grain Legumes Production, Consumption and Trade Trends in Developing Countries-An Assessment and Synthesis
ICRISAT - Socioeconomics Discussion Paper Series 3
9.2 Producer prices ........................................................................................ 44
9.3 Trade ........................................................................................................ 45
9.4 Consumption ............................................................................................ 46
10 Soybean ........................................................................................................ 46
10.1 Area, production and yield trends ........................................................... 46
10.2 Producer prices ...................................................................................... 51
10.3 Trade ...................................................................................................... 52
10.4 Consumption .......................................................................................... 53
11 Groundnut ..................................................................................................... 54
11.1 Area, production and yield ...................................................................... 54
11.2 Producer prices ...................................................................................... 58
11.3 Trade ...................................................................................................... 59
11.4 Consumption .......................................................................................... 60
12 Conclusion .................................................................................................... 61
5 References[examples can be found in the guidlines] ...................................... 63
Appendixes [limit the number to only the absolutely necessary] ........................ 65

Grain Legumes Production, Consumption and Trade Trends in Developing Countries-An Assessment and Synthesis
ICRISAT - Socioeconomics Discussion Paper Series 4
1 Introduction Legumes play an important nutritional role in the diet of millions of people living
in the developing countries, sometimes referred to as the “poor man’s meat”. It forms a significant part of the diet of vegetarians being vital sources of protein, calcium, iron, phosphorus and other minerals (Latham 1997). Legumes are multipurpose crops and are consumed either directly as food or in various processed forms, or as feed. Legumes are often used as rotation crops since they assist in nitrogen fixation. However, by and large, yields and production of legume crops have been stagnant in the developing countries over the past few decades. Agricultural research and development efforts in many of these countries concentrated on increasing cereal yields and production to achieve food security. However, retraining the research spotlight on legumes will have significant impacts on nutritional security and soil fertility.
Recently observed rising prices suggest the burgeoning demand for legumes the world over due to rising incomes and population. The increasing demand for livestock feed even in developing countries is a significant systemic change in the demand structure. In addition, the significant demand that arises from the bio-diesel industry for soybean due to the recent policy initiatives in Europe and the US, has also contributed to the increase in demand and prices of substitute crops. These factors indicate that in the near future, there is going to be substantive shifts in the utilization patterns and price structure for grain legumes.
There are some basic reasons why pulses are lagging behind cereals in terms of area expansion and productivity gain. The main reason is that pulses are considered secondary to cereals in terms of consumer preferences and consequently research activities are concentrated in cereals. Due to high cereal productivity, pulses are being pushed to marginal regions of cultivation with has low rainfall and poor soil fertility. This affects the pulses production in several ways; prices of pulses are highly unstable due to high yield variability. Furthermore, there is high competition from wheat due to the government price support policy. Within pulses, oilseeds especially soybeans because of its multiple uses are preferred in some regions of the world than the food legumes (Bejiga, 2000).
Among all the pulses, soybeans are unique because there are sources of complete protein. Its protein content accounts for almost 40% of its weight. Therefore, unlike other beans, soybeans can be a substitute for animal-based foods for vegans due to its high protein content with relatively less fat (US Food and Drug Administration) (Henkel, 2000). Moreover, its potential health benefits include reducing cardiovascular, diabetic and cancer risks.
2 Methodology FAO recognises eleven categories of legumes, of which six are discussed here.
These are dry beans, dry broad beans (referred to here as fababean), chickpea, dry cowpea, pigeonpea and lentils. In addition, soybean and groundnut are also discussed here as a grain legume though FAO distinguishes them as oilseeds.

Grain Legumes Production, Consumption and Trade Trends in Developing Countries-An Assessment and Synthesis
ICRISAT - Socioeconomics Discussion Paper Series 5
However, in much of the developing world, these legumes contribute to the food basket. The dry bean category in FAO includes all species of Phaseolus and Vigna. As it includes so many major types of beans, the data are not strictly comparable across countries and regions. Common beans are grown in Central America and mung beans are grown in South and South East Asia. So the bean category referred to in here includes common beans and others and is collectively called dry beans.
The main objective of this study is to analyse the global and regional trends in production, consumption and trade of these food legumes. The following regions are included for the trend analysis: South and South East Asia (SSEA), Central and East Asia (CEA), Middle East and North Africa (MENA), Sub-Saharan Africa (SSA), and Latin America and the Caribbean (LAC)1. Developed countries are included under the head named Developed World (DW, which includes Europe, North America, Australia, New Zealand, and Japan) to enable a comparative analysis. The period of study begins at 1980 and ends at 2010 which is the latest year for which data is available. Export data is available only till 2009 and consumption till 2007. Detailed consumption data from FAOSTAT was available for dry beans, groundnut and soybean and these have been analysed. For all other crops, domestic availability (the sum of production and net trade) has been calculated for all the crops to serve as a proxy for demand (Table 1). To further analyse consumption pattern, per capita availability of pulses per year has been calculated with the following formula: Per capita availability per year = (Production +Imports-Exports)/Population. Availability differs from consumption with regard to stock variation from year to year, seed and wastage. Both these components represent the combined usage of the crop in terms of food, feed and other utilisation. So, an increase in consumption/availability trend could represent feed usage to livestock of the pulse crop rather than direct consumption as food. In the case of groundnut and soybean, both being oilseeds, consumption demand represents the demand for oil and meal by livestock. Groundnut is crushed to produce oil as its primary end-product whereas soybean is crushed to produce soymeal for livestock where oil is an inexpensive by-product (Goldsmith, 2008). Since 2007, about 15% of the soybean oil demand in US goes for the production of bio-diesel (Goldsmith, 2008) and this proportion is likely to increase as the push to renewable energy gains more traction.
1 For the regional classification, refer to Appendix 1

Grain Legumes Production, Consumption and Trade Trends in Developing Countries-An Assessment and Synthesis
ICRISAT - Socioeconomics Discussion Paper Series 6
Table 1 Per capita availability of legumes- average, growth rate and variation between 1980 and 2009 across regions 1980-2009 CEA LAC MENA SSA SSEA DW
Beans, dry Growth rate (%/year) -2.8 -0.3 0.6 -0.1 -0.6 -0.1 Average consumption (kg/head/year) 1.2 10.7 1.2 4.5 3.0 1.8 Co-efficient of variation (%) 37% 10% 17% 8% 14% 9%
Chickpeas Growth rate (%/year) 42.2 -5.8 0.9 -0.5 -0.5 2.6 Average consumption (kg/head/year) 0.0 0.3 2.3 0.3 3.5 0.2 Co-efficient of variation (%) 109% 50% 20% 21% 14% 53%
Cow peas, dry Growth rate (%/year) - -0.1 1.7 3.2 4.6 5.5 Average consumption (kg/head/year) - 0.1 0.0 4.5 0.0 0.0 Co-efficient of variation (%) - 12% 88% 28% 53% 74%
Pigeonpeas Growth rate (%/year) - -2.8 - 1.9 -0.6 - Average consumption (kg/head/year) - 0.1 - 0.4 1.5 - Co-efficient of variation (%) - 32% - 20% 12% -
Lentils Growth rate (%/year) 4.4 2.9 -0.5 2.5 0.8 1.4 Average consumption (kg/head/year) 0.1 0.3 2.3 0.1 0.7 0.3 Co-efficient of variation (%) 55% 26% 25% 36% 11% 54%
Fababeans
Growth rate (%/year) -2.3 -1.0 0.3 -0.9 6.7 -1.6 Average consumption (kg/head/year) 1.5 0.3 2.7 0.7 0.0 0.6 Co-efficient of variation (%) 33% 23% 10% 33% 77% 31% 1980-2009 Soybeans Growth rate (%/year) 4.9 4.1 4.3 4.8 6.5 1.3 Average consumption (kg/head/year) 18.1 82.2 4.6 1.2 4.5 55.0 Co-efficient of variation (%) 51% 37% 52% 38% 47% 15%
Groundnuts, with shell Growth rate (%/year) 3.9 -0.7 1.0 1.1 -1.2 0.3 Average consumption (kg/head/year) 6.9 1.9 2.8 9.9 5.3 1.6 Co-efficient of variation (%) 34% 21% 32% 13% 17% 13%
3 Grain legumes crop area, yield and production: global context Globally the production of all the focus crops has increased at the rate of more
than 1% per annum from 1980. Cowpea production has experienced the highest growth (4.71% per annum between 1994-95 and 2008-10) since some new regions have recently embarked upon its cultivation (Table 2) although yield levels continue to be low. Area under soybean has expanded quite rapidly in Latin America and
Grain Legumes Production, Consumption and Trade Trends in Developing Countries-An Assessment and Synthesis
ICRISAT - Socioeconomics Discussion Paper Series 7
South Asia leading to a production growth rate of 4.38% per annum (Table 2). Lentil and pigeonpea production have also had remarkable increases in the fifteen year period growing at the rate of 2.25% and 2.09% per annum (Table 2).
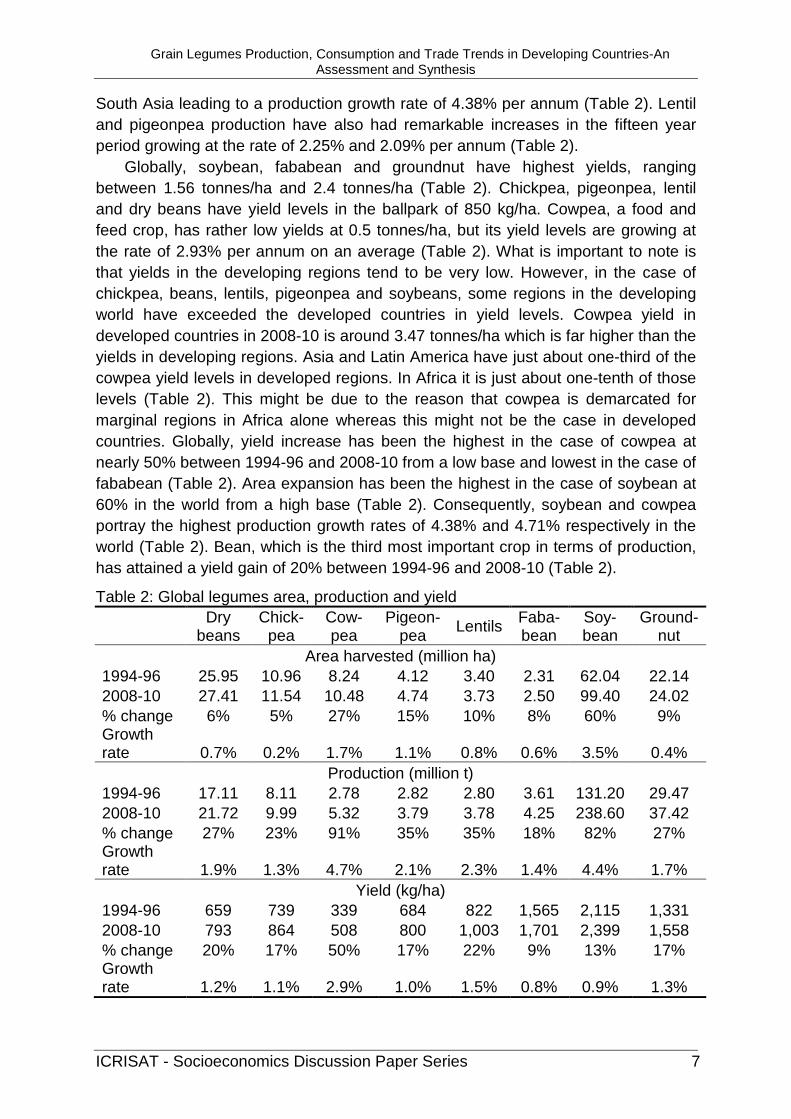
Globally, soybean, fababean and groundnut have highest yields, ranging between 1.56 tonnes/ha and 2.4 tonnes/ha (Table 2). Chickpea, pigeonpea, lentil and dry beans have yield levels in the ballpark of 850 kg/ha. Cowpea, a food and feed crop, has rather low yields at 0.5 tonnes/ha, but its yield levels are growing at the rate of 2.93% per annum on an average (Table 2). What is important to note is that yields in the developing regions tend to be very low. However, in the case of chickpea, beans, lentils, pigeonpea and soybeans, some regions in the developing world have exceeded the developed countries in yield levels. Cowpea yield in developed countries in 2008-10 is around 3.47 tonnes/ha which is far higher than the yields in developing regions. Asia and Latin America have just about one-third of the cowpea yield levels in developed regions. In Africa it is just about one-tenth of those levels (Table 2). This might be due to the reason that cowpea is demarcated for marginal regions in Africa alone whereas this might not be the case in developed countries. Globally, yield increase has been the highest in the case of cowpea at nearly 50% between 1994-96 and 2008-10 from a low base and lowest in the case of fababean (Table 2). Area expansion has been the highest in the case of soybean at 60% in the world from a high base (Table 2). Consequently, soybean and cowpea portray the highest production growth rates of 4.38% and 4.71% respectively in the world (Table 2). Bean, which is the third most important crop in terms of production, has attained a yield gain of 20% between 1994-96 and 2008-10 (Table 2).
Table 2: Global legumes area, production and yield
Dry beans
Chick-pea
Cow-pea
Pigeon-pea Lentils Faba-
bean Soy-bean
Ground-nut
Area harvested (million ha) 1994-96 25.95 10.96 8.24 4.12 3.40 2.31 62.04 22.14 2008-10 27.41 11.54 10.48 4.74 3.73 2.50 99.40 24.02 % change 6% 5% 27% 15% 10% 8% 60% 9% Growth rate 0.7% 0.2% 1.7% 1.1% 0.8% 0.6% 3.5% 0.4%
Production (million t) 1994-96 17.11 8.11 2.78 2.82 2.80 3.61 131.20 29.47 2008-10 21.72 9.99 5.32 3.79 3.78 4.25 238.60 37.42 % change 27% 23% 91% 35% 35% 18% 82% 27% Growth rate 1.9% 1.3% 4.7% 2.1% 2.3% 1.4% 4.4% 1.7%
Yield (kg/ha) 1994-96 659 739 339 684 822 1,565 2,115 1,331 2008-10 793 864 508 800 1,003 1,701 2,399 1,558 % change 20% 17% 50% 17% 22% 9% 13% 17% Growth rate 1.2% 1.1% 2.9% 1.0% 1.5% 0.8% 0.9% 1.3%

Grain Legumes Production, Consumption and Trade Trends in Developing Countries-An Assessment and Synthesis
ICRISAT - Socioeconomics Discussion Paper Series 8
Note: Percentage change and growth rate pertains to the period between 1994 and 2010. Also, growth rate is an annual figure.
Figure 1: Area shares of legumes in the developing world in 2008-10
Figure 2 Area shares of legumes in the developed world in 2008-10
4 Dry bean
4.1 Area, production and yield: Dry beans have the highest area share after soybean with 27 million ha in 2008-
10 (Table 3). Production has grown annually at the rate of 1.92% mostly due to yield gains. However, it should be noted that bean has one of the lowest yields among food legumes at 748 kg/ha in 2008-10. These low global yield levels are because most of the production comes from the developing countries, even though the
18%
2%
8%
7%
16% 2% 3%
44%
Beans, dry
Broad beans, horse beans, dry Chick peas
Cow peas, dry
Groundnuts, with shell
Lentils
Pigeon peas
Soybeans
3%
1% 1% 0% 2%
3%
0%
90%
Beans, dry
Broad beans, horse beans, dry Chick peas
Cow peas, dry
Groundnuts, with shell
Lentils
Pigeon peas
Soybeans

Grain Legumes Production, Consumption and Trade Trends in Developing Countries-An Assessment and Synthesis
ICRISAT - Socioeconomics Discussion Paper Series 9
average yield of bean in developed countries is 133% higher than that of developing countries. Unlike other legumes, the intensity of diseases is quite high in beans (Beebe 2006). Hence, high yielding varieties have not been focused upon due to the need for disease resistant varieties and demand for specific commercial types. In recent years, pilot integrated pest management studies in the Andean region of South America conducted by CIAT have been successful in reducing pesticide applications by more than 50 percent in targeted regions (Beebe 2006).
Table 3: Dry bean area, yield and production
CEA LAC MENA SSA SSEA DW World
Area harvested (million ha) 1994-96 1.68 8.32 0.23 3.55 10.82 1.36 25.95 2008-10 1.25 6.85 0.15 5.82 12.20 1.14 27.41 % change (1994-2010) -25% -18% -34% 64% 13% -16% 6% Growth rate (%/year for 1994-2010) -1.8% -1.2% -3.0% 3.7% 1.5% -1.6% 0.7%
Production (million t) 1994-96 1.81 5.29 0.30 2.10 5.43 2.18 17.11 2008-10 1.92 5.93 0.31 3.82 7.65 2.10 21.72 % change (1994-2010) 6% 12% 3% 82% 41% -4% 27% Growth rate (%/year for 1994-2010) 0.5% 1.1% 0.1% 4.4% 3.0% -0.8% 1.9%
Yield (kg/ha) 1994-96 1,086 635 1,285 592 502 1,604 659 2008-10 1,530 866 1,997 657 629 1,845 793 % change (1994-2010) 41% 36% 55% 11% 25% 15% 20% Growth rate (%/year for 1994-2010) 2.4% 2.3% 3.1% 0.7% 1.5% 0.9% 1.2%
India, Brazil, Myanmar and Mexico together account for about 60% of the total area under dry bean producing a total 11 million tonnes (Table A.1). India with 8.3 million ha, has the highest area under dry bean but produces only 3.4 million tonnes whereas Brazil with 3.78 million ha of area produces nearly the same quantity (Table A.1). However, in Brazil, the variability of yield as measured by the coefficient of variation is 26% which is the highest among the top bean producing countries (Table A.1). USA shows the highest yield of almost 2 tonnes/ha with low yield variability in 2008-10 (Table A.1). Followed by USA are China, Myanmar, Argentina and Indonesia which have yield rates exceeding one tonne per hectare.
Latin America and South and South East Asia show positive trends in production both from a high base (Figure 4 and 7). The declining yields in sub-Saharan Africa have been largely augmented by area increases (Figure 6). Production of dry bean in Sub-Saharan Africa has been rapidly expanding from 2.1 million tonnes in 1994-

Grain Legumes Production, Consumption and Trade Trends in Developing Countries-An Assessment and Synthesis
ICRISAT - Socioeconomics Discussion Paper Series 10
96 to 3.82 million tonnes 2008-10 with large area increases (Table 3). East Asia and the developed countries denoted by DW show fluctuating production trends with declining area and rising yields between 1980 and 2010 (Figure 8).
Generally yield has increased across all the regions in the world. Except for Africa and South and South East Asia, area has portrayed a declining trend in all regions. In the developed countries, yield has increased at an annual rate of 0.89% and area has diminished at the rate of 1.64% per annum between 1994 and 2010 resulting in 80,000 tonnes reduction in production (Table 3).
Figure 3: Trends in dry bean area, production and yield in Central and East Asia
Figure 4: Trends in dry bean area, production and yield in Latin America and Caribbean
900
1300
1700
2100
2500
0.0
0.5
1.0
1.5
2.0
2.5
3.0
1980
19
82
1984
19
86
1988
19
90
1992
19
94
1996
19
98
2000
20
02
2004
20
06
2008
20
10
Yiel
d (k
g/ha
)
Area
(mill
ion
ha)
Prod
uctio
n (m
illio
n t)
Area Production Yield
400
800
1200
1600
0.0 1.0 2.0 3.0 4.0 5.0 6.0 7.0 8.0 9.0
10.0
1980
19
82
1984
19
86
1988
19
90
1992
19
94
1996
19
98
2000
20
02
2004
20
06
2008
20
10
Yiel
d (k
g/ha
)
Area
(mill
ion
ha)
Prod
uctio
n (m
illio
n t)
Area Production Yield

Grain Legumes Production, Consumption and Trade Trends in Developing Countries-An Assessment and Synthesis
ICRISAT - Socioeconomics Discussion Paper Series 11
Figure 5: Trends in dry bean area, production and yield in Middle East and North Africa
Figure 6 : Trends in dry bean area, production and yield in sub-Saharan Africa
1000
1400
1800
2200
2600
3000
0.0
0.1
0.1
0.2
0.2
0.3
0.3
0.4
0.4
1980
19
82
1984
19
86
1988
19
90
1992
19
94
1996
19
98
2000
20
02
2004
20
06
2008
20
10
Yiel
d (k
g/ha
)
Area
(mill
ion
ha)
Prod
uctio
n (m
illio
n t)
Area Production Yield
500
900
1300
0.0
1.0
2.0
3.0
4.0
5.0
6.0
7.0
1980
19
82
1984
19
86
1988
19
90
1992
19
94
1996
19
98
2000
20
02
2004
20
06
2008
20
10
Yiel
d (k
g/ha
)
Area
(mill
ion
ha)
Prod
uctio
n (m
illio
n t)
Area Production Yield

Grain Legumes Production, Consumption and Trade Trends in Developing Countries-An Assessment and Synthesis
ICRISAT - Socioeconomics Discussion Paper Series 12
Figure 7 : Trends in dry bean area, production and yield in South and South East Asia
Figure 8 : Trends in dry bean area, production and yield in developed regions
350
750
1150
0.0
2.0
4.0
6.0
8.0
10.0
12.0
14.0
16.0
1980
19
82
1984
19
86
1988
19
90
1992
19
94
1996
19
98
2000
20
02
2004
20
06
2008
20
10
Yiel
d (k
g/ha
)
Area
(mill
ion
ha)
Prod
uctio
n (m
illio
n t)
Area Production Yield
800
1200
1600
2000
2400
2800
0.0
0.5
1.0
1.5
2.0
2.5
3.0
1980
1982
1984
1986
1988
1990
1992
1994
1996
1998
2000
2002
2004
2006
2008
2010
Yiel
d (k
g/ha
)
Area
(mill
ion
ha)
Prod
uctio
n (m
illio
n t)
Area Production Yield

Grain Legumes Production, Consumption and Trade Trends in Developing Countries-An Assessment and Synthesis
ICRISAT - Socioeconomics Discussion Paper Series 13
4.2 Producer prices2 Generally, all regions portray a downward trend in producer price of dry bean in
the 1990s and an upward trend in the next decade (Figure 9). India being a major producer of dry bean, the price is the lowest among all other regions increasing only 2.8% per annum between 1991 and 2009. In 2009, it was US$430 per t in India. Philippines and Cambodia have more than double the prices than that of India. It should be noted however that Iran and Maldives which have a relatively lower area share within South and South East Asia, showed extremely high prices which could be because of the influence of exchange rate fluctuations and rather than production constraints and therefore have been excluded from calculating the regional average. Latin America and the Caribbean are the biggest producers of dry bean regionally with Brazil and Mexico together contributing about 16% towards the total production. Between 2006 and 2008, producer price of dry bean rose by 83% in that region and has slightly dropped in 2009 to US$1052 per t(Fig 8). Some countries which have a lower area share but have the effect of distorting the regional level trend with extremely high prices have been excluded from the regional producer price trend calculation. These include Puerto Rico, Jamaica, Belize, Dominican Republic, Greece, Austria, Congo and other small scale producers of dry bean.
Figure 9 : Trends in dry bean producer prices across regions
2 The regional producer prices are calculated by averaging the prices available at the country level for all crops. The data on the farm-gate prices is available for the period between 1991 and 2009 from FAOSTAT. This is a rather crude way of depicting the relative demand and status of the crop. The producer price is passed on to the consumer wholly or partially based on the demand for the crop. Sometimes, rising producer prices represent the inflation level which the consumers experience, though it may not be true for crops with high demand.
0
200
400
600
800
1000
1200
1400
1991
19
92
1993
19
94
1995
19
96
1997
19
98
1999
20
00
2001
20
02
2003
20
04
2005
20
06
2007
20
08
2009
US$
per
t
LAC DW SSA SSEA

Grain Legumes Production, Consumption and Trade Trends in Developing Countries-An Assessment and Synthesis
ICRISAT - Socioeconomics Discussion Paper Series 14
4.3 Trade Trade in dry beans has increased in South and South East Asia in 2007-09
compared to the situation in 1994-96 (Table A.9). Imports have increased by 189% from 0.34 million tonnes to 1 million tonnes and export by 64% from 0.64 million tonnes to 1.06 million tonnes from 1994-96 to 2007-09 (Table A.9). Latin America and Caribbean have increased their import of dry bean from 0.38 million tonnes in 1994-96 to 0.63 million tonnes in 2004-06. Again, which variety of bean is being traded is not clear from the data available.
Figure 10 : Trade in dry bean across regions
4.4 Consumption In the case of dry beans, every region shows an upward trend except Central
and East Asia (Figure A.1). In Middle East and North Africa, since production has not increased at rate of consumption growth, a wide production deficit has been found. In 1992, dry bean consumption was at its highest level at 0.49 million tonnes and the deficit was 0.22 million tonnes (Figure A.1). In Central and East Asia, consumption decreased from 2 million tonnes in 1980 to 1 million tonne in 2007 (Figure A.1). Since bean production shows a modest growth during the same period, an increase in the production surplus can be observed compared to the early 1990s.
-4
-308
-60
15 114
187
858
-168 -183 -208
60
-17
-400
-200
0
200
400
600
800
1000
CEA LAC MENA SSA SSEA DW
'000
tonn
es
1980-82
2007-09

Grain Legumes Production, Consumption and Trade Trends in Developing Countries-An Assessment and Synthesis
ICRISAT - Socioeconomics Discussion Paper Series 15
Figure 11: Trends in dry bean per capita availability across regions
Latin America and the Caribbean is the largest consumer of dry beans in the
world. Dry bean availability is declining in Latin America and Caribbean due to various reasons like urbanisation, rising incomes and shift in consumption pattern away from traditional staples particularly among the young population. The variation in incomes found between the rural and urban households also influence the consumption, with urban population consuming lesser beans than the rural population (Pascal, 2002). Between 1980 and 2009, average per capita bean availability has been around 10.7 kg per annum and the co-efficient of variation has been about 10% (Table 1). Consumption has fallen in most other regions. The next largest consumer is sub-Saharan Africa where consumption has remained almost stagnant between 1980 and 2009. Consumption has fallen at the rate of 0.63% per annum in South and South East Asia where the average consumption is around 2.98 kg/person/year (Table 1). The largest fall has occurred in Central and East Asia where the consumption has declined at the rate of 2.8% per annum between 1980 and 2009 and the variability of consumption is also observed to be high at about 37% from year to year (Table 1).
5 Chickpea
5.1 Area, production and yield Chickpea is grown all over the world in about 57 countries under varied
environmental conditions. SSEA dominates in chickpea production with 80% of regional contribution. Yield level in SSEA has increased from 717 kg/ha in 1994-96 to 811 kg/ha in 2008-10 by 13%, growing at an annual rate of 0.85% (Table 4). Although developed countries do not contribute much towards chickpea production, yield is particularly high some Eastern European countries. China also shows a high yield level at 3344 kg/ha in 2008-10 (Table A.2). ICRISAT has released high-
0
2
4
6
8
10
12
14
16
1980
1982
1984
1986
1988
1990
1992
1994
1996
1998
2000
2002
2004
2006
2008
kg/p
erso
n/ye
ar
CEA LAC MENA DW SSA SSEA

Grain Legumes Production, Consumption and Trade Trends in Developing Countries-An Assessment and Synthesis
ICRISAT - Socioeconomics Discussion Paper Series 16
yielding, short duration chickpea varieties resistant to fusarium wilt in Southern India. Area under chickpea has increased six fold in the last 10 years from 95000 to 884,000 metric tons per year and Andhra Pradesh has the highest chickpea yields averaging 1.4 metric tons/hectare. 80% of the chickpea area in Myanmar during 2008-09 was covered by ICRISAT-bred chickpea varieties (http://www.cgiar.org/).
Table 4: Chickpea area, yield and production
CEA LAC MENA SSA SSEA DW World
Area harvested (million ha) 1994-96 0.01 0.14 1.06 0.35 9.06 0.35 10.96 2008-10 0.02 0.10 0.69 0.42 9.76 0.55 11.54 % change (1994-2010) 176% -31% -35% 19% 8% 60% 5% Growth rate (%/year for 1994-2010) 5.3% -2.4% -3.0% 1.3% 0.4% 2.2% 0.2%
Production (million t) 1994-96 0.01 0.21 0.91 0.19 6.50 0.29 8.11 2008-10 0.02 0.15 0.75 0.39 7.94 0.74 9.99 % change (1994-2010) 186% -28% -18% 111% 22% 154% 23% Growth rate (%/year for 1994-2010) 7.8% -2.3% -1.4% 5.5% 1.2% 6.3% 1.3%
Yield (kg/ha) 1994-96 1,154 1,507 862 524 717 816 739 2008-10 1,159 1,594 1,079 939 812 1,339 864 % change (1994-2010) 0% 6% 25% 79% 13% 64% 17% Growth rate (%/year for 1994-2010) 2.3% 0.0% 1.7% 4.2% 0.8% 4.1% 1.1%
India is the single largest producer of chickpea in the world accounting for 68%
(7.88 million ha) of the total area under chickpea (Table A.2). It produced about 6.8 million tonnes in 2008-10 (Table A.2). Pakistan and Turkey are the other important producers of chickpea in Asia contributing about 1.1 million tonnes of production together (Table A.2). Average chickpea yield in the world is about 1 tonne per hectare but in South and South East Asia the average yield is only about 811 tonnes/ha (Table 4). Though the production is low in other developing countries like Turkey, Myanmar, Ethiopia, and Mexico, yield levels exceed 1 tonne/ha (Table A.2). Yield rates are almost 2 tonnes/ha in Yemen and Russia. Developed countries also portray high yield levels (Table A.2).
South and South East Asia shows positive area and yield trends (Figure 16). In the fifteen year period between 1995 and 2010, production has increased by 22% in this region (Table 4). Sub-Saharan Africa and Central and East Asia, other small chickpea growing regions show annual production growth rates of 5.53% and 7.8%

Grain Legumes Production, Consumption and Trade Trends in Developing Countries-An Assessment and Synthesis
ICRISAT - Socioeconomics Discussion Paper Series 17
(1994-2010) up from 350,000 tonnes and 10,000 tonnes in 1994-96 respectively (Table 4).
The highest yield increase has taken place in sub-Saharan Africa at about 80% between 1994-96 and 2008-10 (Table 4). Central and East Asia shows a strong upward trend in area and therefore production also follows suit from a very low base (Figure 12). Area decline is observed in Latin America and Caribbean and Middle East and North Africa (Figure 13 and 14).
Figure 12 : Trends in chickpea area, production and yield in the Central and East Asia
Figure 13 : Trends in chickpea area, production and yield in Latin America and Caribbean
600
2600
4600
6600
8600
0.0
0.0
0.0
0.0
0.0
0.0
0.0
1992 1994 1996 1998 2000 2002 2004 2006 2008 2010
Yiel
d (k
g/ha
)
Area
(mill
ion
ha)
Prod
uctio
n (m
illio
n t)
Area Production Yield
800
1200
1600
2000
2400
2800
3200
3600
4000
0.0
0.1
0.1
0.2
0.2
0.3
0.3
0.4
0.4
1980
19
82
1984
19
86
1988
19
90
1992
19
94
1996
19
98
2000
20
02
2004
20
06
2008
20
10
Yiel
d (k
g/ha
)
Area
(mill
ion
ha)
Prod
uctio
n (m
illio
n t)
Area Production Yield

Grain Legumes Production, Consumption and Trade Trends in Developing Countries-An Assessment and Synthesis
ICRISAT - Socioeconomics Discussion Paper Series 18
Figure 14 : Trends in chickpea area, production and yield in Middle East and North Africa
Figure 15 : Trends in chickpea area, production and yield in sub-Saharan Africa
750
1150
1550
0.0
0.2
0.4
0.6
0.8
1.0
1.2
1.4
1980
19
82
1984
19
86
1988
19
90
1992
19
94
1996
19
98
2000
20
02
2004
20
06
2008
20
10
Yiel
d (k
g/ha
)
Area
(mill
ion
ha)
Prod
uctio
n (m
illio
n t)
Area Production Yield
400
800
1200
1600
2000
0.0 0.1 0.1 0.2 0.2 0.3 0.3 0.4 0.4 0.5 0.5
1980
19
82
1984
19
86
1988
19
90
1992
19
94
1996
19
98
2000
20
02
2004
20
06
2008
20
10
Yiel
d (k
g/ha
)
Area
(mill
ion
ha)
Prod
uctio
n (m
illio
n t)
Area Production Yield

Grain Legumes Production, Consumption and Trade Trends in Developing Countries-An Assessment and Synthesis
ICRISAT - Socioeconomics Discussion Paper Series 19
Figure 16 : Trends in chickpea area, production and yield in South and South East Asia
Figure 17 : Trends in chickpea area, production and yield in developed regions
5.2 Producer prices It would be pertinent to focus on India, as it is the largest producer and consumer
of chickpea in the world and its trend is largely reflected by the South and South East Asia regional trend (Figure 18), more so because data for other major producers of chickpea like Pakistan and Myanmar are not available within the region. Between 1991 and 2009, the producer price in India has risen by 6% to reach US$342 per t in 2009 which is one of the lowest prices in the world (Figure 19). Iran showed a high deviation from the average prices likely for the same reason as in the case of dry bean and so has been opted out of the regional analysis. Turkey and
400
800
1200
1600
2000
0.0
2.0
4.0
6.0
8.0
10.0
12.0
1980
19
82
1984
19
86
1988
19
90
1992
19
94
1996
19
98
2000
20
02
2004
20
06
2008
20
10
Yiel
d (k
g/ha
)
Area
(mill
ion
ha)
Prod
uctio
n (m
illio
n t)
Area Production Yield
400
800
1200
1600
2000
2400
2800
0.0 0.1 0.2 0.3 0.4 0.5 0.6 0.7 0.8 0.9 1.0
1980
19
82
1984
19
86
1988
19
90
1992
19
94
1996
19
98
2000
20
02
2004
20
06
2008
20
10
Yiel
d (k
g/ha
)
Area
(mill
ion
ha)
Prod
uctio
n (m
illio
n t)
Area Production Yield

Grain Legumes Production, Consumption and Trade Trends in Developing Countries-An Assessment and Synthesis
ICRISAT - Socioeconomics Discussion Paper Series 20
Morocco are the other important producers of chickpea in the developing world which show high prices as reflected by the regional trend in Middle East and North Africa (Figure 18). In Turkey prices rose 2.6 times higher in 2009 compared to the level in 1991 to reach US$ 930 per t.
Figure 18 : Trends in chickpea producer prices across regions
5.3 Trade Globally, trade in chickpea has constantly climbed up since 1980-82. Particularly
notable are the developed countries which have increased their chickpea exports by 173% from 182,000 tonnes in 1994-96 to nearly 0.5 million tonnes in 2007-09 (Table A.10). More than 60% of the chickpea produced in developed countries are traded (Table 4). In contrast, South and South East Asia have also increased their chickpea export several fold from just 3500 tonnes to 0.2 million tonnes between 1994-96 and 2007-09 but the percentage traded as against production is just 2.5% (2008-10) (Table A.10). Import of chickpea has also increased three fold during the same period to reach 0.5 million tonnes in 2007-09 (Table A.10). Middle East and North Africa has witnessed a drop in production, rise in import of chickpea and fall in export during the same period between 1994-96 and 2007-09. Latin America and Caribbean has increased its exports by 28% between 1994-96 and 2007-09 and it was found to be exporting over 80% of its production in 2007-09 (Table A.10 and Table 4).
0 100 200 300 400 500 600 700 800 900
1000 19
91
1992
19
93
1994
19
95
1996
19
97
1998
19
99
2000
20
01
2002
20
03
2004
20
05
2006
20
07
2008
20
09
UDS
/ton
ne
LAC MENA DW SSA SSEA

Grain Legumes Production, Consumption and Trade Trends in Developing Countries-An Assessment and Synthesis
ICRISAT - Socioeconomics Discussion Paper Series 21
Figure 19 : Trade in Chickpea across regions
5.4 Consumption South and South East Asia is the single largest producer and consumer of
chickpea in the world. Per capita availability has been highly fluctuating and slightly fallen over the years. This is due to the high population growth in India where the production is not able to sustain the demand. Production has grown by 1.3% per annum between 1980 and 2010. Middle East and North Africa also shows a fluctuating demand which has shown a modest increase at 0.91% per annum between 1980 and 2009. Though consumption levels are higher than two decades ago, recent trends show a declining trend. Area under chickpea has decreased over the years and production has fallen. As a result of which, imports in the region amount to 25% of total production in 2009.The average consumption in Middle East and North Africa is around 2.3 kg/person/year between 1980 and 2009 (Table 1), the highest barring South and South East Asia. In the developed countries, Latin America and sub-Saharan Africa, the consumption levels are low ranging between 0.21 kg/person/year to 0.33 kg/person/year (Table 1). Consumption level has fallen at the rate of 2.61% per annum in the developed countries. However, both Latin American and developed regions show high variability in consumption of more than 50% (Table 1).
0 55
97
0
-11 -50
2
99
-149
21
-302
302
-400
-300
-200
-100
0
100
200
300
400
CEA LAC MENA SSA SSEA DW
'000
tonn
es
1980-82
2007-09

Grain Legumes Production, Consumption and Trade Trends in Developing Countries-An Assessment and Synthesis
ICRISAT - Socioeconomics Discussion Paper Series 22
Figure 20: Trends in per capita availability of chickpea across regions
6 Cowpea Cowpea is grown on over 10 million ha of land in the developing countries of
Asia, Africa and Latin America (Table 5). Globally, area has expanded by 27% in the fifteen years between 1994-96 and 2008-10, leading to a 90% increase in production (Table 5). Cowpea yield has increased at an annual rate of 1.38% from a low base of 339 kg/ha in 1994-96 in the world (Table 5). In 2008-10, sub-Saharan Africa had produced 2.65 million tonnes of cowpea contributing to 94% of total cowpea production (Table 5). Since 1970, the International Institute of Tropical Agriculture (IITA) in Nigeria has worked on developing and distributing improved cowpea materials and new germplasm lines to over 60 countries. Considerable progress has been made in cowpea breeding, and a range of varieties has been developed, combining diverse plant type and maturity with resistance to several diseases, insect pests, and parasitic weeds. Improved varieties have also been developed for grain (Singh, 1997).
0 0.5
1 1.5
2 2.5
3 3.5
4 4.5
5
1980
1982
1984
1986
1988
1990
1992
1994
1996
1998
2000
2002
2004
2006
2008
kg/p
erso
n/ye
ar
CEA LAC MENA DW SSA SSEA

Grain Legumes Production, Consumption and Trade Trends in Developing Countries-An Assessment and Synthesis
ICRISAT - Socioeconomics Discussion Paper Series 23
Table 5: Cowpeas area, yield and production
LAC MENA SSA SSEA DW World
Area harvested (million ha) 1994-96 0.05 0.00 8.10 0.07 0.01 8.24 2008-10 0.06 0.19 10.04 0.16 0.02 10.48 % change (1994-2010) 22% 5531% 24% 113% 61% 27% Growth rate (%/year for 1994-2010) 1.4% 36.7% 1.6% 5.7% 2.9% 1.7%
Production (million t) 1994-96 0.03 0.01 2.65 0.05 0.03 2.78 2008-10 0.06 0.06 4.93 0.19 0.09 5.32 % change (1994-2010) 64% 750% 86% 260% 145% 91% Growth rate (%/year for 1994-2010) 3.7% 14.6% 4.5% 9.8% 5.0% 4.7%
Yield (kg/ha) 1994-96 712 2,031 329 697 2,318 339 2008-10 953 312 491 1,193 3,474 508 % change (1994-2010) 34% -85% 49% 71% 50% 50% Growth rate (%/year for 1994-2010) 2.2% -16.2% 2.9% 3.9% 2.1% 2.9%
6.1 Area, production and yield trends Sub-Saharan Africa dominates in cowpea production with 96% area share (8.1
million tonnes) (Table 5). The largest producer of cowpea is Nigeria holding 3.11 million ha of land under cowpea and producing 2.51 million tonnes in 2008-10 (Table A.3). Niger falls behind in production though it holds a higher share of land area than Nigeria due to a low yield level of 267 kg/ha (Table A.3). Not only is the yield level low, it also shows a high co-efficient of variation of 41% in the last 3 decades (Table A.3). Burkina Faso, Cameroon, Kenya, Mali, Senegal and Tanzania are the other prominent producers in Africa. Except for Cameroon, all other countries show poor yields. Among the top producers, Myanmar is the sole producer of cowpea in Asia. It has about 1.4% of total land area under cowpea and shows a yield level of 1.19 tonnes/ha in 2008-10 (Table A.3).
Generally area under cowpea has gone up with many new countries contributing to total production from the last decade onwards. Middle East and North Africa have about 0.19 million ha of land under cowpea cultivation in 2008-10 (Table 5). This region has begun cultivating cowpea since 2002 (Figure 22). Sub-Saharan Africa has increased its land under cowpea at the rate of 1.56% and yield at the rate of 2.91% annually (Table 5). South and South East Asia shows a strong upward trend in area under cowpea from a low base (Figure 24). Yield has climbed up in the all regions except in the case of Middle East and North Africa (Figure 22). It has grown

Grain Legumes Production, Consumption and Trade Trends in Developing Countries-An Assessment and Synthesis
ICRISAT - Socioeconomics Discussion Paper Series 24
at the highest pace in South and South East Asia at 3.9% per annum between 1994-95 and 2008-10 (Table 5). Developed countries in the world have experienced a yield growth rate of 2.05% and area growth rate of 2.89% per annum (Table 5).
Figure 21 : Trends in cowpea area, production and yield in Latin America and Caribbean
Figure 22 : Trends in cowpea area, production and yield in Middle East and North Africa
400
800
1200
1600
2000
0.0 0.0 0.0 0.0 0.0 0.1 0.1 0.1 0.1 0.1 0.1
1980
19
82
1984
19
86
1988
19
90
1992
19
94
1996
19
98
2000
20
02
2004
20
06
2008
20
10
Yiel
d (k
g/ha
)
Area
(mill
ion
ha)
Prod
uctio
n (m
illio
n t)
Area Production Yield
200
2200
4200
6200
0.0
0.1
0.1
0.2
0.2
0.3
1980
19
82
1984
19
86
1988
19
90
1992
19
94
1996
19
98
2000
20
02
2004
20
06
2008
20
10
Yiel
d (k
g/ha
)
Area
(mill
ion
ha)
Prod
uctio
n (m
illio
n t)
Area Production Yield

Grain Legumes Production, Consumption and Trade Trends in Developing Countries-An Assessment and Synthesis
ICRISAT - Socioeconomics Discussion Paper Series 25
Figure 23 : Trends in cowpea area, production and yield in sub-Saharan Africa
Figure 24 : Trends in cowpea area, production and yield in South and South East Asia
150
550
950
1350
1750
0.0
2.0
4.0
6.0
8.0
10.0
12.0
14.0
1980
19
82
1984
19
86
1988
19
90
1992
19
94
1996
19
98
2000
20
02
2004
20
06
2008
20
10
Yiel
d (k
g/ha
)
Area
(mill
ion
ha)
Prod
uctio
n (m
illio
n t)
Area Production Yield
500
900
1300
1700
2100
2500
2900
0.0
0.1
0.1
0.2
0.2
0.3
1980
19
82
1984
19
86
1988
19
90
1992
19
94
1996
19
98
2000
20
02
2004
20
06
2008
20
10
Yiel
d (k
g/ha
)
Area
(mill
ion
ha)
Prod
uctio
n (m
illio
n t)
Area Production Yield

Grain Legumes Production, Consumption and Trade Trends in Developing Countries-An Assessment and Synthesis
ICRISAT - Socioeconomics Discussion Paper Series 26
Figure 25 : Trends in cowpea area, production and yield in developed regions
6.2 Producer prices Sub-Saharan Africa is the single largest producer of cowpea in the world and
consequently has the lowest prices globally with a production of 4.93 million tonne in 2008-10. From US$287 per t in 1991, producer prices in sub-Saharan Africa has increased to US$500 per t in 2009 at the rate of 2.7% per annum (Figure 26), but this figure has been arrived at with the exclusion of Nigeria’s prices which is unusually high reaching almost US$2000 per t in the early 1990s. Other regions growing cowpea include South and South East Asia where Myanmar is the largest producer but there is no reliable data for the country. Latin America and the Caribbean whose prices significantly dropped to US$240 per t in 2004 shows an upsurge later reaching US$455 per t in 2009 even with the exclusion of Jamaica which showed extremely high prices unlike other countries (Figure 26). Developed world which shows the highest prices in the world has a steeply increasing trend after 2000, may be due to increasing demand for animal feed.
1000
3000
5000
7000
9000
0.00
0.02
0.04
0.06
0.08
0.10
0.12
0.14
1980
19
82
1984
19
86
1988
19
90
1992
19
94
1996
19
98
2000
20
02
2004
20
06
2008
20
10
Yiel
d (k
g/ha
)
Area
(mill
ion
ha)
Prod
uctio
n (m
illio
n t)
Area Production Yield

Grain Legumes Production, Consumption and Trade Trends in Developing Countries-An Assessment and Synthesis
ICRISAT - Socioeconomics Discussion Paper Series 27
Figure 26 : Trends in cowpea producer prices across regions
6.3 Trade Cowpea trade has reduced to a great extent according to recent data available.
In 1980-82, it was exported by sub-Saharan Africa to a small extent of 25,000 tonnes which has also dropped to nil in 2007-09 (Figure 27). Between 1994-95 and 2008-10, production of cowpea had however increased invariably across the globe. Developed nations’ net export in 1980-82 has also turned into net imports in 2007-09.
Figure 27 : Trade in cowpea across regions
6.4 Consumption
0 100 200 300 400 500 600 700 800 900
1000
1991
19
92
1993
19
94
1995
19
96
1997
19
98
1999
20
00
2001
20
02
2003
20
04
2005
20
06
2007
20
08
2009
US$
per
t
LAC DW SSA
0
0
25
12
0 0 0
-3 -5
0
5
10
15
20
25
30
LAC MENA SSA DW
'000
tonn
es
1980-82
2007-09

Grain Legumes Production, Consumption and Trade Trends in Developing Countries-An Assessment and Synthesis
ICRISAT - Socioeconomics Discussion Paper Series 28
Figure 28: Trends in per capita availability of cowpeas across regions
Cowpea is an important legume in sub-Saharan Africa more than in any other
region, where the consumption has grown at the rate of 3.24% per annum between 1980 and 2009 (Table 1). Average level of consumption is 4.54 kg/person/year on an average in this region (Figure 28). South and South East Asia also shows a significant rise in consumption demand at 4.56% per annum (Table 1). Developed countries also exhibit a similar trend growing at the rate of 5.54%per annum. Latin America shows a marginally falling trend in consumption at 0.12% per annum (Table 1). Generally cowpea consumption has been found to be quite unstable compared to other crops.
7 Pigeonpea
7.1 Area, production and yield Pigeonpea production is mostly concentrated in South and South East Asia with
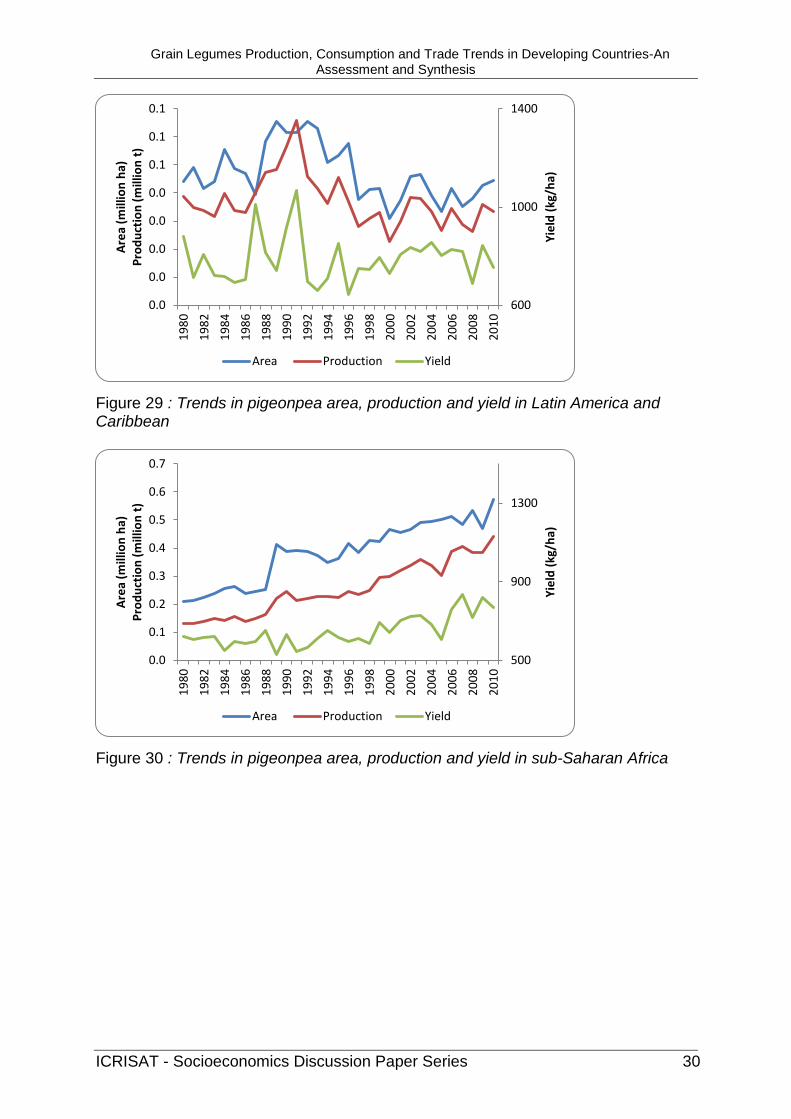
4.17 million ha of land in 2008-10 yielding an output of 3.36 million tonnes (Table 6). The yield however is highest in Latin America and Caribbean with 759 kg/ha in 2008-10 but area has contracted at 22% in size over the years from 0.05 million ha in 1994-96. Yield growth is observed to be the highest in sub-Saharan Africa with 1.67% per annum between 1994-96 and 2008-10. India is followed by Myanmar in South Asia which has an area share of 12.65% producing 740,000 tonnes (Table A.6). Malawi and Kenya are the other important producers of pigeonpea in the world together producing 0.25 million tonnes (Table A.6). Among the top six producers of pigeonpea in the world, Uganda and Myanmar have the high yields of 1 tonne/ha and 1.2 tonne/ha respectively but these yield rates are highly fluctuating (Table A.6). In India, yield was 731 tonnes/ha in 2008-10 which has been quite stable over the years (Table A.6).
0
1
2
3
4
5
6
7
8
1980
1982
1984
1986
1988
1990
1992
1994
1996
1998
2000
2002
2004
2006
2008
kg/p
erso
n/ye
ar
LAC MENA DW SSA SSEA

Grain Legumes Production, Consumption and Trade Trends in Developing Countries-An Assessment and Synthesis
ICRISAT - Socioeconomics Discussion Paper Series 29
Table 6: Pigeonpea area, yield and production
LAC SSA SSEA World
Area harvested (million ha) 1994-96 0.05 0.38 3.69 4.12 2008-10 0.04 0.53 4.17 4.74 % change (1994-2010) -23% 40% 13% 15% Growth rate (%/year for 1994-2010) -1.3% 2.4% 1.0% 1.1%
Production (million t) 1994-96 0.04 0.23 2.54 2.82 2008-10 0.03 0.40 3.36 3.79 % change (1994-2010) -20% 73% 32% 35% Growth rate (%/year for 1994-2010) -0.8% 4.2% 1.9% 2.1%
Yield (kg/ha) 1994-96 735 621 689 684 2008-10 760 769 804 800 % change (1994-2010) 3% 24% 17% 17% Growth rate (%/year for 1994-2010) 0.5% 1.7% 0.9% 1.0%
Area under pigeonpea in sub-Saharan Africa has grown at the rate of 2.44% per annum and in Asia at 0.95% per annum between 1994 and 2010 (Table 6). In contrast, Latin America and Caribbean has registered a decrease in area of 22.69% between 1994-96 and 2008-10 (Table 6). The highest yield increase has been experienced in sub-Saharan Africa where the yield has increased at the rate of 1.67% per annum (Table 6). This has led to a 73% increase in pigeonpea production in this region between 1994-96 and 2008-10 (Table 6).
Myanmar shows a strong positive trend in area and yield between 1980 and 2010. India shows an upward trend in yield but this trend is highly fluctuating. Tanzania which has an area share of 1.53% shows the lowest yield variability of 7% (co-efficient of variation) between 1980 and 2010 and the yield level is also as high as in India (Table A.6).
Grain Legumes Production, Consumption and Trade Trends in Developing Countries-An Assessment and Synthesis
ICRISAT - Socioeconomics Discussion Paper Series 30
Figure 29 : Trends in pigeonpea area, production and yield in Latin America and Caribbean
Figure 30 : Trends in pigeonpea area, production and yield in sub-Saharan Africa
600
1000
1400
0.0
0.0
0.0
0.0
0.0
0.1
0.1
0.1
1980
19
82
1984
19
86
1988
19
90
1992
19
94
1996
19
98
2000
20
02
2004
20
06
2008
20
10
Yiel
d (k
g/ha
)
Area
(mill
ion
ha)
Prod
uctio
n (m
illio
n t)
Area Production Yield
500
900
1300
0.0
0.1
0.2
0.3
0.4
0.5
0.6
0.7
1980
19
82
1984
19
86
1988
19
90
1992
19
94
1996
19
98
2000
20
02
2004
20
06
2008
20
10
Yiel
d (k
g/ha
)
Area
(mill
ion
ha)
Prod
uctio
n (m
illio
n t)
Area Production Yield

Grain Legumes Production, Consumption and Trade Trends in Developing Countries-An Assessment and Synthesis
ICRISAT - Socioeconomics Discussion Paper Series 31
Figure 31 : Trends in pigeonpea area, production and yield in South and South East Asia
7.2 Producer prices South and South East Asia particularly India which is the highest producer and
consumer of pigeonpea shows a highly increasing trend for producer prices rising at the rate of 4.8% per annum. Philippines which is a small producer of pigeonpea showed high prices and so has been excluded so as to show a reasonable regional price trend. In 2009, producer price in South and South East Asia was US$675 per t (Figure 32). In sub-Saharan Africa, after the sharp rise in producer price in 1996 (from US$ 196 per t in 1995 to US$540 per t in 1996) shows quite a stagnant price trend thereafter. Even with the exclusion of Jamaica and Puerto Rico, Latin America shows prices peaking in 2009 at US$1554 per t which might be attributed to the reduced production in the region in the last two decades.
300
700
1100
1500
1900
0.0 0.5 1.0 1.5 2.0 2.5 3.0 3.5 4.0 4.5 5.0
1980
19
82
1984
19
86
1988
19
90
1992
19
94
1996
19
98
2000
20
02
2004
20
06
2008
20
10
Yiel
d (k
g/ha
)
Area
(mill
ion
ha)
Prod
uctio
n (m
illio
n t)
Area Production Yield

Grain Legumes Production, Consumption and Trade Trends in Developing Countries-An Assessment and Synthesis
ICRISAT - Socioeconomics Discussion Paper Series 32
Figure 32 : Trends in pigeonpea producer prices across regions
7.3 Trade Production of pigeonpea is the lowest in the world among all the pulses at
around 3.68 million tonnes in 2010 and mostly concentrated in Asia and Africa (Table 6). Trade is minimal and very erratic. In 2007-09, we find that import of pigeonpea in Latin America and Caribbean which had been around 3645 tonnes of pigeonpea in 1980-82, has dropped to just one tonne in 2007-09 (Figure 33).
Figure 33 : Trade in pigeonpea across regions
7.4 Consumption Pigeonpea is consumed only in the developing regions of Asia, Africa and Latin-
American. The largest consumer is South and South East Asia where a slight decline is observed at 0.60% per annum between 1980 and 2009 (Table 1). A significant jump is found in sub-Saharan Africa where the average consumption has been
0
200
400
600
800
1000
1200
1400
1600
1800
1991
19
92
1993
19
94
1995
19
96
1997
19
98
1999
20
00
2001
20
02
2003
20
04
2005
20
06
2007
20
08
2009
US$
per
t
LAC SSA SSEA
-3
7
-7
0
-2
1
-8
-6
-4
-2
0
2
4
6
8
LAC SSA SSEA
'000
tonn
es
1980-82
2007-09

Grain Legumes Production, Consumption and Trade Trends in Developing Countries-An Assessment and Synthesis
ICRISAT - Socioeconomics Discussion Paper Series 33
around 0.41 kg/person/year and an annual growth rate of 1.92% was registered in the last three decades (Table 1). Consumption is quite unstable and on a declining trend in Latin America and Caribbean where the consumption averaged at around 0.08 kg/person/year (Table 1 and Figure 34).
Figure 34: Trends in per capita availability of pigeonpeas across regions
8 Lentil
8.1 Area, production and yield Globally lentils are grown on 3.7 million ha of land in 2008-10 with a production
of 3.8 million tonnes (Table 7). Though South and South East Asia holds the highest area share, the developed regions contribute the most towards total production at about 51% with an area share of 36%. Yield of lentil in South and South East Asia is about 668 kg/ha in 2008-10 whereas in the developed regions, it’s about 50% higher (Table 7). In Latin America and Caribbean, production has dropped by almost 60% in the fifteen year period (Table 7). Almost 52% of the production of lentil in Middle East and North Africa in 1994-96 has been cut down relatively in 2008-10 since the area was reduced to half the level in 1994-96 (Table 7).
0 0.2 0.4 0.6 0.8
1 1.2 1.4 1.6 1.8
2 19
80
1982
1984
1986
1988
1990
1992
1994
1996
1998
2000
2002
2004
2006
2008
kg/p
erso
n/ye
ar
LAC SSA SSEA

Grain Legumes Production, Consumption and Trade Trends in Developing Countries-An Assessment and Synthesis
ICRISAT - Socioeconomics Discussion Paper Series 34
Table 7: Lentils area, yield and production
CEA LAC MENA SSA SSEA DW World
Area harvested (million ha) 1994-96 0.10 0.05 0.84 0.08 1.88 0.47 3.40 2008-10 0.07 0.02 0.40 0.11 1.79 1.35 3.73 % change (1994-2010) -31% -52% -53% 45% -5% 189% 10% Growth rate (%/year for 1994-2010) -3.0% -4.5% -4.3% 3.2% -0.1% 7.2% 0.8%
Production (million t) 1994-96 0.11 0.04 0.84 0.04 1.20 0.57 2.80 2008-10 0.13 0.02 0.40 0.12 1.20 1.91 3.78 % change (1994-2010) 23% -60% -52% 169% 0% 236% 35% Growth rate (%/year for 1994-2010) 1.7% -5.8% -3.1% 7.0% 0.1% 8.0% 2.3%
Yield (kg/ha) 1994-96 1,139 888 996 593 638 1,221 822 2008-10 2,006 756 1,006 1,094 668 1,410 1,003 % change (1994-2010) 76% -15% 1% 85% 5% 15% 22% Growth rate (%/year for 1994-2010) 4.8% -1.4% 1.2% 3.7% 0.2% 0.7% 1.5%
Among the developing countries, India is the largest producer of lentil in the
world with an area share of 35.61% and yield of 666 kg/ha in 2008-10 (Table A.5). Among developed countries Canada is the largest producer with an area share of 26% and yield of 1505 kg/ha (Table A.5). Due to the high yield level in Canada, it exceeds India in production, producing 1.5 million tonnes compared to the 0.89 million tonnes produced in India (Table A.5). However, it should be noted that the yield variability is lower in India by 50% compared to Canada (Table A.5). Other prominent producers of lentils are Turkey (0.29 million tonnes), USA (0.26 million tonnes) and Nepal (0.15 million tonnes). Turkey shows a downward trend in area under lentil cultivation between 1980 and 2010 falling from 0.97 million tonnes in 1988 to 0.18 million tonnes in 2008 (Table A.5). India is also found to be moving downwards in area since 2006. Area under lentil in Nepal shows a stable positive trend from a low base. Among the developed countries Canada and USA show significant upward movements in area since 2008.
Regionally, South and South East Asia dominates in lentil cultivation, holding 48% of the total lentil area (Table 7). This followed by the developed countries of

Grain Legumes Production, Consumption and Trade Trends in Developing Countries-An Assessment and Synthesis
ICRISAT - Socioeconomics Discussion Paper Series 35
Canada and USA with a 14% share in total area harvested with lentil (Table A.5). Area under cultivation has however fallen in developing regions except for sub-Saharan Africa (Figure 35 to 38). Yield has also grown in sub-Saharan Africa at the rate of 3.71% per annum (Table 7). Production increase has been the highest in developed countries at the rate of 7.96% per annum with Canada at the forefront (Table 7). In Asia, production has either fallen or has remained stagnant except for Central and East Asia which shows some promising trends in production though from a low base (Figures 35 and 39).
Low yield levels in India have been the main reason for the stagnant production trends. In contrast, yield has increased substantially from 592 kg/ha to 1093 kg/ha between 1994-96 and 2008-10 in sub-Saharan Africa (Table 7). Middle East and North Africa has shown a modest increase in yield relatively growing at an annual rate of 1.25% (Table 7). But the inverse area trend in this region has brought down the production by 51% in the last fifteen years (Table 7).
Figure 35 : Trends in lentil area, production and yield in Central and East Asia
800
1800
2800
3800
4800
0.0
0.0
0.0
0.1
0.1
0.1
0.1
0.1
0.2
1980
19
82
1984
19
86
1988
19
90
1992
19
94
1996
19
98
2000
20
02
2004
20
06
2008
20
10
Yiel
d (k
g/ha
)
Area
(mill
ion
ha)
Prod
uctio
n (m
illio
n t)
Area Production Yield

Grain Legumes Production, Consumption and Trade Trends in Developing Countries-An Assessment and Synthesis
ICRISAT - Socioeconomics Discussion Paper Series 36
Figure 36 : Trends in lentil area, production and yield in Latin America and Caribbean
Figure 37 : Trends in lentil area, production and yield in Middle East and North Africa
400
800
1200
1600
2000
2400
2800
3200
3600
4000
0.0
0.0
0.0
0.1
0.1
0.1
0.1
1980
19
82
1984
19
86
1988
19
90
1992
19
94
1996
19
98
2000
20
02
2004
20
06
2008
20
10
Yiel
d (k
g/ha
)
Area
(mill
ion
ha)
Prod
uctio
n (m
illio
n t)
Area Production Yield
500
900
1300
1700
2100
2500
0.0
0.2
0.4
0.6
0.8
1.0
1.2
1.4
1980
19
82
1984
19
86
1988
19
90
1992
19
94
1996
19
98
2000
20
02
2004
20
06
2008
20
10
Yiel
d (k
g/ha
)
Area
(mill
ion
ha)
Prod
uctio
n (m
illio
n t)
Area Production Yield

Grain Legumes Production, Consumption and Trade Trends in Developing Countries-An Assessment and Synthesis
ICRISAT - Socioeconomics Discussion Paper Series 37
Figure 38: Trends in lentil area, production and yield in sub-Saharan Africa
Figure 39 : Trends in lentil area, production and yield in South and South East Asia
400
800
1200
1600
2000
2400
2800
0.0
0.0
0.0
0.1
0.1
0.1
0.1
0.1
1980
19
82
1984
19
86
1988
19
90
1992
19
94
1996
19
98
2000
20
02
2004
20
06
2008
20
10
Yiel
d (k
g/ha
)
Area
(mill
ion
ha)
Prod
uctio
n (m
illio
n t)
Area Production Yield
500
700
900
1100
1300
1500
1700
1900
0.0
0.5
1.0
1.5
2.0
2.5
1980
19
82
1984
19
86
1988
19
90
1992
19
94
1996
19
98
2000
20
02
2004
20
06
2008
20
10
Yiel
d (k
g/ha
)
Area
(mill
ion
ha)
Prod
uctio
n (m
illio
n t)
Area Production Yield

Grain Legumes Production, Consumption and Trade Trends in Developing Countries-An Assessment and Synthesis
ICRISAT - Socioeconomics Discussion Paper Series 38
Figure 40 : Trends in lentil area, production and yield in the developed world
8.2 Producer prices Lentil producer prices show a clear upward moving trend across all regions
(Figure 41). Major lentil producers are South and South East Asia and Middle East and North Africa where the former shows lower prices than the latter throughout the entire period. In 2009, producer price was US$616 per t in South And South East Asia and US$1015 per t in Middle East and North Africa. In Turkey producer prices have increased at the rate of 5.3% per annum between 1991 and 2009 to reach US$1285 per t. Similar increases have been found in the case of Morocco, Egypt and Armenia which have relatively lower production than Turkey. Cyprus and Iran have been excluded from their regional price trend calculations for significant deviation from the normal price levels in their respective regions
Figure 41 : Trends in lentil producer prices across regions
0
400
800
1200
1600
2000
0.0
0.5
1.0
1.5
2.0
2.5
3.0
1980
19
82
1984
19
86
1988
19
90
1992
19
94
1996
19
98
2000
20
02
2004
20
06
2008
20
10
Yiel
d (k
g/ha
)
Area
(mill
ion
ha)
Prod
uctio
n (m
illio
n t)
Area Production Yield
0
200
400
600
800
1000
1200
1991
19
92
1993
19
94
1995
19
96
1997
19
98
1999
20
00
2001
20
02
2003
20
04
2005
20
06
2007
20
08
2009
US$
per
t
LAC MENA DW SSA SSEA

Grain Legumes Production, Consumption and Trade Trends in Developing Countries-An Assessment and Synthesis
ICRISAT - Socioeconomics Discussion Paper Series 39
8.3Trade Both lentil export and import show increasing trends between 1980 and 2009.
We find that between 1995 and 2009 in developed countries, both lentil production and export has increased substantially. Production has increased by 236% and export has increased by 246% (Table A.13 and Table 7). Imports by some developed countries which are about one-fifth of their export are observed to have marginally increased (Table A.13). In the case of South and South East Asia, import has grown more than export (Figure 42); whereas import has grown by 240% reaching 0.5 million tonnes in 2007-09, export has increased by 26% to reach 0.03 million tonnes in 2007-09 (Table A.13).
Figure 42 : Trade in lentil across regions
8.4 Consumption Lentil consumption in the Middle East and North Africa has the highest level of
consumption at 2.28 kg/person/year (Table 1). In all other regions, lentil consumption is quite low ranging between 0.05 and 0.7 kg/person/year (Table 1). However, significant positive movements are observed in Central and East Asia at 4.42% per annum, lac at 2.85% per annum, sub-Saharan Africa at 2.46% per annum, and developed countries at 1.43% per annum (Table 1). South and South East Asia shows a stagnant trend in consumption with relatively low variability (Figure 43).
0
-19
83 2
-25 -28
13
-206 -272
-21
-492
1043
-600
-400
-200
0
200
400
600
800
1000
1200
CEA LAC MENA SSA SSEA DW
'000
tonn
es
1980-82
2007-09

Grain Legumes Production, Consumption and Trade Trends in Developing Countries-An Assessment and Synthesis
ICRISAT - Socioeconomics Discussion Paper Series 40
Figure 43: Trends in per capita availability of lentils across regions
9 Fababean
9.1 Area, production and yield Fababean is grown on 2.5 million ha of land globally with Central and East Asia
contributing 36% and sub-Saharan Africa about 21% (Table 8). China is the largest producer of fababean in the world where production has fallen significantly. In Central and East Asia, area has declined by 12.38% between 1994-95 and 2008-10 from 1 million tonnes in 1994-96, whereas the yield has increased from 1804 kg/ha to 1910 kg/ha (Table 8 and Figure 44). In sub-Saharan Africa, area has grown at the rate of 3.07% per annum leading to a production increase of 90% (from 0.34 million ha to 0.64 million ha) between 1994-95 and 2008-10; yield has also grown at an annual rate of 2.13% during the same period (Table 8). Morocco, Egypt and Sudan are the other main producers of fababean (Table A.4). The developed regions have also expanded their area share and improved their yield levels by nearly one-third in the last fifteen years (Table 8).
Table 8: Trends in fababean area, production and yield
CEA LAC MENA SSA SSEA DW World
Area harvested (million ha) 1994-96 1.03 0.17 0.46 0.34 0.01 0.31 2.31 2008-10 0.90 0.18 0.47 0.53 0.01 0.42 2.50 % change (1994-2010) -12% 6% 2% 53% -31% 35% 8% Growth rate (%/year for 1994- -1.0% 1.0% -0.1% 3.1% -1.8% 2.7% 0.6%
0
0.5
1
1.5
2
2.5
3
3.5
4
1980
1982
1984
1986
1988
1990
1992
1994
1996
1998
2000
2002
2004
2006
2008
kg/p
erso
n/ye
ar
CEA LAC MENA DW SSA SSEA

Grain Legumes Production, Consumption and Trade Trends in Developing Countries-An Assessment and Synthesis
ICRISAT - Socioeconomics Discussion Paper Series 41
2010)
Production (million t) 1994-96 1.85 0.12 0.74 0.34 0.01 0.56 3.61 2008-10 1.73 0.19 0.73 0.64 0.01 0.96 4.25 % change (1994-2010) -7% 58% -1% 90% -12% 71% 18% Growth rate (%/year for 1994-2010) -0.3% 3.4% -0.1% 5.3% -0.1% 4.2% 1.4%
Yield (kg/ha) 1994-96 1,805 700 1,614 976 540 1,826 1,565 2008-10 1,910 1,047 1,572 1,215 688 2,320 1,701 % change (1994-2010) 6% 50% -3% 24% 27% 27% 9% Growth rate (%/year for 1994-2010) 0.8% 2.4% 0.0% 2.1% 1.7% 1.4% 0.8%
Compared to all the other legumes, the yield levels of fababean are extremely
high (Table 17). Among the top producers, China and Sudan have the highest yield levels of 1.9 tonnes/ha (Table A.4). In other regions, yield levels are mostly just above 1 tonne/ha among the top producers, except for Morocco which has a yield level of 735 kg/ha with high yield variability (Table A.4).
Developed countries of Australia and France also find their place as some of the top fababean producing countries (Table A.4). France proves to be the most efficient in fababean production with the highest yield level of 4 tonnes/ha (Table A.4), where the crop is used as livestock feed. Regionally, Central and East Asia has the highest area under fababean accounting for 36% of the total area under the crop, dominated by China in that region (Table 8). North and sub-Saharan Africa and the Middle East have prominent shares in area together holding about 35% of the total fababean area (Table 8). Yield is found to have risen up modestly in Central and East Asia compared to its levels in 1995 (Figure 43). However, production shows a declining trend falling at an annual rate of 0.28% due to area contractions in the last two decades (Table 8). In sub-Saharan Africa, area shows a clear upward trend with a growth rate of 3.07% per annum between 1994-96 and 2008-10 whereas yield shows high fluctuations which may be attributed to variable climatic conditions (Table 8 and Figure 46). All the same, production has moved in line with area growing at the rate of 5.26% annually (Table 8 and Figure 47).
Middle East and some regions of Africa which contributes around 17% of the total production shows a slight dip in production due to downward moving area trends (Table 8 and Figure 46). In the developed regions, after the huge drop in area in 2006, production has gone up especially due to yield improvements (Figure 48).

Grain Legumes Production, Consumption and Trade Trends in Developing Countries-An Assessment and Synthesis
ICRISAT - Socioeconomics Discussion Paper Series 42
Figure 44 : Trends in fababean area, production and yield in Central and East Asia
Figure 45 : Trends in fababean area, production and yield in Latin America and Caribbean
1000
1400
1800
2200
2600
3000
3400
3800
0.0
0.5
1.0
1.5
2.0
2.5
3.0
1980
19
82
1984
19
86
1988
19
90
1992
19
94
1996
19
98
2000
20
02
2004
20
06
2008
20
10
Yiel
d (k
g/ha
)
Area
(mill
ion
ha)
Prod
uctio
n (m
illio
n t)
Area Production Yield
400
800
1200
1600
2000
0.0
0.1
0.1
0.2
0.2
0.3
0.3
1980
19
82
1984
19
86
1988
19
90
1992
19
94
1996
19
98
2000
20
02
2004
20
06
2008
20
10
Yiel
d (k
g/ha
)
Area
(mill
ion
ha)
Prod
uctio
n (m
illio
n t)
Area Production Yield

Grain Legumes Production, Consumption and Trade Trends in Developing Countries-An Assessment and Synthesis
ICRISAT - Socioeconomics Discussion Paper Series 43
Figure 46 : Trends in fababean area, production and yield in Middle East and North Africa
Figure 47:Trends in fababean area, production and yield in sub-Saharan Africa
1000
1400
1800
2200
2600
3000
3400
0.0 0.1 0.2 0.3 0.4 0.5 0.6 0.7 0.8 0.9 1.0
1980
19
82
1984
19
86
1988
19
90
1992
19
94
1996
19
98
2000
20
02
2004
20
06
2008
20
10
Yiel
d (k
g/ha
)
Area
(mill
ion
ha)
Prod
uctio
n (m
illio
n t)
Area Production Yield
700
1100
1500
1900
2300
2700
0.0
0.1
0.2
0.3
0.4
0.5
0.6
0.7
0.8
1980
19
82
1984
19
86
1988
19
90
1992
19
94
1996
19
98
2000
20
02
2004
20
06
2008
20
10
Yiel
d (k
g/ha
)
Area
(mill
ion
ha)
Prod
uctio
n (m
illio
n t)
Area Production Yield

Grain Legumes Production, Consumption and Trade Trends in Developing Countries-An Assessment and Synthesis
ICRISAT - Socioeconomics Discussion Paper Series 44
Figure 48 : Trends in fababean area, production and yield in South and South East Asia
Figure 49 : Trends in fababean area, production and yield in the developed world
9.2 Producer prices Dwindling fababean production levels in Central and East Asia has led to
increasing producer prices in the world over the years. Latin America produces low quantities of fababean at about 0.2 million tonnes compared to Central and East Asia which produces about 1.7 million tonnes (2010 Figures) (Table 8). Therefore Latin America experiences high producer prices varying between US$500 per t and US$900 per t during the last two decades whereas in the developed countries, producer price of fababean was US$ 381 per t in 2009 where the production is around 1 million tonne (Figure 49). In the Middle East and North Africa where production has fallen at the rate of 0.07% per annum, producer prices have risen at the rate of 3.33% per annum between 1995 and 2009 (Table 8 and Figure 50).
500
900
1300
1700
0.000
0.002
0.004
0.006
0.008
0.010
0.012
1996 1998 2000 2002 2004 2006 2008 2010
Yiel
d (k
g/ha
)
Area
(mill
ion
ha)
Prod
uctio
n (m
illio
n t)
Area Production Yield
1200 1600 2000 2400 2800 3200 3600 4000 4400 4800
0.0
0.2
0.4
0.6
0.8
1.0
1.2
1980
19
82
1984
19
86
1988
19
90
1992
19
94
1996
19
98
2000
20
02
2004
20
06
2008
20
10
Yiel
d (k
g/ha
)
Area
(mill
ion
ha)
Prod
uctio
n (m
illio
n t)
Area Production Yield

Grain Legumes Production, Consumption and Trade Trends in Developing Countries-An Assessment and Synthesis
ICRISAT - Socioeconomics Discussion Paper Series 45
Figure 50 : Trends in fababean producer prices across regions
9.3 Trade Looking at the global export quantity of total pulses including both focussed and
non-focussed, we find that world pulse export has increased by 51% to reach 12 million tonnes in 2009 compared to the export quantity of 8 million tonnes in 1995. Fababean, bean, lentils, groundnut and soybean are found to be exported in larger quantities in 2007-09 compared to 1994-96. Also in the case of fababean, Central and East Asia which was leading in its export with 0.25 million tonnes in 1994-96 has been is replaced by the developed countries in 2007-09 with 0.51 million tonnes (Table A.14 and Figure 51). Import of fababean by Middle East and Northern Africa has increased from 0.15 million tonnes in 1994-96 by 140% to 0.37 million tonnes in 2007-09 (Table A.14).
0 100 200 300 400 500 600 700 800 900
1000
1991
19
92
1993
19
94
1995
19
96
1997
19
98
1999
20
00
2001
20
02
2003
20
04
2005
20
06
2007
20
08
2009
US$
per
t
CEA LAC MENA DW SSA
15
0
20 19 0
-27
33
-4
-347
-5 -18
392
-400
-300
-200
-100
0
100
200
300
400
500
CEA LAC MENA SSA SSEA DW
'000
tonn
es
1980-82
2007-09
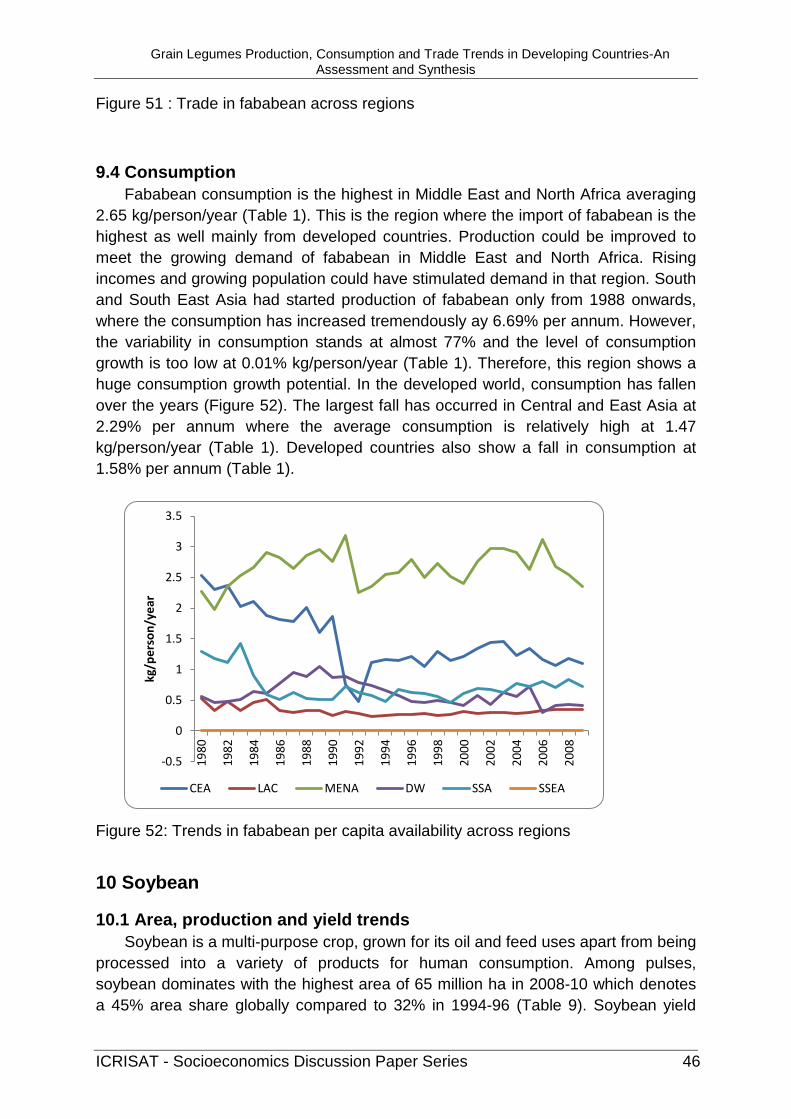
Grain Legumes Production, Consumption and Trade Trends in Developing Countries-An Assessment and Synthesis
ICRISAT - Socioeconomics Discussion Paper Series 46
Figure 51 : Trade in fababean across regions
9.4 Consumption Fababean consumption is the highest in Middle East and North Africa averaging
2.65 kg/person/year (Table 1). This is the region where the import of fababean is the highest as well mainly from developed countries. Production could be improved to meet the growing demand of fababean in Middle East and North Africa. Rising incomes and growing population could have stimulated demand in that region. South and South East Asia had started production of fababean only from 1988 onwards, where the consumption has increased tremendously ay 6.69% per annum. However, the variability in consumption stands at almost 77% and the level of consumption growth is too low at 0.01% kg/person/year (Table 1). Therefore, this region shows a huge consumption growth potential. In the developed world, consumption has fallen over the years (Figure 52). The largest fall has occurred in Central and East Asia at 2.29% per annum where the average consumption is relatively high at 1.47 kg/person/year (Table 1). Developed countries also show a fall in consumption at 1.58% per annum (Table 1).
Figure 52: Trends in fababean per capita availability across regions
10 Soybean
10.1 Area, production and yield trends Soybean is a multi-purpose crop, grown for its oil and feed uses apart from being
processed into a variety of products for human consumption. Among pulses, soybean dominates with the highest area of 65 million ha in 2008-10 which denotes a 45% area share globally compared to 32% in 1994-96 (Table 9). Soybean yield
-0.5
0
0.5
1
1.5
2
2.5
3
3.5
1980
1982
1984
1986
1988
1990
1992
1994
1996
1998
2000
2002
2004
2006
2008
kg/p
erso
n/ye
ar
CEA LAC MENA DW SSA SSEA

Grain Legumes Production, Consumption and Trade Trends in Developing Countries-An Assessment and Synthesis
ICRISAT - Socioeconomics Discussion Paper Series 47
has also increased from 1,799 to 2,202 kg/ha from 1994-96 to 2008-10 (Table 9). Nevertheless, area expansion has been the main driver of production growth. Most of soybean research is concentrated in sub-Saharan Africa. Since the 1970s soybean breeders at the CGIAR's (Consultative Group on International Agricultural Research) International Institute of Tropical Agriculture (IITA) in Ibadan, Nigeria, have been successfully working on developing improved varieties of soybean that fix more nitrogen from the atmosphere without rhizobium inoculation and which are high yielding, store well, and are resistant to pod shattering (Lawrence, no date). USA dominates in soybean production having about 30 million ha of land under cultivation contributing about 87 million tonnes towards total production (2008-10) (Table A.7). Yield level is also the highest in USA at 2.8 tonnes/ha (Table A.7). About 40% of the area under soybean lies in Latin America in Argentina and Brazil (Table A.7). These two countries produce more than 100 million tonnes (Table A.7). Next come India and China with relatively low yield levels. Though China has less land area under soybean than India, its yield levels are 60% higher compared to that in India, producing 15 million tonnes (2008-10) (Table A.7).
Table 9: Soybean area, yield and production
CEA LAC MENA SSA SSEA DW World
Area harvested (million ha) 1994-96 8.71 18.10 0.06 0.85 6.87 27.45 62.04 2008-10 9.37 42.62 0.03 1.20 10.87 35.32 99.40 % change (1994-2010) 8% 135% -53% 40% 58% 29% 60% Growth rate (%/year for 1994-2010) 0.6% 6.8% -5.5% 2.9% 3.1% 1.4% 3.5%
Production (million t) 1994-96 14.81 39.38 0.14 0.59 7.19 69.09 131.20 2008-10 15.78 112.67 0.09 1.45 11.90 96.71 238.60 % change (1994-2010) 7% 186% -36% 148% 65% 40% 82% Growth rate (%/year for 1994-2010) 0.3% 8.2% -2.8% 6.4% 3.6% 2.1% 4.4%
Yield (kg/ha) 1994-96 1,702 2,176 2,328 691 1,046 2,518 2,115 2008-10 1,685 2,638 3,210 1,219 1,095 2,736 2,399 % change (1994-2010) -1% 21% 38% 76% 5% 9% 13% Growth rate (%/year for 1994- -0.3% 1.3% 2.9% 3.4% 0.5% 0.6% 0.9%

Grain Legumes Production, Consumption and Trade Trends in Developing Countries-An Assessment and Synthesis
ICRISAT - Socioeconomics Discussion Paper Series 48
2010)
World soybean production has increased at the rate of 0.89% per annum between 1994-95 and 2008-10 (Table 9). Regionally, production is more concentrated in the Americas and Asia. Production has grown at the highest pace in Latin America at the rate of 8.24% per annum between 1994-95 and 2008-10 (Table 9 and Figure 53). Sub-Saharan Africa has about 1.2 million ha of land under soybean cultivation in 2008-10 but substantial yield improvements have been observed from 690 kg/ha to 1220 kg/ha between 1994-95 and 2008-10 (Table 9). Both Asia and Africa are lagging far behind in soybean yield compared to the developed countries.
Except for Middle East and parts of Africa, all soybean growing regions in the world show upward trend in area, production and yield (Figure 53 to 58). Area expansion is found to be particularly rapid in Asia and Africa, though the area share of Africa is quite less (Figure 56 and 57). Latin America is observed to have the most dramatic yet stable ascent in production between 2000 and 2010 from 56 million tonnes to 130 million tonnes (Table 9 and Figure 54).
Figure 53 : Trend in soybean area, production and yield in Central and East Asia
1000
1400
1800
2200
2600
3000
3400
3800
0.0 2.0 4.0 6.0 8.0
10.0 12.0 14.0 16.0 18.0 20.0
1980
19
82
1984
19
86
1988
19
90
1992
19
94
1996
19
98
2000
20
02
2004
20
06
2008
20
10
Yiel
d (k
g/ha
)
Area
(mill
ion
ha)
Prod
uctio
n (m
illio
n t)
Area Production Yield
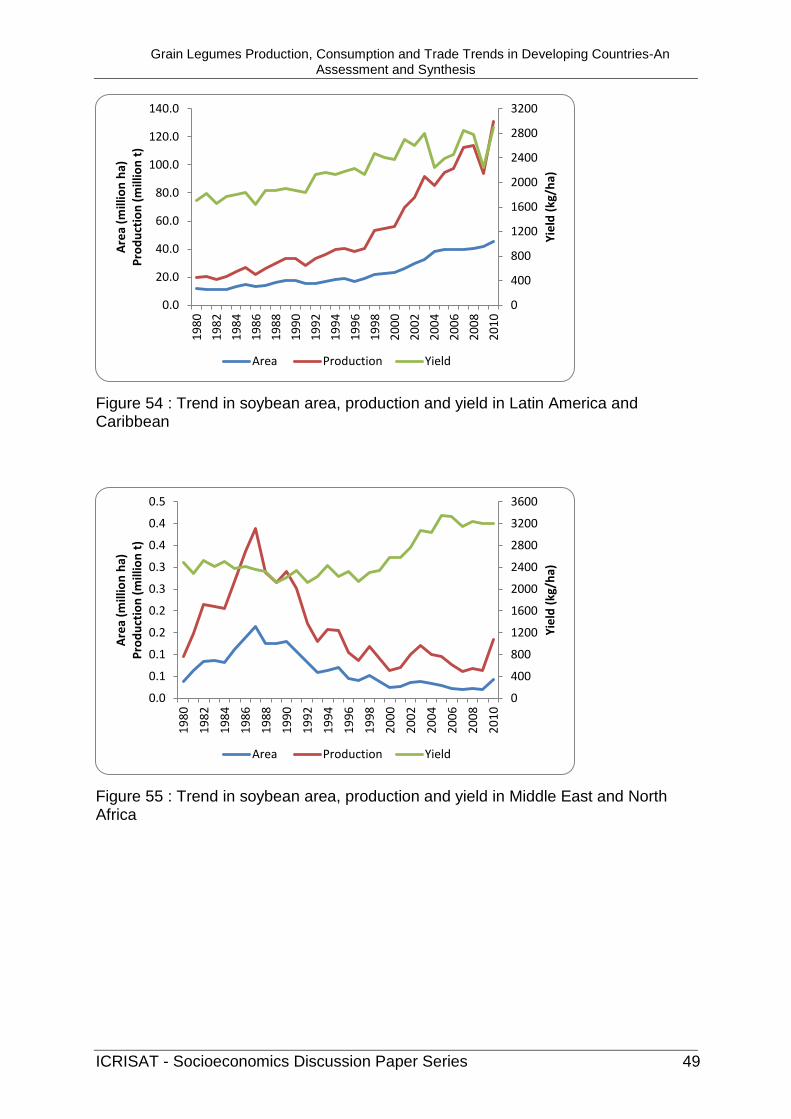
Grain Legumes Production, Consumption and Trade Trends in Developing Countries-An Assessment and Synthesis
ICRISAT - Socioeconomics Discussion Paper Series 49
Figure 54 : Trend in soybean area, production and yield in Latin America and Caribbean
Figure 55 : Trend in soybean area, production and yield in Middle East and North Africa
0
400
800
1200
1600
2000
2400
2800
3200
0.0
20.0
40.0
60.0
80.0
100.0
120.0
140.0
1980
19
82
1984
19
86
1988
19
90
1992
19
94
1996
19
98
2000
20
02
2004
20
06
2008
20
10
Yiel
d (k
g/ha
)
Area
(mill
ion
ha)
Prod
uctio
n (m
illio
n t)
Area Production Yield
0
400
800
1200
1600
2000
2400
2800
3200
3600
0.0
0.1
0.1
0.2
0.2
0.3
0.3
0.4
0.4
0.5
1980
19
82
1984
19
86
1988
19
90
1992
19
94
1996
19
98
2000
20
02
2004
20
06
2008
20
10
Yiel
d (k
g/ha
)
Area
(mill
ion
ha)
Prod
uctio
n (m
illio
n t)
Area Production Yield
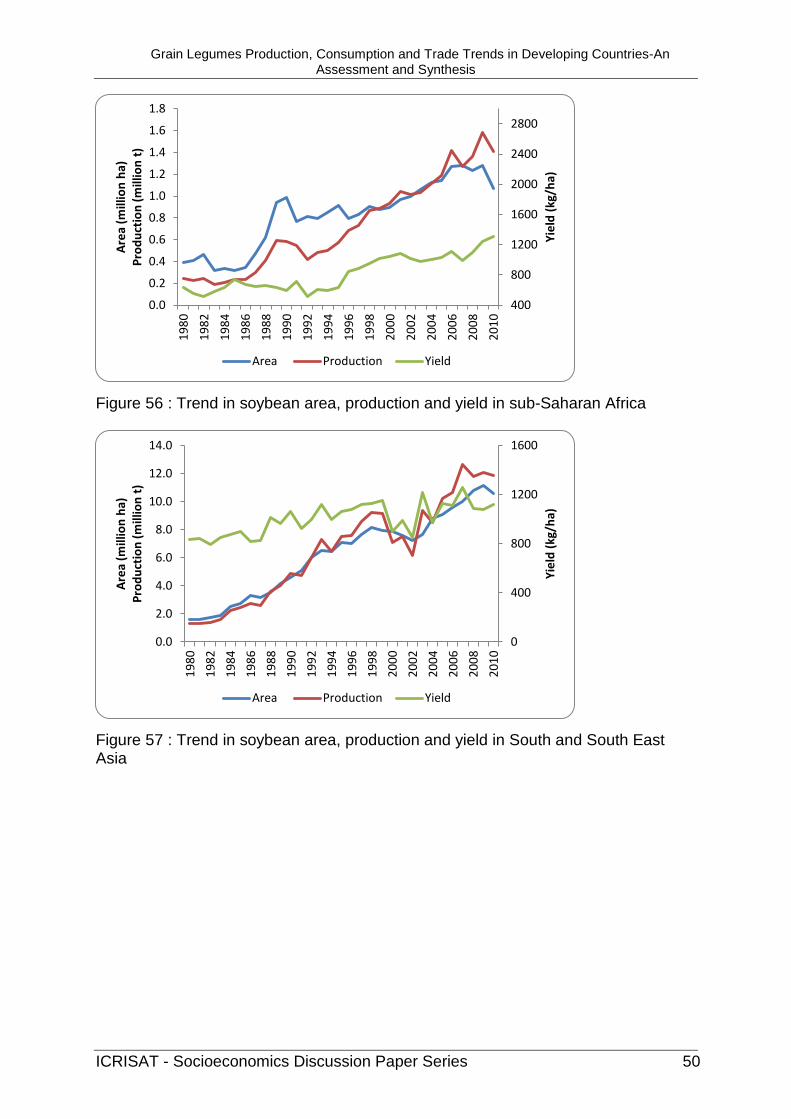
Grain Legumes Production, Consumption and Trade Trends in Developing Countries-An Assessment and Synthesis
ICRISAT - Socioeconomics Discussion Paper Series 50
Figure 56 : Trend in soybean area, production and yield in sub-Saharan Africa
Figure 57 : Trend in soybean area, production and yield in South and South East Asia
400
800
1200
1600
2000
2400
2800
0.0
0.2
0.4
0.6
0.8
1.0
1.2
1.4
1.6
1.8
1980
19
82
1984
19
86
1988
19
90
1992
19
94
1996
19
98
2000
20
02
2004
20
06
2008
20
10
Yiel
d (k
g/ha
)
Area
(mill
ion
ha)
Prod
uctio
n (m
illio
n t)
Area Production Yield
0
400
800
1200
1600
0.0
2.0
4.0
6.0
8.0
10.0
12.0
14.0
1980
19
82
1984
19
86
1988
19
90
1992
19
94
1996
19
98
2000
20
02
2004
20
06
2008
20
10
Yiel
d (k
g/ha
)
Area
(mill
ion
ha)
Prod
uctio
n (m
illio
n t)
Area Production Yield

Grain Legumes Production, Consumption and Trade Trends in Developing Countries-An Assessment and Synthesis
ICRISAT - Socioeconomics Discussion Paper Series 51
Figure 58 : Trend in soybean area, production and yield in the developed world
10.2 Producer prices Soybean producer prices have increased except for sub-Saharan Africa where
between 1995 and 2009, it has decreased to the extent of US$158 per t from US$ 343 per t in 1995 (Figure 59). Compared to all other pulses, after 2000, inter-regional differences in soybean producer prices reduced to a great extent and ranged between US$450 per t and US$530 per t with the exception of Central and East Asia where the average producer price climbed at the rate of 2.9 per annum to reach US$1151 per t in 2009 which is the highest in the world (Figure 59). This has been mainly due to the high price levels in Republic of Korea where prices climbed from US$1402 per t to US$2562 per t in 2009. The lowest price rise has been in the case of South and South East Asia at about 0.73% per annum between 1995 and 2009 where the production has gone up by 65% during the same period (Figure 59 and Table 9). Latin America and Caribbean and the developed world, the largest producers of soybean witnessed farm-gate prices climb up by 62% and 29% respectively between 1995 and 2009 (Figure 59).
0
400
800
1200
1600
2000
2400
2800
3200
0.0
20.0
40.0
60.0
80.0
100.0
120.0
1980
19
82
1984
19
86
1988
19
90
1992
19
94
1996
19
98
2000
20
02
2004
20
06
2008
20
10
Yiel
d (k
g/ha
)
Area
(mill
ion
ha)
Prod
uctio
n (m
illio
n t)
Area Production Yield

Grain Legumes Production, Consumption and Trade Trends in Developing Countries-An Assessment and Synthesis
ICRISAT - Socioeconomics Discussion Paper Series 52
Figure 59 : Trends in soybean producer prices across regions
10.3 Trade In the last two decades, we find that soybean production has improved
tremendously in most regions of the world, distinct from other pulses. Likewise, trade in soybean is much higher compared to all other legumes. Latin America and Caribbean and the developed regions of the world are the highest producers and exporters of the crop. In the developed parts of the world, though some countries are leading in exports in the world like United States of America, Canada, Netherlands, Ukraine and Belgium, most European countries are large importers of soybeans from the aforesaid countries. In 2008-10, the total production in developed regions was around 96.71 million tonnes and export was around 39 million tonnes and import was 22 million tonnes (Table A.15). Latin America and Caribbean have expanded their exports from 8 million tonnes in 1994-96 to 39 million tonnes in 2007-09 (Figure 60), which constitutes 34.5% of the production (Table A.15). China is the largest importer of soybean in the world and between 1980 and 2009; its import has grown at the rate of 13% per annum reaching 44 million tonnes in 2009.
0
200
400
600
800
1000
1200
1400
1991
19
92
1993
19
94
1995
19
96
1997
19
98
1999
20
00
2001
20
02
2003
20
04
2005
20
06
2007
20
08
2009
US$
per
t
CEA LAC MENA DW SSA SSEA

Grain Legumes Production, Consumption and Trade Trends in Developing Countries-An Assessment and Synthesis
ICRISAT - Socioeconomics Discussion Paper Series 53
Figure 60 : Trade in soybean across regions
10.4 Consumption Distinct upward consumption trends are observed in all regions of the world in
the case of soybean (Figure 61). In Latin America and Caribbean, developed regions and sub-Saharan Africa production has grown much faster than the developed world (Figure A.8 and A.11) wherein the Americas export the surplus soybean production to Europe and China. In South and East Asia, after 1995, production growth has not been enough to satisfy total demand (Figure A.I0 and A.7). Middle East and North Africa has been experiencing a steeply rising demand with the production still remaining at the lowest level even in the recent past (Figure A.9).
-2
2
-1 0
2
-40
32
-4 -5
17
-50
-40
-30
-20
-10
0
10
20
30
40
CEA LAC MENA SSEA DW
mill
ion
tonn
es
1980-82
2007-09

Grain Legumes Production, Consumption and Trade Trends in Developing Countries-An Assessment and Synthesis
ICRISAT - Socioeconomics Discussion Paper Series 54
Figure 61: Trends in per capita availability of soybeans across regions
Soybean shows significant growth in consumption invariably across the globe.
The developed countries consumed 55 kg/person/year between 1980 and 2009 and the growth rate was 1.32% per annum (Table 1) representing the combined demand for livestock feed and for the generation of bio-diesel. Generation of bio-diesel with soybean oil is only a recent phenomenon in the USA. The average level of consumption in LAC was still higher at 82.15 kg/person/year with a growth rate of 4.05% per annum (Table 1). Soybean protein is used for processing into soy meal and then fed to the livestock. About 98% of the total soy protein in the world is used to feed the livestock (Goldsmith, 2008). The derived demand for soybean is what causes the spike in demand. In the developing countries, population and income has increased, causing the shift to livestock products in China, Brazil and India. Poultry and pork is increasingly being consumed by more and more people in China, where a significant growth in consumption of soybean is observed (Table 1).
11 Groundnut
11.1 Area, production and yield Groundnut is grown extensively in the developing countries of Asia, Africa and
Latin America. About 62% of the production comes from south, east and central Asia (Table 10). Sub-Saharan Africa contributes about 24% to total groundnut production where production has grown at the rate of 3.65% per annum between 1994-96 and 2008-10 (Table 10). Groundnut has a variety of uses ranging from oil production to providing feed for animals. Groundnut yield is about 1508 kg/ha on an average in 2008-10 in developing countries. It had grown at an annual rate of 1.88% (1994-96 to 2008-10). Area has expanded by 9.25% between 1994-96 and 2008-10 in the developing world. High-yielding varieties of the crop released by ICRISAT have
0
20
40
60
80
100
120
140
160
1980
1982
1984
1986
1988
1990
1992
1994
1996
1998
2000
2002
2004
2006
2008
kg/p
erso
n/ye
ar
CEA LAC MENA DW SSA SSEA

Grain Legumes Production, Consumption and Trade Trends in Developing Countries-An Assessment and Synthesis
ICRISAT - Socioeconomics Discussion Paper Series 55
helped increase the yield in Asia and Africa considerably which has improved the farmers’ livelihood as a cash crop.
Table 10: Groundnut area, yield and production
CEA LAC MENA SSA SSEA DW World
Area harvested (million ha) 1994-96 3.79 0.46 1.10 6.72 9.40 0.67 22.14 2008-10 4.42 0.52 1.15 9.91 7.45 0.57 24.02 % change (1994-2010) 17% 13% 5% 48% -21% -15% 9% Growth rate (%/year for 1994-2010) 0.9% -0.2% -2.0% 2.6% -1.5% -1.3% 0.4%
Production (million t) 1994-96 10.13 0.71 1.06 5.31 10.45 1.81 29.47 2008-10 14.97 1.24 1.22 9.02 8.94 2.04 37.42 % change (1994-2010) 48% 76% 15% 70% -15% 12% 27% Growth rate (%/year for 1994-2010) 2.6% 3.8% -0.3% 3.6% -0.5% 0.7% 1.7%
Yield (kg/ha) 1994-96 2,677 1,526 972 788 1,111 2,714 1,331 2008-10 3,388 2,402 1,068 910 1,198 3,598 1,558 % change (1994-2010) 27% 57% 10% 15% 8% 33% 17% Growth rate (%/year for 1994-2010) 1.7% 3.9% 1.7% 1.0% 1.0% 2.0% 1.3%
China tops in groundnut production with around 15 million tonnes in 2008-10 ahead of India, Nigeria and USA (Table A.8). In the case of both Nigeria and India however, the large production can be attributed to the large areas under groundnut cultivation. Groundnut yield in Central and East Asia has grown from 2.6 tonnes/ha in 1994-95 to 3.35 tonnes/ha in 2008-10 (Table 10). A similar rise is observed in the case of developed regions also reaching yield levels of 3.5 tonnes/ha in 2008-10 (Table 10).
Senegal and Sudan are the other important groundnut producers having an area share of about 12% altogether (Table A.8). The yield levels are below 1 tonne/ha, having a yield variability of more than 20% in each case (Table A.8). Myanmar and Indonesia, holding about 6% area share, have yield levels of 1.5 tonnes/ha and 1.2 tonnes/ha respectively with relatively less variability compared to Sudan and Senegal (Table A.8).
Area under groundnut in sub-Saharan Africa has grown at the rate of 2.65% per annum between 1994-95 and 2008-10 and currently stands at 9.91 million ha (Table 10). In contrast, it has come down in South and South East Asia by 1.95 million ha in the last fifteen years (Table 10). Within the same period, in Central and East Asia,

Grain Legumes Production, Consumption and Trade Trends in Developing Countries-An Assessment and Synthesis
ICRISAT - Socioeconomics Discussion Paper Series 56
there has been a 16% rise in area under groundnut and 26% jump in yield (Table 10).
Yield levels have generally moved up across all regions in the world. Yield levels in South and South East Asia have been fluctuating in the last fifteen years, whereas the rise in sub-Saharan Africa has been quite stable (Figure 65 and 66). A 7% rise is found in the case of South and South East Asia (from 1.11 to 1.19 tonnes/ha between 1994-95 and 2008-10) whereas a 15% rise in yield is observed in sub-Saharan Africa from 0.78 to 0.91 tonnes/ha (Table 10). Area follows varying trends across regions. It has moved downwards in Latin America, South and South East Asia and in the developed countries (Figure 63, 66 and 67) and upwards in the developed world amongst which, sub-Saharan Africa alone shows a significant upward trend (Figure 65).
Figure 62 : Trend in groundnut area, production and yield in Central and East Asia
1000
3000
5000
7000
9000
0.0
2.0
4.0
6.0
8.0
10.0
12.0
14.0
16.0
18.0
1980
19
82
1984
19
86
1988
19
90
1992
19
94
1996
19
98
2000
20
02
2004
20
06
2008
20
10
Yiel
d (k
g/ha
)
Area
(mill
ion
ha)
Prod
uctio
n (m
illio
n t)
Area Production Yield
1000
1400
1800
2200
2600
3000
3400
3800
0.0
0.2
0.4
0.6
0.8
1.0
1.2
1.4
1980
19
82
1984
19
86
1988
19
90
1992
19
94
1996
19
98
2000
20
02
2004
20
06
2008
20
10
Yiel
d (k
g/ha
)
Area
(mill
ion
ha)
Prod
uctio
n (m
illio
n t)
Area Production Yield

Grain Legumes Production, Consumption and Trade Trends in Developing Countries-An Assessment and Synthesis
ICRISAT - Socioeconomics Discussion Paper Series 57
Figure 63 : Trend in groundnut area, production and yield in Latin America and Caribbean
Figure 64 : Trend in groundnut area, production and yield in Middle East and North Africa
Figure 65 : Trend in groundnut area, production and yield in sub-Saharan Africa
650
1050
1450
1850
2250
0.0
0.2
0.4
0.6
0.8
1.0
1.2
1.4
1.6
1.8 19
80
1982
19
84
1986
19
88
1990
19
92
1994
19
96
1998
20
00
2002
20
04
2006
20
08
2010
Yiel
d (k
g/ha
)
Area
(mill
ion
ha)
Prod
uctio
n (m
illio
n t)
Area Production Yield
500
900
1300
1700
2100
2500
0.0
2.0
4.0
6.0
8.0
10.0
12.0
1980
19
82
1984
19
86
1988
19
90
1992
19
94
1996
19
98
2000
20
02
2004
20
06
2008
20
10
Yiel
d (k
g/ha
)
Area
(mill
ion
ha)
Prod
uctio
n (m
illio
n t)
Area Production Yield

Grain Legumes Production, Consumption and Trade Trends in Developing Countries-An Assessment and Synthesis
ICRISAT - Socioeconomics Discussion Paper Series 58
Figure 66 : Trend in groundnut area, production and yield in South and South East Asia
Figure 67 : Trend in groundnut area, production and yield in the developed world
11.2 Producer prices Asia and Africa produce 91% of the world’s total groundnut production. India
shows a stagnant trend in producer prices averaging at US$350 per t between 1991 and 2009 falling between 1991 and 1998 and increasing thereafter. Production has however fallen by 20% during the same period between 1991 and 2009 in India. Sub-Saharan Africa follows the same trend as South and South East Asia after 1998, till then it has been found to have lower prices than South Asia (Figure 68). It should be noted that with the inclusion of Kenya and Rwanda, prices would have been higher. These countries showed unusually high prices and had small area shares and so were excluded for regional producer price trend calculation. In the
700
1100
1500
1900
2300
2700
0.0
2.0
4.0
6.0
8.0
10.0
12.0
14.0
1980
19
82
1984
19
86
1988
19
90
1992
19
94
1996
19
98
2000
20
02
2004
20
06
2008
20
10
Yiel
d (k
g/ha
)
Area
(mill
ion
ha)
Prod
uctio
n (m
illio
n t)
Area Production Yield
1700
3700
5700
7700
0.0
0.5
1.0
1.5
2.0
2.5
3.0
1980
19
82
1984
19
86
1988
19
90
1992
19
94
1996
19
98
2000
20
02
2004
20
06
2008
20
10
Yiel
d (k
g/ha
)
Area
(mill
ion
ha)
Prod
uctio
n (m
illio
n t)
Area Production Yield

Grain Legumes Production, Consumption and Trade Trends in Developing Countries-An Assessment and Synthesis
ICRISAT - Socioeconomics Discussion Paper Series 59
recent years, Middle East and North Africa has seen a sharp rise in producer prices exceeding that of the developed world which was having highest prices regionally till 2003. Sudan and Egypt which are the largest producers of groundnut in the region experience sharp increases after 2005. In Central and East Asia, prices show an increasing trend between 1991 and 2009 from US$292 per t in 1992 to US$556 per t in 2009 even though production increased by 146% in China during the same period. Prices would have been much higher if Republic of Korea had been included in the regional producer prices analysis for its extremely high prices for a small area share of groundnut (Figure 68).
Figure 68 : Trends in groundnut producer prices across regions
11.3 Trade Although groundnut trade has increased over the years, only a small percentage
of the production is found to be exported in Asia (Figure 69). Between 1994-96 and 2008-10, production of groundnut in South and South East Asia, the highest producer of groundnut in the world moved from 10.45 million tonnes to 8.94 million tonnes and exports doubled reaching 0.033 million in 2007-09 (Table A.16). Imports are found to have increased seven fold during the same period reaching a level of 0.109 million tonnes in 2007-09 (Table A.16). Comparatively, the developed countries produce only 17% of that which produced in Asia (1994-96) (Table 10). In 2008-10, production of groundnut in developed countries improved to 2.04 million tonnes from 1.81 tonnes fifteen years ago with a growth rate of less than 1% (Table A.18). Import of groundnut by developed countries has also declined as a percentage of production from 7.5% in 1994-96 to 5.5% 2008-10 (Table A.16).
0 100 200 300 400 500 600 700 800 900
1000
1991
19
92
1993
19
94
1995
19
96
1997
19
98
1999
20
00
2001
20
02
2003
20
04
2005
20
06
2007
20
08
2009
USA
/ton
ne
CEA LAC MENA DW SSA SSEA

Grain Legumes Production, Consumption and Trade Trends in Developing Countries-An Assessment and Synthesis
ICRISAT - Socioeconomics Discussion Paper Series 60
Figure 69 : Trade in groundnut across regions
11.4 Consumption Groundnut consumption shows varying trends across the various regions
(Figure 70). Compared to soybean, an alternative oilseed, the consumption levels have not fared well. Central and East Asia has increased its groundnut consumption at the rate of 5.5% per annum between 1980 and 2007 and now exceeds South and South East Asia in consumption (Figure A.13). Except for the developed countries, the gap between production and consumption is minimal (Figure A.18). Throughout the period between 1980 and 2007, production deficit has been increasing, fluctuating between 0.1 and 0.9 million tonnes in the developed countries. Sub-Saharan Africa shows a significant upward trend in consumption and production has always been just enough to satisfy demand (Figure A.17).
Figure 70: Trends in per capita availability of groundnut across regions
-8
16 28
0 14
-30
72
-17
8 3
-76 -71
-100
-80
-60
-40
-20
0
20
40
60
80
CEA LAC MENA SSA SSEA DW
'000
tonn
es
1980-82
2007-09
0
2
4
6
8
10
12
14
1980
1982
1984
1986
1988
1990
1992
1994
1996
1998
2000
2002
2004
2006
2008
kg/p
erso
n/ye
ar
CEA LAC MENA DW SSA SSEA

Grain Legumes Production, Consumption and Trade Trends in Developing Countries-An Assessment and Synthesis
ICRISAT - Socioeconomics Discussion Paper Series 61
Groundnut is mainly viewed as an oilseed, and among pulses, it has the highest consumption levels next only to soybean. Sub-Saharan Africa consumed around 9.88 kg/person/year on an average between 1980 and 2009, where an annual growth rate of 1.09% is recorded (Table 1). Central and East Asia is the next highest consumer in terms of per capita availability which shows a high growth rate of 3.94% per annum (Table 1). South and South East Asia which has a consumption level of 5.34 kg/person/year, has fallen in consumption level at the rate of 1.15% per annum (Table 1). In all other regions, consumption has remained relatively stagnant.
12 Conclusion Trend analysis reveals the growing importance of pulse crops across all
economies and the lack of research efforts in developing countries. Whereas in the developed economies, the commercial benefits from expanding pulse production are being realised more than ever in the past few decades, about 50% to 75% of the national research funds in developing countries are allocated to rice and wheat alone. Poor government support, low productivity of new cultivars and biotic and abiotic constraints due to marginalisation of pulse crops are the main factors of low production in Asia and Africa. In India, the high post-harvest costs (marketing margins) are eating up the profits. Also, poor yields impede in realising the high market prices in relation to cereals.
Population is another major factor in determining the pulse production. As the western countries are recognising pulses as healthy foods, per capita consumption of pulses is falling in Asia and Africa since production growth is not moving in line with population growth. In most regions, production and consumption follow the same trajectory, indicating that consumption is limited to domestic production.
Another matter of concern in pulse production is the huge yield gap between developing countries and developed countries. This is evident from the fact that production in developed countries has increased due to yield improvement whereas in in developing countries due to area expansion. The yield growth between 1980 and 2004 in developed countries was 2% per annum and in developing countries, about 0.4% per annum (IFLRC-IV, 2005). Shifting pulse cultivation to limited-irrigation zones and improving input usage could have a huge impact on boosting yields. If the government were to support pulse production, then the trade-off between land allocated for cereals and pulses would reduce substantially. The low marketability of pulses, high risk in yield and process are the principal factors that put off farmers from cultivating pulses.
Pulses have a thin and volatile market. Developing countries still grow pulses as a subsistence crop whereas pulses like soybean are grown as a commercial crop in the west. Some European countries which import soybeans from the west are trying to produce their own protein-rich foods but with hardly any success. The developing countries are yet to tap into the huge market for stock feed in industrialised countries. A persistent increase in the demand for food legumes in Asia and Africa has led to a rise in imports. The money that is lost on foreign exchange could well be

Grain Legumes Production, Consumption and Trade Trends in Developing Countries-An Assessment and Synthesis
ICRISAT - Socioeconomics Discussion Paper Series 62
invested in the domestic market for attaining self-sufficiency. The demand for pulses spurred by the population and income growth in the developing countries has resulted in some developed countries increasing their domestic production to capture these markets. Therefore, it is high time the developing countries realise the huge potential of pulses in increasing the soil fertility and nutrition and take steps in increasing the productivity and thus the production of pulses.

Grain Legumes Production, Consumption and Trade Trends in Developing Countries-An Assessment and Synthesis
ICRISAT - Socioeconomics Discussion Paper Series 63
13 References
Beebe S 2006. Successes and Challenges in Improving Common Bean Productivity http://www.cgiar.org/pdf/Beebe-%20Summary-Challenges%20in%20Bean%20improvement.pdf
Bejiga G and Degago Y 2000. Regional reviews. Linking Research and Marketing Opportunities for Pulses in the 21st Century. In: R. Knight (ed.) Linking Research and Marketing Opportunities for Pulses in the 21st Century, pp. 99-106. Dordrecht, the Netherlands: Kluwer Academic Publishers. ISBN 0-7923-5565-2.
BenBelhassen, Boubaker 2006. Pulses: Past trends and future prospects. Paper contributed by FAO to the 4th International Food Legumes Research Conference (IFLRC-IV) held in New Delhi, India, on 18-22 October 2005. http://www.fao.org/es/esc/common/ecg/98/en/PulsesStudy.pdf
Boukar O, Abdoulaye T, Tamó M, Agrama H, Tefera H, Fatokun C and Boahen S 2012. A success tale on improving two legume crops in Africa. IITA, R4D Review
Byerlee D and White R 2000. Agricultural systems intensification and diversification through food legumes: Technological and policy options. In: R. Knight (ed.) Linking Research and Marketing Opportunities for Pulses in the 21st Century, pp. 31-46. Dordrecht, the Netherlands: Kluwer Academic Publishers. ISBN 0-7923-5565-2.
FAOSTAT/FAO 2012. http://faostat.fao.org/, accessed May 2012 Goldsmith P 2008. Economics of soybean production, marketing and utilization.
University of Illinois, Urbana-Champaign, IL, 61801. Henkel, J 2000. Soy: Health Claims for Soy Protein, Question About Other
Components. FDA Consumer (Food and Drug Administration) 34 (3): 18–20. PMID 11521249
http://cowpea2010.iita.org/news-page-asset/-/asset_publisher/i7WP/content/all-eyes-on-black-eyed-peas/
http://www.cgiar.org/our-research/crop-factsheets/chickpea/ Johansen C, Duxbury JM, Virmani SM, Gowda CLL, Pande S and Joshi PK
(eds). Legumes in Rice and Wheat Cropping Systems of the Indo-Gangetic Plain: Constraints and Opportunities. ICRISAT, Patancheru, India; and Cornell University, New York, USA.
Joshi PK, Asokan M, Datta KK and Kumar P 2000. Socioeconomic Constraints to Legumes Production in Rice-Wheat Cropping Systems of India. pages 176-184.
Latham MC 1997. Human nutrition in the developing world. Food and Nutrition Series - No. 29. Food and Agriculture Organization of the United Nations, Rome.
Lawrence KA, no date. Soybean: Africa’s Potential Cinderella Food Crop. Chapter 9. The Polytechnic, Ibadan, Nigeria.

Grain Legumes Production, Consumption and Trade Trends in Developing Countries-An Assessment and Synthesis
ICRISAT - Socioeconomics Discussion Paper Series 64
Leterme P and Carmenza Munoz L 2002. Factors influencing pulse consumption in Latin America. British Journal of Nutrition
Singh BB, Mohan Raj DR, Dashiell KE and Jackai LEN 1997. Advances in Cowpea Research. IITA and JIRCAS
Singh KB and Saxena MC, 1996. Winter Chickpea in Mediterranean-Type Environments.ICARDA, Aleppo, Syria. 38 pp.
Technical Advisory Committee 1997. CGIAR Priorities and Strategies for Resource Allocation during 1998-2000 and Centre Proposals.

Grain Legumes Production, Consumption and Trade Trends in Developing Countries-An Assessment and Synthesis
ICRISAT - Socioeconomics Discussion Paper Series 65
Appendixes
List of countries included in regional analysis as defined by FAO Sub-Saharan Africa Angola Niger Benin Nigeria Botswana Réunion Burkina Faso Rwanda Burundi Saint Helena Cameroon Sao Tome and Principe Cape Verde Senegal Central African Republic Seychelles Chad Sierra Leone Comoros Somalia Côte d'Ivoire South Africa D R Congo Swaziland Djibouti Togo Equatorial Guinea Uganda Eritrea United Republic of Tanzania Ethiopia Zambia Gabon Zimbabwe Gambia Congo Ghana Ethiopia Guinea Malawi Guinea-Bissau Mali Kenya Mauritania Lesotho Mauritius Liberia Mayotte Madagascar Mozambique Namibia

Grain Legumes Production, Consumption and Trade Trends in Developing Countries-An Assessment and Synthesis
ICRISAT - Socioeconomics Discussion Paper Series 66
Latin America and Caribbean Anguilla Chile Antigua and Barbuda Dominica Argentina Panama Aruba Paraguay Bahamas Honduras Barbados Jamaica Belize Martinique Bolivia Grenada Brazil Mexico British Virgin Islands Guatemala Cayman Islands Netherlands Antilles Colombia Nicaragua Costa Rica Trinidad and Tobago Cuba Peru Ecuador Puerto Rica El Salvador Venezuela Falkland Islands Saint Kitts and Nevis French Guiana Montserrat Dominican Republic Saint Lucia Haiti Suriname Guyana Saint Vincent and the Grenadines Guadeloupe Turks and Caicos Islands Uruguay United States Virgin Islands

Grain Legumes Production, Consumption and Trade Trends in Developing Countries-An Assessment and Synthesis
ICRISAT - Socioeconomics Discussion Paper Series 67
Middle East and North Africa Algeria Oman Armenia Qatar Azerbaijan Sudan Bahrain Tunisia Cyprus Turkey Egypt Western Sahara Georgia Syrian Arab Republic Iraq Tunisia Israel Turkey Jordan Western Sahara Kuwait Syrian Arab Republic Lebanon Saudi Arabia Libya United Arab Emirates Morocco Yemen Occupied Palestinian South and South East Asia Afghanistan Iran Bangladesh Maldives Brunei Darussalam Lao People's Democratic Cambodia Singapore Indonesia Thailand Bhutan Nepal India Pakistan Viet Nam Sri Lanka Malaysia Timor-Leste Myanmar Philippines Central and East Asia Kazakhstan Kyrgyzstan China Tajikistan Democratic Republic of Korea Turkmenistan Mongolia Uzbekistan Republic of Korea

Grain Legumes Production, Consumption and Trade Trends in Developing Countries-An Assessment and Synthesis
ICRISAT - Socioeconomics Discussion Paper Series 68
Country-level area, production and yield of legumes
Table A. 1: Dry bean area, production and yield across countries
2008-10
1980-
2010
Countries
Area (million
ha)
Production (million
t)
Yield (kg/ha
)
CV of
Yield
Area share (%)
Cumulative area share
1 India 8.3 3.4 411 0.15 30.2 30 2 Brazil 3.8 3.4 897 0.26 13.8 44 3 Myanmar 2.8 3.1 1,112 0.20 10.1 54 4 Mexico 1.4 1.1 773 0.14 5.3 59
5 United Republic of Tanzania 1.2 0.9 749 0.14 4.5 64
6 China 1.0 1.6 1,657 0.18 3.5 67 7 Uganda 0.9 0.5 491 0.20 3.3 71 8 Kenya 0.8 0.4 488 0.24 2.8 73
9 United States of America 0.7 1.3 1,930 0.08 2.4 76
10 Angola 0.6 0.2 341 0.19 2.2 78 11 Rwanda 0.3 0.3 962 0.14 1.2 79 12 Indonesia 0.3 0.3 1,098 0.24 1.0 80 13 Argentina 0.3 0.3 1,238 0.13 1.0 81 14 Malawi 0.3 0.1 594 0.13 0.9 82
15
Democratic People's Republic of Korea 0.3 0.2 919 0.05 0.9 83
16 Ethiopia 0.2 0.3 1,062 0.33 0.9 84 17 Viet Nam 0.2 0.2 924 0.20 0.9 85 18 Nicaragua 0.2 0.2 746 0.13 0.9 86 19 Guatemala 0.2 0.2 824 0.15 0.8 87
20
Democratic Republic of the Congo 0.2 0.1 541 0.04 0.8 87
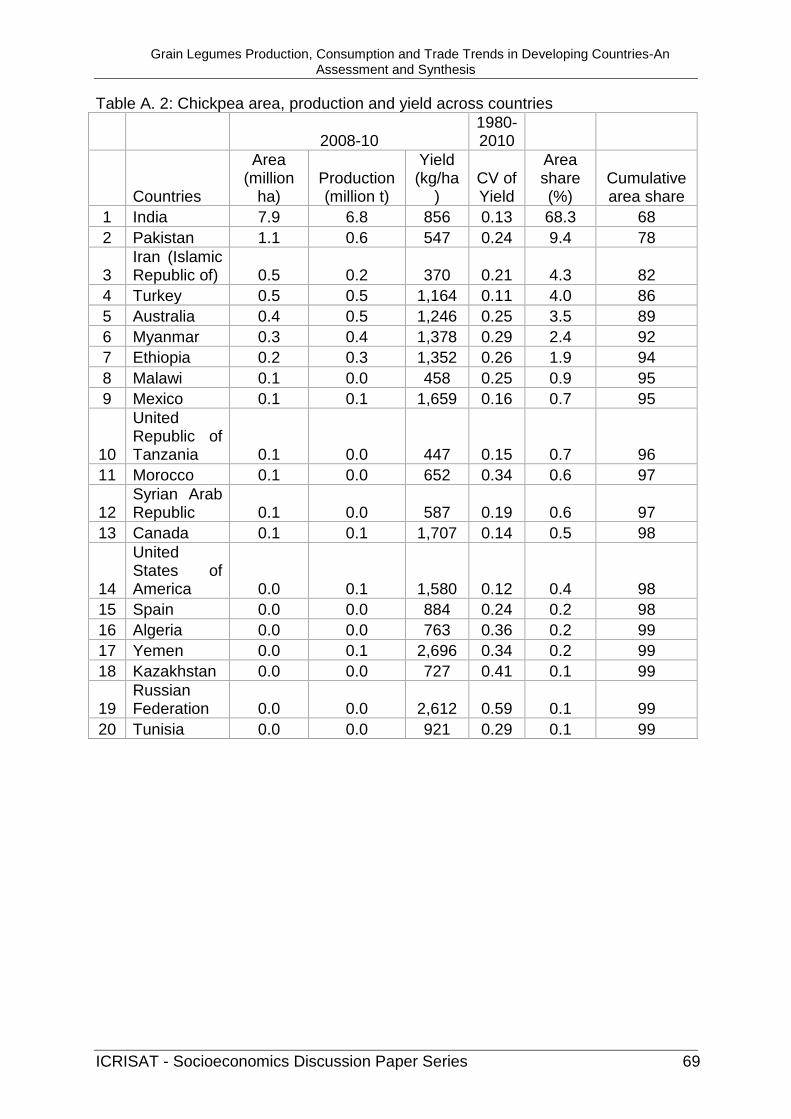
Grain Legumes Production, Consumption and Trade Trends in Developing Countries-An Assessment and Synthesis
ICRISAT - Socioeconomics Discussion Paper Series 69
Table A. 2: Chickpea area, production and yield across countries
2008-10
1980-2010
Countries
Area (million
ha) Production (million t)
Yield (kg/ha
) CV of Yield
Area share (%)
Cumulative area share
1 India 7.9 6.8 856 0.13 68.3 68 2 Pakistan 1.1 0.6 547 0.24 9.4 78
3 Iran (Islamic Republic of) 0.5 0.2 370 0.21 4.3 82
4 Turkey 0.5 0.5 1,164 0.11 4.0 86 5 Australia 0.4 0.5 1,246 0.25 3.5 89 6 Myanmar 0.3 0.4 1,378 0.29 2.4 92 7 Ethiopia 0.2 0.3 1,352 0.26 1.9 94 8 Malawi 0.1 0.0 458 0.25 0.9 95 9 Mexico 0.1 0.1 1,659 0.16 0.7 95
10
United Republic of Tanzania 0.1 0.0 447 0.15 0.7 96
11 Morocco 0.1 0.0 652 0.34 0.6 97
12 Syrian Arab Republic 0.1 0.0 587 0.19 0.6 97
13 Canada 0.1 0.1 1,707 0.14 0.5 98
14
United States of America 0.0 0.1 1,580 0.12 0.4 98
15 Spain 0.0 0.0 884 0.24 0.2 98 16 Algeria 0.0 0.0 763 0.36 0.2 99 17 Yemen 0.0 0.1 2,696 0.34 0.2 99 18 Kazakhstan 0.0 0.0 727 0.41 0.1 99
19 Russian Federation 0.0 0.0 2,612 0.59 0.1 99
20 Tunisia 0.0 0.0 921 0.29 0.1 99

Grain Legumes Production, Consumption and Trade Trends in Developing Countries-An Assessment and Synthesis
ICRISAT - Socioeconomics Discussion Paper Series 70
Table A. 3: Cowpea area, production and yield across countries
2008-10
1980-2010
Countries
Area (million
ha)
Production (million
t) Yield
(kg/ha) CV of Yield
Area share (%)
Cumulative area share
1 Niger 5.0 1.4 267 0.41 47.6 48 2 Nigeria 3.1 2.5 836 0.24 29.7 77 3 Burkina Faso 0.7 0.4 499 0.09 6.7 84 4 Mali 0.3 0.1 385 0.44 2.5 86 5 Senegal 0.2 0.1 416 0.30 2.0 88 6 Sudan 0.2 0.1 275 0.37 1.8 90
7
United Republic of Tanzania 0.2 0.1 556 0.40 1.5 92
8 Myanmar 0.1 0.2 1,199 0.37 1.4 93 9 Kenya 0.1 0.1 412 0.27 1.4 95
10 Cameroon 0.1 0.1 1,013 0.06 1.2 96
11
Democratic Republic of the Congo 0.1 0.1 461 0.12 1.2 97
12 Malawi 0.1 0.1 720 0.10 0.9 98 13 Uganda 0.1 0.1 1,074 0.20 0.7 99 14 Haiti 0.0 0.0 694 0.19 0.4 99 15 Mauritania 0.0 0.0 474 0.21 0.2 99 16 Peru 0.0 0.0 1,387 0.09 0.2 99
17 United States
of America 0.0 0.1 3,533 0.72 0.1 100 18 Sri Lanka 0.0 0.0 1,076 0.13 0.1 100 19 South Africa 0.0 0.0 656 0.33 0.1 100 20 Serbia 0.0 0.0 3,518 0.10 0.1 100

Grain Legumes Production, Consumption and Trade Trends in Developing Countries-An Assessment and Synthesis
ICRISAT - Socioeconomics Discussion Paper Series 71
Table A. 4: Pigeonpea area, production and yield across countries
2008-10
1980-
2010
Countries
Area (million
ha) Production (million t)
Yield (kg/ha
)
CV of
Yield
Area share (%)
Cumulative area share
1 India 3.5 2.6 731 0.10 74.9 75 2 Myanmar 0.6 0.7 1,229 0.28 12.7 88 3 Malawi 0.2 0.2 905 0.18 4.1 92 4 Kenya 0.2 0.1 491 0.22 3.3 95 5 Uganda 0.1 0.1 1,015 0.28 1.9 97
6
United Republic of Tanzania 0.1 0.1 738 0.07 1.5 98
7 Dominican Republic 0.0 0.0 927 0.25 0.5 99
8 Nepal 0.0 0.0 876 0.15 0.4 99
9
Democratic Republic of the Congo 0.0 0.0 582 0.07 0.2 100
10 Haiti 0.0 0.0 356 0.15 0.1 100 11 Panama 0.0 0.0 413 0.33 0.1 100 12 Burundi 0.0 0.0 965 0.11 0.0 100
13
Venezuela (Bolivarian Republic of) 0.0 0.0 769 0.22 0.0 100
14 Trinidad and Tobago 0.0 0.0 855 0.27 0.0 100
15 Bangladesh 0.0 0.0 939 0.24 0.0 100 16 Philippines 0.0 0.0 1,271 0.11 0.0 100 17 Jamaica 0.0 0.0 1,118 0.10 0.0 100 18 Grenada 0.0 0.0 832 0.26 0.0 100 19 Comoros 0.0 0.0 675 0.10 0.0 100 20 Puerto Rico 0.0 0.0 735 0.35 0.0 100

Grain Legumes Production, Consumption and Trade Trends in Developing Countries-An Assessment and Synthesis
ICRISAT - Socioeconomics Discussion Paper Series 72
Table A. 5: Lentil area, production and yield across countries
2008-10
1980-2010
Countries
Area (million
ha) Production (million t)
Yield (kg/ha)
CV of Yield
Area share (%)
Cumulative area share
1 India 1.3 0.9 666 0.12 35.6 36 2 Canada 1.0 1.5 1,505 0.24 26.8 62 3 Turkey 0.2 0.3 1,338 0.24 5.7 68 4 Nepal 0.2 0.2 821 0.18 5.0 73
5 United States of America 0.2 0.3 1,372 0.18 4.8 78
6 Iran (Islamic Republic of) 0.2 0.1 433 0.23 4.5 82
7 Syrian Arab Republic 0.1 0.1 619 0.31 3.3 86
8 Australia 0.1 0.1 970 0.56 3.2 89 9 Ethiopia 0.1 0.1 1,115 0.31 2.7 92
10 Bangladesh 0.1 0.1 920 0.11 2.0 94 11 China 0.1 0.1 2,042 0.27 1.7 95 12 Morocco 0.0 0.0 546 0.47 1.0 96 13 Pakistan 0.0 0.0 467 0.15 0.8 97 14 Spain 0.0 0.0 611 0.30 0.6 98 15 Yemen 0.0 0.0 805 0.25 0.3 98
16 Russian Federation 0.0 0.0 667 0.32 0.3 98
17 France 0.0 0.0 1,350 0.18 0.2 98 18 Mexico 0.0 0.0 888 0.28 0.2 99 19 Iraq 0.0 0.0 386 0.36 0.2 99 20 Colombia 0.0 0.0 309 0.12 0.1 99

Grain Legumes Production, Consumption and Trade Trends in Developing Countries-An Assessment and Synthesis
ICRISAT - Socioeconomics Discussion Paper Series 73
Table A. 6: Trends in fababean area, production and yield across countries
2008-10
1980-2010
Countries
Area (million
ha) Production (million t)
Yield (kg/ha)
CV of Yield
Area share (%)
Cumulative area share
1 China 0.9 1.7 1,906 0.16 36.0 36 2 Ethiopia 0.5 0.6 1,214 0.14 21.0 57 3 Morocco 0.2 0.1 736 0.40 7.4 64 4 Australia 0.1 0.2 1,455 0.37 5.7 70 5 France 0.1 0.4 4,454 0.14 4.0 74 6 Egypt 0.1 0.3 3,295 0.18 3.1 77 7 Sudan 0.1 0.1 1,944 0.20 2.8 80 8 Tunisia 0.1 0.1 1,261 0.37 2.3 82 9 Peru 0.1 0.1 1,251 0.11 2.1 84 10 Italy 0.1 0.1 1,973 0.17 2.1 87 11 Brazil 0.0 0.0 477 0.25 1.7 88 12 Algeria 0.0 0.0 988 0.37 1.3 90 13 Portugal 0.0 0.0 747 0.16 1.0 91
14 United Kingdom 0.0 0.1 3,481 0.14 1.0 92
15 Spain 0.0 0.0 1,399 0.20 0.9 92
16 Guatemala 0.0 0.0 934 0.24 0.8 93
17 Mexico 0.0 0.0 1,113 0.41 0.8 94
18
Syrian Arab Republic 0.0 0.0 1,961 0.13 0.8 95
19 Paraguay 0.0 0.0 926 0.09 0.6 95 20 Germany 0.0 0.0 3,574 0.12 0.5 96

Grain Legumes Production, Consumption and Trade Trends in Developing Countries-An Assessment and Synthesis
ICRISAT - Socioeconomics Discussion Paper Series 74
Table A. 7: Soybean area, production and yield across countries
2008-10
1980-
2010
Countries
Area (million
ha)
Production (million
t)
Yield (kg/ha
)
CV of
Yield
Area share (%)
Cumulative area share
1 United States of America 30.7 87.6 2,851 0.14 30.9 31
2 Brazil 22.1 61.9 2,798 0.20 22.2 53 3 Argentina 17.1 43.3 2,525 0.16 17.2 70 4 India 9.5 9.9 1,045 0.19 9.6 80 5 China 8.9 15.2 1,701 0.14 9.0 89 6 Paraguay 2.6 5.9 2,285 0.24 2.6 91 7 Canada 1.4 3.7 2,756 0.12 1.4 93
8
Bolivia (Plurinational State of) 1.0 1.5 1,547 0.14 1.0 94
9 Russian Federation 0.8 1.0 1,138 0.19 0.9 95
10 Ukraine 0.7 1.2 1,603 0.21 0.7 95 11 Indonesia 0.7 0.9 1,344 0.13 0.7 96 12 Uruguay 0.6 1.2 1,853 0.25 0.6 97 13 Nigeria 0.5 0.5 1,114 0.54 0.5 97
14
Democratic People's Republic of Korea 0.3 0.4 1,167 0.07 0.3 97
15 South Africa 0.2 0.5 1,898 0.23 0.2 98 16 Viet Nam 0.2 0.3 1,453 0.26 0.2 98 17 Myanmar 0.2 0.2 1,333 0.21 0.2 98 18 Serbia 0.2 0.4 2,679 0.14 0.2 98 19 Uganda 0.2 0.2 1,177 0.14 0.2 98 20 Japan 0.1 0.2 1,659 0.12 0.1 99

Grain Legumes Production, Consumption and Trade Trends in Developing Countries-An Assessment and Synthesis
ICRISAT - Socioeconomics Discussion Paper Series 75
Table A. 8: Groundnut area, production and yield across countries
2008-10
1980-
2010
Countries
Area (million
ha) Production (million t)
Yield (kg/ha
)
CV of
Yield
Area share (%)
Cumulative area share
1 India 5.5 6.1 1,105 0.18 23.0 23 2 China 4.4 14.9 3,390 0.24 18.3 41 3 Nigeria 2.5 2.8 1,119 0.22 10.6 52 4 Senegal 1.0 1.0 975 0.24 4.3 56 5 Sudan 1.0 0.8 803 0.20 4.2 60 6 Myanmar 0.8 1.3 1,533 0.22 3.4 64 7 Niger 0.7 0.3 466 0.32 2.9 67 8 Indonesia 0.6 0.8 1,240 0.13 2.6 69
9 United Republic of Tanzania 0.5 0.4 721 0.19 2.3 72
10 Chad 0.5 0.4 753 0.19 2.2 74
11 United States of America 0.5 2.0 3,795 0.15 2.2 76
12
Democratic Republic of the Congo 0.5 0.4 778 0.05 2.0 78
13 Burkina Faso 0.4 0.3 830 0.21 1.7 80 14 Mali 0.4 0.3 937 0.15 1.5 81 15 Ghana 0.3 0.5 1,428 0.23 1.4 83 16 Cameroon 0.3 0.5 1,486 0.71 1.3 84 17 Mozambique 0.3 0.1 263 0.20 1.2 85 18 Angola 0.3 0.1 375 0.19 1.2 86 19 Malawi 0.3 0.2 933 0.24 1.1 87 20 Viet Nam 0.2 0.5 2,095 0.30 1.0 88
Export and import quantities of legumes across regions
Table A. 9: Dry bean export and import quantity across regions in 1980-82 and 2007-09 (‘000 tonnes)
Export Quantity Import Quantity
1980-82 2007-09 1980-82 2007-09 CEA 69 981 74 123 LAC 214 464 522 632 MENA 15 101 75 284 SSA 61 66 46 274 SSEA 289 1,062 176 1,001 DW 759 974 572 991

Grain Legumes Production, Consumption and Trade Trends in Developing Countries-An Assessment and Synthesis
ICRISAT - Socioeconomics Discussion Paper Series 76
Table A. 10: Chickpea export and import across regions in 1980-82 and 2007-09 (‘000 tonnes)
Export Quantity Import Quantity
1980-82 2007-09 1980-82 2007-09 CEA - 4 - 1 LAC 64 126 9 28 MENA 157 122 59 271 SSA 0 26 - 5 SSEA 2 205 13 506 DW 2 498 52 196
Table A. 11: Cowpea export and import across regions in 1980-82 and 2007-09 (‘000 tonnes)
Export Quantity Import Quantity
1980-82 2007-09 1980-82 2007-09 SSA 25 - 0 - DW 12 1 0 4
Table A. 12: Pigeonpea export and import across regions in 1980-82 and 2007-09 (‘000 tonnes)
Export Quantity Import Quantity
1980-82 2007-09 1980-82 2007-09 LAC 1 0 4 0 SSA 7 0 - 2 SSEA - 1 7 -
Table A. 13: Lentil export and import across regions in 1980-82 and 2007-09 (‘000 tonnes)
Export Quantity Import Quantity
1980-82 2007-09 1980-82 2007-09 CEA - 16 - 3 LAC 10 2 29 208 MENA 254 245 171 517 SSA 2 1 0 22 SSEA 6 37 32 529 DW 96 1,289 124 246

Grain Legumes Production, Consumption and Trade Trends in Developing Countries-An Assessment and Synthesis
ICRISAT - Socioeconomics Discussion Paper Series 77
Table A. 14: Fababean export and import across regions in 1980-82 and 2007-09 (‘000 tonnes)
Export Quantity Import Quantity
1980-82 2007-09 1980-82 2007-09 CEA 15 36 0 3 LAC 0 2 0 5 MENA 44 26 24 373 SSA 20 0 1 5 SSEA - 1 - 19 DW 92 516 118 124
Table A. 15: Soybean export and import across regions in 1980-82 and 2007-09 (‘000 tonnes)
Export Quantity Import Quantity
1980-82 2007-09 1980-82 2007-09 CEA 142 427 2,115 40,461 LAC 3,760 38,901 1,879 6,587 MENA 0 1 568 3,868 SSA 1 89 3 117 SSEA 27 118 499 4,915 DW 23,412 38,791 20,937 21,573

Grain Legumes Production, Consumption and Trade Trends in Developing Countries-An Assessment and Synthesis
ICRISAT - Socioeconomics Discussion Paper Series 78
Table A. 16: Groundnut export and import across regions in 1980-82 and 2007-09 (‘000 tonnes)
Export Quantity Import Quantity
1980-82 2007-09 1980-82 2007-09 CEA 1 73 9 1 LAC 25 1 9 18 MENA 32 27 5 19 SSA 2 8 2 5 SSEA 16 33 2 109 DW 33 43 62 114
Consumption and production trends across regions
Figure A. 1: Trends in dry bean consumption and production in Central and East Asia
0
500
1000
1500
2000
2500
3000
1980 1983 1986 1989 1992 1995 1998 2001 2004 2007
'000
tonn
es
Consumption Production

Grain Legumes Production, Consumption and Trade Trends in Developing Countries-An Assessment and Synthesis
ICRISAT - Socioeconomics Discussion Paper Series 79
Figure A. 2: Trends in dry bean consumption and production in Latin America and Caribbean
Figure A. 3: Trends in dry bean consumption and production in Middle East and North Africa
0
1000
2000
3000
4000
5000
6000
7000
1980 1983 1986 1989 1992 1995 1998 2001 2004 2007
'000
tonn
es
Consumption Production
0
100
200
300
400
500
600
1980 1983 1986 1989 1992 1995 1998 2001 2004 2007
'000
tonn
es
Consumption Production

Grain Legumes Production, Consumption and Trade Trends in Developing Countries-An Assessment and Synthesis
ICRISAT - Socioeconomics Discussion Paper Series 80
Figure A. 4: Trends in dry bean consumption and production in sub-Saharan Africa
Figure A. 5: Trends in dry bean consumption and production in South and South East Asia
0
500
1000
1500
2000
2500
3000
3500
4000
1980 1983 1986 1989 1992 1995 1998 2001 2004 2007
'000
tonn
es
Consumption Production
0
1000
2000
3000
4000
5000
6000
7000
8000
1980 1983 1986 1989 1992 1995 1998 2001 2004 2007
'000
tonn
es
Consumption Production

Grain Legumes Production, Consumption and Trade Trends in Developing Countries-An Assessment and Synthesis
ICRISAT - Socioeconomics Discussion Paper Series 81
Figure A. 6: Trends in dry bean consumption and production in developed regions
Figure A. 7: Trends in soybean consumption and production in Central and East Asia
0
500
1000
1500
2000
2500
3000
1980 1983 1986 1989 1992 1995 1998 2001 2004 2007
'000
tonn
es
Consumption Production
0
10000
20000
30000
40000
50000
60000
1980 1983 1986 1989 1992 1995 1998 2001 2004 2007
'000
tonn
es
Consumption Production

Grain Legumes Production, Consumption and Trade Trends in Developing Countries-An Assessment and Synthesis
ICRISAT - Socioeconomics Discussion Paper Series 82
Figure A. 8: Trends in soybean consumption and production in Latin America and Caribbean
Figure A. 9: Trends in soybean consumption and production in Middle East and North Africa
0
20000
40000
60000
80000
100000
120000
1980 1983 1986 1989 1992 1995 1998 2001 2004 2007
'000
tonn
es
Consumption Production
0
500
1000
1500
2000
2500
3000
3500
4000
4500
1980 1983 1986 1989 1992 1995 1998 2001 2004 2007
'000
tonn
es
Consumption Production

Grain Legumes Production, Consumption and Trade Trends in Developing Countries-An Assessment and Synthesis
ICRISAT - Socioeconomics Discussion Paper Series 83
Figure A. 10: Trends in soybean consumption and production in sub-Saharan Africa
Figure A. 11: Trends in soybean consumption and production in sub-Saharan Africa
0
200
400
600
800
1000
1200
1400
1600
1980 1983 1986 1989 1992 1995 1998 2001 2004 2007
'000
tonn
es
Consumption Production
0
2000
4000
6000
8000
10000
12000
14000
16000
18000
1980 1983 1986 1989 1992 1995 1998 2001 2004 2007
'000
tonn
es
SSEA Consumption SSEA Production

Grain Legumes Production, Consumption and Trade Trends in Developing Countries-An Assessment and Synthesis
ICRISAT - Socioeconomics Discussion Paper Series 84
Figure A. 12: Trends in soybean consumption and production in the developed world
Figure A. 13: Trends in groundnut consumption and production in Central and East Asia
0 10000 20000 30000 40000 50000 60000 70000 80000 90000
100000
1980 1983 1986 1989 1992 1995 1998 2001 2004 2007
'000
tonn
es
Consumption Production
0
2000
4000
6000
8000
10000
12000
1980 1983 1986 1989 1992 1995 1998 2001 2004 2007
'000
tonn
es
Consumption Production

Grain Legumes Production, Consumption and Trade Trends in Developing Countries-An Assessment and Synthesis
ICRISAT - Socioeconomics Discussion Paper Series 85
Figure A. 14: Trends in groundnut consumption and production in Latin America and Caribbean
Figure A. 15: Trends in groundnut consumption and production in Middle East and North Africa
0
100
200
300
400
500
600
700
800
900
1980 1983 1986 1989 1992 1995 1998 2001 2004 2007
'000
tonn
es
Consumption Production
0
200
400
600
800
1000
1200
1400
1980 1983 1986 1989 1992 1995 1998 2001 2004 2007
'000
tonn
es
Consumption Production

Grain Legumes Production, Consumption and Trade Trends in Developing Countries-An Assessment and Synthesis
ICRISAT - Socioeconomics Discussion Paper Series 86
Figure A. 16: Trends in groundnut consumption and production in sub-Saharan Africa
Figure A. 17: Trends in groundnut consumption and production in South and South East Asia
0
1000
2000
3000
4000
5000
6000
7000
1980 1983 1986 1989 1992 1995 1998 2001 2004 2007
'000
tonn
es
Consumption Production
0 1000 2000 3000 4000 5000 6000 7000 8000 9000
10000
1980 1983 1986 1989 1992 1995 1998 2001 2004 2007
'000
tonn
es
Consumption Production

Grain Legumes Production, Consumption and Trade Trends in Developing Countries-An Assessment and Synthesis
ICRISAT - Socioeconomics Discussion Paper Series 87
Figure A. 18: Trends in groundnut consumption and production in the developed world
0
500
1000
1500
2000
2500
1980 1983 1986 1989 1992 1995 1998 2001 2004 2007
'000
tonn
es
Consumption Production