Technical Appendix: A Socioeconomic Profile of Recreation ...

A Profile ofSocioeconomic Trends
Selected Geographies:
Sublette County, WY
Comparison Geographies:
Wyoming
Produced by Headwaters Economics'
Economic Profile System (EPS)https://headwaterseconomics.org/eps
April 15, 2021

Socioeconomic TrendsSublette County, WY
About the Economic Profile System (EPS)EPS is a free web tool created by Headwaters Economics to build customized socioeconomic reports of U.S. counties, states, andregions. Reports can be easily created to compare or aggregate different areas. EPS uses published statistics from federal datasources, including the U.S. Census Bureau, Bureau of Economic Analysis, and Bureau of Labor Statistics.
The Bureau of Land Management and Forest Service have made significant financial and intellectual contributions to the operationand content of EPS.
See https://headwaterseconomics.org/eps for more information about the capabilities of EPS. For technical questions, contact PattyHernandez Gude at [email protected] or telephone 406-599-7425.
headwaterseconomics.org
Headwaters Economics is an independent, nonprofit research group. Our mission is to improve community development and landmanagement decisions.
www.blm.gov
The Bureau of Land Management, an agency within the U.S. Department of Interior, administers 249.8 million acres of America'spublic lands, located primarily in western states. It is the mission of the Bureau of Land Management to sustain the health, diversity,and productivity of public lands for the use and enjoyment of present and future generations.
www.fs.fed.us
The Forest Service, an agency of the U.S. Department of Agriculture, administers national forests and grasslands encompassing193 million acres. The Forest Service’s mission is to sustain the health, diversity, and productivity of the nation’s forests andgrasslands to meet the needs of present and future generations.
Find more reports like this at headwaterseconomics.org/eps About EPS

Socioeconomic TrendsSublette County, WY
Table of Contents
TrendsOverview of Historical Trends 4Population 6Earnings Per Job and Per Capita Income 8Labor Earnings and Non-Labor Income 10
Industry SectorsEmployment by Industry (1970-2000) 12Employment by Industry (since 2000) 16Earnings by Industry (1970-2000) 20Earnings by Industry (since 2000) 24
PerformanceUnemployment 28Wages by Industry 30Proprietors (self-employed) 32Wages and Proprietors' Income 34Commuting Patterns 36Employment During National Recessions 38
Relative PerformanceComparisons 40
Data Sources & Methods 44Endnotes
Note to Users:This is one of 14 reports that can be created and downloaded from EPS. Topics include land use, demographics, specific industrysectors, the role of non-labor income, the wildland-urban interface, the role of amenities in economic development, and payments tocounty governments from federal lands. The EPS reports are downloadable as Excel or PDF documents. Seehttps://headwaterseconomics.org/eps.
Find more reports like this at headwaterseconomics.org/eps TOC

Socioeconomic TrendsSublette County, WY
Overview of Historical TrendsAccording to the U.S. Census Bureau, Sublette County, WY is designated as a Rural.
1970 2000 2019 Change2000-2019
Population 3,744 5,963 9,831 3,868Employment (full & part-time jobs) 2,027 3,947 6,642 2,695Personal Income (thousands of 2019 $s) 111,196 257,729 539,227 281,498Population and personal income are reported by place of residence, and employment by place of work on this page.
• From 1970 to 2019, populationgrew from 3,744 to 9,831 people,a 163% increase.
• From 1970 to 2019, employmentgrew from 2,027 to 6,642, a228% increase.
• From 1970 to 2019, personalincome grew from $111.2 millionto $539.2 million, (in real terms),a 385% increase.
Data Sources: U.S. Department of Commerce. 2020. Bureau of Economic Analysis, Regional Economic Accounts, Washington, D.C., reported byHeadwaters Economics’ Economic Profile System, headwaterseconomics.org/eps.
Find more reports like this at headwaterseconomics.org/eps Data and Graphics | Part 4
Population Trends, Sublette County, WY
1970
1972
1974
1976
1978
1980
1982
1984
1986
1988
1990
1992
1994
1996
1998
2000
2002
2004
2006
2008
2010
2012
2014
2016
2018
0
2,000
4,000
6,000
8,000
10,000
12,000
Employment Trends, Sublette County, WY
1970
1972
1974
1976
1978
1980
1982
1984
1986
1988
1990
1992
1994
1996
1998
2000
2002
2004
2006
2008
2010
2012
2014
2016
2018
01,0002,0003,0004,0005,0006,0007,0008,0009,000
Personal Income Trends, Sublette County, WY
1970
1972
1974
1976
1978
1980
1982
1984
1986
1988
1990
1992
1994
1996
1998
2000
2002
2004
2006
2008
2010
2012
2014
2016
2018
$0$100$200$300$400$500$600$700
Milli
ons
of 2
019$
s

Socioeconomic TrendsSublette County, WY
Overview of Historical Trends
What do we measure on this page?
This page describes trends in population, employment, and real personal income. If this report is for an individual county, it alsoshows the county classification (metropolitan, micropolitan, or rural).1
Population: The total number of people by place of residence.
Employment: All full- and part-time workers, wage and salary jobs (employees), and proprietors (the self-employed) reported byplace of work.
Personal Income: Income from wage and salary employment and proprietors' income (labor earnings), as well as non-labor income(dividends, interest, rent, and transfer payments) reported by place of residence. All income figures in this report are shown in realterms (i.e., adjusted for inflation). Subsequent sections of this report define labor earnings and non-labor income in more detail.
Metropolitan Statistical Areas: Counties that have at least one urbanized area of 50,000 or more people, plus adjacent territorythat has a high degree of social and economic integration with the core as measured by commuting ties. Metropolitan StatisticalAreas are classified as either Central or Outlying.
Micropolitan Statistical Areas: Counties that have at least one urbanized area of 10,000 to 50,000 people, plus adjacent territorythat has a high degree of social and economic integration with the core as measured by commuting ties. Micropolitan StatisticalAreas are classified as either Central or Outlying.
Rural: Counties that are not designated as either Metropolitan or Micropolitan.
Why is it important?
Long-term, steady growth of population, employment, and real personal income is generally an indication of a healthy, prosperouseconomy. Erratic growth, no-growth, or long-term decline in these indicators are generally an indication of a struggling economy.
Growth can benefit the general population of a place, especially by providing economic opportunities, but it can also stresscommunities and lead to income stratification. When considering the benefits of growth, it is important to distinguish betweenstandard of living (such as earnings per job and per capita income) and quality of life (such as leisure time, crime rate, and sense ofwell-being).
A related indicator of economic performance is whether the local economy is negatively affected by periods of national recession.This issue is explored in depth in the section "Employment During National Recessions" later in this report.
The size of a population and economy (metropolitan, micropolitan, or rural) can have an important bearing on economic activities aswell as opportunities and challenges for area businesses.
Study Guide | Part 5
Socioeconomic TrendsSublette County, WY
Population
Change 2000-2019
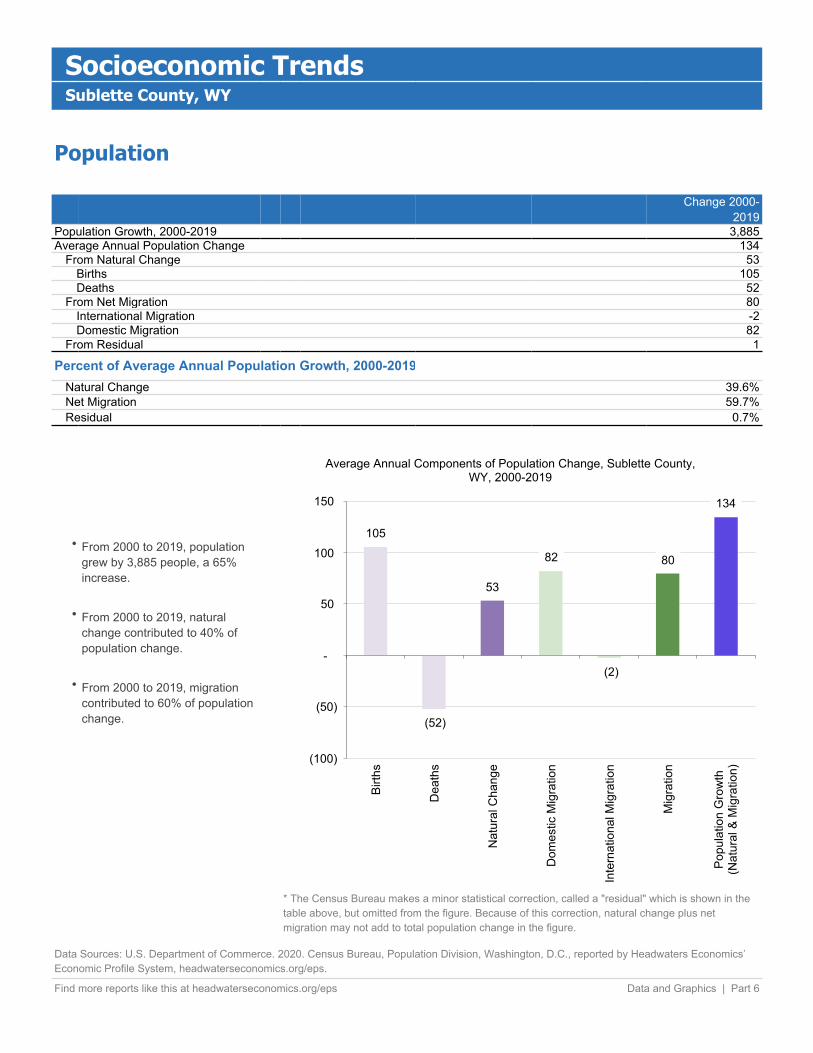
Population Growth, 2000-2019 3,885Average Annual Population Change 134
From Natural Change 53Births 105Deaths 52
From Net Migration 80International Migration -2Domestic Migration 82
From Residual 1
Percent of Average Annual Population Growth, 2000-2019Natural Change 39.6%Net Migration 59.7%Residual 0.7%
• From 2000 to 2019, populationgrew by 3,885 people, a 65%increase.
• From 2000 to 2019, naturalchange contributed to 40% ofpopulation change.
• From 2000 to 2019, migrationcontributed to 60% of populationchange.
* The Census Bureau makes a minor statistical correction, called a "residual" which is shown in thetable above, but omitted from the figure. Because of this correction, natural change plus netmigration may not add to total population change in the figure.
Data Sources: U.S. Department of Commerce. 2020. Census Bureau, Population Division, Washington, D.C., reported by Headwaters Economics’Economic Profile System, headwaterseconomics.org/eps.
Find more reports like this at headwaterseconomics.org/eps Data and Graphics | Part 6
105
(52)
53
82
(2)
80
134
Average Annual Components of Population Change, Sublette County,WY, 2000-2019
Birth
s
Dea
ths
Nat
ural
Cha
nge
Dom
estic
Mig
ratio
n
Inte
rnat
iona
l Mig
ratio
n
Mig
ratio
n
Popu
latio
n G
row
th(N
atur
al &
Mig
ratio
n)
(100)
(50)
-
50
100
150

Socioeconomic TrendsSublette County, WY
Population
What do we measure on this page?
This page describes components of population change and total population growth or decline. Total population growth (or decline)is the sum of natural change (births and deaths) and migration (international and domestic). Data are from the U.S. CensusBureau.2,3
The U.S. Census Bureau makes a minor statistical correction called a "residual." This is defined by the U.S. Census Bureau asresulting from two parts of the estimates process: 1) the application of national population controls to state and county populationestimates; and 2) “the incorporation of accepted challenges and special censuses into the population estimates.” The residualrepresents change in the population that cannot be attributed to any specific demographic component of population change.
For more detailed information about demographics for a given area, create an EPS Demographics report athttps://headwaterseconomics.org/eps.
Why is it important?
The components of population change offer insight into the causes of population growth or decline and they help highlight importantareas of inquiry. For example, if a large portion of population growth is attributable to in-migration, it would be helpful to understandwhat is driving this trend, such as whether people are moving to the area for jobs, quality of life, or both. Similarly, if a large portionof population decline is attributable to out-migration, it would be important to understand the reasons, such as the loss ofemployment in specific industries, youth leaving for education or new opportunities, or elderly people leaving for better medicalfacilities.
Study Guide | Part 7

Socioeconomic TrendsSublette County, WY
Earnings Per Job and Per Capita Income
1970 2000 2019 Change2000-2019
Average Earnings per Job (2019 $s) $45,597 $36,073 $52,568 $16,495Per Capita Income (2019 $s) $29,700 $43,221 $54,850 $11,629
Percent Change Percent Change2000-2019
Average Earnings per Job 45.7%Per Capita Income 26.9%
• From 1970 to 2019, averageearnings per job grew from$45,597 to $52,568 (in realterms), a 15% increase.
• From 1970 to 2019, per capitaincome grew from $29,700 to$54,850 (in real terms), a 85%increase.
Data Sources: U.S. Department of Commerce. 2020. Bureau of Economic Analysis, Regional Economic Accounts, Washington, D.C., reported byHeadwaters Economics’ Economic Profile System, headwaterseconomics.org/eps.
Find more reports like this at headwaterseconomics.org/eps Data and Graphics | Part 8
Average Earnings per Job & Per Capita Income, Sublette County, WY19
7019
7219
7419
7619
7819
8019
8219
8419
8619
8819
9019
9219
9419
9619
9820
0020
0220
0420
0620
0820
1020
1220
1420
1620
180
10,000
20,000
30,000
40,000
50,000
60,000
70,000
80,000
2019
$s
Average Earnings per Job Per Capita Income
Socioeconomic TrendsSublette County, WY
Earnings Per Job and Per Capita Income
What do we measure on this page?
This page describes how average earnings per job and per capita income (in real terms) have changed over time.
Average Earnings per Job: The compensation of the average job. It is total earnings divided by total employment. Full-time andpart-time jobs are counted at equal weight. Employees, sole proprietors, and active partners are included.
Per Capita Income: Income per person. It is total personal income (from labor and non-labor sources) divided by total population.
Why is it important?
Average earnings per job is an indicator of the quality of local employment. A higher average earnings per job indicates that thereare relatively more high-wage occupations. It can be useful to consider earnings against local cost of living indicators.4
Average earnings per job may decline for a number of reasons: 5, 6
1. more part-time and/or seasonal workers entering the workforce; 2. a rise in low-wage industries, such as tourism-related sectors; 3. a decline of high-wage industries, such as manufacturing; 4. more lower-paid workers entering the workforce; 5. the presence of a university that is increasing its enrollment of relatively low-wage students; 6. the in-migration of semi-retired workers who work part-time and/or seasonally; and 7. an influx of people who move to an area for quality of life rather than profit-maximizing reasons.
Per capita income is one of the most important measures of economic well-being. However, this measure can be misleading. Percapita income is total personal income divided by population. Because total personal income includes non-labor income sources(dividends, interest, rent and transfer payments), it is possible for per capita income to be relatively high due to the presence ofretirees and people with investment income.7 And because per capita income is calculated using total population and not the laborforce (as in average earnings per job), it is possible for per capita income to be relatively low in a population with a disproportionatenumber of children and/or elderly people.
Study Guide | Part 9
Socioeconomic TrendsSublette County, WY
Labor Earnings and Non-Labor Income
1970 2000 2019 Change2000-2019
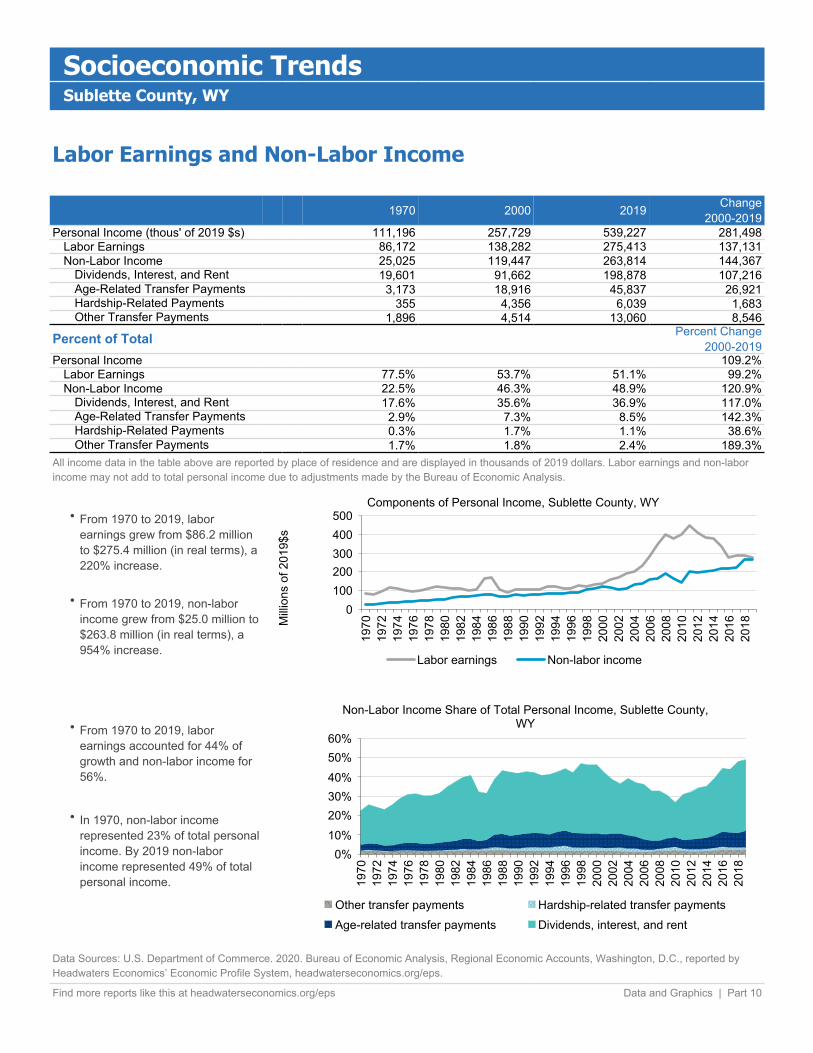
Personal Income (thous' of 2019 $s) 111,196 257,729 539,227 281,498Labor Earnings 86,172 138,282 275,413 137,131Non-Labor Income 25,025 119,447 263,814 144,367
Dividends, Interest, and Rent 19,601 91,662 198,878 107,216Age-Related Transfer Payments 3,173 18,916 45,837 26,921Hardship-Related Payments 355 4,356 6,039 1,683Other Transfer Payments 1,896 4,514 13,060 8,546
Percent of Total Percent Change2000-2019
Personal Income 109.2%Labor Earnings 77.5% 53.7% 51.1% 99.2%Non-Labor Income 22.5% 46.3% 48.9% 120.9%
Dividends, Interest, and Rent 17.6% 35.6% 36.9% 117.0%Age-Related Transfer Payments 2.9% 7.3% 8.5% 142.3%Hardship-Related Payments 0.3% 1.7% 1.1% 38.6%Other Transfer Payments 1.7% 1.8% 2.4% 189.3%
All income data in the table above are reported by place of residence and are displayed in thousands of 2019 dollars. Labor earnings and non-laborincome may not add to total personal income due to adjustments made by the Bureau of Economic Analysis.
• From 1970 to 2019, laborearnings grew from $86.2 millionto $275.4 million (in real terms), a220% increase.
• From 1970 to 2019, non-laborincome grew from $25.0 million to$263.8 million (in real terms), a954% increase.
• From 1970 to 2019, laborearnings accounted for 44% ofgrowth and non-labor income for56%.
• In 1970, non-labor incomerepresented 23% of total personalincome. By 2019 non-laborincome represented 49% of totalpersonal income.
Data Sources: U.S. Department of Commerce. 2020. Bureau of Economic Analysis, Regional Economic Accounts, Washington, D.C., reported byHeadwaters Economics’ Economic Profile System, headwaterseconomics.org/eps.
Find more reports like this at headwaterseconomics.org/eps Data and Graphics | Part 10
Components of Personal Income, Sublette County, WY
1970
1972
1974
1976
1978
1980
1982
1984
1986
1988
1990
1992
1994
1996
1998
2000
2002
2004
2006
2008
2010
2012
2014
2016
2018
0100200300400500
Milli
ons
of 2
019$
s
Labor earnings Non-labor income
Non-Labor Income Share of Total Personal Income, Sublette County,WY
1970
1972
1974
1976
1978
1980
1982
1984
1986
1988
1990
1992
1994
1996
1998
2000
2002
2004
2006
2008
2010
2012
2014
2016
2018
0%10%20%30%40%50%60%
Other transfer payments Hardship-related transfer paymentsAge-related transfer payments Dividends, interest, and rent
Socioeconomic TrendsSublette County, WY
Labor Earnings and Non-Labor Income
What do we measure on this page?
This page describes changes in labor earnings and non-labor sources of income.
Labor Earnings: Net earnings by place of residence, which is earnings by place of work (the sum of wage and salarydisbursements, supplements to wages and salaries, and proprietors' income) less contributions for government social insurance,plus an adjustment to convert earnings by place of work to a place of residence basis.
Non-Labor Income: Dividends, interest, rent, and transfer payments (includes government retirement and disability insurancebenefits, medical payments such as mainly Medicare and Medicaid, income maintenance benefits, unemployment insurancebenefits, etc.). Non-labor income is reported by place of residence.
Labor earnings and non-labor income may not add to total personal income because of adjustments made by the Bureau ofEconomic Analysis to account for contributions for Social Security, cross-county commuting, and other factors.
Dividends, Interest, and Rent: Personal dividend income, personal interest income, and rental income of persons with capitalconsumption adjustments. Dividends, interest, and rent are sometimes referred to as "investment income" or "property income."
Age-Related Transfer Payments: Payments, including Social Security and Medicare, associated with older populations.
Hardship-Related Transfer Payments: Payments associated with poverty and welfare, including Medicaid and incomemaintenance.
Other Transfer Payments: Payments from veteran's benefits, education and training, Workers Compensation insurance, railroadretirement and disability, other government retirement and disability, and other receipts of individuals and nonprofits.
The EPS Non-Labor report provides a more detailed analysis of non-labor income and its components. The EPS Demographicsreport provides more information about the aging of the population and poverty. See https://headwaterseconomics.org/eps.
Why is it important?
In many locations, non-labor income is the largest source of personal income and also the fastest growing.8 This is particularly thecase in some rural areas and small cities. An aging population, growth in the stock market and investments, and a highly mobilepopulation are some of the reasons behind the rapid growth in non-labor income.
Growth in non-labor income can indicate an attractive place to live and retire. The in-migration of people who bring investment andretirement income with them (verify from previous pages that in-migration is increasing) is associated with a high quality of life (forexample, local recreation opportunities), good health care facilities, and affordable housing (important for those on a fixed income).Non-labor income can also be important to places with struggling economies, either as a source of income maintenance for the pooror as a more stable form of income in areas with declining industries and labor markets.
Study Guide | Part 11

Socioeconomic TrendsSublette County, WY
Employment by Industry (1970-2000)
1970 1990 2000 Change1990-2000
Total Employment (number of jobs) 2,027 3,063 3,947 884Non-Services Related 793 ῀1,116 1,383 ῀267
Farm 448 402 420 18Agricultural services, forestry, fishing & other 17 83 129 46Mining (including fossil fuels) 132 318 323 5Construction 150 257 421 164Manufacturing (incl. forest products) 46 ῀56 90 ῀34
Services Related 876 ῀1,366 1,885 ῀519Transportation & public utilities 187 145 107 -38Wholesale trade 1 ῀42 55 ῀13Retail trade 326 404 593 189Finance, insurance & real estate 93 183 225 42Services 269 592 905 313
Government 358 558 679 121
Percent of Total Percent Change1990-2000
Total Employment 28.9%Non-Services Related 39.1% ῀36.4% 35.0% ῀23.9%
Farm 22.1% 13.1% 10.6% 4.5%Agricultural services, forestry, fishing & other 0.8% 2.7% 3.3% 55.4%Mining (including fossil fuels) 6.5% 10.4% 8.2% 1.6%Construction 7.4% 8.4% 10.7% 63.8%Manufacturing (incl. forest products) 2.3% ῀1.8% 2.3% ῀60.7%
Services Related 43.2% ῀44.6% 47.8% ῀38.0%Transportation & public utilities 9.2% 4.7% 2.7% -26.2%Wholesale trade 0.0% ῀1.4% 1.4% ῀31.0%Retail trade 16.1% 13.2% 15.0% 46.8%Finance, insurance & real estate 4.6% 6.0% 5.7% 23.0%Services 13.3% 19.3% 22.9% 52.9%
Government 17.7% 18.2% 17.2% 21.7%All employment data are reported by place of work. Estimates for data that were not disclosed are indicated with tildes (~).
• From 1970 to 2000, jobs in non-services related industries grewfrom 793 to 1,383, a 74%increase.
• From 1970 to 2000, jobs inservices related industries grewfrom 876 to 1,885, a 115%increase.
• From 1970 to 2000, jobs ingovernment grew from 358 to679, a 90% increase.
Data Sources: U.S. Department of Commerce. 2020. Bureau of Economic Analysis, Regional Economic Accounts, Washington, D.C., reported byHeadwaters Economics’ Economic Profile System, headwaterseconomics.org/eps.
Find more reports like this at headwaterseconomics.org/eps Data and Graphics | Part 12
Employment by Major Industry Category, Sublette County, WY
1970
1971
1972
1973
1974
1975
1976
1977
1978
1979
1980
1981
1982
1983
1984
1985
1986
1987
1988
1989
1990
1991
1992
1993
1994
1995
1996
1997
1998
1999
2000
0
500
1,000
1,500
2,000
2,500
Non-Services Related Services Related Government
Socioeconomic TrendsSublette County, WY
Employment by Industry (1970-2000)
What do we measure on this page?
This page describes historical employment change by industry. Industries are organized according to three major categories: non-services related, services related, and government. Employment includes wage and salary jobs and proprietors. The employmentdata are organized according to the Standard Industrial Classification (SIC) system and reported by place of work.
Non-Services Related: Employment in industries such as farming, mining, and manufacturing.
Services Related: Employment in industries such as retail trade, finance, insurance and real estate, and services.
The terms “non-services related” and “services related” are not terms used by the U.S. Department of Commerce. They are used inthese pages to help organize the information into easy-to-understand categories.
Government: Federal, military, state, and local government employment, and government enterprise.
The SIC data end in 2000 because in 2001 the Bureau of Economic Analysis switched to organizing industry-level informationaccording to the newer North American Industrial Classification System (NAICS). More recent employment trends, organized byNAICS, are shown in subsequent pages of this report.
It is not normally appropriate to put SIC and NAICS data in the same tables and graphs because of the difference in methods used toorganize industry data. The SIC coding system organizes industries by the primary activity of the establishment. In NAICS, industriesare organized according to the production process.9 See the Data Sources and Methods section of this report for more informationon the shift from SIC to NAICS.
Some data are withheld by the federal government to avoid the disclosure of potentially confidential information. HeadwatersEconomics uses supplemental data from the U.S. Department of Commerce to estimate these data gaps.10 These values areindicated with tildes (~).
Why is it important?
Understanding which industries are responsible for most jobs and which sectors are growing or declining is key to grasping the typeof economy that exists, how it has changed over time, and evolving competitive strengths.11,12 Most new jobs created in the U.S.economy in the last 30 years have been in services-related sectors, a category that includes a wide variety of high- and low-wageoccupations ranging from jobs in hotels and amusement parks to legal, health, business, and educational services. The section inthis report titled "Wages by Industry" shows the difference in wages among various services related industries and compared to non-services related sectors.
In many small rural communities, government employment (e.g., the Forest Service and Bureau of Land Management) represents animportant component of the economy. In others there have been important changes in employment in mining and fossil fuel energydevelopment, manufacturing (which includes lumber and wood products), and construction.13,14
Find more reports like this at headwaterseconomics.org/eps Study Guide | Part 13

Socioeconomic TrendsSublette County, WY
Employment by Industry (1970-2000)
Employment by Industry, Sublette County, WY
• In 2000 the three industrysectors with the largest numberof jobs were services (905 jobs),government (679 jobs), and retailtrade (593 jobs).
• From 1970 to 2000, the threeindustry sectors that added themost new jobs were services(636 new jobs), government (321new jobs), and retail trade (267new jobs).
Data Sources: U.S. Department of Commerce. 2020. Bureau of Economic Analysis, Regional Economic Accounts, Washington, D.C., reported byHeadwaters Economics’ Economic Profile System, headwaterseconomics.org/eps.
Find more reports like this at headwaterseconomics.org/eps Data and Graphics | Part 14
1970
1971
1972
1973
1974
1975
1976
1977
1978
1979
1980
1981
1982
1983
1984
1985
1986
1987
1988
1989
1990
1991
1992
1993
1994
1995
1996
1997
1998
1999
2000
0
100
200
300
400
500
600
700
800
900
1,000
Farm Ag. ServicesMining ConstructionManufacturing Trans. & Public UtilitiesWholesale Trade Retail TradeFinance, Ins., Real Estate ServicesGovernment

Socioeconomic TrendsSublette County, WY
Employment by Industry (1970-2000)
What do we measure on this page?
This page describes historical employment change by industry. Industries are organized according to three major categories: non-services related, services related, and government. Employment includes wage and salary jobs and proprietors. The employmentdata are organized according to the Standard Industrial Classification (SIC) system and reported by place of work.
Non-Services Related: Employment in industries such as farming, mining, and manufacturing.
Services Related: Employment in industries such as retail trade, finance, insurance and real estate, and services.
The terms “non-services related” and “services related” are not terms used by the U.S. Department of Commerce. They are used inthese pages to help organize the information into easy-to-understand categories.
Government: Federal, military, state, and local government employment, and government enterprise.
The SIC data end in 2000 because in 2001 the Bureau of Economic Analysis switched to organizing industry-level informationaccording to the newer North American Industrial Classification System (NAICS). More recent employment trends, organized byNAICS, are shown in subsequent pages of this report.
It is not normally appropriate to put SIC and NAICS data in the same tables and graphs because of the difference in methods usedto organize industry data. The SIC coding system organizes industries by the primary activity of the establishment. In NAICS,industries are organized according to the production process.9 See the Data Sources and Methods section of this report for moreinformation on the shift from SIC to NAICS.
Some data are withheld by the federal government to avoid the disclosure of potentially confidential information. HeadwatersEconomics uses supplemental data from the U.S. Department of Commerce to estimate these data gaps.10 These values areindicated with tildes (~).
Why is it important?
Understanding which industries are responsible for most jobs and which sectors are growing or declining is key to grasping the typeof economy that exists, how it has changed over time, and evolving competitive strengths.11,12 Most new jobs created in the U.S.economy in the last 30 years have been in services-related sectors, a category that includes a wide variety of high- and low-wageoccupations ranging from jobs in hotels and amusement parks to legal, health, business, and educational services. The section inthis report titled "Wages by Industry" shows the difference in wages among various services related industries and compared to non-services related sectors.
In many small rural communities, government employment (e.g., the Forest Service and Bureau of Land Management) representsan important component of the economy. In others there have been important changes in employment in mining and fossil fuelenergy development, manufacturing (which includes lumber and wood products), and construction.13,14
Study Guide | Part 15

Socioeconomic TrendsSublette County, WY
Employment by Industry (since 2000)
2001 2010 2019 Change2010-2019
Total Employment (number of jobs) 4,203 8,157 6,642 -1,515Non-services related ῀1,400 3,605 ῀2,281 -῀1,324
Farm 410 428 474 46Forestry, fishing, & ag. services 81 118 ῀111 -῀7Mining (including fossil fuels) 430 1,907 942 -965Construction 467 1,070 657 -413Manufacturing ῀12 82 97 15
Services related ῀1,902 ῀3,152 ῀2,875 -῀277Utilities na 36 ῀25 -῀11Wholesale trade ῀39 72 ῀16 -῀56Retail trade 427 534 532 -2Transportation and warehousing 85 339 223 -116Information 45 45 24 -21Finance and insurance 75 127 156 29Real estate and rental and leasing 173 431 508 77Professional and technical services 224 328 309 -19Management of companies ῀6 ῀12 ῀14 ῀2Administrative and waste services ῀158 ῀292 ῀241 -῀51Educational services na na na naHealth care and social assistance na na na naArts, entertainment, and recreation 85 113 160 47Accommodation and food services 385 526 373 -153Other services, except public admin. 200 297 294 -3
Government 704 1,122 1,094 -28All employment data are reported by place of work. Estimates for data that were not disclosed are indicated with tildes (~).
• From 2001 to 2019, jobs in non-services related industries grewfrom 1,400 to 2,281, a 63%increase.
• From 2001 to 2019, jobs inservices related industries grewfrom 1,902 to 2,875, a 51%increase.
• From 2001 to 2019, jobs ingovernment grew from 704 to1,094, a 55% increase.
Data Sources: U.S. Department of Commerce. 2020. Bureau of Economic Analysis, Regional Economic Accounts, Washington, D.C., reported byHeadwaters Economics’ Economic Profile System, headwaterseconomics.org/eps.
Find more reports like this at headwaterseconomics.org/eps Data and Graphics | Part 16
Employment by Major Industry Category, Sublette County, WY
2001
2002
2003
2004
2005
2006
2007
2008
2009
2010
2011
2012
2013
2014
2015
2016
2017
2018
2019
0
500
1,000
1,500
2,000
2,500
3,000
3,500
4,000
Non-Services Related Services Related Government

Socioeconomic TrendsSublette County, WY
Employment by Industry (since 2000)
What do we measure on this page?
This page describes recent employment change by industry. Industries are organized according to three major categories: non-services related, services related, and government. Employment includes wage and salary jobs and proprietors. The employmentdata are organized according to the North American Industrial Classification System (NAICS) and reported by place of work.
Non-Services Related: Employment in industries such as farming, mining, and manufacturing.
Services Related: Employment in industries such as retail trade, finance, insurance and real estate, and services.
The terms “non-services related” and “services related” are not terms used by the U.S. Department of Commerce. They are used inthese pages to help organize the information into easy-to-understand categories.
Government: Federal, military, state, and local government employment, and government enterprise.
In 2001, the Bureau of Economic Analysis (BEA) began organizing industry-level information according to the newer North AmericanIndustrial Classification System (NAICS). The NAICS method provides greater detail to describe changes in the services relatedsectors. Prior to 2001, BEA used data organized according to the Standard Industrial Classification (SIC) system.
It is not normally appropriate to put SIC and NAICS data in the same tables and graphs because of the difference in methods used toorganize industry data. The SIC coding system organizes industries by the primary activity of the establishment. In NAICS, industriesare organized according to the production process.9 See the Data Sources and Methods section of this report for more information onthe shift from SIC to NAICS.
Some data are withheld by the federal government to avoid the disclosure of potentially confidential information. HeadwatersEconomics uses supplemental data from the U.S. Department of Commerce to estimate these data gaps.10 These values areindicated with tildes (~).
Why is it important?
Recent employment trends organized by NAICS offer more detail than the previous SIC system, particularly with regard to services-related industries. This is especially useful since in many places the majority of new job growth in recent years has been in services-related industries.
The services-related sector encompasses a wide variety of high- and low-wage occupations ranging from jobs in accommodation andfood services to professional and technical services. The section in this report titled "Wages by Industry" shows the difference inwages among various services related industries and compared to non-services related sectors.
Find more reports like this at headwaterseconomics.org/eps Study Guide | Part 17

Socioeconomic TrendsSublette County, WY
Employment by Industry (since 2000)
Employment by Industry, Sublette County, WY
• In 2019 the three industrysectors with the largest numberof jobs were government (1,094jobs), construction (657 jobs),and real estate and rental andleasing (508 jobs).
• From 2001 to 2019, the threeindustry sectors that added themost new jobs were mining(including fossil fuels) (512 newjobs), real estate and rental andleasing (335 new jobs), andtransportation and warehousing(138 new jobs).
Data Sources: U.S. Department of Commerce. 2020. Bureau of Economic Analysis, Regional Economic Accounts, Washington, D.C., reported byHeadwaters Economics’ Economic Profile System, headwaterseconomics.org/eps.
Find more reports like this at headwaterseconomics.org/eps Data and Graphics | Part 18
2001
2002
2003
2004
2005
2006
2007
2008
2009
2010
2011
2012
2013
2014
2015
2016
2017
2018
2019
0
500
1,000
1,500
2,000
2,500
Farm Forestry, Fishing, & Ag. ServicesMining (incl. fossil fuels) UtilitiesConstruction Mfg. (incl. forest products)Wholesale Trade Retail TradeTransportation & Warehousing InformationFinance & Insurance Real estate, rental, & leasingProfessional, scientific, & technical Mgmt. of CompaniesAdmin., Waste Services Educational ServicesHealth Care & Social Assist. Arts, Entertainment, & RecreationAccommodation & Food Other ServicesGovernment
Socioeconomic TrendsSublette County, WY
Employment by Industry (since 2000)
What do we measure on this page?
This page describes recent employment change by industry. Industries are organized according to three major categories: non-services related, services related, and government. Employment includes wage and salary jobs and proprietors. The employmentdata are organized according to the North American Industrial Classification System (NAICS) and reported by place of work.
Non-Services Related: Employment in industries such as farming, mining, and manufacturing.
Services Related: Employment in industries such as retail trade, finance, insurance and real estate, and services.
The terms “non-services related” and “services related” are not terms used by the U.S. Department of Commerce. They are used inthese pages to help organize the information into easy-to-understand categories.
Government: Federal, military, state, and local government employment, and government enterprise.
In 2001, the Bureau of Economic Analysis (BEA) began organizing industry-level information according to the newer NorthAmerican Industrial Classification System (NAICS). The NAICS method provides greater detail to describe changes in the servicesrelated sectors. Prior to 2001, BEA used data organized according to the Standard Industrial Classification (SIC) system.
It is not normally appropriate to put SIC and NAICS data in the same tables and graphs because of the difference in methods usedto organize industry data. The SIC coding system organizes industries by the primary activity of the establishment. In NAICS,industries are organized according to the production process.9 See the Data Sources and Methods section of this report for moreinformation on the shift from SIC to NAICS.
Some data are withheld by the federal government to avoid the disclosure of potentially confidential information. HeadwatersEconomics uses supplemental data from the U.S. Department of Commerce to estimate these data gaps.10 These values areindicated with tildes (~).
Why is it important?
Recent employment trends organized by NAICS offer more detail than the previous SIC system, particularly with regard to services-related industries. This is especially useful since in many places the majority of new job growth in recent years has been in services-related industries.
The services-related sector encompasses a wide variety of high- and low-wage occupations ranging from jobs in accommodationand food services to professional and technical services. The section in this report titled "Wages by Industry" shows the differencein wages among various services related industries and compared to non-services related sectors.
Study Guide | Part 19

Socioeconomic TrendsSublette County, WY
Earnings by Industry (1970-2000)Labor earnings in thousands of 2019 $s
1970 1990 2000 Change1990-2000
Labor Earnings $92,424 $112,704 $142,379 $29,675Non-Services Related $45,712 ῀$49,052 $54,152 ῀$5,100
Farm $21,141 $12,133 $4,415 -$7,718Agricultural services, forestry, fishing $579 $1,137 $1,317 $180Mining (including fossil fuels) $8,879 $22,954 $23,649 $695Construction $13,427 $11,576 $23,041 $11,465Manufacturing (incl. forest products) $1,685 ῀$1,252 $1,730 ῀$478
Services Related $31,752 ῀$36,778 $55,333 ῀$18,555Transportation & public utilities $11,578 $8,785 $5,579 -$3,206Wholesale trade $66 ῀$912 $1,519 ῀$607Retail trade $9,893 $9,084 $13,175 $4,091Finance, insurance & real estate $1,922 $2,135 $6,497 $4,362Services $8,293 $15,861 $28,562 $12,701
Government $14,961 $25,067 $32,894 $7,827
Percent of Total* Percent Change1990-2000
Labor Earnings 26.3%Non-Services Related 49.5% ῀44.2% 38.0% ῀10.4%
Farm 22.9% 10.9% 3.1% -63.6%Agricultural services, forestry, fishing 0.6% 1.0% 0.9% 15.8%Mining (including fossil fuels) 9.6% 20.7% 16.6% 3.0%Construction 14.5% 10.4% 16.2% 99.0%Manufacturing (incl. forest products) 1.8% ῀1.1% 1.2% ῀38.2%
Services Related 34.4% ῀33.2% 38.9% ῀50.5%Transportation & public utilities 12.5% 7.9% 3.9% -36.5%Wholesale trade 0.1% ῀0.8% 1.1% ῀66.6%Retail trade 10.7% 8.2% 9.3% 45.0%Finance, insurance & real estate 2.1% 1.9% 4.6% 204.3%Services 9.0% 14.3% 20.1% 80.1%
Government 16.2% 22.6% 23.1% 31.2%All earnings data are reported by place of work. Estimates for data that were not disclosed are indicated with tildes (~).* Total is considered to be the sum of all reported or estimated income with positive values from the earnings by industry table.
• From 1970 to 2000, earningsfrom non-services grew from$45.7M to $54.2M (in realterms), a 18% increase.
• From 1970 to 2000, earningsfrom services grew from $31.8Mto $55.3M (in real terms), a 74%increase.
• From 1970 to 2000, earningsfrom government grew from$15.0M to $32.9M (in realterms), a 120% increase.
Data Sources: U.S. Department of Commerce. 2020. Bureau of Economic Analysis, Regional Economic Accounts, Washington, D.C., reported byHeadwaters Economics’ Economic Profile System, headwaterseconomics.org/eps.
Find more reports like this at headwaterseconomics.org/eps Data and Graphics | Part 20
Earnings by Major Industry Category, Sublette County, WY
1970
1971
1972
1973
1974
1975
1976
1977
1978
1979
1980
1981
1982
1983
1984
1985
1986
1987
1988
1989
1990
1991
1992
1993
1994
1995
1996
1997
1998
1999
2000
0
20
40
60
80
100
120
Milli
ons
of 2
019
$s
Non-Services Related Services Related Government
Socioeconomic TrendsSublette County, WY
Employment by Industry (1970-2000)
What do we measure on this page?
This page describes historical change in earnings by industry (in real terms). Industries are organized according to three majorcategories: non-services related, services related, and government. The labor earnings data are organized according to the StandardIndustrial Classification (SIC) system and reported by place of work.
Non-Services Related: Employment in industries such as farming, mining, and manufacturing.
Services Related: Employment in industries such as retail trade, finance, insurance and real estate, and services.
The terms “non-services related” and “services related” are not terms used by the U.S. Department of Commerce. They are used inthese pages to help organize the information into easy-to-understand categories.
Government: Federal, military, state, and local government employment, and government enterprise.
The SIC data end in 2000 because in 2001 the Bureau of Economic Analysis switched to organizing industry-level informationaccording to the newer North American Industrial Classification System (NAICS). More recent personal income trends, organized byNAICS, are shown in subsequent pages of this report.
It is not normally appropriate to put SIC and NAICS data in the same tables and graphs because of the difference in methods used toorganize industry data. The SIC coding system organizes industries by the primary activity of the establishment. In NAICS industriesare organized according to the production process.9 See the Data Sources and Methods section of this report for more informationon the shift from SIC to NAICS.
Some data are withheld by the federal government to avoid the disclosure of potentially confidential information. HeadwatersEconomics uses supplemental data from the U.S. Department of Commerce to estimate these data gaps.10 These values areindicated with tildes (~).
Why is it important?
Historical changes in labor earnings by industry show how the structure of the local economy has changed over time. Some of thetrends are caused by national and international circumstances while other trends may reflect local conditions. The shifting sources oflabor earnings can point to evolving weaknesses and strengths in the local or regional economy.
Most new jobs created in the U.S. economy in the last several decades have been in services-related sectors, a category thatincludes a wide variety of high- and low-wage occupations ranging from jobs in hotels and amusement parks to legal, health,business, and educational services. The section in this report titled "Wages by Industry" shows the difference in wages amongvarious services related industries and compared to non-services related sectors.
In many communities there have been important changes in employment in non-services, particularly mining and fossil fuel energydevelopment, manufacturing (which includes lumber and wood products), and construction.13
In rural communities, government employment (e.g., the Forest Service and Bureau of Land Management) often represents animportant component of the economy.
Find more reports like this at headwaterseconomics.org/eps Study Guide | Part 21

Socioeconomic TrendsSublette County, WY
Earnings by Industry (1970-2000)
• In 2000 the three industrysectors with the largest earningswere government ($32.9 million),services ($28.6 million), andretail trade ($13.2 million).
• From 1970 to 2000, the threeindustry sectors that added themost earnings were services($20.3 million), government($17.9 million), and finance,insurance & real estate ($4.6million).
Data Sources: U.S. Department of Commerce. 2020. Bureau of Economic Analysis, Regional Economic Accounts, Washington, D.C., reported byHeadwaters Economics’ Economic Profile System, headwaterseconomics.org/eps.
Find more reports like this at headwaterseconomics.org/eps Data and Graphics | Part 22
Earnings by Industry, Sublette County, WY
1970
1971
1972
1973
1974
1975
1976
1977
1978
1979
1980
1981
1982
1983
1984
1985
1986
1987
1988
1989
1990
1991
1992
1993
1994
1995
1996
1997
1998
1999
2000
0
10
20
30
40
50
60
70
80
Milli
ons
of 2
019
$s
Farm Ag. ServicesMining ConstructionManufacturing Trans. & Public UtilitiesWholesale Trade Retail TradeFinance, Ins., Real Estate ServicesGovernment

Socioeconomic TrendsSublette County, WY
Earnings by Industry (1970-2000)
What do we measure on this page?
This page describes historical change in earnings by industry (in real terms). Industries are organized according to three majorcategories: non-services related, services related, and government. The labor earnings data are organized according to theStandard Industrial Classification (SIC) system and reported by place of work.
Non-Services Related: Employment in industries such as farming, mining, and manufacturing.
Services Related: Employment in industries such as retail trade, finance, insurance and real estate, and services.
The terms “non-services related” and “services related” are not terms used by the U.S. Department of Commerce. They are used inthese pages to help organize the information into easy-to-understand categories.
Government: Federal, military, state, and local government employment, and government enterprise.
The SIC data end in 2000 because in 2001 the Bureau of Economic Analysis switched to organizing industry-level informationaccording to the newer North American Industrial Classification System (NAICS). More recent personal income trends, organized byNAICS, are shown in subsequent pages of this report.
It is not normally appropriate to put SIC and NAICS data in the same tables and graphs because of the difference in methods usedto organize industry data. The SIC coding system organizes industries by the primary activity of the establishment. In NAICSindustries are organized according to the production process.9 See the Data Sources and Methods section of this report for moreinformation on the shift from SIC to NAICS.
Some data are withheld by the federal government to avoid the disclosure of potentially confidential information. HeadwatersEconomics uses supplemental data from the U.S. Department of Commerce to estimate these data gaps.10 These values areindicated with tildes (~).
Why is it important?
Historical changes in labor earnings by industry show how the structure of the local economy has changed over time. Some of thetrends are caused by national and international circumstances while other trends may reflect local conditions. The shifting sourcesof labor earnings can point to evolving weaknesses and strengths in the local or regional economy.
Most new jobs created in the U.S. economy in the last several decades have been in services-related sectors, a category thatincludes a wide variety of high- and low-wage occupations ranging from jobs in hotels and amusement parks to legal, health,business, and educational services. The section in this report titled "Wages by Industry" shows the difference in wages amongvarious services related industries and compared to non-services related sectors.
In many communities there have been important changes in employment in non-services, particularly mining and fossil fuel energydevelopment, manufacturing (which includes lumber and wood products), and construction.13
In rural communities, government employment (e.g., the Forest Service and Bureau of Land Management) often represents animportant component of the economy.
Study Guide | Part 23

Socioeconomic TrendsSublette County, WY
Earnings by Industry (since 2000)Labor earnings in thousands of 2019 $s
2001 2010 2019 Change2010-2019
Labor Earnings $166,176 $567,523 $349,156 -$218,367Non-services related ῀$66,896 $325,964 ῀$166,603 -῀$159,361
Farm $5,672 $1,259 $16,823 $15,564Forestry, fishing, & ag. services $1,030 $3,268 ῀$1,491 -῀$1,777Mining (including fossil fuels) $32,387 $237,627 $109,343 -$128,284Construction $25,147 $80,881 $35,023 -$45,858Manufacturing ῀$2,660 $2,930 $3,923 $993
Services related ῀$64,658 ῀$155,301 ῀$96,181 -῀$59,120Utilities na $4,136 ῀$1,994 -῀$2,142Wholesale trade ῀$2,128 $5,532 ῀$2,925 -῀$2,607Retail trade $19,295 $19,052 $15,193 -$3,859Transportation and warehousing $5,181 $35,881 $17,652 -$18,229Information $1,788 $2,972 $1,814 -$1,158Finance and insurance $3,272 $8,215 $5,326 -$2,889Real estate and rental and leasing $3,590 $4,960 $10,364 $5,404Professional and technical services $7,912 $25,212 $12,647 -$12,565Management of companies ῀$1,136 ῀$4,470 ῀$1,521 -῀$2,949Administrative and waste services ῀$6,468 ῀$13,807 ῀$9,655 -῀$4,152Educational services na na na naHealth care and social assistance na na na naArts, entertainment, and recreation $1,331 $2,210 $1,331 -$879Accommodation and food services $7,832 $17,326 $8,077 -$9,249Other services, except public admin. $4,725 $11,528 $7,682 -$3,846
Government $35,987 $83,015 $80,127 -$2,888All earnings data are reported by place of work. Estimates for data that were not disclosed are indicated with tildes (~).* Total is considered to be the sum of all reported or estimated income with positive values from the earnings by industry table.
• From 2001 to 2019, earnings innon-services related industriesgrew from $66.9 million to$166.6 million, a 149% increase.
• From 2001 to 2019, earnings inservices related industries grewfrom $64.7 million to $96.2million, a 49% increase.
• From 2001 to 2019, earnings ingovernment grew from $36.0million to $80.1 million, a 123%increase.
Data Sources: U.S. Department of Commerce. 2020. Bureau of Economic Analysis, Regional Economic Accounts, Washington, D.C., reported byHeadwaters Economics’ Economic Profile System, headwaterseconomics.org/eps.
Find more reports like this at headwaterseconomics.org/eps Data and Graphics | Part 24
Earnings by Major Industry Category, Sublette County, WY
2001
2002
2003
2004
2005
2006
2007
2008
2009
2010
2011
2012
2013
2014
2015
2016
2017
2018
2019
0
50
100
150
200
250
300
350
400
Milli
ons
of 2
019
$s
Non-Services Related Services Related Government

Socioeconomic TrendsSublette County, WY
Earnings by Industry (since 2000)
What do we measure on this page?
This page describes recent change in earnings (in real terms). Industries are organized according to three major categories: non-services related, services related, and government. The personal income data are organized according to the North AmericanIndustrial Classification System (NAICS) and reported by place of work.
Services Related: Employment in industries such as retail trade, finance, insurance and real estate, and services.
Non-Services Related: Employment in industries such as farming, mining, and manufacturing.
The terms “non-services related” and “services related” are not terms used by the U.S. Department of Commerce. They are used inthese pages to help organize the information into easy-to-understand categories.
Government: Federal, military, state, and local government employment, and government enterprise.
In 2001, the Bureau of Economic Analysis (BEA) switched to organizing industry-level information according to the newer NorthAmerican Industrial Classification System (NAICS). The NAICS method provides greater detail to describe changes in the services-related sectors. Prior to 2001, BEA used data organized according to the Standard Industrial Classification (SIC) system.9
It is not normally appropriate to put SIC and NAICS data in the same tables and graphs because of the difference in methods used toorganize industry data. The SIC coding system organizes industries by the primary activity of the establishment. In NAICS, industriesare organized according to the production process. (See the Data Sources and Methods section of this report for more information onthe shift from SIC to NAICS.)
Some data are withheld by the federal government to avoid the disclosure of potentially confidential information. HeadwatersEconomics uses supplemental data from the U.S. Department of Commerce to estimate these data gaps.10 These values areindicated with tildes (~).
Why is it important?
It can be useful to ask whether the historical employment trends shown earlier in this report continue, and what factors are driving ashift in industry makeup and competitive position.
In many places the majority of growth in earnings in recent years has been in services-related industries, which include a wide varietyof high- and low-wage occupations ranging from jobs in hotels and amusement parks to legal, health, business, and educationalservices. The section in this report titled "Wages by Industry" shows the difference in wages among various services relatedindustries and compared to non-services related sectors.
Find more reports like this at headwaterseconomics.org/eps Study Guide | Part 25

Socioeconomic TrendsSublette County, WY
Earnings by Industry (since 2000)
• In 2019 the three industrysectors with the largestearnings were mining(including fossil fuels) ($109.3million), construction ($35.0million), and farm ($16.8million).
• From 2001 to 2019, the threeindustry sectors that addedthe most earnings weremining (including fossil fuels)($77.0 million), transportationand warehousing ($12.5million), and construction($9.9 million).
Data Sources: U.S. Department of Commerce. 2020. Bureau of Economic Analysis, Regional Economic Accounts, Washington, D.C., reported byHeadwaters Economics’ Economic Profile System, headwaterseconomics.org/eps.
Find more reports like this at headwaterseconomics.org/eps Data and Graphics | Part 26
Earnings by Industry, Sublette County, WY
2001
2002
2003
2004
2005
2006
2007
2008
2009
2010
2011
2012
2013
2014
2015
2016
2017
2018
2019
-50
0
50
100
150
200
250
300
350M
illion
s of
201
9 $s
Farm Forestry, Fishing, & Ag. Services
Mining (incl. fossil fuels) Utilities
Construction Mfg. (incl. forest products)
Wholesale Trade Retail Trade
Transportation & Warehousing Information
Finance & Insurance Real estate, rental, & leasing
Professional, scientific, & technical Mgmt. of Companies
Admin., Waste Services Educational Services
Health Care & Social Assist. Arts, Entertainment, & Recreation
Accommodation & Food Other Services
Government

Socioeconomic TrendsSublette County, WY
Earnings by Industry (since 2000)
What do we measure on this page?
This page describes recent change in earnings (in real terms). Industries are organized according to three major categories: non-services related, services related, and government. The personal income data are organized according to the North AmericanIndustrial Classification System (NAICS) and reported by place of work.
Services Related: Employment in industries such as retail trade, finance, insurance and real estate, and services.
Non-Services Related: Employment in industries such as farming, mining, and manufacturing.
The terms “non-services related” and “services related” are not terms used by the U.S. Department of Commerce. They are used inthese pages to help organize the information into easy-to-understand categories.
Government: Federal, military, state, and local government employment, and government enterprise.
In 2001, the Bureau of Economic Analysis (BEA) switched to organizing industry-level information according to the newer NorthAmerican Industrial Classification System (NAICS). The NAICS method provides greater detail to describe changes in the services-related sectors. Prior to 2001, BEA used data organized according to the Standard Industrial Classification (SIC) system.9
It is not normally appropriate to put SIC and NAICS data in the same tables and graphs because of the difference in methods usedto organize industry data. The SIC coding system organizes industries by the primary activity of the establishment. In NAICS,industries are organized according to the production process. (See the Data Sources and Methods section of this report for moreinformation on the shift from SIC to NAICS.)
Some data are withheld by the federal government to avoid the disclosure of potentially confidential information. HeadwatersEconomics uses supplemental data from the U.S. Department of Commerce to estimate these data gaps.10 These values areindicated with tildes (~).
Why is it important?
It can be useful to ask whether the historical employment trends shown earlier in this report continue, and what factors are driving ashift in industry makeup and competitive position.
In many places the majority of growth in earnings in recent years has been in services-related industries, which include a widevariety of high- and low-wage occupations ranging from jobs in hotels and amusement parks to legal, health, business, andeducational services. The section in this report titled "Wages by Industry" shows the difference in wages among various servicesrelated industries and compared to non-services related sectors.
Study Guide | Part 27

Socioeconomic TrendsSublette County, WY
Unemployment
1990 2000 2010 2019 Change2010-2019
Average AnnualUnemployment Rate 2.7% 3.0% 5.9% 4.4% -1.5%
• Since 1990, the annualunemployment rate ranged froma low of 1.5% in 2007 to a highof 11.7% in 1987.
Monthly Unemployment Rate Jan. Feb. March April May June July Aug. Sept. Oct. Nov. Dec.
2016 7.3% 7.4% 8.4% 8.1% 7.0% 6.1% 5.8% 5.4% 5.4% 5.3% 5.5% 6.0%2017 6.4% 5.9% 5.6% 4.8% 4.4% 4.1% 3.7% 3.5% 3.7% 3.7% 4.1% 4.1%2018 5.0% 4.6% 4.6% 4.1% 4.0% 3.9% 3.6% 3.6% 3.7% 3.8% 4.0% 4.5%2019 5.1% 4.9% 4.9% 4.0% 4.0% 4.2% 3.9% 3.8% 3.8% 4.5% 4.9% 5.0%2020 5.9% 6.1% 6.5% 11.4% 9.8% 8.4% 7.5%
• The most recent monthly data ispreliminary in the table and thechart; as reported by BLS.
• The lowest monthlyunemployment rate was Aug of2017. The highest monthlyunemployment rate was April of2020.
Data Sources: U.S. Department of Labor. 2020. Bureau of Labor Statistics, Local Area Unemployment Statistics, Washington, D.C., reported byHeadwaters Economics’ Economic Profile System, headwaterseconomics.org/eps.
Find more reports like this at headwaterseconomics.org/eps Data and Graphics | Part 28
Monthly Unemployment Rate, Sublette County, WY
Jan Feb March April May June July Aug Sept Oct Nov Dec0.0%
2.0%
4.0%
6.0%
8.0%
10.0%
12.0%
2016 2017 2018 2019 2020
Average Annual Unemployment Rate, Sublette County, WY
1990
1991
1992
1993
1994
1995
1996
1997
1998
1999
2000
2001
2002
2003
2004
2005
2006
2007
2008
2009
2010
2011
2012
2013
2014
2015
2016
2017
2018
2019
0.0%
1.0%
2.0%
3.0%
4.0%
5.0%
6.0%
7.0%

Socioeconomic TrendsSublette County, WY
Unemployment
What do we measure on this page?
This page describes the average annual unemployment rate and the seasonality of the unemployment rate over time.
The Average Annual Unemployment Rate graph shows the rate of unemployment since 1990. The Monthly Unemployment Rategraph shows the rate of unemployment for each month over the last five years. Note that unemployment figures most often reportedare seasonally adjusted.15 However, the monthly unemployment data shown on this page are not seasonally adjusted so thatfluctuations in employment throughout the year can be displayed.
Unemployment Rate: The number of people who are jobless, looking for jobs, and available for work, divided by the labor force.16
Data begin in 1990 because prior to 1990 the Bureau of Labor Statistics used a different method to calculate the unemploymentrate.
Why is it important?
The rate of unemployment is an important indicator of economic well-being. This figure can go up during national recessions and/ormore localized downturns. Unemployment may vary significantly by season.
It is important to know how the unemployment rate has changed over time, whether the rate is higher or lower during certain periodsof the year, and whether this seasonality of unemployment has changed over time. Places that are heavily dependent on thetourism industry, for example, may show higher rates of unemployment during spring and fall "shoulder seasons." Places that relyheavily on the construction industry, for example, may have lower unemployment rates during the non-winter months.17
Communities with diverse economies tend to have more stable unemployment rates. This is particularly true of places that are ableto attract new residents, retain manufacturing, and support a high-tech economy.18
Public land agencies sometimes provide seasonal employment and may have an effect on the local rate of unemployment.
Study Guide | Part 29

Socioeconomic TrendsSublette County, WY
Wages by Industry
Employment and Wages in 2019 Wage & SalaryEmployment
% of TotalEmployment
Avg. AnnualWages (2019 $s)
% Above orBelow Avg.
Total 3,974 $56,200Private 2,944 74.1% $58,633 4.3%
Non-Services Related 1,368 34.4% $80,807 43.8%Natural Resources and Mining 914 23.0% $95,895 70.6%
Agriculture, forestry, fishing & hunting 113 2.8% $38,243 -32.0%Mining (incl. fossil fuels) 801 20.2% $104,028 85.1%
Construction 405 10.2% $50,658 -9.9%Manufacturing (Incl. forest products) 49 1.2% $48,550 -13.6%
Services Related 1,576 39.7% $39,386 -29.9%Trade, Transportation, and Utilities 612 15.4% $45,942 -18.3%Information 13 0.3% $57,011 1.4%Financial Activities 152 3.8% $53,419 -4.9%Professional and Business Services 205 5.2% $49,183 -12.5%Education and Health Services 183 4.6% $32,494 -42.2%Leisure and Hospitality 327 8.2% $19,814 -64.7%Other Services 84 2.1% $30,801 -45.2%Unclassified 0 0.0% na na
Government 1,031 25.9% $49,198 -12.5%Federal Government 126 3.2% $65,353 16.3%State Government 81 2.0% $61,116 8.7%Local Government 824 20.7% $45,556 -18.9%
• In 2019 non-services related jobspaid the highest wages($80,807) and services relatedjobs paid the lowest ($39,386).
• In 2019 trade, transportation,and utilities jobs employed thelargest number of people(1,576), and federal governmentemployed the smallest (1,031jobs).
Data Sources: U.S. Department of Labor. 2020. Bureau of Labor Statistics, Quarterly Census of Employment and Wages, Washington, D.C.,reported by Headwaters Economics’ Economic Profile System, headwaterseconomics.org/eps.
Find more reports like this at headwaterseconomics.org/eps Data and Graphics | Part 30
$56,200
$80,807
$39,386$49,198
Wages & Employment by Industry, Sublette County, WY, 2019
010,00020,00030,00040,00050,00060,00070,00080,00090,000
Avg.
Ann
ual W
ages
(201
9$s
)
3,974
1,368 1,5761,031
Total Non-ServicesRelated
Services Related Government0
5001,0001,5002,0002,5003,0003,5004,0004,500
Wag
e &
Sala
ry J
obs

Socioeconomic TrendsSublette County, WY
Wages by Industry
What do we measure on this page?
This page describes employment and average annual wages by industry. It is sometimes the case that industries that pay wellemploy few people. Use the table on this page to understand how wages relate to the share of employment contributed by eachindustry.
Average Annual Wages: Total annual pay divided by total employment.
The data on this page are from the Bureau of Labor Statistics (BLS), which is the most reliable source of national data on averageannual wages.19, 20, 21 However, unlike the Bureau of Economic Analysis data used in other sections of this report, these data do notinclude proprietors or the value of benefits and are summarized into slightly different industry categories. As reported by BLS,wages include gross wages and salaries, bonuses, stock options, tips and other gratuities, and the value of meals and lodging.
The table compares level of employment and wages for all sectors of the economy and shows (in the far-right column) whether thesector's wages are above or below the average wage for all industries.
Depending on the areas selected, some data may not be available due to disclosure restrictions.
“Average annual wages” shown on this page is not the same as “average earnings per job” shown earlier in this report. Averageannual wages are calculated from BLS data, which do not include proprietors, while earnings per job are calculated from Bureau ofEconomic Analysis data, which include proprietors.
Why is it important?
It is sometimes assumed, particularly in rural areas, that the only high-wage jobs are in manufacturing and natural resourceindustries (e.g., timber, fossil fuel energy development, and mining). While these jobs often provide high average wages, someservices-related industries also offer high wages (e.g., information, financial activities, and professional and business services).
Nearly all new jobs created since 1990 have been in services-related industries, but they are not equally distributed across thecountry, and not all areas are able to attract and retain the relatively high-wage service-related jobs. The elements required toattract and keep high-wage service-related workers may include access to reliable transportation including airports, amenities,recreation opportunities, a trained workforce, and good schools.22, 23
In some areas, the highest-paying jobs are in the public sector. During recessions, government jobs may serve as an economicbuffer against declining employment and earnings in the private sector.
Study Guide | Part 31

Socioeconomic TrendsSublette County, WY
Proprietors (self-employed)
1970 2000 2019 Change2000-2019
Total Employment 2,027 3,947 6,642 2,695Wage and salary jobs 1,504 2,511 4,329 1,818Number of proprietors 523 1,436 2,313 877
Percent of Total % Change 2000-2019
Total Employment 68.3%Wage and salary jobs 74.2% 63.6% 65.2% 72.4%Number of proprietors 25.8% 36.4% 34.8% 61.1%
All employment data in the table above are reported by place of work and include both full-time and part-time workers.
• From 1970 to 2019, wageand salary employment(people who work forsomeone else) grew from1,504 to 4,329, a 188%increase.
• From 1970 to 2019,proprietors (the self-employed) grew from 523 to2,313, a 342% increase.
Data Sources: U.S. Department of Commerce. 2020. Bureau of Economic Analysis, Regional Economic Accounts, Washington, D.C., reported byHeadwaters Economics’ Economic Profile System, headwaterseconomics.org/eps.
Find more reports like this at headwaterseconomics.org/eps Data and Graphics | Part 32
Components of Employment, Sublette County, WY
1970
1972
1974
1976
1978
1980
1982
1984
1986
1988
1990
1992
1994
1996
1998
2000
2002
2004
2006
2008
2010
2012
2014
2016
2018
0
1,000
2,000
3,000
4,000
5,000
6,000
7,000
Wage & Salary Proprietors
Socioeconomic TrendsSublette County, WY
Proprietors (self-employed)
What do we measure on this page?
This page describes the changes in two components of employment: wage and salary employment, and proprietors.
Wage and Salary: This is a measure of the average annual number of full-time and part-time jobs by place of work. All jobs forwhich wages and salaries are paid are counted. Full-time and part-time jobs are counted with equal weight.24
Proprietors: This term includes the self-employed in nonfarm and farm sectors by place of work. Nonfarm self-employmentconsists of the number of sole proprietorships and the number of individual business partners not assumed to be limited partners.Farm self-employment is defined as the number of non-corporate farm operators, consisting of sole proprietors and partners.25
For more detailed information about farm employment and earnings, create an EPS Agriculture report athttps://headwaterseconomics.org/eps.
Why is it important?
A high level of growth in proprietors' employment could be interpreted as a sign of entrepreneurial activity, which is a positiveindicator of economic health.26 However, in some areas and particularly in remote rural areas, it is possible that a high proportionof self-employed is an indication that few jobs are available. People may work for themselves because it is the only alternative orthey may work for themselves in addition to holding a wage and salary job.
One way to see whether growth and a high level of proprietors' employment is a positive sign for the local economy is to look at thelong-term trends in proprietors' personal income. When proprietors' employment and real personal income are both rising, this is ahealthy indicator of entrepreneurial activity. On the other hand, rising proprietors' employment and falling real personal income canbe a sign of economic stress. The following section of this report examines this relationship.
Study Guide | Part 33

Socioeconomic TrendsSublette County, WY
Wages and Proprietors' Income
1970 2000 2019 Change2000-2019
Earnings by place of work 92,424 142,379 349,156 206,777Wage & salary disbursements 58,376 93,349 242,773 149,424Supplements to wage & salary 5,924 18,938 65,044 46,106Proprietors' income 28,125 30,092 41,339 11,247
Percent of Total % Change 2000-2019
Earnings by place of work 145.2%Wage & salary disbursements 63.2% 65.6% 69.5% 160.1%Supplements to wage & salary 6.4% 13.3% 18.6% 243.5%Proprietors' income 30.4% 21.1% 11.8% 37.4%
All income data in the table above are reported by place of work, which is different than earnings by place of residence shown on the following pageof this report.
• From 1970 to 2019, laborearnings from wage and salaryemployment grew from $58.4million to $242.8 million (in realterms), a 316% increase.
• From 1970 to 2019, laborearnings from proprietors'employment grew from $28.1million to $41.3 million (in realterms), a 47% increase.
• In 1970, proprietors represented26% of total employment. By2019, proprietors represented35% of total employment.
• In 1970, proprietors represented30% of total labor earnings. By2019, proprietors represented12% of total labor earnings.
Data Sources: U.S. Department of Commerce. 2020. Bureau of Economic Analysis, Regional Economic Accounts, Washington, D.C., reported byHeadwaters Economics’ Economic Profile System, headwaterseconomics.org/eps.
Find more reports like this at headwaterseconomics.org/eps Data and Graphics | Part 34
Components of Labor Earnings, Sublette County, WY
1970
1972
1974
1976
1978
1980
1982
1984
1986
1988
1990
1992
1994
1996
1998
2000
2002
2004
2006
2008
2010
2012
2014
2016
2018
050
100150200250300350400450500
Milli
ons
of 2
019$
s
Wage & salary disbursements Proprietors' income
Proprietors' Employment Share of Employment & Proprietors' IncomeShare of Labor Earnings, Sublette County, WY
1970
1972
1974
1976
1978
1980
1982
1984
1986
1988
1990
1992
1994
1996
1998
2000
2002
2004
2006
2008
2010
2012
2014
2016
2018
0%5%
10%15%20%25%30%35%40%45%
Proprietors' employment Proprietors' income
Socioeconomic TrendsSublette County, WY
Wages and Proprietors' Income
What do we measure on this page?
This page describes the components of labor earnings (in real terms): income from wage and salary, and proprietors' employment.It also looks more closely at proprietors, comparing long-term trends in proprietors' employment and personal income.
Earnings by Place of Work: This represents net earnings by place of work.
Wage and Salary Disbursements: This is a measure of the average annual number of full-time and part-time jobs in each area byplace of work. All jobs for which wages and salaries are paid are counted. Full-time and part-time jobs are counted with equalweight.
Proprietors' Income: This term includes the self-employed in nonfarm and farm sectors. Nonfarm self-employment consists of thenumber of sole proprietorships and the number of individual business partners not assumed to be limited partners. Farm self-employment is defined as the number of non-corporate farm operators, consisting of sole proprietors and partners.
For more detailed information about farm employment and earnings, create an EPS Agriculture report athttps://headwaterseconomics.org/eps.
Why is it important?
The table and figures can be used to compare the relative importance, and change in importance, of wage and salary jobs andproprietors as a source of employment and earnings.
Rapid growth and/or high proportions of proprietors' employment and income can be a sign of a healthy economy that is attractingentrepreneurs and stimulating business development, especially when paired with population growth and low unemployment.However, if labor earnings are flat or declining, high levels of proprietors may indicate a lack of opportunity.
Study Guide | Part 35

Socioeconomic TrendsSublette County, WY
Commuting PatternsPersonal income in thousands of 2019 $s
1990 2010 2019 Change2010-2019
Total Personal Income 181,371 543,351 539,227 -4,124Cross-County Commuting Flows
Inflow of Earnings 12,415 19,896 26,828 6,932Outflow of Earnings 8,102 123,575 59,509 -64,066Net Residential Adjustment (In - Outflow) 4,313 -103,679 -32,681 70,998
Percent of Total % Change 2010-2019
Net Residential Adjustment Share ofTotal Personal Income 2.4% -19.1% -6.1% 13.0%Data are only available at the county level (i.e., this page will be blank for aggregated geographies, states, and the U.S.). Total personal income isreported by place of residence.
• From 1990 to 2019 inflow ofearnings grew from $12.4 millionto $26.8 million (in real terms), a116% increase.
• From 1990 to 2019 outflow ofearnings grew from $8.1 millionto $59.5 million (in real terms), a634% increase.
• From 1990 to 2019, netresidential adjustment (inflow -outflow) changed from 2.4 to -6.1percent of total personal income.
Data Sources: U.S. Department of Commerce. 2020. Bureau of Economic Analysis, Regional Economic Accounts, Washington, D.C., reported byHeadwaters Economics’ Economic Profile System, headwaterseconomics.org/eps.
Find more reports like this at headwaterseconomics.org/eps Data and Graphics | Part 36
Inflow & Outflow of Earnings, Sublette County, WY
1990
1991
1992
1993
1994
1995
1996
1997
1998
1999
2000
2001
2002
2003
2004
2005
2006
2007
2008
2009
2010
2011
2012
2013
2014
2015
2016
2017
2018
2019
020406080
100120140160
Milli
ons
of (2
019
$s)
Inflow of Earnings Outflow of Earnings
Net Residential Adjustment as Share of Total Personal Income,Sublette County, WY
1990
1991
1992
1993
1994
1995
1996
1997
1998
1999
2000
2001
2002
2003
2004
2005
2006
2007
2008
2009
2010
2011
2012
2013
2014
2015
2016
2017
2018
2019
-25.0%
-20.0%
-15.0%
-10.0%
-5.0%
0.0%
5.0%
10.0%
Socioeconomic TrendsSublette County, WY
Commuting Patterns
What do we measure on this page?
This page describes the flow of earnings into the county by residents who work in neighboring counties ("inflow" of earningsbecause they bring money home); the flow of earnings by residents from neighboring counties who commute into the county forwork ("outflow" of earnings because they take their earnings with them); and the difference between the two ("net residentialadjustment"). 19, 20 , 21
If net residential adjustment is positive (inflow exceeds outflow), it means county residents commute outside the county for work andbring back more personal income than leaves the county in net terms. If net residential adjustment is negative (outflow exceedsinflow), it means the economy of the county attracts workers from nearby counties and loses more personal income than it bringsinto the county in net terms.
Inflow of Earnings: The gross annual earnings of in-commuters (i.e., people who work out of the county and bring money home).
Outflow of Earnings: The gross annual earnings of out-commuters (i.e., people who work in the county but live elsewhere and taketheir earnings with them).
Net Residence Adjustment: The net inflow of labor earnings of inter-area commuters.22, 23
Note: Data are only available at the county level, and begin in 1990 because that is the year the Bureau of Economic Analysisbegan reporting these data.
Why is it important?
One indicator of economic health for a county is whether it is able to attract workers from nearby counties. This could be the case ifa county has a surplus of jobs that attract workers from adjacent counties and would be indicated by a negative net residentialadjustment. Another possibility is that expensive housing in the county has driven some workers to live in relatively more affordableneighboring counties that have become "bedroom communities."
Alternatively, it is possible that a county with a positive net residential adjustment is a more desirable place to live (people are willingto commute and/or telecommute to work in order to live there for quality of life reasons). Commuting and telecommuting workersmay also contribute to the economy by spending their money in the local area (essentially exporting work and importing wages).
Long-term trends in inflow, outflow, and net residential adjustment help to describe the role that the county's economy has playedover time in a multi-county area. For example, a net residential adjustment that was positive but today is negative indicates thatcounty residents used to have to commute to neighboring counties for work but today the reverse is true and the county attractsworkers from neighboring counties.
If net residential adjustment is a large share of earnings (e.g., 10% or higher), it may indicate that the appropriate unit of analysis isa multi-county area that encompasses the entire labor market.
Study Guide | Part 37
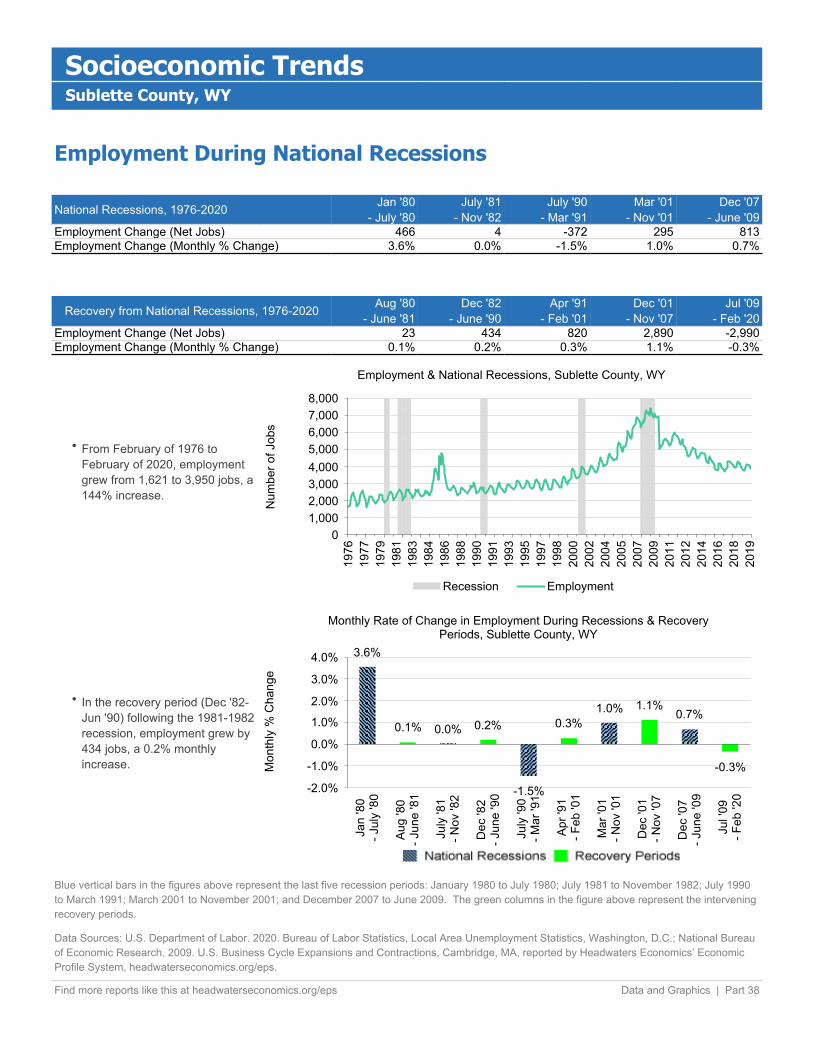
Socioeconomic TrendsSublette County, WY
Employment During National Recessions
National Recessions, 1976-2020 Jan '80- July '80
July '81- Nov '82
July '90- Mar '91
Mar '01- Nov '01
Dec '07- June '09
Employment Change (Net Jobs) 466 4 -372 295 813Employment Change (Monthly % Change) 3.6% 0.0% -1.5% 1.0% 0.7%
Recovery from National Recessions, 1976-2020 Aug '80- June '81
Dec '82- June '90
Apr '91- Feb '01
Dec '01- Nov '07
Jul '09- Feb '20
Employment Change (Net Jobs) 23 434 820 2,890 -2,990Employment Change (Monthly % Change) 0.1% 0.2% 0.3% 1.1% -0.3%
• From February of 1976 toFebruary of 2020, employmentgrew from 1,621 to 3,950 jobs, a144% increase.
• In the recovery period (Dec '82-Jun '90) following the 1981-1982recession, employment grew by434 jobs, a 0.2% monthlyincrease.
Blue vertical bars in the figures above represent the last five recession periods: January 1980 to July 1980; July 1981 to November 1982; July 1990to March 1991; March 2001 to November 2001; and December 2007 to June 2009. The green columns in the figure above represent the interveningrecovery periods.
Data Sources: U.S. Department of Labor. 2020. Bureau of Labor Statistics, Local Area Unemployment Statistics, Washington, D.C.; National Bureauof Economic Research. 2009. U.S. Business Cycle Expansions and Contractions, Cambridge, MA, reported by Headwaters Economics’ EconomicProfile System, headwaterseconomics.org/eps.
Find more reports like this at headwaterseconomics.org/eps Data and Graphics | Part 38
Employment & National Recessions, Sublette County, WY
1976
1977
1979
1981
1983
1984
1986
1988
1990
1991
1993
1995
1997
1998
2000
2002
2004
2005
2007
2009
2011
2012
2014
2016
2018
2019
01,0002,0003,0004,0005,0006,0007,0008,000
Num
ber o
f Job
s
Recession Employment
3.6%
0.1% 0.0% 0.2% 0.3%1.0% 1.1%
0.7%
-1.5%
-0.3%
Monthly Rate of Change in Employment During Recessions & RecoveryPeriods, Sublette County, WY
Jan
'80
- Jul
y '8
0
Aug
'80
- Jun
e '8
1
July
'81
- Nov
'82
Dec
'82
- Jun
e '9
0
July
'90
- Mar
'91
Apr '
91- F
eb '0
1
Mar
'01
- Nov
'01
Dec
'01
- Nov
'07
Dec
'07
- Jun
e '0
9
Jul '
09- F
eb '2
0
-2.0%
-1.0%
0.0%
1.0%
2.0%
3.0%
4.0%
Mon
thly
% C
hang
e
Socioeconomic TrendsSublette County, WY
Employment During National Recessions
What do we measure on this page?
This page describes long-term trends in employment during national recessions and recovery periods. 32, 33
The Employment and National Recessions graph shows long-term change in employment against periods of national recession(blue bars) and recovery. The Employment During Recessions and Recovery Periods graph shows the percent gain or loss inemployment during periods of national recession (blue bars) and recovery (green bars).
Recession: According to the National Bureau of Economic Research: "A recession is a significant decline in economic activityspread across the economy, lasting more than a few months, normally visible in real GDP, real income, employment, industrialproduction, and wholesale-retail sales. A recession begins just after the economy reaches a peak of activity and ends as theeconomy reaches its trough. Between trough and peak, the economy is in an expansion."
The U.S. Bureau of Labor Statistics changed methodology related to unemployment rates in 1990. Caution should be usedcomparing pre-1990 estimates of unemployment rates with those from 1990 forward. 34
Why is it important?
One measure of economic well-being is the resilience of the local economy during periods of national recession. It is a positive signif local employment continues to grow (or does not decline) during a recession. 35
Another sign of economic well-being is how well the local economy recovers from a recession, measured as growth of employmentfrom the trough (at the depth of the recession) to the peak (just before the next period of decline).
As the economy of a place diversifies, it can become more resilient to economic downturns. Places that attract new residents, retainmanufacturing, and support a high-tech economy tend to be less affected by economic downturns.
Government employment is more stable and can help to absorb some of the losses in private sector economic activity during arecession.
Study Guide | Part 39

Socioeconomic TrendsSublette County, WY
Comparisons
Indicators SubletteCounty, WY Wyoming Ratio of Sublette County, WY vs. Wyoming
Tren
ds
Population, % change, 2000-2019 64.9% 17.1%
Employment, % change, 2000-2019 68.3% 27.1%
Personal Income, % change, 2000-2019 109.2% 66.1%
Average Earnings per Job, % change, 2000-2019 45.7% 27.2%
Per Capita Income, % change, 2000-2019 26.9% 41.9%
Pros
perit
y
Avg. Earnings per Job, 2019 $52,568 $56,828
Per Capita Income, 2019 $54,850 $62,189
Services, Avg. Annual Wages, 2019 $39,386 $41,529
Non-Services, Avg. Annual Wages, 2019 $80,807 $71,487
Government, Avg. Annual Wages, 2019 $49,198 $50,546
Stre
ss Unemployment Rate, change 2000-2019 1.4% -0.3%
Unemployment Rate, 2019 4.4% 3.6%
Stru
ctur
e
Proprietors, % of Jobs, 2019 34.8% 27.9%
Non-Labor Income, % of Pers. Income, 2019 48.9% 43.2%
Services, % of Jobs, 2019 43.3% 60.6%
Non-Services, % of Jobs, 2019 34.3% 21.2%
Government, % of Jobs, 2019 16.5% 18.2%
Net inflow of labor earnings of inter-countycommuters* -6.1% 0.0%
* Displayed only when comparing a county to a benchmark county.
Data Sources: U.S. Department of Commerce. 2020. Bureau of Economic Analysis, Regional Economic Accounts, Washington, D.C.; U.S.Department of Labor. 2020. Bureau of Labor Statistics, Local Area Unemployment Statistics, Washington, D.C.;U.S. Department of Labor. 2020.Bureau of Labor Statistics, Quarterly Census of Employment and Wages, Washington, D.C.; reported by Headwaters Economics’ Economic ProfileSystem, headwaterseconomics.org/eps.
Find more reports like this at headwaterseconomics.org/eps Data and Graphics | Part 40
400%200%0%-200%-400%

Socioeconomic TrendsSublette County, WY
Comparisons
What do we measure on this page?
This page compares key performance indicators for the selected location(s) to the selected comparison area. (If no customcomparison area was selected, EPS defaults to comparing against the U.S.) Performance indicators are organized by groups(Trends, Prosperity, Stress, and Structure) that highlight potential competitive strengths and weaknesses.
The percent, or relative, difference between the selected geography and the comparison area is calculated by dividing thedifference between the values by the arithmetic mean of the values.
In some cases it may be appropriate to compare a local economy to the U.S. economy. In most cases, however, it will be moreuseful to compare county or regional economies to similar county or regional economies. For example, if the county being analyzedis small and rural, it should be compared to similar counties because comparing against the U.S. will include data from largemetropolitan areas.
Some indicators require a judgment call to decide whether they represent a positive or negative indicator of well-being. Forexample, a high percentage of personal income in the form of non-labor income could mean the location has done a good job ofattracting retirees and investment income. However, it could also mean that there is very little labor income so non-labor income isrelatively larger.
The term "benchmark" in this report should not be construed as having the same meaning as in the National Forest ManagementAct (NFMA).
Why is it important?
A number of indicators determine the economic health of a place. No single indicator should be used by itself. Rather, a range ofindicators should be analyzed to derive a comprehensive view of the economy.
The indicators in this report can be used to gauge both standard of living (through factors such as earnings per job and per capitaincome) and growth (through factors such as change in population, employment, and personal income). When comparingperformance among places, it may be important to consider additional measures that are not provided in this report, such as leisuretime, crime rate, health statistics, sense of well-being, and other factors that represent quality of life.
Detailed data on a range of topics, including in-depth reports on individual industries, can be obtained by creating other EPS reportsat https://headwaterseconomics.org/eps.
Data and Graphics | Part 41

Socioeconomic TrendsSublette County, WY
Comparisons
Sublette County, WY compared to Wyoming
• From 1970 to 2019, population inSublette County, WY grew by163% compared to 73% for theWyoming.
• From 1970 to 2019, employmentin Sublette County, WY grew by228% compared to 159% for theWyoming.
• From 1970 to 2019, personalincome in Sublette County, WYgrew by 385% compared to306% for the Wyoming.
• From 1976 to 2019, theunemployment rate in SubletteCounty, WY grew by 47%compared to -9% for theWyoming.
Data Sources: U.S. Department of Commerce. 2020. Bureau of Economic Analysis, Regional Economic Accounts, Washington, D.C.; U.S.Department of Labor. 2020. Bureau of Labor Statistics, Local Area Unemployment Statistics, Washington, D.C.; reported by HeadwatersEconomics’ Economic Profile System, headwaterseconomics.org/eps.
Find more reports like this at headwaterseconomics.org/eps Data and Graphics | Part 42
Population
050
100150200250300
Recession Sublette County, WY Wyoming
Employment
050
100150200250300350400450
Personal Income
0100200300400500600700
Unemployment Rate
1970
1972
1974
1976
1978
1980
1982
1984
1986
1988
1990
1992
1994
1996
1998
2000
2002
2004
2006
2008
2010
2012
2014
2016
2018
050
100150200250300350400450
Socioeconomic TrendsSublette County, WY
Comparisons
What do we measure on this page?
This page describes trends in key performance indicators (change in population, employment, real personal income, and theunemployment rate) for the selected area and compared to the comparison area. Gray vertical bars indicate periods of nationalrecession.
Data are indexed to the start year for each indicator so that data from areas of different sizes can be compared. The charts areuseful for showing the relative difference in the rate of change for each indicator.
The term "benchmark" in this report should not be construed as having the same meaning as in the National Forest ManagementAct (NFMA).
Information for a range of locations and measures can be obtained by creating additional EPS reports athttps://headwaterseconomics.org/eps.
Why is it important?
This page shows long-term economic performance at a glance. It enables the reader to compare performance between places, andevaluate how performance was impacted by national business cycles.
Data and Graphics | Part 43

Socioeconomic TrendsSublette County, WY
Data Sources & MethodsThis Socioeconomic Trends report uses national statistics from public government sources. All data used in EPS can be readilyverified with the original sources:
Regional Economic Accounts Population· ·Bureau of Economic Analysis, U.S. Department ofCommerce
Census Bureau, U.S. Department of Commerce.http://bea.gov/data/economic-accounts/regional https://www.census.gov/topics/population.htmlTel. 202-606-9600 Tel. 800-923-8282
Local Area Unemployment Statistics National Bureau of Economic Research· ·Bureau of Labor Statistics, U.S. Department of Labor http://www.nber.org/cycles/recessions.htmlhttp://www.bls.gov/lau Tel. 617-868-3900Tel. 202-691-6392
Quarterly Census of Employment and Wages·Bureau of Labor Statistics, U.S. Department of Laborhttp://www.bls.gov/cewTel. 202-691-6567
EPS core approachesEPS is designed to focus on long-term trends across a range of important measures. Trend analysis provides a morecomprehensive view of changes than spot data for select years. We encourage users to focus on major trends rather thanabsolute numbers. EPS displays detailed industry-level data to show changes in the composition of the economy over time andthe mix of industries at points in time. EPS employs cross-sectional benchmarking – comparing smaller areas such as countiesto larger regions, states, and the nation – to give a sense of relative performance. EPS allows users to aggregate data formultiple locations to allow for more sophisticated cross-sectional comparisons.
Industrial ClassificationsIndustry data reported in EPS come from data sources that use standard industry classification systems. Starting in the 1930s,the Standard Industrial Classification (SIC) system served as the structure for the collection, aggregation, presentation, andanalysis of industry data. Under SIC, which used a four-digit coding structure, an industry consisted of a group ofestablishments primarily engaged in producing or handling the same product or group of products or in rendering the sameservices. As the U.S. economy shifted from a primary emphasis on manufacturing to a more complex services economy, SICbecame less useful for describing the economy's changing industrial composition.
The North American Industry Classification System (NAICS), developed using a production-oriented conceptual framework,groups establishments into industries based on the activity in which they are primarily engaged. NAICS uses a six-digithierarchical coding system to classify all economic activity into 20 industry sectors. Five sectors are mainly goods-producingsectors and 15 are entirely services-producing sectors.
Adjusting dollar figures for inflationBecause a dollar in the past was worth more than a dollar today, data reported in current dollar terms should be adjusted forinflation. The U.S. Department of Commerce reports personal income figures in terms of current dollars. All income data in EPSare adjusted to real (or constant) dollars using the Consumer Price Index. Figures are adjusted to the latest date for which theannual Consumer Price Index is available.
Data gaps and estimationSome data are withheld by the federal government to avoid the disclosure of potentially confidential information. HeadwatersEconomics uses supplemental data from the U.S. Department of Commerce to estimate these data gaps. These are indicatedwith tildes (~) in tables. Documentation explaining methods developed by Headwaters Economics for estimating disclosuregaps is available at https://headwaterseconomics.org/eps.
Find more reports like this at headwaterseconomics.org/eps Data Sources & Methods
Socioeconomic TrendsSublette County, WY
Endnotes
1 - In addition to the U.S. Census Bureau county classifications offered here, several other county classificationsystems are available: the Economic Research Service of the U.S. Department of Agriculture offers a countyclassification system based on economic dependence on particular sectors (for example, “Farming-dependent,”Mining-dependent”), economic activity (“Non-metro recreation”), and policy type (for example, “Housing-stress” or“Persistent poverty”). The Economic Research Service’s “Rural-Urban Continuum Codes” codes with explanationcan be found at https://www.ers.usda.gov/data-products/rural-urban-continuum-codes/. Headwaters Economicsdeveloped a "Three Wests" county typology for all counties in the 11 contiguous western U.S. states based onaccess to markets via highway or air travel. Its web site (https://headwaterseconomics.org/economic-development/trends-performance/three-wests-explained/) offers sortable county data, a journal article on thesubject, and an interactive tool that allows users to compare economic and demographic data for “Metro,”“Connected,” and “Isolated” counties across the West.
2 - Population and Housing Unit Estimates. U.S. Census Bureau. https://www.census.gov/programs-surveys/popest/about.html.
3 - The U.S. Census Bureau provides a tool for mapping migration flows into and out of all counties in the country:https://flowsmapper.geo.census.gov/map.html.
4 - For a comprehensive cost of living index, see http://livingwage.mit.edu/pages/about.5 - A 2006 study documented that workers would accept lower wages in order to live closer to environmental amenities.
See: Schmidt L and Courant PN. 2006. Sometimes Close is Good Enough: The Value of Nearby EnvironmentalAmenities. Journal of Regional Science 46(5):931-951. See also: Deller SC, Tsai T-H, Marcouiller DW, and EnglishDBK. 2001. The Role of Amenities and Quality of Life in Rural Economic Growth. American Journal of AgriculturalEconomics 83(2): 352-365.
6 - The Occupational Outlook Handbook, published by the Bureau of Labor Statistics, contains descriptions of alloccupations, median pay, and the education and training required for each: https://www.bls.gov/ooh/.
7 - To see the possible impact of non-labor income sources on per capita income, see previous sections of this reportthat show the percent contribution of non-labor to total personal income, or create an EPS Non-Labor Income reportat https://headwaterseconomics.org/eps.
8 - A 2014 study analyzed the impact of types of non-labor income on socioeconomic performance. See: Lawson MM,Rasker R, and Gude PH. 2014. The importance of non-labor income: An analysis of socioeconomic performance inwestern counties by type of non-labor income. Journal of Regional Analysis and Policy 44(2): 175-190.
9 - For online SIC and NAICS manuals and definitions of industry codes, see https://www.census.gov/naics/ andhttps://www.osha.gov/pls/imis/sic_manual.html.
10 - Documentation explaining methods developed by Headwaters Economics for estimating disclosure gaps is availableat https://headwaterseconomics.org/eps.
11 - According to estimates by the U.S. Department of Labor, from 2008 through 2018 "goods-producing" employment inthe U.S. (mining, construction, and manufacturing) will not grow. By 2018, goods-producing sectors will account for12.9 percent of all jobs, down from 14.2 percent in 2008. In contrast, "service-producing" sectors are expected toaccount for 96 percent of the growth in new jobs. The fastest growing are projected to be professional and businessservices, and health care and social assistance. See: Bartsch KJ. 2009. The employment projections for 2008-18.Monthly Labor Review Online 132(11): 3-10. https://www.bls.gov/opub/mlr/2009/11/art1full.pdf.
Find more reports like this at headwaterseconomics.org/eps Endnotes
Socioeconomic TrendsSublette County, WY
Endnotes (cont.)
12 - The Bureau of Labor Statistics provides industry employment projections to 2024:https://www.bls.gov/opub/mlr/2015/article/industry-employment-and-output-projections-to-2024.htm.
13 - For an overview of how historical changes in employment have affected rural America, see Whitenar, LA andMcGranahan DA. 2003. Rural America: Opportunities and Challenges. Amber Waves 1(1):1-8 available athttps://www.agclassroom.org/teen/ars_pdf/social/amber/rural_america.pdf.
14 - The Economic Research Service of the U.S. Department of Agriculture is a good source for articles and data on therural economy: https://www.ers.usda.gov/topics/rural-economy-population/.
15 - See the Bureau of Labor Statistics’ explanation of seasonal adjustments at https://www.bls.gov/cps/seasfaq.htm.
16 - For more information on unemployment, see related Bureau of Labor Statistics resources available athttps://www.bls.gov/cps/faq.htm.
17 - The U.S. Department of Labor offers an explanation of seasonal and part-time employment:https://www.dol.gov/general/topic/workhours/seasonalemployment.
18 - For research findings on economic resiliency, see Chapple K and Lester TW. 2010. The resilient regional labourmarket? The U.S. case. Cambridge Journal of Regions, Economy and Society 3(1):85-104.
19 - For an overview of how the Bureau of Labor Statistics treats employment, seehttps://www.bls.gov/bls/employment.htm.
20 - For an overview of how the Bureau of Labor Statistics treats pay and benefits, seehttps://www.bls.gov/bls/wages.htm.
21 - Employment and wage estimates for more than 800 occupations are available from the Bureau of Labor Statistics. Itis helpful to look at services by occupation rather than by sector or industry because wages vary dramatically acrossoccupations associated with different services. For more information, see https://www.bls.gov/oes/.
22 - For a review of the role of public lands amenities and transportation in economic development, see Rasker R, GudePH, Gude JA, van den Noort J. 2009. The Economic Importance of Air Travel in High-Amenity Rural Areas. Journalof Rural Studies 25: 343-353. https://headwaterseconomics.org/wp-content/uploads/3wests/Rasker_et_al_2009_Three_Wests.pdf.
23 - This article specifically captures the idea that amenity values are capitalized into wages: Knapp TA and Graves PE.1989. On the Role of Amenities in Models of Migration and Regional Development. Journal of Regional Science29(1):71-87.
24 - Glossary. Bureau of Economic Analysis. https://www.bea.gov/help/glossary.25 - Regional Economic Accounts: Regional Definitions. Bureau of Economic Analysis.
https://www.bea.gov/data/economic-accounts/regional.26 - For an example of an academic study where proprietors' employment is considered an indication of entrepreneurial
activity, see Mack E, Grubesic TH, and Kessler E. 2007. Indices of Industrial Diversity and Regional EconomicComposition. Growth and Change 38(3):474-509.
27 - Regional Economic Accounts. Bureau of Economic Analysis. https://www.bea.gov/data/economic-accounts/regional.
28 - For a glossary of terms used by the Bureau of Economic Analysis with definitions, seehttps://www.bea.gov/data/economic-accounts/regional.
29 - The Decennial Census also reports the number of workers commuting between counties, seehttps://www.census.gov/topics/employment/commuting.html.
Find more reports like this at headwaterseconomics.org/eps Endnotes

Socioeconomic TrendsSublette County, WY
Endnotes (cont.)
30 - According to the Bureau of Economic Analysis: "Estimates of gross commuters' earnings inflow and outflow arederived from the residence adjustment estimates, which are the estimates of the net inflow of the earnings of inter-area commuters. In the personal income accounts, the residence adjustment estimates are added to place-of-workearnings estimates to yield place-of-residence earnings estimates. This conversion process is an important part ofthe local area economic accounts because personal income is a place-of-residence measure, whereas the dataused to estimate over 60 percent of personal income is reported on a place-of-work basis."
31 - For a study documenting a negative residential adjustment that is considered a positive indicator, see Mack E,Grubesic TH, and Kessler E. 2007. Indices of Industrial Diversity and Regional Economic Composition. Growth andChange 38(3):474-509.
32 - For a definition of recession and recovery periods, see the National Bureau of Economic Research: Business CycleDating Committee available at www.nber.org/cycles/recessions.html.
33 - For a list of national recessions and recovery periods, see www.nber.org/cycles/cyclesmain.html.34 - For information regarding data collection and methodology for labor force statistics compiled by the Bureau of Labor
Statistics, see https://www.bls.gov/lau/laumthd.htm. Please note that Local Area Unemployment Statistics data priorto 1990 are no longer supported by the Bureau of Labor Statistics.
35 - For research findings on economic resiliency, see: Chapple K and Lester TW. 2010. The resilient regional labourmarket? The U.S. case. Cambridge Journal of Regions, Economy and Society 3(1):85-104.
Find more reports like this at headwaterseconomics.org/eps Endnotes