Socioeconomic status, white matter, and executive function ... · Brain and Behavior 2016; ... most...
13
Brain and Behavior 2016; e00531 wileyonlinelibrary.com/journal/brb3 © 2016 The Authors. Brain and Behavior published by Wiley Periodicals, Inc. | 1 Received: 22 January 2016 | Revised: 31 May 2016 | Accepted: 3 June 2016 DOI: 10.1002/brb3.531 This is an open access arcle under the terms of the Creave Commons Aribuon License, which permits use, distribuon and reproducon in any medium, provided the original work is properly cited. Abstract Background: A growing body of evidence links socioeconomic status (SES) to chil- dren’s brain structure. Few studies, however, have specifically invesgated relaons of SES to white maer structure. Further, although several studies have demonstrated that family SES is related to development of brain areas that support execuve func- ons (EF), less is known about the role that white maer structure plays in the relaon of SES to EF. One possibility is that white maer differences may parally explain SES disparies in EF (i.e., a mediang relaonship). Alternavely, SES may differenally shape brain-behavior relaons such that the relaon of white maer structure to EF may differ as a funcon of SES (i.e., a moderang relaonship). Method: In a diverse sample of 1082 children and adolescents aged 3–21 years, we examined socioeconomic disparies in white maer macrostructure and microstruc- ture. We further invesgated relaons between family SES, children’s white maer volume and integrity in tracts supporng EF, and performance on EF tasks. Results: Socioeconomic status was associated with fraconal anisotropy (FA) and vol- ume in mulple white maer tracts. Addionally, family income moderated the rela- on between white maer structure and cognive flexibility. Specifically, across mulple tracts of interest, lower FA or lower volume was associated with reduced cognive flexibility among children from lower income families. In contrast, children from higher income families showed preserved cognive flexibility in the face of low white maer FA or volume. SES factors did not mediate or moderate links between white maer and either working memory or inhibitory control. Conclusions: This work adds to a growing body of literature suggesng that the socioeco- nomic contexts in which children develop not only shape cognive funconing and its underlying neurobiology, but may also shape the relaons between brain and behavior. KEYWORDS adolescents, children, educaon, execuve funcon, income, white maer 1 Sergievsky Center, Columbia University, New York City, New York, USA 2 Teachers College, Columbia University, New York City, New York, USA Correspondence Kimberly G. Noble, Teachers College, Columbia University, New York City, New York, USA. Email: [email protected] and Alexandra Ursache, Gertrude H. Sergievsky Center, Columbia University, New York City, New York, USA. Email: [email protected] ORIGINAL RESEARCH Socioeconomic status, white maer, and execuve funcon in children Alexandra Ursache 1 | Kimberly G. Noble 2 | for the Pediatric Imaging, Neurocognion and Genecs Study* *Data used in preparaon of this arcle were obtained from the Pediatric Imaging, Neurocognion and Genecs Study (PING) database (hp://ping.chd.ucsd.edu). As such, the invesgators within PING contributed to the design and implementaon of PING and/or provided data but did not parcipate in analysis or wring of this report. A complete lisng of PING invesgators can be found at hps://pingdataportal.ucsd.edu/sharing/Authors10222012.pdf.
Transcript of Socioeconomic status, white matter, and executive function ... · Brain and Behavior 2016; ... most...

Brain and Behavior 2016; e00531 wileyonlinelibrary.com/journal/brb3 © 2016 The Authors. Brain and Behavior published by Wiley Periodicals, Inc.
| 1
Received: 22 January 2016 | Revised: 31 May 2016 | Accepted: 3 June 2016
DOI: 10.1002/brb3.531
This is an open access article under the terms of the Creative Commons Attribution License, which permits use, distribution and reproduction in any medium, provided the original work is properly cited.
AbstractBackground: A growing body of evidence links socioeconomic status (SES) to chil-dren’s brain structure. Few studies, however, have specifically investigated relations of SES to white matter structure. Further, although several studies have demonstrated that family SES is related to development of brain areas that support executive func-tions (EF), less is known about the role that white matter structure plays in the relation of SES to EF. One possibility is that white matter differences may partially explain SES disparities in EF (i.e., a mediating relationship). Alternatively, SES may differentially shape brain- behavior relations such that the relation of white matter structure to EF may differ as a function of SES (i.e., a moderating relationship).Method: In a diverse sample of 1082 children and adolescents aged 3–21 years, we examined socioeconomic disparities in white matter macrostructure and microstruc-ture. We further investigated relations between family SES, children’s white matter volume and integrity in tracts supporting EF, and performance on EF tasks.Results: Socioeconomic status was associated with fractional anisotropy (FA) and vol-ume in multiple white matter tracts. Additionally, family income moderated the rela-tion between white matter structure and cognitive flexibility. Specifically, across multiple tracts of interest, lower FA or lower volume was associated with reduced cognitive flexibility among children from lower income families. In contrast, children from higher income families showed preserved cognitive flexibility in the face of low white matter FA or volume. SES factors did not mediate or moderate links between white matter and either working memory or inhibitory control.Conclusions: This work adds to a growing body of literature suggesting that the socioeco-nomic contexts in which children develop not only shape cognitive functioning and its underlying neurobiology, but may also shape the relations between brain and behavior.
K E Y W O R D S
adolescents, children, education, executive function, income, white matter
1Sergievsky Center, Columbia University, New York City, New York, USA2Teachers College, Columbia University, New York City, New York, USA
CorrespondenceKimberly G. Noble, Teachers College, Columbia University, New York City, New York, USA.Email: [email protected] Ursache, Gertrude H. Sergievsky Center, Columbia University, New York City, New York, USA.Email: [email protected]
O R I G I N A L R E S E A R C H
Socioeconomic status, white matter, and executive function in children
Alexandra Ursache1 | Kimberly G. Noble2 | for the Pediatric Imaging, Neurocognition and Genetics Study*
*Data used in preparation of this article were obtained from the Pediatric Imaging, Neurocognition and Genetics Study (PING) database (http://ping.chd.ucsd.edu). As such, the investigators within PING contributed to the design and implementation of PING and/or provided data but did not participate in analysis or writing of this report. A complete listing of PING investigators can be found at https://pingdataportal.ucsd.edu/sharing/Authors10222012.pdf.

e00531 (2 of 13) |
Ursache and noble
1 | INTRODUCTION
Socioeconomic disparities in children’s academic and cognitive out-comes have been well documented (McLoyd, 1998; Sirin, 2005) and current research has moved toward identifying potential neural underpinnings of these disparities. Differences in experiences, such as stress, language exposure, and cognitive stimulation, are differential-ly associated with growing up in more or less well- resourced house-holds; these differences in experience likely shape the development of brain areas that are important for children’s cognitive skills (Brito & Noble, 2014; Noble, Houston, Kan, & Sowell, 2012). Consistent with this theoretical perspective, several studies have demonstrated asso-ciations between socioeconomic status (SES) and cortical and sub-cortical gray matter structure in children (see Brito & Noble, 2014 for a review). For example, differences have been reported in left hemi-sphere language regions including the left superior temporal gyrus, left inferior frontal gyrus, and left fusiform (Noble, Wolmetz, Ochs, Farah, & McCandliss, 2006; Noble, Houston, et al., 2012; Noble, et al., 2015; Raizada, Richards, Meltzoff, & Kuhl, 2008); the hippo-campus, which supports memory, (Hanson, Chandra, Wolfe, & Pollak, 2011; Jednoróg et al., 2012; Luby et al., 2013; Noble, Houston, et al., 2012; Noble, Grieve, et al., 2012; Noble, et al., 2015); the prefrontal cortex which supports executive functioning, (Gianaros et al., 2007; Lawson, Duda, Avants, Wu, & Farah, 2013; Noble et al., 2015); and the amygdala which supports social- emotional processing, (Gianaros et al., 2008; Luby et al., 2013; Noble, Houston, et al., 2012).
Few studies, however, have investigated the ways in which the context of low socioeconomic status may shape the macro- and micro-structural properties of white matter in children. Jednoróg et al. (2012) found that SES, as measured by the Hollingshead index, was unrelated to white matter microstructure in a sample of 23 children. A larger sample of twins also did not find any direct relations between SES and white matter integrity as measured by fractional anisotropy (FA) (Chiang et al., 2011). Interestingly, however, the authors did find that SES modified the heritability of FA such that FA was more heritable among higher SES children. A related literature has shown that early deprivation in the form of institutionalization is associated with alter-ations in both white matter macrostructure, as measured by volume (Sheridan, Fox, Zeanah, McLaughlin, & Nelson, 2012) as well as white matter microstructure, or integrity (Bick et al., 2015). Moreover, one study has demonstrated relations between one’s own educational achievement in young adulthood and integrity in the superior longitu-dinal fasciculus and cingulum bundle, such that higher education was associated with lower FA in those two regions (Noble, Korgaonkar, Grieve, & Brickman, 2013).
Much of the work on SES differences in children’s brain struc-ture and function has focused on the development of executive functions, in part because the protracted development of brain areas that support these processes likely makes them more sus-ceptible to environmental influence (Giedd, 2004; Gogtay et al., 2004; Huttenlocher, 1979; Klingberg, Vaidya, Gabrieli, Moseley, & Hedehus, 1999; Liston et al., 2006; Sowell et al., 2003, 2004). Executive functions (EF) are cognitive skills involved in planning
and goal- directed behavior and play an important role in academ-ic achievement and school success (Blair, 2002). Several stud-ies have demonstrated that SES is related to the development of most aspects of executive functioning including working memory, inhibitory control, and cognitive flexibility (Blair et al., 2011; Farah et al., 2006; Noble, McCandliss, & Farah, 2007; Sarsour et al., 2011). Moreover, a growing body of work has found associations between SES and both function and structure of brain areas that underlie executive function capabilities. In one functional magnetic reso-nance imaging (fMRI) study that used a complex stimulus- response learning task that elicits prefrontal activation in adults, lower SES children performed more poorly than their higher SES counterparts. They were also more likely to activate the right medial frontal gyrus as compared to higher SES children, possibly reflecting less efficient processing (Sheridan, Sarsour, Jutte, D’Esposito, & Boyce, 2012). In adults, a study of functional connectivity of corticostriatal brain systems during a reward processing task found that lower parental education was associated with reduced functional connectivity of perigenual anterior cingulate cortex (pACC) and orbitofrontal cor-tex (OFC) regions to the dorsomedial prefrontal cortex (dMPFC) and ventral striatum, even after controlling for participants’ own (adult) level of education (Gianaros et al., 2011). Additional studies have reported SES- related differences in structural properties of gray mat-ter areas that support executive function. In a study of gray matter development from infancy through early childhood, lower family income was associated with smaller frontal lobe volumes in infan-cy and with slower growth of the frontal lobes through early child-hood (Hanson et al., 2013). Higher parental education has also been associated with greater cortical thickness in specific frontal regions including the right anterior cingulate gyrus and left superior frontal gyrus in children (Lawson et al., 2013). In adults, subjective social status has been associated with gray matter volume in the anterior cingulate cortex, an area important for cognitive control (Gianaros et al., 2007). In a prior study with the same cohort as analyzed in the present paper, family income was logarithmically related to differ-ences in cortical surface area, and surface area partially accounted for links between family income and certain executive function skills (Noble et al., 2015).
Diffusion tensor imaging (DTI) studies have identified several white matter tracts that appear to be important for performance on executive functioning tasks. These include the cingulum bundle (CB) (Kantarci et al., 2011; Konrad et al., 2010; Liston et al., 2006; Makris et al., 2008; Murphy et al., 2007; Pavuluri et al., 2009; Peters et al., 2014; Schermuly et al., 2010; Skranes et al., 2009); the superior lon-gitudinal fasciculus (SLF) (Ashtari et al., 2007; Burzynska et al., 2011; Charlton, Barrick, Lawes, Markus, & Morris, 2010; Karlsgodt et al., 2008; Kennedy & Raz, 2009; Konrad et al., 2010; Liston, Cohen, Teslovich, Levenson, & Casey, 2011; Makris et al., 2008; Olesen, Nagy, Westerberg, & Klingberg, 2003; Pavuluri et al., 2009; Perry et al., 2009; Sasson, Doniger, Pasternak, Tarrasch, & Assaf, 2013; Vestergaard et al., 2011); the anterior thalamic radiations (ATR) (Liston et al., 2011; Niogi et al., 2008; Pavuluri et al., 2009); and the inferior longitudinal fascic-ulus (ILF) (Perry et al., 2009; Sarro et al., 2011; Takeuchi et al., 2013).

Ursache and noble
| (3 of 13) e00531
The CB, SLF, and ATR all have projections to the anterior cingulate gyrus (Makris et al., 2008; Niogi et al., 2008; Schermuly et al., 2010) a prefrontal region long recognized to support executive functioning (Adleman et al., 2002; Botvinick, Braver, Barch, Carter, & Cohen, 2001; Bush et al., 1998; Casey et al., 2000), and the ILF connects occipital and temporal regions which support visual memory processes (Catani, Jones, Donato, & Ffytche, 2003; Perry et al., 2009). Studies of white matter tracts have investigated both macrostructural properties, such as volume, as well as microstructural properties including integrity as measured by FA. FA is an important microstructural property that is thought to indicate greater efficiency in information transfer across the brain, and recent work demonstrates that declines in FA in late adulthood have been linked to declines in fluid intelligence (Ritchie et al., 2015).
Few studies, however, have investigated the role that macro- and microstructural properties of white matter tracts may play in the rela-tion between SES and children’s EF. In considering relations across SES, brain structure, and executive function, both mediation and mod-eration pathways have been proposed (Brito & Noble, 2014; Noble, Houston, et al., 2012; Ursache & Noble, 2016). In a mediating mod-el, differences in white matter structure are hypothesized to account for the links between SES and behavioral performance on executive function tasks. Some support for this pathway comes from a study by Noble et al. (2013) which found that the relation between young adults’ education levels and performance on a Stroop- like cognitive control task was mediated by integrity of the SLF and CB white matter tracts. Similarly, Noble et al. (2015) found that differences in cortical surface area partially mediated relations between family income and performance on the flanker inhibitory control task and on the working memory task.
In a moderating model, SES is hypothesized to interact with brain structure such that the relation of brain structure to cognitive func-tion would differ across SES. This model stems from several areas of research that suggest that brain- behavior relations may differ for children from different SES backgrounds (for a review see Ursache & Noble, 2016). For example, some evidence suggests that children from higher SES families who are at- risk for reading difficulties may be able to develop good reading skills despite atypical activation in systems that are classically important for reading development (Noble, Wolmetz, et al., 2006; Shaywitz et al., 2003). Such studies suggest that experiences associated with higher SES backgrounds may buffer against risk for poorer cognitive performance. Moreover, this model is related to the theory of cognitive reserve which states that, because of differences in lifetime experience, higher SES individuals may be better able to call upon other neurocognitive resources and/or alter neurocognitive processing such that brain pathology does not result in otherwise expected cognitive deficits (Stern, 2009). For exam-ple, higher SES older adults may be able to recruit additional neural resources to buffer against some of the typical age- related memory decline (Czernochowski, Fabiani, & Friedman, 2008). Thus, it is possi-ble that the relation between white matter micro- or macrostructure and performance on executive functioning tasks may differ for chil-dren from lower versus higher SES backgrounds.
1.1 | Current study
This study examines the relations between SES, white matter struc-ture, and executive functioning. We first examine socioeconomic dis-parities in two facets of white matter structure— macrostructure as measured by volume, and microstructure as measured by fractional anisotropy (FA), an indicator of tract integrity—across the brain. Next, we investigate whether differences in white matter micro- or macro-structure in four a priori tracts of interest, namely the CB, ILF, SLF, and ATR, mediate or moderate SES disparities in executive function.
2 | METHODS
2.1 | Participants
Data used in the preparation of this article were obtained from the Pediatric Imaging, Neurocognition and Genetics (PING) Study database (RRID:SCR_008953; http://ping.chd.ucsd.edu/). PING was launched in 2009 by the National Institute on Drug Abuse (NIDA) and the Eunice Kennedy Shriver National Institute of Child Health and Human Development (NICHD) as a 2- year project of the American Recovery and Reinvestment Act. The primary goal of PING has been to create a data resource of highly standardized and carefully curated magnetic resonance imaging (MRI) data, comprehensive genotyping data, and developmental and neuropsychological assessments for a large cohort of developing children aged 3–20 years. The scientific aim of the project is, by openly sharing these data, to amplify the power and productivity of investigations of healthy and disordered development in children, and to increase understanding of the origins of variation in neurobehavioral phenotypes. For up- to- date information, see http://ping.chd.ucsd.edu/.
Participants were recruited through a combination of web- based, word- of- mouth, and community advertising at nine university- based data collection sites in and around the cities of Los Angeles, San Diego, New Haven, Sacramento, San Diego, Boston, Baltimore, Honolulu, and New York. Participants were excluded if they had a history of neu-rological, psychiatric, medical, or developmental disorders. All partic-ipants and their parents gave their informed written consent/assent to participate in all study procedures, including whole genome SNP genotype, neuropsychological assessments (NIH Toolbox Cognition Battery; RRID:SCR_002423; Akshoomoff et al., 2014), demographic and developmental history questionnaires, and high- resolution brain MRI. Each data collection site’s Office of Protection of Research Subjects and Institutional Review Board approved the study. The sam-ple for the current study was limited to the 1082 participants with complete data on imaging measures, age, sex, and genetic ancestry factors. Sample demographics are shown in Table 1.
2.2 | MEASURES
2.2.1 | Socioeconomic status
Parents were asked to report the level of educational attainment for each parent in the home. The average parental educational attainment

e00531 (4 of 13) |
Ursache and noble
was used in all analyses. Parents were also asked to report the total yearly family income. Data were not collected on the number of adults and children in the home, and thus we could not calculate income- to- needs ratios. Both family income and parental education data were originally collected in bins, which were recorded as the means of the bins for analysis. Family income was log transformed for all analy-ses due to the typically observed positive skew. As expected, fam-ily income and parental education were highly correlated (r = .546, p < .001).
2.2.2 | Image acquisition and Processing
For complete details of the image acquisition and processing meth-ods used in the creation of this publicly available dataset, please see Fjell et al. (2012) and Jernigan et al. (2016). Briefly, across the nine sites and 12 scanners, a standardized multiple- modality high- resolution structural MRI protocol was implemented, including a conventional three- plane localizer, a sagittal three- dimensional inversion recovery spoiled gradient echo T1- weighted vol-ume optimized for maximum gray/white matter contrast (echo time = 3.5 ms, repetition time = 8.1 ms, inversion time = 640 ms, flip angle = 8°, receiver bandwidth = ±31.25 kHz, FOV = 24 cm, frequency = 256, phase = 192, slice thickness = 1.2 mm), and a two axial two- dimensional diffusion tensor imaging (DTI) pepolar scans (30- directions b-value = 1,000, TE = 83 ms, TR = 13,600 ms, fre-quency = 96, phase = 96, slice thickness = 2.5 mm). Scanning dura-tion for DTI was 4:24. The scanner models used at each site can be found in Fjell et al., 2012. Pooling of data from different scanners imposes challenges, although the sequences were optimized for yielding comparable results, and scanner is included as the covariate in all statistical analyses.
Diffusion- weighted images were corrected for eddy current dis-tortion using a least squares inverse and iterative conjugate gradient descent method to solve for the 12 scaling and translation parame-ters describing eddy current distortions across the entire diffusion MRI scan, explicitly taking into account the orientations and ampli-tudes of the diffusion gradient (Zhuang et al., 2006). Head motion was corrected by registering each diffusion- weighted image to a cor-responding image synthesized from a tensor fit to the data (Hagler et al., 2009). Diffusion MRI data were corrected for spatial and intensity distortions caused by B0 magnetic field in homogeneities using the reversing gradient method (Holland, Kuperman, & Dale, 2010). Distortions caused by gradient nonlinearities were corrected by applying a predefined, scanner- specific, nonlinear transformation (Jovicich et al., 2006). Diffusion- weighted images were automatically registered to T1- weighted structural images using mutual informa-tion (Wells, Viola, Atsumi, Nakajima, & Kikinis, 1996) and rigidly resa-mpled into a standard orientation relative to the T1- weighted images with isotropic 2- mm voxels. Cubic interpolation was used for all res-ampling steps.
Diffusion parameters were computed for major brain fiber tracts. AtlasTrack was used to automatically label long- range white matter tracts based on a probabilistic atlas of fiber tract locations and orien-tations (Hagler et al., 2009). The fiber atlas contains prior probabilities and orientation information for specific long- range projection fibers, including some additional fiber tracts not included in the original description, such as corticostriate connections and inferior to supe-rior frontal corticocortical connections (Jernigan et al., 2016). Fiber tract volumes of DTI Atlas tracts were computed and conventional DTI methods were used to calculate fractional anisotropy (FA; (Basser, Mattiello, & LeBihan, 1994; Pierpaoli, Jezzard, Basser, Barnett, & Di Chiro, 1996) which represents the degree of directionality of random water diffusion.
2.2.3 | Flanker inhibitory control test
The NIH Toolbox Cognition Battery version of the flanker task was adapted from the Attention Network Test (ANT; Rueda et al., 2004). Participants were presented with a stimulus on the center of a com-puter screen and were required to indicate the left–right orientation while inhibiting attention to the flankers (surrounding stimuli). On some trials, the orientation of the flankers was congruent with the orientation of the central stimulus, and on the other trials, the flank-ers were incongruent. The test consisted of a block of 25 fish trials (designed to be more engaging and easier to see to make the task easier for children) and a block of 25 arrow trials, with 16 congru-ent and 9 incongruent trials in each block, presented in pseudoran-dom order. Participants who responded correctly on five or more of the nine incongruent trials then proceeded to the arrows block. All children aged 9 and above received both the fish and arrows blocks regardless of performance. The inhibitory control score was based on performance on both congruent and incongruent trials. A two- vector method was used that incorporated both accuracy and reaction time (RT) for participants who maintained a high level of
TABLE 1 Descriptive statistics
N Mean or % SD Range
Age 1082 12.21 4.91 3–21
Sex (male = 1) 1082 52%
Family Income 1036 97209 76233 4500–325000
Parental Education 1047 15.00 2.26 6–18
GAF Africa 1082 0.13 0.27 0–1
GAF American Indian
1082 0.05 0.12 0–0.83
GAF East Asian 1082 0.16 0.31 0–1
GAF Oceanic 1082 0.01 0.03 0–0.25
GAF Central Asian 1082 0.03 0.14 0–1
GAF European 1082 0.63 0.374 0–1
List Sort Working Memory
1069 17.98 5.25 0–28
DCCS Cognitive Flexibility
979 7.75 1.45 2–10
Flanker Inhibitory Control
1059 7.74 1.79 1–10

Ursache and noble
| (5 of 13) e00531
accuracy (>80% correct), and accuracy only for those who did not meet this criterion. Each vector score ranged from 0 to 5, for a maxi-mum total score of 10. The accuracy vector score was calculated by multiplying the number of correct responses by 0.125. The reaction time vector score was generated using individuals’ raw median reac-tion time score for the incongruent condition. Median reaction time values were computed using only correct trials with reaction times greater than or equal to 100 ms and reaction times no larger than 3 SDs away from the individual’s mean (for respective trial type). Lower reaction times result in higher vector scores. For further details on how reaction times were converted to the vector score, please see National Institutes of Health Toolbox Cognition Battery (NIH Toolbox CB) (2013).
2.2.4 | List sorting working memory test
This working memory measure requires participants to order stimuli by size (Tulsky et al., 2013). Participants were presented with a series of pictures on a computer screen and heard the name of the object from a speaker. The test was divided into the one- list and two- list conditions. In the one- list condition, participants were told to remem-ber a series of objects (food or animals) and repeat them in order, from smallest to largest. In the two- list condition, participants were told to remember a series of objects (food and animals, intermixed) and then again report the food in order of size, followed by animals in order of size. Working memory scores consisted of combined total items correct on both one- list and two- list conditions, with a maximum of 28 points.
2.2.5 | Dimensional change card sort task
The dimensional change card sort task (DCCS) is a test of cognitive flexibility taken from the NIH Toolbox. Participants are shown two target pictures, one on each side of the screen, that vary along two dimensions (e.g., shape and color). Participants are asked to match a series of bivalent test pictures (e.g., yellow balls and blue trucks) to the target pictures, first according to one dimension (e.g., color) and then, after a number of trials, according to the other dimension (e.g., shape). “Switch” trials are also employed, in which the partici-pant must change the dimension being matched. For example, after four straight trials matching on shape, the participant may be asked to match on color on the next trial and then go back to shape, thus requiring the cognitive flexibility to quickly choose the correct stimu-lus. A two- vector scoring method was used that incorporated both accuracy and reaction time (RT) for participants who maintained a high level of accuracy (>80% correct), and accuracy only for those who did not meet this criteria. Each vector score ranged from 0 to 5, for a maximum total score of 10. The accuracy vector score was calculated by multiplying the number of correct responses by 0.125. The reaction time vector score was generated using individuals’ raw, median reaction time score during the nondominant dimension condition. Median reaction time values were computed using only correct trials with reaction times greater than or equal to 100 ms and
reaction times no larger than 3 SDs away from the individual’s mean (for respective trial type). Lower reaction times result in higher vector scores. For further details on how reaction times were converted to the vector score, please see National Institutes of Heatlh Toolbox Cognition Battery (NIH Toolbox CB) (2013).
2.2.6 | Genetic collection and analysis
Saliva samples were sent to Scripps Translational Research Institute (STRI) for analysis. Once extracted, genomic DNA was genotyped with Illumina Human660W- Quad BeadChip. Replication and qual-ity control filters (that is, sample call rate >99, call rates >95%, minor allele frequency >5%) were performed (Bakken et al., 2012). To assess genetic ancestry and admixture proportions in the PING participants, a supervised clustering approach implemented in the ADMIXTURE software was used (Alexander & Lange, 2011). Using this approach, a genetic ancestry factor (GAF) was developed for each participant, representing the proportion of ancestral descent for each of six major continental populations: African, Central Asian, East Asian, European, Native American, and Oceanic. Implementation of ancestry and admixture proportions in the PING subjects is described elsewhere (Fjell et al., 2012). A more complete description of the genetic ances-try of the PING sample is also presented elsewhere (Akshoomoff et al., 2014).
2.3 | Analysis Plan
To investigate SES differences in white matter micro- and macro-structure, we first examined the extent to which family income and education are related to white matter FA and volume across the brain. For these analyses, we used a Bonferroni- adjusted alpha of 0.0013 (i.e., 0.05/39 tracts). Next, to investigate the role that white matter structure plays in the relation of SES to EF, we tested mediating and moderating hypotheses regarding four tracts, chosen a priori, that have been shown to be important for EF (the CB, SLF, ILF, ATR). As we did not have a priori hypotheses regarding laterality, we averaged FA and summed volume across left and right hemispheres for these analyses. To test for mediation, we examined whether differences in volume or integrity of those tracts attenuate (i.e., statistically medi-ate) associations between family income/parental education and EF. Mediation analyses were conducted using the INDIRECT Macro (Preacher & Hayes, 2008) with 5000 bootstrap samples to test the significance of indirect effects. To test for moderation, we examined whether SES factors (parent education/family income) altered (i.e., statistically moderated) associations between white matter tract volume/integrity and EF (see Fig. 1). Interaction terms were cre-ated by multiplying parent education or family income by volume or integrity of the white matter tracts of interest. Linear regression was then used to test the significance of the interaction term in predict-ing EF. For each hypothesis, our Bonferroni- adjusted alpha was set at 0.0125, to adjust for comparisons in four tracts. We additionally conducted exploratory, unadjusted analyses of the same relations across all fibers.

e00531 (6 of 13) |
Ursache and noble
Analyses predicting white matter integrity included as covari-ates age, age squared, sex, genetic ancestry, and scanner. Analyses predicting white matter volume included as covariates age, whole brain volume, sex, genetic ancestry, and scanner. Analyses predict-ing EF included as covariates age, age squared, sex, and genetic ancestry.
The sample was limited to the 1082 participants with complete data on imaging measures, age, sex, and genetic ancestry factors. Analyses were conducted for all participants with complete data on the variables included in a given analysis. Descriptive statistics and sample sizes for each variable are shown in Table 1. Analyses were conducted in SPSS (version 22).
3 | RESULTS
3.1 | Relations of SES to white matter integrity and volume
Higher family income was related to higher FA in the right parahip-pocampal cingulum (β = 0.101, p = .001) and the right superior cor-ticostriate tract in the frontal cortex (β = 0.095, p = .001). There were no significant relations between family income and white mat-ter volume. Higher parental education was related to higher FA in the left superior cortiostriate tract in the parietal cortex (β = 0.088, p = .001). Higher parental education was associated with lower white matter volume in the left inferior frontal superior frontal cortex tract (β = −0.063, p < .001). Tables S1–S4 show uncorrected relations between SES and white matter FA and volume in all tracts across the brain.
3.2 | SES associations with EF mediated by white matter integrity
To begin examining whether white matter structure mediated path-ways between SES and EF, we first replicated results demonstrat-ing links between SES and children’s EF. As shown in Table 2, when adjusting for age, age squared, sex, and genetic ancestry, higher fam-ily income was significantly related to higher scores on the cognitive
flexibility (β = 0.049, p = .021), working memory (β = 0.058, p = .003), and inhibitory control (β = 0.039, p = .045) tasks. As shown in Table 2, when adjusting for age, age squared, sex, and genetic ancestry, higher parental education was significantly related to higher scores on the cognitive flexibility, (β = 0.072, p = .001), working memory, (β = 0.095, p < .001), and inhibitory control (β = 0.073, p < .001) tasks.
The CB, ILF, SLF, and ATR were hypothesized a priori to play a role in mediating the links between SES and EF. We therefore next examined whether parental education and/or family income was relat-ed to FA in these tracts. Family income was inversely related to ATR FA (β = −0.063, p = .014) and parental education was positively related to ILF FA (β = 0.056, p = .013). Although these relations did not reach sta-tistical significance at the Bonferroni- adjusted levels, they were bor-derline significant. We therefore next examined whether FA in either of these tracts was associated with performance on each of the three EF tasks. Higher FA in the ILF was associated with higher inhibitory control (β = 0.067, p = .011). FA in the ATR was not associated with performance on any of the EF tasks.
Finally, we tested whether FA in the ILF mediated the association between parental education and inhibitory control. Results indicated that the indirect effect of parental education on inhibitory control through ILF FA was not significant (98.75% CI: [−.0007,.0094]).
3.3 | Moderation of SES effects on EF by white matter volume and integrity
We next examined whether SES- moderated relations between white matter structure in the four a priori tracts of interest and performance on each of the EF tasks.
As shown in Table 3, for the DCCS task, there was a significant volume x family income interaction in two of the a priori tracts as well as across the whole brain: CB (β = −0.718, p = .002), SLF (β = −0.915, p < .001), and all fibers (β = −0.741, p = .007). There were border-line significant interactions in each of the other a priori tracts: ILF (β = −0.629, p = .016), ATR (β = −0.602, p = .022). Thus family income moderated the association between white matter volume and cogni-tive flexibility. As shown in Fig. 2, the pattern of moderation largely suggests that for children from lower income families, lower white
F IGURE 1 Hypotheses. (A) The relation of SES to executive function may be mediated by white matter structure. (B) Alternatively, SES may moderate the relation of white matter structure to executive function

Ursache and noble
| (7 of 13) e00531
matter volume is associated with reduced cognitive flexibility, whereas children from higher income families tended to show higher levels of cognitive flexibility regardless of white matter volume.
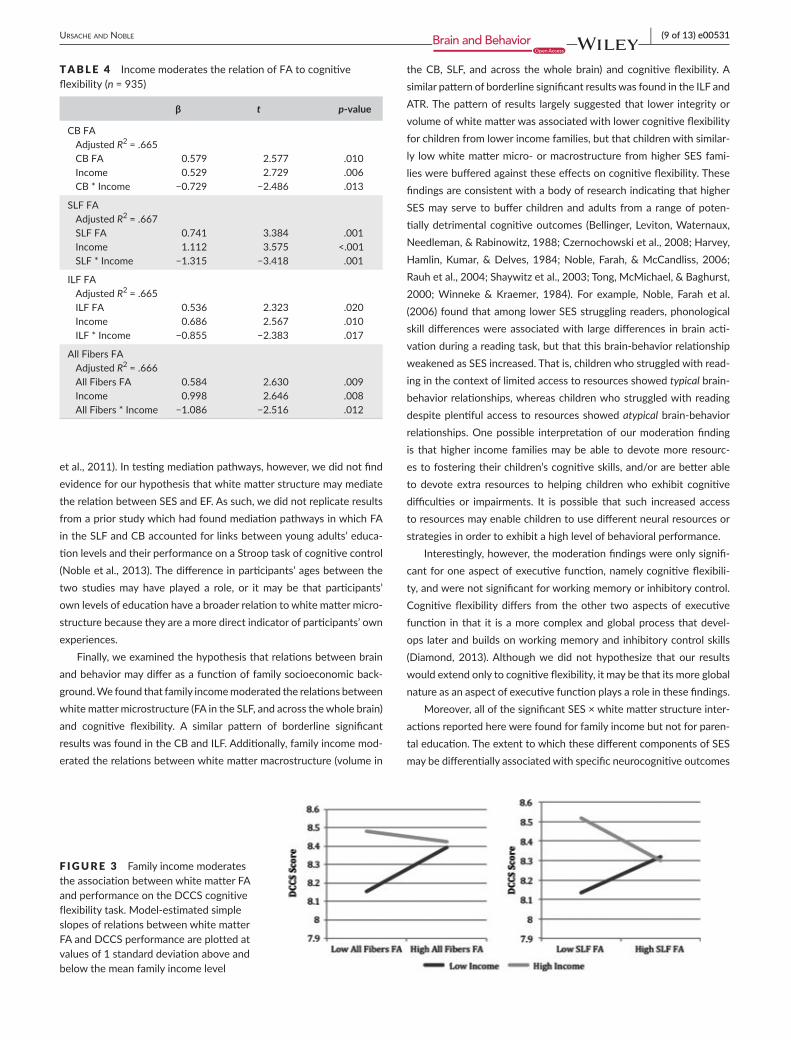
As shown in Table 4, for the DCCS task, there was a significant FA x family income interaction in the SLF (β = −1.315, p = .001) as well as across the whole brain (β = −1.086, p = .012), and there were border-line significant interactions in two other a priori tracts: CB (β = −0.729, p = .013), ILF (β = −0.855, p = .017). Thus, family income moderates the associations between FA and cognitive flexibility. As shown in Fig. 3, the pattern of moderation largely suggests that for children from lower income families, lower white matter integrity is associated with lower cognitive flexibility, whereas children from higher income families tend to exhibit higher cognitive flexibility regardless of their white matter microstructure.
Because of the negatively skewed distribution of the DCCS, we reran the analyses after winsorizing scores on the task by recoding any values that were more than 3 SD below the mean to the value of 3 SD below the mean. The pattern of results remained the same.
No other relations between white matter macro- or microstruc-ture and EF task performance were moderated by SES factors at Bonferroni- adjusted levels of significance.
4 | DISCUSSION
This study is the largest investigation to date of SES differences in macro- and microstructure of white matter tracts. Additionally, it is the first to report associations between parental SES and children’s white matter integrity and volume. Specifically, we found that higher fam-ily income was related to higher FA in two regions: the right parahip-pocampal cingulum, which is a limbic tract involved in memory (Zhuang et al., 2013) and which is part of the cingulum bundle important for EF; and the right superior corticostriate tract in the frontal cortex, which connects the cortex to the striatum involved in reward processing. Additionally, higher parental education was related to higher integrity (FA) in the left superior corticostriate in the parietal cortex. Higher parental education was associated with lower white matter volume in the left inferior frontal superior frontal cortex tract, which has been associated with language function (Kucukboyaci et al., 2014).
These results add to an emerging body of work, which has demon-strated SES- related differences in children’s brain structure and func-tion (see Brito & Noble, 2014 and Ursache & Noble, 2016). Little is known, however, about the specific mechanistic pathways through which SES might affect white matter development. Differences in
TABLE 2 Relation of family income and parental education to executive function
Model 1
DCCS (n = 935) List Sort (n = 1023) Flanker (n = 1013)
β t p- value β t p- value β t p- value
Age 2.757 25.326 <.001 2.842 29.480 <.001 3.011 30.898 <.001
Age sq −2.077 −19.063 <.001 −2.171 −22.526 <.001 −2.346 −24.051 <.001
Sex −0.053 −2.781 .006 0.043 2.441 .015 0.014 0.802 .423
GAF Africa −0.046 −2.141 .033 −0.101 −5.202 <.001 −0.037 −1.868 .062
GAF American Indian −0.059 −2.936 .003 - 0.026 −1.416 .157 −0.031 −1.685 .092
GAF East Asian 0.023 1.065 .287 −0.061 −3.011 .003 0.030 1.472 .141
GAF Oceanic −0.052 −2.440 .015 −0.017 −0.869 .385 −0.035 −1.761 .078
GAF Central Asian 0.007 0.342 .732 0.008 0.449 .654 0.014 0.747 .455
Income 0.049 2.310 .021 0.058 2.957 .003 0.039 2.006 .045
Adjusted R2 = .662 Adjusted R2 = .687 Adjusted R2 = .687
Model 2
DCCS (n = 945) List Sort (n = 1034) Flanker (n = 1024)
β t p- value β t p- value β t p- value
Age 2.811 26.212 <.001 2.876 30.621 <.001 3.048 32.119 <.001
Age sq −2.128 −19.875 <.001 −2.196 −23.439 <.001 −2.376 −25.074 <.001
Sex −0.052 −2.729 .006 0.044 2.511 .012 0.012 0.692 .489
GAF Africa −0.040 −1.970 .049 −0.095 −5.090 <.001 −0.028 −1.474 .141
GAF American Indian −0.043 −2.085 .037 −0.011 −0.596 .551 −0.014 −0.748 .455
GAF East Asian 0.013 0.611 .541 −0.059 −2.970 .003 0.030 1.514 .13
GAF Oceanic −0.047 −2.216 .027 −0.010 −0.493 .622 −0.025 −1.300 .194
GAF Central Asian 0.013 0.665 .506 0.007 0.420 .675 0.011 0.613 .54
Education 0.072 3.441 .001 0.095 4.956 <.001 0.073 3.798 <.001
Adjusted R2 = .665 Adjusted R2 = .695 Adjusted R2 = .695

e00531 (8 of 13) |
Ursache and noble
experiences of family stress and cognitive stimulation are candidates for investigation, as these have been linked to socioeconomic differenc-es in gray matter structure and function (Brito & Noble, 2014; Noble,
Houston, et al., 2012; Noble, Grieve, et al., 2012). Socioeconomic dis-advantage may lead to increased experience of stress through multi-ple pathways including both physical and social characteristics of the environment (Evans, 2004). Lower SES homes are often characterized by harsher parenting, crowding, noise, chaotic schedules, a lack of rou-tines, and a generally higher level of unpredictability, all of which can contribute to an increase in stress in children (Adler & Snibbe, 2003; Combs- Orme & Cain, 2006; Evans, Gonnella, Marcynyszyn, Gentile, & Salpekar, 2005). Children from lower SES families are also more like-ly to be exposed to environments that are less cognitively stimulat-ing and linguistically enriched (see Perkins et al., 2013 for a review). For example, children from lower SES families are exposed to fewer words (Hart & Risley, 1995) and less complex sentences (Hoff, 2003; Huttenlocher, Vasilyeva, Cymerman, & Levine, 2002), and differences in child- directed speech have been associated with children’s language abilities (Weisleder & Fernald, 2013). How exactly these or other expe-riences might translate into white matter differences, however, needs to be explored in future work.
This is also the first study to explore the ways in which children’s socioeconomic context and white matter structure might explain behavioral performance on executive function tasks. We first inves-tigated the extent to which differences in white matter structure in four a priori tracts of interest might account for, or mediate, the links between socioeconomic factors and EF performance. In doing so, we first replicated prior behavioral findings that higher family income and parental education were associated with better performance on work-ing memory, inhibitory control, and cognitive flexibility tasks. These results are in line with past research demonstrating that executive functions are impaired among children growing up in lower SES con-texts (Blair et al., 2011; Farah et al., 2006; Noble et al., 2007; Sarsour
TABLE 3 Income moderates the relation between volume and cognitive flexibility (n = 935)
β t p- value
CB volumeAdjusted R2 = .668CB volume 0.676 3.314 .001Income 0.370 3.406 .001CB * Income −0.718 −3.033 .002
SLF volumeAdjusted R2 = .668SLF volume 0.780 3.641 <.001Income 0.499 3.880 <.001SLF * Income −0.915 −3.564 <.001
ILF volumeAdjusted R2 = .667ILF volume 0.421 1.963 .050Income 0.360 2.747 .006ILF *Income −0.629 −2.410 .016
ATR volumeAdjusted R2 = .665ATR volume 0.486 2.299 .022Income 0.379 2.592 .010ATR * Income −0.602 −2.292 .022
All fibers volumeAdjusted R2 = .666All Fibers Volume 0.593 2.753 .006Income 0.470 2.998 .003All Fibers * Income −0.741 −2.720 .007
F IGURE 2 Family income moderates the association between white matter volume and performance on the DCCS cognitive flexibility task. Model-estimated simple slopes of relations between white matter volume and DCCS performance are plotted at values of 1 standard deviation above and below the mean family income level
Ursache and noble
| (9 of 13) e00531
et al., 2011). In testing mediation pathways, however, we did not find evidence for our hypothesis that white matter structure may mediate the relation between SES and EF. As such, we did not replicate results from a prior study which had found mediation pathways in which FA in the SLF and CB accounted for links between young adults’ educa-tion levels and their performance on a Stroop task of cognitive control (Noble et al., 2013). The difference in participants’ ages between the two studies may have played a role, or it may be that participants’ own levels of education have a broader relation to white matter micro-structure because they are a more direct indicator of participants’ own experiences.
Finally, we examined the hypothesis that relations between brain and behavior may differ as a function of family socioeconomic back-ground. We found that family income moderated the relations between white matter microstructure (FA in the SLF, and across the whole brain) and cognitive flexibility. A similar pattern of borderline significant results was found in the CB and ILF. Additionally, family income mod-erated the relations between white matter macrostructure (volume in
the CB, SLF, and across the whole brain) and cognitive flexibility. A similar pattern of borderline significant results was found in the ILF and ATR. The pattern of results largely suggested that lower integrity or volume of white matter was associated with lower cognitive flexibility for children from lower income families, but that children with similar-ly low white matter micro- or macrostructure from higher SES fami-lies were buffered against these effects on cognitive flexibility. These findings are consistent with a body of research indicating that higher SES may serve to buffer children and adults from a range of poten-tially detrimental cognitive outcomes (Bellinger, Leviton, Waternaux, Needleman, & Rabinowitz, 1988; Czernochowski et al., 2008; Harvey, Hamlin, Kumar, & Delves, 1984; Noble, Farah, & McCandliss, 2006; Rauh et al., 2004; Shaywitz et al., 2003; Tong, McMichael, & Baghurst, 2000; Winneke & Kraemer, 1984). For example, Noble, Farah et al. (2006) found that among lower SES struggling readers, phonological skill differences were associated with large differences in brain acti-vation during a reading task, but that this brain- behavior relationship weakened as SES increased. That is, children who struggled with read-ing in the context of limited access to resources showed typical brain- behavior relationships, whereas children who struggled with reading despite plentiful access to resources showed atypical brain- behavior relationships. One possible interpretation of our moderation finding is that higher income families may be able to devote more resourc-es to fostering their children’s cognitive skills, and/or are better able to devote extra resources to helping children who exhibit cognitive difficulties or impairments. It is possible that such increased access to resources may enable children to use different neural resources or strategies in order to exhibit a high level of behavioral performance.
Interestingly, however, the moderation findings were only signifi-cant for one aspect of executive function, namely cognitive flexibili-ty, and were not significant for working memory or inhibitory control. Cognitive flexibility differs from the other two aspects of executive function in that it is a more complex and global process that devel-ops later and builds on working memory and inhibitory control skills (Diamond, 2013). Although we did not hypothesize that our results would extend only to cognitive flexibility, it may be that its more global nature as an aspect of executive function plays a role in these findings.
Moreover, all of the significant SES × white matter structure inter-actions reported here were found for family income but not for paren-tal education. The extent to which these different components of SES may be differentially associated with specific neurocognitive outcomes
TABLE 4 Income moderates the relation of FA to cognitive flexibility (n = 935)
β t p- value
CB FAAdjusted R2 = .665CB FA 0.579 2.577 .010Income 0.529 2.729 .006CB * Income −0.729 −2.486 .013
SLF FAAdjusted R2 = .667SLF FA 0.741 3.384 .001Income 1.112 3.575 <.001SLF * Income −1.315 −3.418 .001
ILF FAAdjusted R2 = .665ILF FA 0.536 2.323 .020Income 0.686 2.567 .010ILF * Income −0.855 −2.383 .017
All Fibers FAAdjusted R2 = .666All Fibers FA 0.584 2.630 .009Income 0.998 2.646 .008All Fibers * Income −1.086 −2.516 .012
F IGURE 3 Family income moderates the association between white matter FA and performance on the DCCS cognitive flexibility task. Model-estimated simple slopes of relations between white matter FA and DCCS performance are plotted at values of 1 standard deviation above and below the mean family income level

e00531 (10 of 13) |
Ursache and noble
is only beginning to be explored. Although we did not have a priori hypotheses about the effects of family income versus parental educa-tion, it may be that higher family income plays a particularly salient role in giving families the resources to purchase better housing, child care, learning opportunities, tutoring services, extracurricular activities, and medical services that could promote executive function development among those who might otherwise be at risk for impairments.
5 | LIMITATIONS AND FUTURE DIRECTIONS
The tract- based approach that we utilized in the present study is lim-ited in that tract size may play a role in our ability to detect relations between SES and white matter. For example, in larger tracts, significant relations in one part of the tract may be washed out by nonsignificant relations elsewhere in the tract. Future work should consider voxel- based approaches to overcome this limitation. Our results exploring the role that white matter structure plays in the relation of SES to EF are additionally limited by the small effect sizes, and future work is needed to replicate these findings. Moreover, it is unclear why family income moderated the effects of white matter integrity and volume primarily in the context of cognitive flexibility, and not in the context of other executive functions. This should be explored in future work.
6 | CONCLUSIONS
This study is the largest examination of SES differences in white mat-ter structure and is the first to investigate relations among family income and parental education, white matter integrity and volume, and executive functioning. Parental SES was related to white matter integrity and volume in multiple tracts. Additionally, SES was found to moderate the relation between white matter structure and cogni-tive flexibility. These results suggest that children from higher income families may be buffered from behavioral deficits that are typically associated with lower white matter volume and integrity. As such, this work adds to a growing body of literature suggesting that the socio-economic contexts in which children develop not only shape cognitive functioning and its underlying neurobiology, but may also shape the relations between brain and behavior.
ACKNOWLEDGMENTS
Data collection and sharing for this project was funded by the Pediatric Imaging, Neurocognition and Genetics Study (PING; National Institutes of Health Grant RC2DA029475). PING is funded by the National Institute on Drug Abuse and the Eunice Kennedy Shriver National Institute of Child Health and Human Development. PING data are disseminated by the PING Coordinating Center at the Center for Human Development, University of California, San Diego. The authors are grateful for funding from the Neuro- epidemiology Training Program at Columbia University (NIH/NINDS T32- NS07153),
the Annie E. Casey Foundation, the W.K. Kellogg Foundation, and Teachers College, Columbia University. Funding sources had no involvement in the preparation of this manuscript.
FUNDING INFORMATION
Teachers College, National Institutes of Health, (Grant/Award Number: ‘RC2DA029475’,’T32-NS07153’) Annie E. Casey Foundation, W.K. Kellogg Foundation.
CONFLICT OF INTEREST
None declared.
REFERENCES
Adleman, N. E., Menon, V., Blasey, C. M., White, C. D., Warsofsky, I. S., Glover, G. H., & Reiss, A. L. (2002). A developmental fMRI study of the Stroop color- word task. NeuroImage, 16, 61–75.
Adler, N. E., & Snibbe, A. C. (2003). The role of psychosocial processes in explaining the gradient between socioeconomic status and health. Cur-rent Directions in Psychological Science, 12, 119–123.
Akshoomoff, N., Newman, E., Thompson, W. K., McCabe, C., Bloss, C. S., Chang, L., … Frazier, J. A. (2014). The NIH Toolbox Cognition Battery: Results from a large normative developmental sample (PING). Neuro-psychology, 28, 1.
Alexander, D. H., & Lange, K. (2011). Enhancements to the ADMIXTURE algorithm for individual ancestry estimation. BMC Bioinformatics, 12, 246. doi:10.1186/1471-2105-12-246.
Ashtari, M., Cottone, J., Ardekani, B. A., Cervellione, K., Szeszko, P. R., Wu, J., … Kumra, S. (2007). Disruption of white matter integrity in the inferior longitudinal fasciculus in adolescents with schizophrenia as revealed by fiber tractography. Archives of General Psychiatry, 64, 1270–1280.
Bakken, T. E., Roddey, J. C., Djurovic, S., Akshoomoff, N., Amaral, D. G., Bloss, C. S., … for the Alzheimer’s Disease Neuroimaging Initiative, Pediatric Imaging, Neurocognition, and Genetics Study (2012). Asso-ciation of common genetic variants in GPCPD1 with scaling of visual cortical surface area in humans. Proceedings of the National Academy of Sciences of the United States of America, 109, 3985–3990.
Basser, P. J., Mattiello, J., & LeBihan, D. (1994). MR diffusion tensor spec-troscopy and imaging. Biophysical Journal, 66, 259–267.
Bellinger, D., Leviton, A., Waternaux, C., Needleman, H., & Rabinowitz, M. (1988). Low- level lead exposure, social class, and infant development. Neurotoxicology and Teratology, 10, 497–503.
Bick, J., Zhu, T., Stamoulis, C., Fox, N. A., Zeanah, C., & Nelson, C. A. (2015). Effect of early institutionalization and foster care on long- term white matter development: A randomized clinical trial. JAMA Pediatrics, 169, 211–219.
Blair, C. (2002). School readiness: Integrating cognition and emotion in a neurobiological conceptualization of children’s functioning at school entry. American Psychologist, 57, 111–127.
Blair, C., Granger, D. A., Willoughby, M., Mills-Koonce, R., Cox, M., Green-berg, M. T., … the FLP Investigators (2011). Salivary cortisol mediates effects of poverty and parenting on executive functions in early child-hood. Child Development, 82, 1970–1984.
Botvinick, M. M., Braver, T. S., Barch, D. M., Carter, C. S., & Cohen, J. D. (2001). Conflict monitoring and cognitive control. Psychological Review, 108, 624–652.
Brito, N. H., & Noble, K. G. (2014). Socioeconomic status and structural brain development. Frontiers in Neuroscience, 8, 276. doi:10.3389/fnins.2014.00276.

Ursache and noble
| (11 of 13) e00531
Burzynska, A. Z., Nagel, I. E., Preuschhof, C., Li, S. C., Lindenberger, U., Backman, L., & Heekeren, H. R. (2011). Microstructure of frontoparietal connections predicts cortical responsivity and working memory perfor-mance. Cerebral Cortex, 21, 2261–2271.
Bush, G., Whalen, P. J., Rosen, B. R., Jenike, M. A., McInerney, S. C., & Rauch, S. L. (1998). The counting Stroop: An interference task specialized for functional neuroimaging—validation study with functional MRI. Human Brain Mapping, 6, 270–282.
Casey, B. J., Thomas, K. M., Welsh, T. F., Badgaiyan, R. D., Eccard, C. H., Jennings, J. R., & Crone, E. A. (2000). Dissociation of response conflict, attentional selection, and expectancy with functional magnetic reso-nance imaging. Proceedings of the National Academy of Sciences of the United States of America, 97, 8728–8733.
Catani, M., Jones, D. K., Donato, R., & Ffytche, D. H. (2003). Occipito- temporal connections in the human brain. Brain, 126, 2093–2107.
Charlton, R. A., Barrick, T. R., Lawes, I. N. C., Markus, H. S., & Morris, R. G. (2010). White matter pathways associated with working memory in normal aging. Cortex, 46, 474–489.
Chiang, M., McMahon, K. L., de Zubicaray, G. I., Martin, N. G., Hickie, I., Toga, A. W., … Thompson, P. M. (2011). Genetics of white matter de-velopment: A DTI study of 705 twins and their siblings aged 12 to 29. NeuroImage, 54, 2308–2317.
Combs-Orme, T., & Cain, D. S. (2006). Poverty and the daily lives of infants. Journal of Children & Poverty, 12, 1–20.
Czernochowski, D., Fabiani, M., & Friedman, D. (2008). Use it or lose it? SES mitigates age- related decline in a recency/recognition task. Neurobiol-ogy of Aging, 29, 945–958.
Diamond, A. (2013). Executive functions. Annual Review of Psychology, 64, 135–168.
Evans, G. W. (2004). The environment of childhood poverty. American Psy-chologist, 59, 77–92.
Evans, G. W., Gonnella, C., Marcynyszyn, L. A., Gentile, L., & Salpekar, N. (2005). The role of chaos in poverty and children’s socioemotional ad-justment. Psychological Science, 16, 560–565.
Farah, M. J., Shera, D. M., Savage, J. H., Betancourt, L., Giannetta, J. M., Brodsky, N. L., … Hurt, H. (2006). Childhood poverty: Specific associ-ations with neurocognitive development. Brain Research, 1110, 166–174.
Fjell, A. M., Walhovd, K. B., Brown, T. T., Kuperman, J. M., Chung, Y., Hagler, D. J. Jr, … Pediatric Imaging, Neurocognition, and Genetics Study (2012). Multimodal imaging of the self- regulating developing brain. Proceedings of the National Academy of Sciences of the United States of America, 109, 19620–19625.
Gianaros, P. J., Horenstein, J. A., Cohen, S., Matthews, K. A., Brown, S. M., Flory, J. D., … Hariri, A. R. (2007). Perigenual anterior cingulate mor-phology covaries with perceived social standing. Social Cognitive and Affective Neuroscience, 2, 161–173.
Gianaros, P. J., Horenstein, J., Hariri, A., Sheu, L., Manuck, S., Matthews, K., & Cohen, S. (2008). Potential neural embedding of parental social standing. Social Cognitive and Affective Neuroscience, 3, 91–96.
Gianaros, P. J., Manuck, S., Sheu, L., Kuan, D. C. H., Votruba Drzal, E., Craig, A., & Hariri, A. (2011). Parental education predicts corticostriatal func-tionality in adulthood. Cerebral Cortex, 21, 896–910.
Giedd, J. N. (2004). Structural magnetic resonance imaging of the ad-olescent brain. Annals of the New York Academy of Sciences, 1021, 77–85.
Gogtay, N., Giedd, J. N., Lusk, L., Hayashi, K. M., Greenstein, D., Vaituzis, A. C., … Thompson, P. M. (2004). Dynamic mapping of human cortical development during childhood through early adulthood. Proceedings of the National Academy of Sciences of the United States of America, 101, 8174–8179.
Hagler, D. J., Ahmadi, M. E., Kuperman, J., Holland, D., McDonald, C. R., Hal-gren, E., & Dale, A. M. (2009). Automated white- matter tractography using a probabilistic diffusion tensor atlas: Application to temporal lobe epilepsy. Human Brain Mapping, 30, 1535–1547.
Hanson, J. L., Chandra, A., Wolfe, B. L., & Pollak, S. D. (2011). Association between income and the hippocampus. PLoS ONE, 6, e18712.
Hanson, J. L., Hair, N., Shen, D. G., Shi, F., Gilmore, J. H., Wolfe, B. L., & Pol-lak, S. D. (2013). Family poverty affects the rate of human infant brain growth. PLoS One, 8, e80954.
Hart, B., & Risley, T. R. (1995). Meaningful differences in the everyday experi-ence of young american children. Baltimore, MD: ERIC.
Harvey, P., Hamlin, M., Kumar, R., & Delves, H. (1984). Blood lead, be-haviour and intelligence test performance in preschool children. Sci-ence of the Total Environment, 40, 45–60.
Hoff, E. (2003). The specificity of environmental influence: Socioeconomic status affects early vocabulary development via maternal speech. Child Development, 74, 1368–1378.
Holland, D., Kuperman, J. M., & Dale, A. M. (2010). Efficient correction of inhomogeneous static magnetic field- induced distortion in Echo Planar Imaging. NeuroImage, 50, 175–183.
Huttenlocher, J., Vasilyeva, M., Cymerman, E., & Levine, S. (2002). Language input and child syntax. Cognitive Psychology, 45, 337–374.
Huttenlocher, P. R. (1979). Synaptic density in human frontal cortex- developmental changes and effects of aging. Brain Research, 163, 195–205.
Jednoróg, K., Altarelli, I., Monzalvo, K., Fluss, J., Dubois, J., Billard, C., … Ramus, F. (2012). The influence of socioeconomic status on children’s brain structure. PLoS ONE, 7, e42486.
Jernigan, T. L., Brown, T. T., Hagler, D. J., Akshoomoff, N., Bartsch, H., Newman, E., … Kennedy, D. N. (2016). The Pediatric Imaging, Neu-rocognition, and Genetics (PING) data repository. Neuroimage, 124, 1149–1154.
Jovicich, J., Czanner, S., Greve, D., Haley, E., van der Kouwe, A., Gollub, R., … MacFall, J. (2006). Reliability in multi- site structural MRI studies: Ef-fects of gradient non- linearity correction on phantom and human data. NeuroImage, 30, 436–443.
Kantarci, K., Senjem, M. L., Avula, R., Zhang, B., Samikoglu, A. R., Weigand, S. D., … Jack, C. R. Jr (2011). Diffusion tensor imaging and cognitive function in older adults with no dementia. Neurology, 77, 26–34.
Karlsgodt, K. H., van Erp, T. G., Poldrack, R. A., Bearden, C. E., Nuechterlein, K. H., & Cannon, T. D. (2008). Diffusion tensor imaging of the superior longitudinal fasciculus and working memory in recent- onset schizo-phrenia. Biological Psychiatry, 63, 512–518.
Kennedy, K. M., & Raz, N. (2009). Aging white matter and cognition: Differ-ential effects of regional variations in diffusion properties on memory, executive functions, and speed. Neuropsychologia, 47, 916–927.
Klingberg, T., Vaidya, C. J., Gabrieli, J. D., Moseley, M. E., & Hedehus, M. (1999). Myelination and organization of the frontal white matter in children: A diffusion tensor MRI study. NeuroReport, 10, 2817–2821.
Konrad, A., Dielentheis, T. F., El Masri, D., Bayerl, M., Fehr, C., Gesierich, T., … Winterer, G. (2010). Disturbed structural connectivity is related to inattention and impulsivity in adult attention deficit hyperactivity disorder. European Journal of Neuroscience, 31, 912–919.
Kucukboyaci, N. E., Kemmotsu, N., Leyden, K. M., Girard, H. M., Tecoma, E. S., Iragui, V. J., & McDonald, C. R. (2014). Integration of multimodal MRI data via PCA to explain language performance. NeuroImage: Clinical, 5, 197–207.
Lawson, G. M., Duda, J. T., Avants, B. B., Wu, J., & Farah, M. J. (2013). Asso-ciations between children’s socioeconomic status and prefrontal corti-cal thickness. Developmental Science, 16, 641–652.
Liston, C., Cohen, M. M., Teslovich, T., Levenson, D., & Casey, B. (2011). Atypical prefrontal connectivity in attention- deficit/hyperactivity dis-order: Pathway to disease or pathological end point? Biological Psychi-atry, 69, 1168–1177.
Liston, C., Watts, R., Tottenham, N., Davidson, M. C., Niogi, S., Ulug, A. M., & Casey, B. J. (2006). Frontostriatal microstructure modulates efficient recruitment of cognitive control. Cerebral Cortex, 16, 553–560.

e00531 (12 of 13) |
Ursache and noble
Luby, J., Belden, A., Botteron, K., Marrus, N., Harms, M. P., Babb, C., … Barch, D. (2013). The effects of poverty on childhood brain develop-ment: The mediating effect of caregiving and stressful life events. JAMA Pediatrics, 167, 1135–1142.
Makris, N., Buka, S. L., Biederman, J., Papadimitriou, G. M., Hodge, S. M., Valera, E. M., … Seidman, L. J. (2008). Attention and executive systems abnormalities in adults with childhood ADHD: A DT- MRI study of con-nections. Cerebral Cortex, 18, 1210–1220.
McLoyd, V. C. (1998). Socioeconomic disadvantage and child development. American Psychologist, 53, 185–204.
Murphy, C. F., Gunning-Dixon, F. M., Hoptman, M. J., Lim, K. O., Ardekani, B., Shields, J. K., … Alexopoulos, G. S. (2007). White- matter integrity predicts stroop performance in patients with geriatric depression. Bio-logical Psychiatry, 61, 1007–1010.
National Institutes of Health Toolbox Cognition Battery (NIH Toolbox CB) (2013). Monographs of the Society for Research in Child Development, 78, 1–172.
Niogi, S. N., Mukherjee, P., Ghajar, J., Johnson, C. E., Kolster, R., Lee, H., … McCandliss, B. D. (2008). Structural dissociation of attentional con-trol and memory in adults with and without mild traumatic brain injury. Brain, 131, 3209–3221.
Noble, K. G., Farah, M. J., & McCandliss, B. D. (2006). Socioeconomic back-ground modulates cognition–achievement relationships in reading. Cognitive Development, 21, 349–368.
Noble, K. G., Grieve, S. M., Korgaonkar, M. S., Engelhardt, L. E., Griffith, E. Y., Williams, L. M., & Brickman, A. M. (2012). Hippocampal volume var-ies with educational attainment across the life- span. Frontiers in Human Neuroscience, 6, 307. doi.org/10.3389/fnhum.2012.00307
Noble, K. G., Houston, S. M., Brito, N. H., Bartsch, H., Kan, E., Kuperman, J. M., … Libiger, O. (2015). Family income, parental education and brain structure in children and adolescents. Nature Neuroscience, 18, 773–778.
Noble, K. G., Houston, S. M., Kan, E., & Sowell, E. R. (2012). Neural cor-relates of socioeconomic status in the developing human brain. Devel-opmental Science, 15, 516–527.
Noble, K. G., Korgaonkar, M. S., Grieve, S. M., & Brickman, A. M. (2013). Higher education is an age- independent predictor of white matter integrity and cognitive control in late adolescence. Developmental Sci-ence, 16, 653–664.
Noble, K. G., McCandliss, B. D., & Farah, M. J. (2007). Socioeconomic gradi-ents predict individual differences in neurocognitive abilities. Develop-mental Science, 10, 464–480.
Noble, K. G., Wolmetz, M. E., Ochs, L. G., Farah, M. J., & McCandliss, B. D. (2006). Brain- behavior relationships in reading acquisition are modulated by socioeconomic factors. Developmental Science, 9, 642–654.
Olesen, P. J., Nagy, Z., Westerberg, H., & Klingberg, T. (2003). Combined analysis of DTI and fMRI data reveals a joint maturation of white and grey matter in a fronto- parietal network. Cognitive Brain Research, 18, 48–57.
Pavuluri, M. N., Yang, S., Kamineni, K., Passarotti, A. M., Srinivasan, G., Harral, E. M., … Zhou, X. J. (2009). Diffusion tensor imaging study of white matter fiber tracts in pediatric bipolar disorder and attention- deficit/hyperactivity disorder. Biological Psychiatry, 65, 586–593.
Perkins, S. C., Finegood, E. D., & Swain, J. E. (2013). Poverty and language development: Roles of parenting and stress. Innovations in Clinical Neu-roscience, 10, 10–19.
Perry, M. E., McDonald, C. R., Hagler, D. J., Gharapetian, L., Kuperman, J. M., Koyama, A. K., … McEvoy, L. K. (2009). White matter tracts asso-ciated with set- shifting in healthy aging. Neuropsychologia, 47, 2835–2842.
Peters, B. D., Ikuta, T., DeRosse, P., John, M., Burdick, K. E., Gruner, P., … Malhotra, A. K. (2014). Age- related differences in white matter tract microstructure are associated with cognitive performance from child-hood to adulthood. Biological Psychiatry, 75, 248–256.
Pierpaoli, C., Jezzard, P., Basser, P. J., Barnett, A., & Di Chiro, G. (1996). Diffusion tensor MR imaging of the human brain. Radiology, 201, 637–648.
Preacher, K. J., & Hayes, A. F. (2008). Asymptotic and resampling strategies for assessing and comparing indirect effects in multiple mediator mod-els. Behavior Research Methods, 40, 879–891.
Raizada, R. D. S., Richards, T. L., Meltzoff, A., & Kuhl, P. K. (2008). Socio-economic status predicts hemispheric specialisation of the left inferior frontal gyrus in young children. NeuroImage, 40, 1392–1401.
Rauh, V., Whyatt, R., Garfinkel, R., Andrews, H., Hoepner, L., Reyes, A., … Perera, F. (2004). Developmental effects of exposure to environmental tobacco smoke and material hardship among inner- city children. Neu-rotoxicology and Teratology, 26, 373–385.
Ritchie, S. J., Bastin, M. E., Tucker-Drob, E. M., Maniega, S. M., Engelhardt, L. E., Cox, S. R., … Pattie, A. (2015). Coupled changes in brain white matter microstructure and fluid intelligence in later life. The Journal of Neuroscience, 35, 8672–8682.
Rueda, M. R., Fan, J., McCandliss, B. D., Halparin, J. D., Gruber, D. B., Lercari, L. P., & Posner, M. I. (2004). Development of attentional networks in childhood. Neuropsychologia, 42, 1029–1040.
Sarro, L., Agosta, F., Canu, E., Riva, N., Prelle, A., Copetti, M., … Filippi, M. (2011). Cognitive functions and white matter tract damage in amyo-trophic lateral sclerosis: A diffusion tensor tractography study. Ameri-can Journal of Neuroradiology, 32, 1866–1872.
Sarsour, K., Sheridan, M., Jutte, D., Nuru-Jeter, A., Hinshaw, S., & Boyce, W. T. (2011). Family socioeconomic status and child executive func-tions: The roles of language, home environment, and single parent-hood. Journal of the International Neuropsychological Society, 17, 120–132.
Sasson, E., Doniger, G. M., Pasternak, O., Tarrasch, R., & Assaf, Y. (2013). White matter correlates of cognitive domains in normal aging with dif-fusion tensor imaging. Frontiers in Neuroscience, 7, 1–13.
Schermuly, I., Fellgiebel, A., Wagner, S., Yakushev, I., Stoeter, P., Schmitt, R., … Beutel, M. (2010). Association between cingulum bundle structure and cognitive performance: an observational study in major depres-sion. European Psychiatry, 25, 355–360.
Shaywitz, S. E., Shaywitz, B. A., Fulbright, R. K., Skudlarski, P., Mencl, W. E., Constable, R. T., … Fletcher, J. M. (2003). Neural systems for com-pensation and persistence: Young adult outcome of childhood reading disability. Biological Psychiatry, 54, 25–33.
Sheridan, M. A., Fox, N. A., Zeanah, C. H., McLaughlin, K. A., & Nelson, C. A. 3rd (2012). Variation in neural development as a result of ex-posure to institutionalization early in childhood. Proceedings of the National Academy of Sciences of the United States of America, 109, 12927–12932.
Sheridan, M. A., Sarsour, K., Jutte, D., D’Esposito, M., & Boyce, W. T. (2012). The impact of social disparity on prefrontal function in childhood. PLoS ONE, 7, e35744.
Sirin, S. R. (2005). Socioeconomic status and academic achievement: A meta- analytic review of research. Review of Educational Research, 75, 417–453.
Skranes, J., Lohaugen, G. C., Martinussen, M., Indredavik, M. S., Dale, A. M., Haraldseth, O., … Brubakk, A. (2009). White matter abnormalities and executive function in children with very low birth weight. NeuroReport, 20, 263–266.
Sowell, E. R., Peterson, B. S., Thompson, P. M., Welcome, S. E., Henkenius, A. L., & Toga, A. W. (2003). Mapping cortical change across the human life span. Nature Neuroscience, 6, 309–315.
Sowell, E. R., Thompson, P. M., Leonard, C. M., Welcome, S. E., Kan, E., & Toga, A. W. (2004). Longitudinal mapping of cortical thickness and brain growth in normal children. Journal of Neuroscience, 24, 8223–8231.
Stern, Y. (2009). Cognitive reserve. Neuropsychologia, 47, 2015–2028.Takeuchi, H., Taki, Y., Sassa, Y., Hashizume, H., Sekiguchi, A., Fukushima,
A., & Kawashima, R. (2013). Brain structures associated with executive
Ursache and noble
| (13 of 13) e00531
functions during everyday events in a non- clinical sample. Brain Struc-ture and Function, 218, 1017–1032.
Tong, S., McMichael, A. J., & Baghurst, P. A. (2000). Interactions between environmental lead exposure and sociodemographic factors on cog-nitive development. Archives of Environmental Health: An International Journal, 55, 330–335.
Tulsky, D. S., Carlozzi, N. E., Chevalier, N., Espy, K. A., Beaumont, J. L., & Mungas, D. (2013). V. Nih toolbox cognition battery (CB): Measuring working memory. Monographs of the Society for Research in Child Devel-opment, 78, 70–87.
Ursache, A., & Noble, K. G. (2016). Neurocognitive development in socio-economic context: Multiple mechanisms and implications for measur-ing socioeconomic status. Psychophysiology, 53, 71–82.
Vestergaard, M., Madsen, K. S., Baaré, W. F., Skimminge, A., Ejersbo, L. R., Ramsøy, T. Z., … Jernigan, T. L. (2011). White matter microstruc-ture in superior longitudinal fasciculus associated with spatial working memory performance in children. Journal of Cognitive Neuroscience, 23, 2135–2146.
Weisleder, A., & Fernald, A. (2013). Talking to children matters: Early lan-guage experience strengthens processing and builds vocabulary. Psy-chological Science, 24, 2143–2152.
Wells, W. M., Viola, P., Atsumi, H., Nakajima, S., & Kikinis, R. (1996). Multi- modal volume registration by maximization of mutual information. Medical Image Analysis, 1, 35–51.
Winneke, G., & Kraemer, U. (1984). Neuropsychological effects of lead in children: Interactions with social background variables. Neuropsychobi-ology, 11, 195–202.
Zhuang, J., Hrabe, J., Kangarlu, A., Xu, D., Bansal, R., Branch, C. A., & Pe-terson, B. S. (2006). Correction of eddy- current distortions in diffusion tensor images using the known directions and strengths of diffusion gradients. Journal of Magnetic Resonance Imaging, 24, 1188–1193.
Zhuang, L., Sachdev, P. S., Trollor, J. N., Reppermund, S., Kochan, N. A., Bro-daty, H., & Wen, W. (2013). Microstructural white matter changes, not hippocampal atrophy, detect early amnestic mild cognitive impairment. PLoS ONE, 8, e58887.
SUPPORTING INFORMATION
Additional Supporting Information may be found online in the support-ing information tab for this article.
How to cite this article: Ursache, A. and Noble, K.G. for the Pediatric Imaging, Neurocognition and Genetics Study (2016), Socioeconomic status, white matter, and executive function in children. Brain and Behavior, 00: 1–13. e00531, doi: 10.1002/brb3.531