Socio-Economic/Ecological Profile 2019
86
S S o o c c i i o o - - E E c c o o n n o o m m i i c c / / E E c c o o l l o o g g i i c c a a l l P P r r o o f f i i l l e e 2019 Mangaldan, Pangasinan 1_ CHAPTER I. BRIEF HISTORY SOCIO – ECONOMIC/ECOLOGICAL PROFILE CY 2019 Mangaldan, Pangasinan 1. ETYMOLOGY There are four (4) versions as to how Mangaldan got its name. The first version relates that one day a Spanish missionary inquired from one inhabitant about the name of the place in the Spanish language. Thinking that the missionary was asking for water, the inhabitant replied “MANGA-ALAY-ADAN”, which means “Adan is fetching”. The second version states that Mangaldan got its name from the first native chief of the town named “BABALDAN”. The third version says that just at the middle of the plaza was a big mango tree laden with fruits. It was customary that anyone of the town’s inhabitants was free to gather the fruits but it resulted in quarreling among themselves. The meaning of the quarrel in the dialect is ‘MAN-NGA-NGAL-NGALAN”. Of these versions, anyone of them seems to justify the legendary origin of the name and therefore, “MANGA-ALAY-ADAN”, “BABALDAN” and “MAN-NGA-NGAL-NGALAN” when stated in plain word gave rise to “MANGALDAN”. The fourth version of how Mangaldan got its name is attributed to Fr. Raymundo Suarez, OP. In his more than a century year old manuscript “Apuntes Cureosos de Pangasinan”, it was stated that “MANGALDAN” was derived from the root word “ALAR” or “ALAD” which is interposed between the particles “MANG” and “AN”. In the Pangasinan dialect, “ALAR” or ‘ALAD” signifies a fence made of bamboo or of any similar material. However, the word is syncopated by suppressing the penultimate “A” and what remains alone is “MANGALDAN”. Mangaldan existed as a ranch in its beginning and the presence of bamboo fences in the place would have given rise to the town’s appellation which accordingly justifies Fr. Suarez’s version. (The preceding etymology of the name of Mangaldan was taken from Rev. Fr. Rafael Magno’s Historical Retrospect on the Town of Mangaldan, Pangasinan, 1600-1898). 2. CREATION OF THE MUNICIPALITY Mangaldan was formerly a cattle ranch. It gradually became populated by emigrants who divided the ranch among themselves. It was an encomienda in 1591. Its early settlers were noted for their looms, salakots and campilans. During the Spanish colonial administration, both civil and ecclesiastical communities were established. Secular administration was carried out through a hierarchy headed by the Governor-General and below him the Alcalde Mayor (governor) of every province, and the Gobernadorcillo (petty governor or municipal mayor) of every town. Ecclesiastical authority was exercised by the Archbishop of Manila at the apex and the bishoprics and parishes
Transcript of Socio-Economic/Ecological Profile 2019
SSoocciioo--EEccoonnoommiicc//EEccoollooggiiccaall PPrrooffii llee 22001199
MMaannggaallddaann,, PPaannggaassiinnaann 1_
CHAPTER I. BRIEF HISTORY
SSOOCCIIOO –– EECCOONNOOMMIICC//EECCOOLLOOGGIICCAALL PPRROOFFIILLEE
CY 2019
Mangaldan, Pangasinan
1. ETYMOLOGY
There are four (4) versions as to how Mangaldan got its name. The first version relates
that one day a Spanish missionary inquired from one inhabitant about the name of the place in
the Spanish language. Thinking that the missionary was asking for water, the inhabitant replied
“MANGA-ALAY-ADAN”, which means “Adan is fetching”.
The second version states that Mangaldan got its name from the first native chief of the
town named “BABALDAN”. The third version says that just at the middle of the plaza was a big
mango tree laden with fruits. It was customary that anyone of the town’s inhabitants was free
to gather the fruits but it resulted in quarreling among themselves. The meaning of the quarrel
in the dialect is ‘MAN-NGA-NGAL-NGALAN”. Of these versions, anyone of them seems to justify
the legendary origin of the name and therefore, “MANGA-ALAY-ADAN”, “BABALDAN” and
“MAN-NGA-NGAL-NGALAN” when stated in plain word gave rise to “MANGALDAN”.
The fourth version of how Mangaldan got its name is attributed to Fr. Raymundo Suarez,
OP. In his more than a century year old manuscript “Apuntes Cureosos de Pangasinan”, it was
stated that “MANGALDAN” was derived from the root word “ALAR” or “ALAD” which is
interposed between the particles “MANG” and “AN”. In the Pangasinan dialect, “ALAR” or
‘ALAD” signifies a fence made of bamboo or of any similar material. However, the word is
syncopated by suppressing the penultimate “A” and what remains alone is “MANGALDAN”.
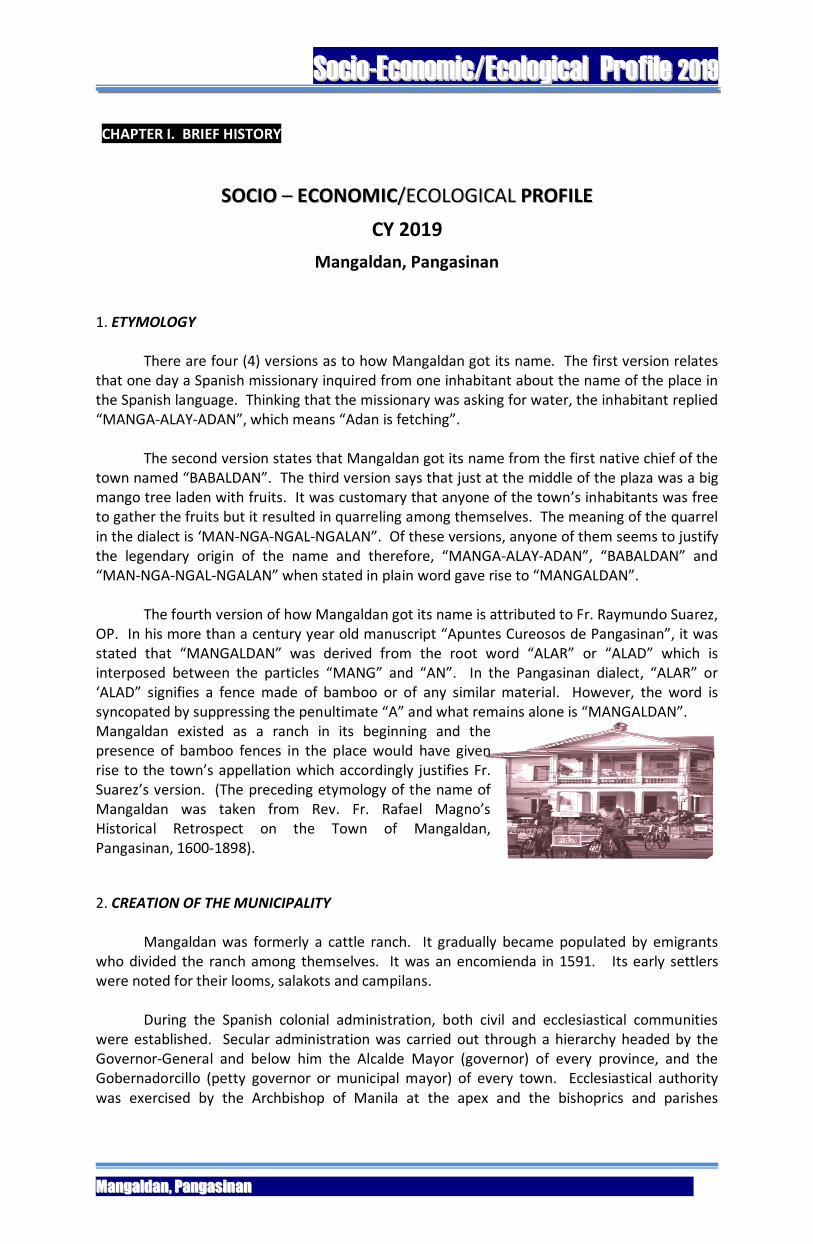
Mangaldan existed as a ranch in its beginning and the
presence of bamboo fences in the place would have given
rise to the town’s appellation which accordingly justifies Fr.
Suarez’s version. (The preceding etymology of the name of
Mangaldan was taken from Rev. Fr. Rafael Magno’s
Historical Retrospect on the Town of Mangaldan,
Pangasinan, 1600-1898).
2. CREATION OF THE MUNICIPALITY
Mangaldan was formerly a cattle ranch. It gradually became populated by emigrants
who divided the ranch among themselves. It was an encomienda in 1591. Its early settlers
were noted for their looms, salakots and campilans.
During the Spanish colonial administration, both civil and ecclesiastical communities
were established. Secular administration was carried out through a hierarchy headed by the
Governor-General and below him the Alcalde Mayor (governor) of every province, and the
Gobernadorcillo (petty governor or municipal mayor) of every town. Ecclesiastical authority
was exercised by the Archbishop of Manila at the apex and the bishoprics and parishes
SSoocciioo--EEccoonnoommiicc//EEccoollooggiiccaall PPrrooffii llee 22001199
MMaannggaallddaann,, PPaannggaassiinnaann 2_
scattered all over the islands. The parishes were manned by priests or friars representing the
five religious orders then participating in the evangelization of the Philippines.
The administration of the towns was left almost entirely in the hands of the friars. Civil
authorities in Manila could not provide enough Spaniards to serve as Municipal Mayors so the
friars often served concurrently as parish priest and Mayor. Central government authorities
were interested in the towns only as a source of tax revenue, tributes and conscripted labor.
Mangaldan displays a characteristic morphology of a typical town which the Spaniards
established out of their mission fields or oversized villages which included a central plaza. On
one side of the plaza stood the Catholic Church and on another the municipal hall. A few large
residences owned by wealthy families, a market place, rectangular residential blocks where the
native principalia and other landowners resided made up the urban area called Poblacion.
Encircling this Zone which consisted of dispersed houses belonging to the landless tenants
constituted the rural hinterland. The rural dwellers were advised by Spanish law to reside near
the church due to the importance of the church in the lives of the people.
The town of Mangaldan is one of the oldest towns in the province of Pangasinan.
Historical documents relate that it was actually the third parish (after Binalatongan and
Calasiao) founded by the Dominican Missionaries. The founding of Mangaldan as a parish was
attributed to Fr. Juan Sto. Domingo, although the exact date remains uncertain. It could be
deduced, however, from historical documents that it was founded in June, 1600 when
Mangaldan was accepted as a new parish in the vicariate of the Dominican Provincial Chapter.
Placed under the patronage of one of the Dominican Order’s greatest glories St. Thomas
Aquinas, it became one of the Archdiocese’s most important parishes. It became the first
Vatican Parish in the province in 1947 when one of its former parish priests, Fr. Juan C. Sison
was appointed by then Pope Pious XII as the titular bishop of Limata and auxiliary bishop of the
Archdiocese of Nueva Segovia.
Brief Histories of the Thirty Barangays
Alitaya
There are two versions as to the naming of this barrio.
First version. There was a sitio in the barrio called Perlan which was the center of pot
makers in the whole town. The best shop was Aling Taya’s. Aling Taya molded quality
pots demanded by even the most sophisticated kitchenware buyers in those days. Not
long thereafter, the natives wanted a name to call their place. They used the name of
Aling Taya. Soon enough, the name stuck but due to the slip and wear of the native
tongue, they shortened the word to just plain Alitaya.
Second version. In those days, this barrio had no school. The nearest school was in
Gueguesangen which was about two kilometers away. So the children of the barrio had
to walk that distance every school day. As a result, schoolchildren often came late for
their classes. Concerned barrio talks would say “A-lit aya” which means that the child is
already late. Soon enough, the words became a byword, and it was even used to name
the place.
SSoocciioo--EEccoonnoommiicc//EEccoollooggiiccaall PPrrooffii llee 22001199
MMaannggaallddaann,, PPaannggaassiinnaann 3_
Amansabina
There was a widow, who due to sudden death of her husband had to bear the burden of
rearing her children. She had to do odd chores intended only for a father. After several
years, this woman had acquired the attributes of a man. Her name was Sabina.
Sabina could outdo any man in any physical prowess contest. Thus, when she died the
barrio folks named their place Sabina. Not long thereafter, the barrio folks realized that
they should emphasize the role of Sabina when she was still alive. Thus, they prefixed
the word Ama meaning father to her name Sabina. Then the place was finally named
Amansabina.
Anolid
A sturdy tree used to abound in the forested area of this old barrio. The wood of the
tree was hard and fine that the barrio folks found it a perfect material for building their
houses. This tree called “Anolir” perhaps held a special meaning to the barrio folks, that
they named the place Anolir. Difficulty in pronouncing the last syllable converted this
word into Anolid. Thus, the place was known as Anolid.
Banaoang
Before the turn of the century, the Spanish embarked on a massive digging of canals for
irrigation purposes. Mangaldan was then one of the few irrigated areas in the province.
In this barrio, extension canals were built. Canal means Banaoang in the dialect.
Perhaps, due to the presence of these canals, the barrio folks began calling their place
Banaoang.
Bantayan
There used to be a body of water which ran through Bantayan, Talogtog and finally to
the sea. It was a river, deep and wide enough to afford perfect navigation.
In those days, Chinese junk dealers used to sail to this place to barter for the goods of
the natives. Bantayan then was a sort of trading center. The arrival of these Chinese
junks was eagerly anticipated and in order that the natives would not be caught
unaware of their arrival, they maintained a vigil even at night. Thus, vigil which means
Bantay and the suffix,” an” to denote a place, was made to be the name of this trading
center, Bantayan.
Bari
Bari (Bari of old) was a wilderness. Big trees and mounds abound, which the old folks
believed to be inhabited by unseen creatures. It was the belief that if you disturbed or
molested these creatures, you would get sick, so if you passed by their habitat you had
to ask their permission. The natives had to say “bari-bari, paliis kid tan bai, laki, ta siak so
apo yon dili”. The sentence was long and surely the natives could not say the whole
sentence at the spur of the moment. So they just said “Bari-bari.’ The Bari stuck to the
native tongue. Soon after, they began calling the place Bari.
SSoocciioo--EEccoonnoommiicc//EEccoollooggiiccaall PPrrooffii llee 22001199
MMaannggaallddaann,, PPaannggaassiinnaann 4_
Bateng
During the Spanish regime, a miraculous Virgin appeared in the barrio. The natives being
hardened pagans did not believe in the Christian Doctrine of the Spaniards. So when the
Virgin appeared, they tried to capture her with a rope. They shouted, “Bateng yoy
Birhen” and that incident was a big scandal. Eventually, people from other places
referred to that place as Bateng.
Buenlag
There are two versions as to how Barangay Buenlag got its name.
First Version. Natives of old Buenlag were said to be hostile to strangers. If a stranger
attempts to visit this place, he ran the risk of sporting a ‘black eye.’ Parents dissuaded
their sons from visiting the place, but if the visit was unavoidable, they cautioned them
saying “asicasom ditan ta ompano nabanaan mon binmenlag so kenan da et kalasianen
da ka”, meaning careful son, the timing of your visit may be wrong and you may get
yourself into trouble. Hence, the barrio became a dreaded place, Buenlag which means
“negative approach” was made to refer to this barrio.
Second Version. In the older days, there used to be a river in this place. This is now the
Mangaldan-Mapandan Road. This was used as the fastest means of transportation by
the barrio folks. Along the river were big, centuries-old trees. One time, a strong
earthquake struck the place and the big trees fell across the river, ‘binmenlag ed ilog’.
As a result, people could not pass through the river. It took a long time for the people to
remove the trees. To commemorate the incident the people called the place Buenlag.
David
In the later part of the 19th century, this barrio had a chieftain named Juan David. This
man was well-acclaimed for his exemplary leadership and extraordinary physical
prowess. Even the Spanish authorities had high regards for this man that before the turn
of the century, he was made Reign-Alcalde of the town in 1899.
As a distinguished son of the barrio, his name was generated by his people by naming
the place barrio David.
Embarcadero
During the Spanish regime, the Angalacan river was the only commercial route for
transportation, good roads being non-existent. Chinese junks and native boats used to
ply this route to transport their products and wares.
Because of its proximity to Poblacion, and location along the riverbank, the place was
converted into a port. Merchants from other areas disembarked their wares in the port
to be sold in the market in Poblacion.’
Since many kinds of “barco” anchor in this port, the place eventually became known as
Embarcadero.
SSoocciioo--EEccoonnoommiicc//EEccoollooggiiccaall PPrrooffii llee 22001199
MMaannggaallddaann,, PPaannggaassiinnaann 5_
Gueguesangen
During the time of the native chieftain Casipit, there was a small body of water that cuts
through the barrio. This creek extended as far south as Sta. Barbara. Water abundantly
flowed through this creek that eventually each side of the bank eroded. The native
would say their place was “Gueguesangen na danum” meaning their place was being
divided by the creek. Consequently, Gueguesangen came to be the name of the barrio.
Guesang
Guesang was once a part of David. A big earthquake in 1500 created a large fissure
which became the Inirangan Creek. The wide creek divided the compact territory of
what was then barrio David. So the place on the other side of the creek became
isolated. The inhabitants, wanting to have a barrio of their own named the place
Guesang, meaning divided by a mighty and divine force.
Guiguilonen
There are two versions as to how Guiguilonen got its name.
First Version. The barrio used to be a swampy area. Freshwater fish like mudfish and
hito used to abound in the place. These species of fish are very slippery and burrow in
the mud, thus making it difficult to catch them. Hence, the people resorted to a method
to catch these fishes through a fish pen or “sikop”. A “sikop” is a sort of a native net
made of woven bamboo sticks. Native folks would say, “Guiguilonen da ray sira” which
means the fishes are being gathered in one place by means of the “sikop” to easily catch
them. All year round, people in the place and adjoining areas came to the barrio and
used the method to catch fish. In time, they called the place Guiguilonen.
Second Version. This barrio used to be a thickly populated area, next only to Poblacion
in density. The barrio folks were fun-loving and used to watch zarzuelas and other
events held in the auditorium. This led other folks who were usually shoved out by the
Guiguilonen folks away from the vantage point to comment in disgust “Singara
guiguilonen ya sira” meaning they were like fish caught en masse. Thus, they branded
the people as Guiguilonen, and eventually their barrio as such.
Guilig
The barrio used to be a part of Poblacion. Later, it became a separate and distinct
barrio. It is located in the western part of the town adjoining the Poblacion. It is also
adjacent to the cemetery. Adjacent in the dialogue means “Guilig”. Thus, the barrio came to be known as “Guilig”.
Inlambo
The major agricultural products of the barrio by the edge of Angalacan River are camote,
corn and peanuts. The Sandy soil was perfect for these kinds of crops. It is best known
even today that boiled camote, peanuts and corn are delicacies that sell like hot cakes in
the market. “Masamit so inlambong ya mais”, meaning boiled corn tastes sweet.
SSoocciioo--EEccoonnoommiicc//EEccoollooggiiccaall PPrrooffii llee 22001199
MMaannggaallddaann,, PPaannggaassiinnaann 6_
Natives boiled their food even during barrio banquets and they served their guests
boiled camote, corn and peanuts.
Due to this practice, (the natives, not knowing any better than boil their food) people in
adjoining areas began referring to this barrio as Inlambong which was later reduced to
just plain Inlambo.
Lanas
In the Pangasinan language, the word “alanas” refers to a bamboo pole, which is cut off
its leaves and long spikes and left with just enough hard branches that can be used as
foothold. This was the age before cranes and iron ladders and the bamboo pole was
used as a ladder. It was most commonly used in climbing tall “silag” trees where they
would get “sinamit” (liquid sugar). There was this little place in Mangaldan where “silag”
trees used to abound. Thanks to the ingenuity of the natives, the “alanas” was used to
climb these tall trees. People from other places would go to this place not only to buy
“sinamit” but also to buy “alanas” for their own use.
The name “alanas” stuck to this place until it evolved into what it is called now, Lanas.
Landas
During the Spanish regime, an epidemic broke out. Many people died. This barrio was
the most affected in the town. More than half of the population perished and coffins
were sadly lacking. So they had to assemble improvised coffins called “Andas”. Andas
was made of bamboo sticks intricately wooden.
The place became famous in the making of “andas” that later they referred to the barrio
as “andas”. A prefix “L” was added so as to remove the dreaded connotation of the
word thus the name Landas.
Maasin
This barrio was named after an old and still existing salt-making industry. Maasin is a
Pangasinan word which means an abundance in salt. Even today, through a seasonal
home industry, majority of the barrio’s population are still engaged in salt-making,
hence the name Maasin.
Macayug
Before the coming of the Spaniards, coconut trees abound in this barrio. Natives made a
living out of coconut trees alone. It was an easy way to make a living for natives because
coconut trees required minimum care or none at all. Then the Spaniards came. They
found the natives idling the hours away. They had nothing better to do than sleep. So
the Spaniards summoned the native chieftain and told him to convince the natives to
clear some areas, to be planted with some other crops, which were brought by the
Spaniards. The chieftain agreed.
But long after the Spaniards had left, the coconut trees still stood. People in adjacent
barrios noted with dismay the natives’ adamant attitude “Macaniyug irad tan so totoo”.
SSoocciioo--EEccoonnoommiicc//EEccoollooggiiccaall PPrrooffii llee 22001199
MMaannggaallddaann,, PPaannggaassiinnaann 7_
Thus, the place came to be known as Macaniyug and much later due to the slip and
wear of native tongue dropped the “ni” and reduced it to just plain Macayug.
Malabago
In the olden times, this barrio was a thickly forested area. In the heart of the barrio, a
big and robust tree stood prominent. Its obtuse leaves were used to welcome unwanted
guests in the barrio.
Old folks say, that during special barrio occasions, unwanted guests far outnumbered
the invited ones. In order to determine the uninvited guests, a mischievous trick was
employed.
Natives said that if a stranger stepped over a leaf of the tree, the stranger would emit a
rapid burst of foul air. The stranger would surely blush to shame. So that during big
barrio banquets, natives would assemble to climb the big tree to break a branch of
leaves to be placed secretly at their doorsteps.
The name of that big tree, now extinct was Malabago. Perhaps that tree held a special
meaning to the natives that in due time, they were calling their barrio Malabago. Thus,
the barrio came to be known as Malabago.
Navaluan
At one time in the history of the barrio, more than half of the married woman were
widows. It was the belief during those days that it was not advisable for a married
woman to visit that place because if she persisted it would not be long when she herself
became a widow.
Thus, the barrio became a dreaded place for married couples. “Navaloca no onlacad
tan” so they said, meaning you will become a widow if you go there. Hence, Navalo and
a suffix of “an” to denote a place came to be the name of the barrio, Navaluan.
Nibaliw
There used to be an old river, tributary of the Angalacan River which was located in the
present location of Mangaldan Central School, passing through the Romana Peanut
Brittle Building Site, extending up to the barrios of Tebag, Salaan and Bantayan and
finally making its way to the sea in San Fabian. Chinese junks used to frequent the place
to barter their goods with the native products.
The place just across the river was named “Nibaliw” by the people since one had to
cross it in a banca before reaching the place.
Osiem
During the pre-Spanish era, a native chieftain named Osem ruled this barrio. When the
Spaniards arrived in the 1600’s, a Spanish Missionary went to the place and asked a
native who their ruler is, and the native answered Osem. Thus, the Spaniards referred to
this place as Osiem. Slip of the native’s tongue led to the name Osiem.
SSoocciioo--EEccoonnoommiicc//EEccoollooggiiccaall PPrrooffii llee 22001199
MMaannggaallddaann,, PPaannggaassiinnaann 8_
Palua
There was once a datu who ruled over his subjects very kindly and compassionately. He
loved his people as much as they loved him. When he died, the people were
heartbroken. Men and women, young and old came to pay their last respects as they
wept hard.
So it was not unusual that such conversations as the following would be heard:
“Nialara’y man-palua”. (Here come people who will shed tears.) Nanlapuan yo? (Where
did you go?) Nan-palua. ([here] where we shed tears.)
Soon after, the place was referred to as Palua.
Poblacion
Before the arrival of the Spaniards in the country, the Filipinos did not constitute a single
nation or single state. What existed in the Archipelago were distinct states or political
units known as barangays. When the Spanish Missionaries came, they formed “pueblos”
out of the barangays. These are equivalent to municipalities today. The center of the
town was called Poblacion and we have maintained that name up to now. In each town
or municipality, the center area where we usually find the parish church offices of the
municipal officials, the central school, market, plaza and other important offices, is
called Poblacion.
Pogo
Once upon a time, this part of Mangaldan was a hunting ground for quail or pogo.
People went hunting as a sport as well as to catch the small birds for food. Before long,
people from other places went there, too. Children enjoyed gathering quail eggs which
are delicious when boiled or mixed with other delicacies.
Thus, the barrio earned the name Pogo.
Salaan
There was no record of the formal beginning of Brgy. Salaan, but it was believed that
this was established during the Spanish Era. The first settlers of Salaan were the Ilocanos
from La Union and Tarlac.
The name Salaan is an Ilocano word meaning “a place to dance” or a place where socials
are usually held.
Old folks in the barangay say that during the Spanish Times, the place was the gathering
area of people looking for entertainment. There used to be a place in the Barangay
where a dance was usually held. Ladies accompanied by their fathers usually went to
the place, where gentlemen were required to purchase a ticket in exchange for a dance
with the ladies. The number of ticket purchase was also the number of times the
gentlemen were allowed to dance. The fathers of the ladies acted as bodyguards as well as collectors of the tickets.
The place was eventually called Salaan, a place to dance.
SSoocciioo--EEccoonnoommiicc//EEccoollooggiiccaall PPrrooffii llee 22001199
MMaannggaallddaann,, PPaannggaassiinnaann 9_
Salay
According to the barrio folks, this part of Mangaldan used to be a commercial center
famous for selling dried fish called “salay”.
People who wanted good-quality salay usually went to this place. Thus, the place was
eventually named Salay.
Talogtog
Long, long ago, when Chinese traders monopolized the local commerce and trade, the
natives always looked forward to their coming. It was a chance for them to buy or trade
the things they needed but could not find in their place and also an opportunity to sell
their own products to the Chinese. These boat-sailing Chinese traders used to land in
Binloc, travel through Bateng and to this place whichwe now call Talogtog.
When the traders came, the men would beat on their drums or “taltagan” to let the
people know. And the men would continue beating on their drums for some time, until
even people from other places had come. When this happened, the children would
chant to the beat of the drums, saying, “Tog-Tog-Tog! Matalakotog! Talogtog!”
And that was how the place earned the name Talogtog.
Tebag
Once upon a time, the Angalacan river, which was then filled with fresh, clear water,
flew smoothly from Embarcadero winding its way to the place now called Tebag. As the
years passed, the riverside was slowly eroded. So, the natives referred to it as “dalin ya
atebag!” (Eroded land) When someone from a distance would ask, “Iner so laenmo?”
(Where are you going?) “Dimada tebag.” (From the place which was eroded by the
river.) Soon, the place was referred to as Tebag.
3. POLITICAL DEVELOPMENT
The people of Mangaldan figured actively in several revolts against Spain. Sometime, in
1660-1661, Mangaldan became the seat of the rebel kingdom of Andres Malong after
Binalatongan fell in the hands of the Spanish forces. In 1762, the inhabitants participated in the
revolt led by Juan dela Cruz Palaris. Again when the Philippine Revolution broke out, many
joined the forces of General Emilio Aguinaldo.
The political evolution of Mangaldan has been greatly shaped by Spaniards who ran the
affairs of the town. In 1727 Mangaldan was a Spanish pueblo and Mapandan was annexed to it
as a Barrio from 1903-1908. It was also in 1727 when a decree was issued by the Spanish
authorities, which allowed Filipinos a hand in running the affairs of the local governments. Don
Santiago Senen was appointed chief executive with the title of “Kapitan Basal” or town
executive.
From 1727 – 1896, a period of 170 years, there were 152 Capitan Basal who got their
appointments from 62 Padre Curas. Each Capitan Basal served only for a term of one year and
then reappointed, if found good. From 1877 to 1896, the term of office was increased to two
years without reappointment. By 1897, the Spanish rule in Mangaldan ended due to the
Revolution that broke out.ton has its distinguished sons in the field of politics in the persons of:
SSoocciioo--EEccoonnoommiicc//EEccoollooggiiccaall PPrrooffii llee 22001199
MMaannggaallddaann,, PPaannggaassiinnaann 10_
the late Atty. Bernabe Aquino Provincial Governor of Pangasinan 1928-1931 CFI Judge of Tarlac, 1960s the late Dr. Jose L. de Guzman Congressman of the 3rd District 1950-1953 Member, Provincial Board 1946-1949 Delegate, Philippine Constitutional Convention of 1935 the late Atty. Eugenio Estayo Member, Provincial Board 1922-1925
the late Atty. Emiliano L. Abalos Member, Provincial Board Delegate, Philippine Constitutional Convention of 1970-1971
the late Atty. Teofilo Cabrera Member, Provincial Board 1952 – 1954.
the late Atty. Adriatico Golea Member, Provincial Board 1959-1963
the late Atty. Luis E. Serafica, Sr. Member, Provincial Board 1984-1987; 1988-1992
Atty. Manuel D. Ancheta Member, Provincial Board 2001-2004; 2004-2007
The following are the chief executives of the town:
Reign – Capitan Basal (1727 – 1821) 1727: Don Santiago Senen 1728: Don Juan dela Cruz 1729: Don Juan Bautista 1730: Don Pedro Casipit 1731: Don Juan de Ocampo 1732: Don Pedro Casipit 1733: Don Santiago Casipit 1734: Don Domingo de Guzman
1735: Don Juan dela Cruz 1736: Don Domingo de Guzman
1737: Don Pedro Casipit 1738: Don Alfonso Mateo 1739: Don Luis Lomboy 1740: Don Lorenzo de Vera 1741: Don Domingo dela Masa 1742: Don Domingo de Guzman
1743: Don Tomas Ventura 1744: Don Jose dela Cruz 1745: Don Domingo de Guzman
1746: Don Domingo Gervacio 1747: Don Miguel Fabia 1748: Don Esteban Satyan 1749: Don Mateo David 1750: Don Domingo de Guzman
1751: Don Lorenzo Lazaro 1752: Don Martin Fernandez 1753: Don Manuel Salvador
1754: Don Francisco Peteti 1755: Don Domingo dela Masa 1756: Don Domingo de Guzman
1757: Don Manuel Fabia 1758: Don Bernardo de Vera 1759: Don Pedro Jimenez 1760: Don Lorenzo Lazaro 1761: Don Lorenzo Lazaro 1762: Don Francisco Antonio 1763: Don Pascual dela Cruz 1764: Don Luis Enrique David 1765: Don Luis Enrique David 1766: Don Alfonso Matoo 1767: Don Francisco Antonio 1768: Don Alfonso Mateo Caramat
1769: Don Juan de Vera 1770: Don Juan Amansec 1771: Don Luis Enrique David 1772: Don Melchor Lomboy 1773: Don Domingo dela Cruz 1774: Don Bartolome de Vera Masa 1775: Don Jordan Tambaoan 1776: Don Luis Fernandez 1777: Don Pascual Lomboy
1778: Don Julian de Guzman 1779: Don Domingo Soriano 1780: Don Pascual Lomboy 1781: Don Juan Amansec 1782: Don Bartolome de Vera
Masa
1783: Don Fulgencio Caramat 1784: Don Bernardo Lazaro 1785: Don Bartolome V. Masa 1786: Don Manuel de Vera 1787: Don Gabriel de Guzman 1788: Domingo dela Cruz 1789: Don Domingo Amansec 1790: Don Domingo dela Cruz 1791: Don Juan de Vera Masa 1792: Don Vicente Casupang
The town has its distinguished sons in the field of politics in the persons of:
SSoocciioo--EEccoonnoommiicc//EEccoollooggiiccaall PPrrooffii llee 22001199
MMaannggaallddaann,, PPaannggaassiinnaann 11_
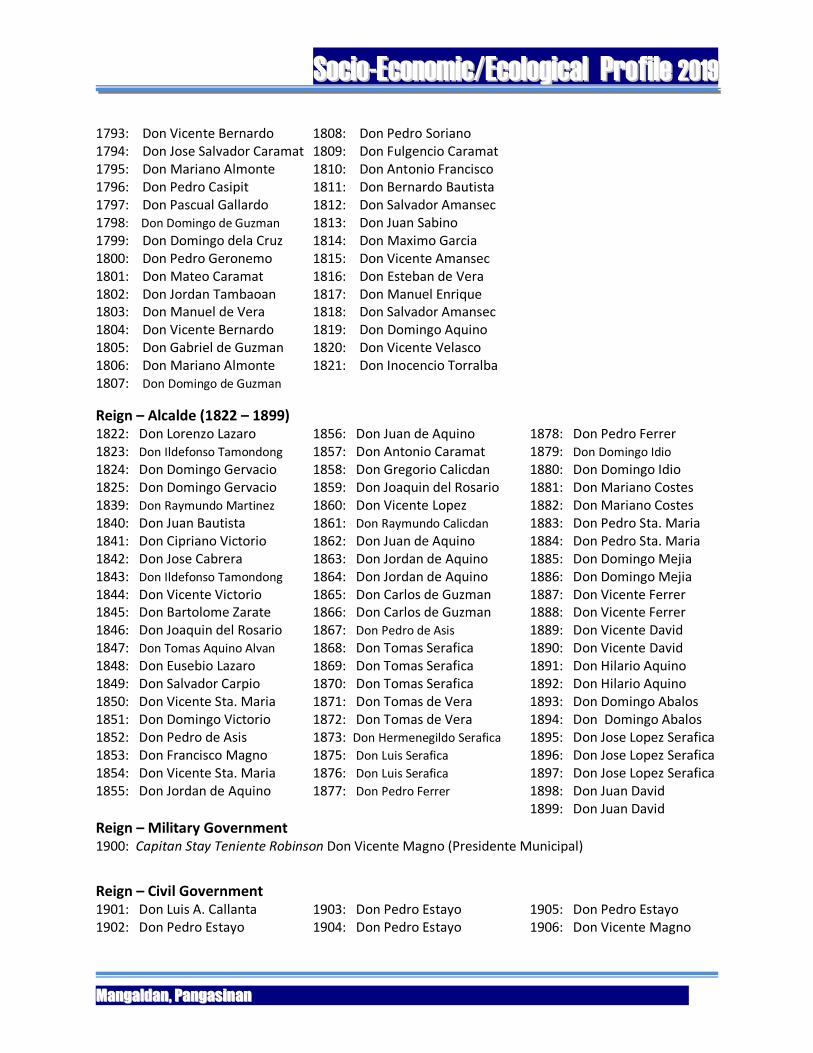
1793: Don Vicente Bernardo 1794: Don Jose Salvador Caramat 1795: Don Mariano Almonte 1796: Don Pedro Casipit 1797: Don Pascual Gallardo 1798: Don Domingo de Guzman
1799: Don Domingo dela Cruz 1800: Don Pedro Geronemo 1801: Don Mateo Caramat 1802: Don Jordan Tambaoan 1803: Don Manuel de Vera 1804: Don Vicente Bernardo 1805: Don Gabriel de Guzman 1806: Don Mariano Almonte 1807: Don Domingo de Guzman
1808: Don Pedro Soriano 1809: Don Fulgencio Caramat 1810: Don Antonio Francisco 1811: Don Bernardo Bautista 1812: Don Salvador Amansec 1813: Don Juan Sabino 1814: Don Maximo Garcia 1815: Don Vicente Amansec 1816: Don Esteban de Vera 1817: Don Manuel Enrique 1818: Don Salvador Amansec 1819: Don Domingo Aquino 1820: Don Vicente Velasco 1821: Don Inocencio Torralba
Reign – Alcalde (1822 – 1899) 1822: Don Lorenzo Lazaro 1823: Don Ildefonso Tamondong
1824: Don Domingo Gervacio 1825: Don Domingo Gervacio 1839: Don Raymundo Martinez
1840: Don Juan Bautista 1841: Don Cipriano Victorio 1842: Don Jose Cabrera 1843: Don Ildefonso Tamondong
1844: Don Vicente Victorio 1845: Don Bartolome Zarate 1846: Don Joaquin del Rosario 1847: Don Tomas Aquino Alvan
1848: Don Eusebio Lazaro 1849: Don Salvador Carpio 1850: Don Vicente Sta. Maria 1851: Don Domingo Victorio 1852: Don Pedro de Asis 1853: Don Francisco Magno 1854: Don Vicente Sta. Maria 1855: Don Jordan de Aquino
1856: Don Juan de Aquino 1857: Don Antonio Caramat 1858: Don Gregorio Calicdan 1859: Don Joaquin del Rosario 1860: Don Vicente Lopez 1861: Don Raymundo Calicdan
1862: Don Juan de Aquino 1863: Don Jordan de Aquino 1864: Don Jordan de Aquino 1865: Don Carlos de Guzman 1866: Don Carlos de Guzman 1867: Don Pedro de Asis
1868: Don Tomas Serafica 1869: Don Tomas Serafica 1870: Don Tomas Serafica 1871: Don Tomas de Vera 1872: Don Tomas de Vera 1873: Don Hermenegildo Serafica
1875: Don Luis Serafica
1876: Don Luis Serafica
1877: Don Pedro Ferrer
1878: Don Pedro Ferrer 1879: Don Domingo Idio
1880: Don Domingo Idio 1881: Don Mariano Costes 1882: Don Mariano Costes 1883: Don Pedro Sta. Maria 1884: Don Pedro Sta. Maria 1885: Don Domingo Mejia 1886: Don Domingo Mejia 1887: Don Vicente Ferrer 1888: Don Vicente Ferrer 1889: Don Vicente David 1890: Don Vicente David 1891: Don Hilario Aquino 1892: Don Hilario Aquino 1893: Don Domingo Abalos 1894: Don Domingo Abalos 1895: Don Jose Lopez Serafica 1896: Don Jose Lopez Serafica 1897: Don Jose Lopez Serafica 1898: Don Juan David 1899: Don Juan David
Reign – Military Government 1900: Capitan Stay Teniente Robinson Don Vicente Magno (Presidente Municipal)
Reign – Civil Government 1901: Don Luis A. Callanta 1902: Don Pedro Estayo
1903: Don Pedro Estayo 1904: Don Pedro Estayo
1905: Don Pedro Estayo 1906: Don Vicente Magno
SSoocciioo--EEccoonnoommiicc//EEccoollooggiiccaall PPrrooffii llee 22001199
MMaannggaallddaann,, PPaannggaassiinnaann 12_
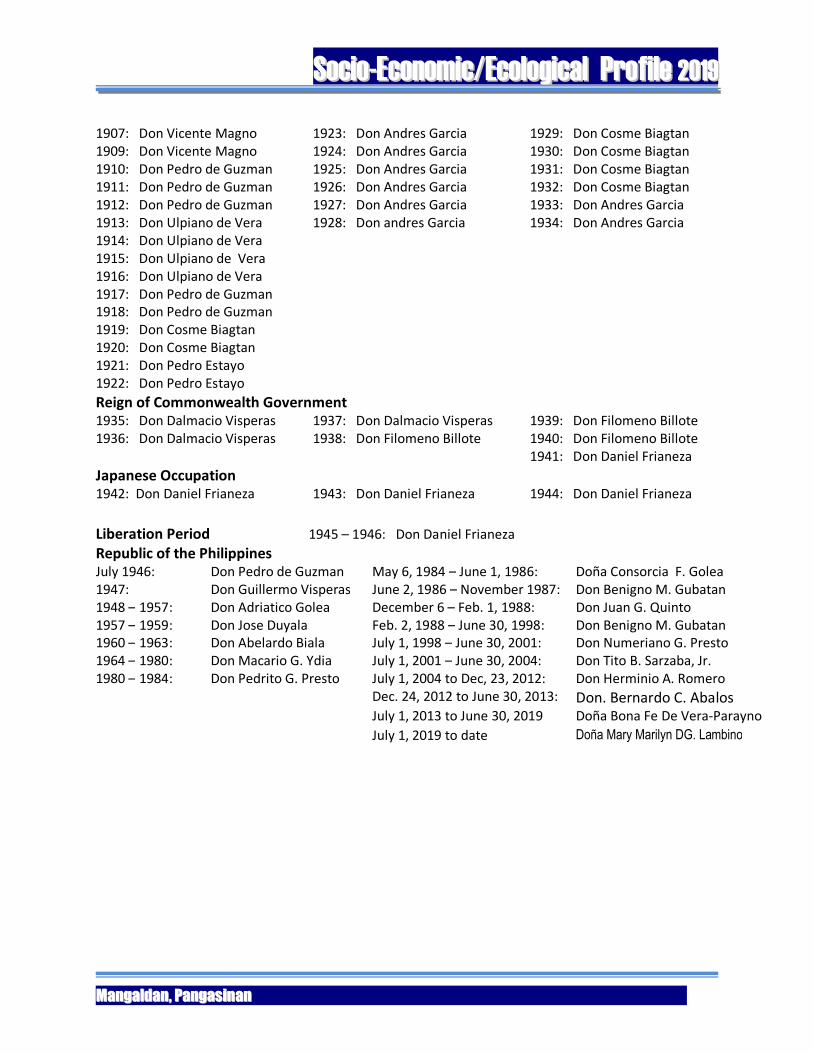
1907: Don Vicente Magno 1909: Don Vicente Magno 1910: Don Pedro de Guzman 1911: Don Pedro de Guzman 1912: Don Pedro de Guzman 1913: Don Ulpiano de Vera 1914: Don Ulpiano de Vera 1915: Don Ulpiano de Vera 1916: Don Ulpiano de Vera 1917: Don Pedro de Guzman 1918: Don Pedro de Guzman 1919: Don Cosme Biagtan 1920: Don Cosme Biagtan 1921: Don Pedro Estayo 1922: Don Pedro Estayo
1923: Don Andres Garcia 1924: Don Andres Garcia 1925: Don Andres Garcia 1926: Don Andres Garcia 1927: Don Andres Garcia 1928: Don andres Garcia
1929: Don Cosme Biagtan 1930: Don Cosme Biagtan 1931: Don Cosme Biagtan 1932: Don Cosme Biagtan 1933: Don Andres Garcia 1934: Don Andres Garcia
Reign of Commonwealth Government 1935: Don Dalmacio Visperas 1936: Don Dalmacio Visperas
1937: Don Dalmacio Visperas 1938: Don Filomeno Billote
1939: Don Filomeno Billote 1940: Don Filomeno Billote 1941: Don Daniel Frianeza
Japanese Occupation 1942: Don Daniel Frianeza
1943: Don Daniel Frianeza
1944: Don Daniel Frianeza
Liberation Period 1945 – 1946: Don Daniel Frianeza
Republic of the Philippines July 1946: Don Pedro de Guzman May 6, 1984 – June 1, 1986: Doña Consorcia F. Golea 1947: Don Guillermo Visperas June 2, 1986 – November 1987: Don Benigno M. Gubatan 1948 – 1957: Don Adriatico Golea December 6 – Feb. 1, 1988: Don Juan G. Quinto 1957 – 1959: Don Jose Duyala Feb. 2, 1988 – June 30, 1998: Don Benigno M. Gubatan 1960 – 1963: Don Abelardo Biala July 1, 1998 – June 30, 2001: Don Numeriano G. Presto 1964 – 1980: Don Macario G. Ydia July 1, 2001 – June 30, 2004: Don Tito B. Sarzaba, Jr. 1980 – 1984: Don Pedrito G. Presto July 1, 2004 to Dec, 23, 2012: Don Herminio A. Romero
Dec. 24, 2012 to June 30, 2013: Don. Bernardo C. Abalos July 1, 2013 to June 30, 2019 Doña Bona Fe De Vera-Parayno
July 1, 2019 to date Doña Mary Marilyn DG. Lambino
Socio-Economic/ Ecological Profile|2019
MMaannggaallddaann,, PPaannggaassiinnaann 13
July 1946: Don Pedro de Guzman 1947: Don Guillermo Visperas 1948 – 1957: Don Adriatico
Golea 1957 – 1959: Don Jose Duyala 1960 – 1963: Don Abelardo Biala 1964 – 1980: Don
Macario G. Ydia 1980 – 1984: Don Pedrito G. Presto May 6, 1984 – June 1, 1986: Doña
Consorcia F. Golea June 2, 1986 – November 1987:Hon.Benigno M. Gubatan December 6 –
February 1, 1988:Hon. Juan G. Quinto February 2, 1988 – June 30, 1998: Hon. Benigno M.
Gubatan July 1, 1998 – June 30, 2001: Hon. Numeriano G. Presto July 1, 2001 – June 30, 2004:
Hon. Tito B. Sarzaba, Jr. July 1, 2004 to December 23, 2012: Hon. Herminio A. Romero
December 24, 2012 – June 30, 2013: Hon. Bernardo C. Abalos July 1, 2013 to date: Hon. Bona Fe
De Vera – Parayno
It was after the declaration of martial law and the 1986 EDSA revolution that the town
experienced an unprecedented growth in its income. This may be brought about by the
enactment of legislation which made the local government units a shot in the arm. Among
these regulations are: Presidential Decree No. 231 as amended known as the Local Tax Code
providing for the local government units to create/levy taxes subject to the limitations set by
law; Presidential Decree No. 464 otherwise known as the Real Property Tax Code; and
Presidential Decree No. 477 known as Local Fiscal Administration Code. These laws were
intended to enable the local governments develop into self-reliant communities and able
partners of the national government in development.
In 1973, the town was classified as a third class municipality and became 2nd Class with
an average income of P2 Million in 1982. In the 1996 reclassification of municipalities,
Mangaldan attained a 2nd class stature, having attained an annual average income of
P18million from 1992 to 1995 as contained in the Department of Finance Department Order
No. 24-97. Its growth may be attributed to the able leaders/officials who are dedicated to
make the municipality a premier town of Pangasinan.
4. SOCIO-CULTURAL DEVELOPMENT
Based on historical accounts of the municipality, the Spanish Friars had a hard time
convincing and converting the inhabitants of Mangaldan to the Christian Faith. Once converted
however, they became ardent followers of the faith until today.
Mangaldan had its best years in the field of arts and music in the early 1900’s when
several of its sons and daughters were famous Zarzuela producers and performers. Juan
Biason, a noted playwright and businessman, produced a number of zarzuelas reflecting the
existing conditions of the times and were staged in the province and the neighboring provinces
of Tarlac and Pampanga. His writings however were destroyed when his house was burned
down in the 1930’s. Another Mangaldanian in the person of Claudio Gonzales wrote and
composed zarzuela music. One of his famous works was the translation of the Pambansang
Awit into the Pangasinan dialect.
Mangaldan excelled in having among its inhabitants creative composers, conductors and
famous musicians that in the 1900’s up to the 30s in the persons of Mariano Evangelista,
Tranquilino Caballero, Claudio Gonzales, Juan Aquino and Mariano Aquino. Two well known
Orchestras came about, the “Orchestra Biason” and “Orchestra Biagtan”. Both were in demand
as far as the Ilocos and the southern provinces. In the 1950’s these were succeeded by the Blue Eagle Orchestra of Domingo Lomibao and the Loyal Orchestra of Don Filomeno Billote which
were no less in great demand and popularity. The Blue Eagle later became the Blue Eagle
Swingsters with Melecio Cabrera, Domingo Rivera, Lorenzo Cachola and Edie Montes as
successive conductors.
Socio-Economic/ Ecological Profile|2019
MMaannggaallddaann,, PPaannggaassiinnaann 14
Mangaldan is one of the very few towns of Pangasinan with a patriotic song of its own.
Rafael Magno composed the Loyalty Song, “Logor ed Baley’ based on the English lyrics written
by Ernesto Serote, which was one of the pieces winning a major prize in a songwriting contest
sponsored by the Municipal Council in 1974 in Commemoration of the 375th foundation
anniversary of Mangaldan as a parish.
Demetrio Gonzales, a son of composer Claudio Gonzales and a creative music lover
composed both the music and lyrics in English and Pangasinan, the Mangaldan March, “Abante
Mangaldan” which won first prize. A Municipal Council resolution was passed requiring the
singing of these songs at the close of any program or occasion undertaken in the municipality.
In 2000, a stage play entitled “Indio Anak-Banua” was shown at the MYDC depicting the
life of Pedro Casipit who was known as the Father of Mangaldan. Under the direction of Abdel
Langit, the casts of the play was a combination of local talents and popular artists/actors in
cinema/television and stage plays in Manila.
In 2008, Mangaldan joined an invitational competition on Municipal Hymns in the entire
Province of Pangasinan sponsored by the Municipality of San Fabian. The entry song was the
“Abante Mangaldan”, the Mangaldan March and was adjudged as 2nd place.
Mangaldan continuously supports the promotion of arts and culture through various
activities. For the past 25 years, the Municipality of Mangaldan has continuously sponsored the
conduct of “UGNAYAN SA PASKO” held at the Public Auditorium which serves as a training
ground for amateur talents especially in the field of singing. This annual gathering has become
a venue of economic activities among vendors who have practically increased in number.
Another long-running annual cultural activity which was started in the late 70’s is “New
Year and Costume Ball” conducted every January 1 every year. For almost 38 years, various
groups, organizations and barangay folks participate in this annual activity to welcome the
beginning of the year with merriment and optimism. Various contests are conducted like best
in costume, biggest delegation, dance competitions and highlighted by the selection fo Mr. and
Ms. New Year and Costume Ball.
In 2011, the Province of Pangasinan launched the 1st Pangasinan Culture and Arts
Festival (PCAF), dubbed as “Balitok a Tawir” in which the Municipality of Mangaldan garnered
the Championship award in the folk dance competition. In December of 2013 PCAF
competition, Mangaldan was adjudged as the 1st Runner up in the dance competition.
On April 5, 2014, the Province of Pangasinan celebrated the 434th Agew na Pangasinan
and launched the Parade Na Dayew with a Float competition. Again, Mangaldan was adjudged
Champion as the Best in Float.
On government/public services, some of the awards garnered were: being the 46th
Place Nationwide Economic Dynamism(1st – 2nd Class Municipalities & 2nd Place Region I);
38th PLACE Nationwide Overall Competitiveness (1st – 2nd Class Municipalities & 3rd Place
Region I); First Place – 2016 National Literacy Award Category A (Division Level); First Place –
2016 Outstanding A & E Program Implementation (Municipality With Two Districts Category);
CHAMPION, 2016 Provincial Search For The Most Statistically Developed LGU - Category A (City
/ First And Second Class Income Municipality); CSC Maturity Level 2 In PERFORMANCE
MANAGEMENT 2016; 2016 Seal of Child Friendly Local Governance (National Level); 2017 Cities & Municipalities Competitivenes Index (Regional); 2017 Good Financial Housekeeping
(National); 2017 Seal of Good Local Governance Awardee; 2017 Best Implementer In Event-
Based Surveilance & Response-MHO (Regional); One of The Top 5 Eligible Local Government
Units - Performance Based Eligibility Criteria FY 2017 ; 2019 Seal of Good Local Governance
Awardee;
Socio-Economic/ Ecological Profile|2019
MMaannggaallddaann,, PPaannggaassiinnaann 15
5. FUNCTIONAL ROLE AND GLIMPSE TO THE FUTURE
Mangaldan’s strategic location being at the crossroads of the major transportation routes going to the major urban centers makes it a growing commercial/industrial town. In the Regional Physical Framework Plan 1989-1993 of the National Economic & Development Authority, Region I, Mangaldan is identified as one of the sub-growth centers in the Region, a satellite of Dagupan City. As envisioned, Mangaldan will play a supportive role to Dagupan City which is a major urban center and to the town of Manaoag, which is dubbed as the “Pilgrimage City of the North”.
Mangaldanians are united in their vision that “MANGALDAN, is a smart, environment and
tourist-friendly, economically-stable, safe and progressive municipality, with God-loving, healthy and
gender-sensitive people, guided by leaders with principles of good governance”. In this Socio-Economic/Ecological Profile, the Municipal Government of Mangaldan is fully committed to promote the welfare and well-being of its constituents through dedicated and development-oriented political leaders, aided by a highly motivated and accountable bureaucracy through vital operating mechanisms, putting premium on people’s participation and steadfast in its performance commitment to pro-actively meet the challenge of a multi-faceted local governance. It’s main objectives are:
Increase production in agriculture, fishery, livestock thru optimum utilization of land; Generate needed livelihood and employment opportunities; Balance distribution of infrastructure services to support social development programs in various parts of the municipality; Ensure long-term sustainability of the environment thru maintained equity in the utilization of resources.; Increase access to safe drinking and potable drinking water; Identify relocation sites for informal settler or families living in identified danger areas; Improve existing local public enterprises; Strengthen LGU-business sector partnership; Promote effective preservation, protection and management of the environment for a balanced ecology; Improve the quality of life particularly the poor households of the municipality; and to Provide adequate quality services on health, education, housing and basic utilities, safety and security.
CHAPTER II GEO-PHYSICAL ENVIRONMENT
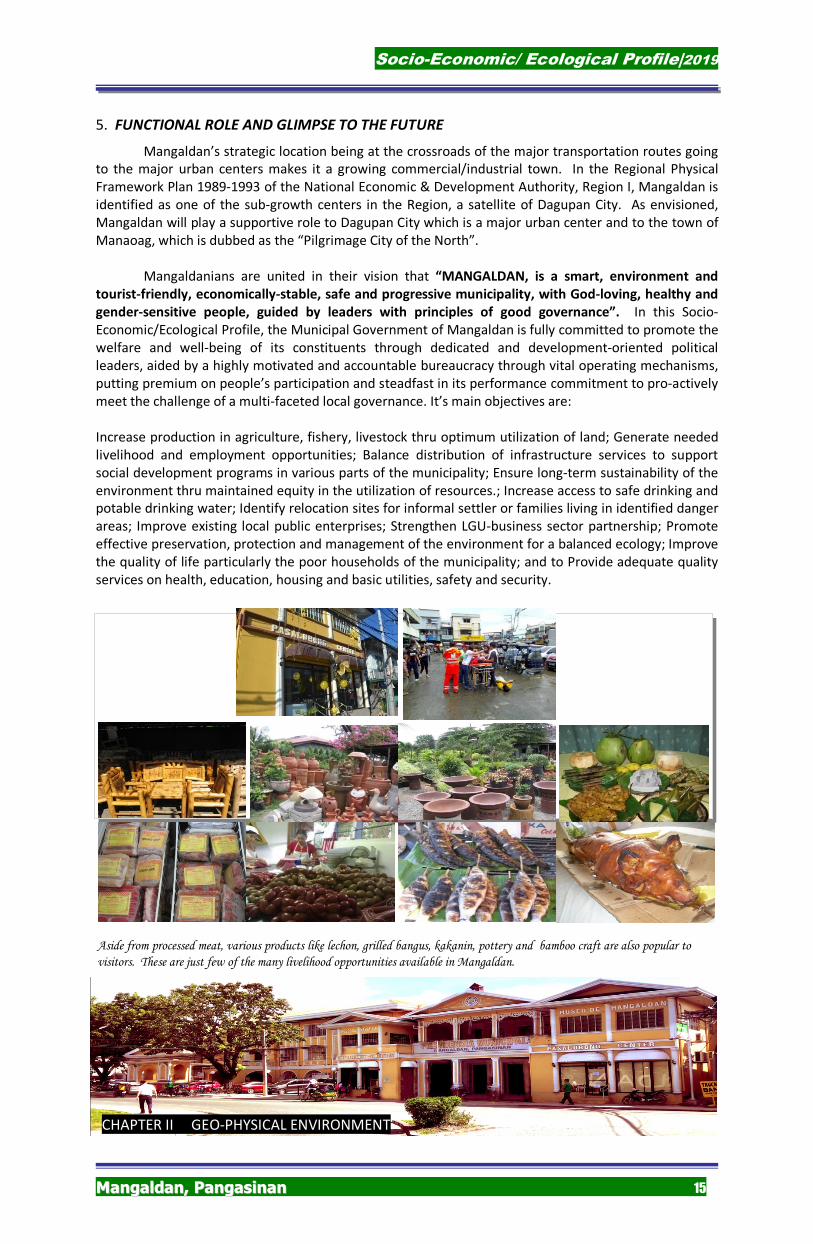
Aside from processed meat, various products like lechon, grilled bangus, kakanin, pottery and bamboo craft are also popular to
visitors. These are just few of the many livelihood opportunities available in Mangaldan.
Socio-Economic/ Ecological Profile|2019
MMaannggaallddaann,, PPaannggaassiinnaann 16
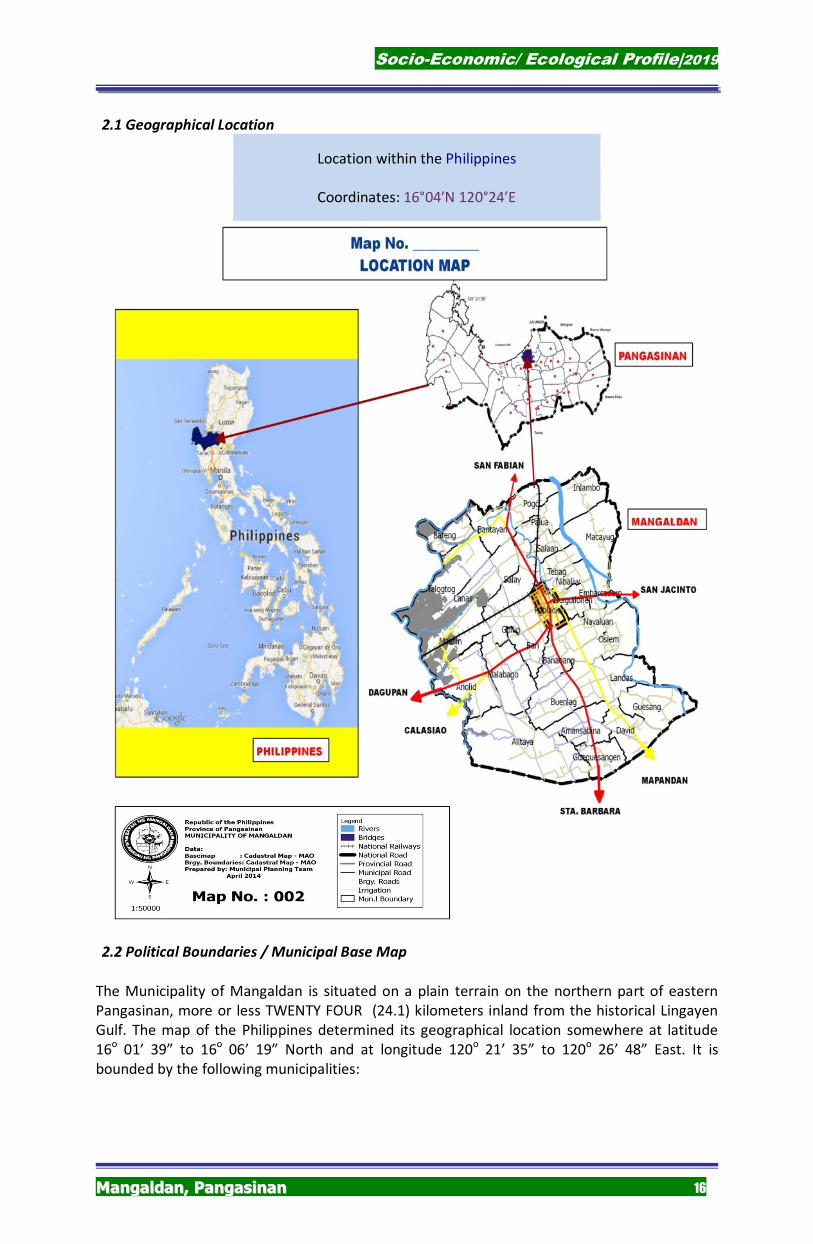
2.1 Geographical Location
Location within the Philippines
Coordinates: 16°04′N 120°24′E
2.2 Political Boundaries / Municipal Base Map
The Municipality of Mangaldan is situated on a plain terrain on the northern part of eastern
Pangasinan, more or less TWENTY FOUR (24.1) kilometers inland from the historical Lingayen
Gulf. The map of the Philippines determined its geographical location somewhere at latitude
16o 01’ 39” to 16o 06’ 19” North and at longitude 120o 21’ 35” to 120o 26’ 48” East. It is
bounded by the following municipalities:
Socio-Economic/ Ecological Profile|2019
MMaannggaallddaann,, PPaannggaassiinnaann 17
Mangaldan is a part of the vast agricultural basin found in the central-eastern portion of the
Province of Pangasinan. It forms part of the major urban areas within the Lingayen Gulf, which
is known as the Mangaldan-Dagupan-Binmaley-Lingayen Corridor. It is 75.2 kilometers away
from the regional center of San Fernando City, La Union, eight (8) kilometers away from
Dagupan City, 12.3 kilometers away from the religious town of Manaoag, 24.1 kilometers away
from the provincial capital of Lingayen, 67.4 kilometers away from Baguio City, via Kennon Road
and 210 kilometers away from Manila. It is accessible and could easily be reached by regular
means of land transportation.
2.3 Topography
TOPOGRAPHY AND LAND FEATURES
Generally, the entire town of Mangaldan is flat and leveled with 0.3% slope. This is
within slope category “A” which is useful for paddy rice culture. There are no mountains
or large bodies of water within the area. Four (4) rivers can be located in the
municipality comprising the Old Mangaldan River, Manguiragday River, Angalacan River
and Paldakit River.
2.4 Geology
LAND CLASSIFICATION
In terms of Land Capability, the municipality has three (3) types namely: Class A, Class
Be and Class X. Soils belonging to San Manuel series belong to Class A, soils belonging to
Bantog Clay loam belong to Class Be and hydrosol series belong to Class X.
Class A lands are very good lands which can be cultivated safely requiring only simple
but good farm management practices and are approximately 2,389.70 hectares. These are located mostly in Southeastern barangays. Class Be lands are good lands which could
be cultivated safely requiring simple conservation practices and is estimated at
1,892.124 hectares. These are mostly in the Southwestern Barangay. Class X lands are
BOUNDARIES
North Lingayen Gulf
South Sta. Barbara
East San Jacinto
West Dagupan City
Northeast San Fabian
Southeast Mapandan
Southwest Calasiao
DISTANCES KM
Lingayen 24.1
Dagupan 8
Mapandan 10.9
San Fabian 13.3
San Jacinto 6.3
Manaoag 12.3
San Fernando, La Union 75.2
Baguio City 67.4
Manila 210
Socio-Economic/ Ecological Profile|2019
MMaannggaallddaann,, PPaannggaassiinnaann 18
level lands, wet most of the time and cannot be economically drained and are suited for
fishponds. Generally, these classes of lands are not susceptible to erosion and cover an
estimated area of 477.776 hectares such as in Barangays Talogtog, Anolid, Bateng,
Bantayan, Lanas and Maasin.
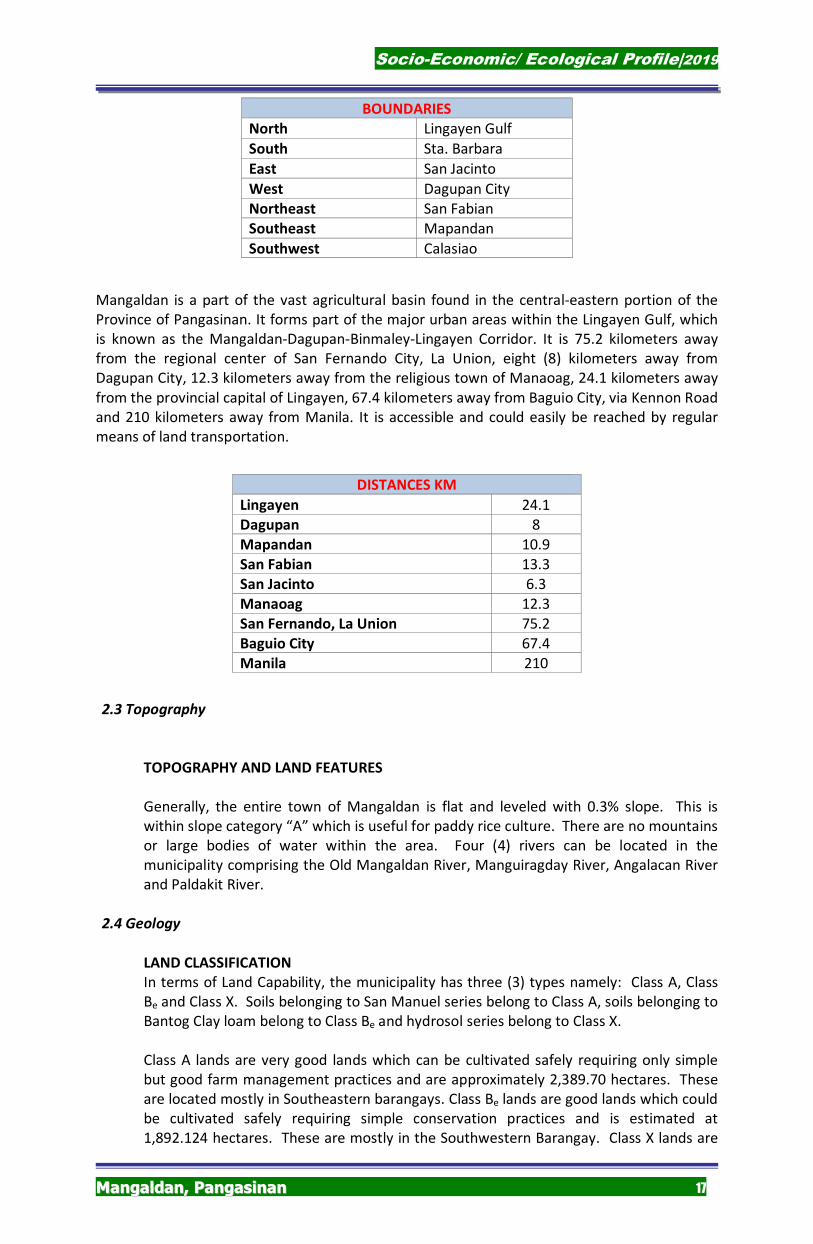
Soil types
There are four (4) soil types found in Mangaldannamely: San Manuel Silt Loam, San
Manuel Fine Sandy Loam, Bantog Clay Loam and Hydrosol.
Socio-Economic/ Ecological Profile|2019
MMaannggaallddaann,, PPaannggaassiinnaann 19
2.5 Land Resources
EXISTING LAND USE AND LAND USE TRENDS
General Land Uses, Areas, Intensity
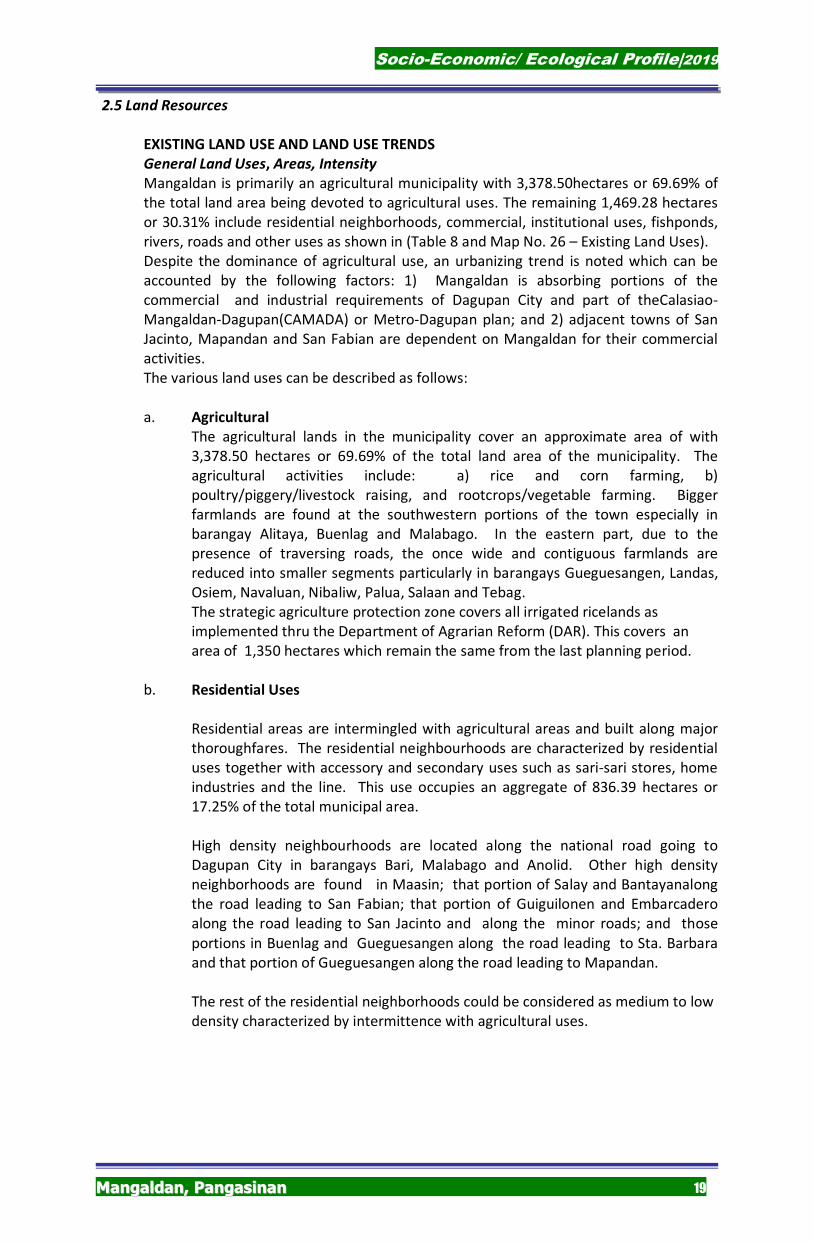
Mangaldan is primarily an agricultural municipality with 3,378.50hectares or 69.69% of
the total land area being devoted to agricultural uses. The remaining 1,469.28 hectares
or 30.31% include residential neighborhoods, commercial, institutional uses, fishponds,
rivers, roads and other uses as shown in (Table 8 and Map No. 26 – Existing Land Uses).
Despite the dominance of agricultural use, an urbanizing trend is noted which can be
accounted by the following factors: 1) Mangaldan is absorbing portions of the
commercial and industrial requirements of Dagupan City and part of theCalasiao-
Mangaldan-Dagupan(CAMADA) or Metro-Dagupan plan; and 2) adjacent towns of San
Jacinto, Mapandan and San Fabian are dependent on Mangaldan for their commercial
activities.
The various land uses can be described as follows:
a. Agricultural
The agricultural lands in the municipality cover an approximate area of with
3,378.50 hectares or 69.69% of the total land area of the municipality. The
agricultural activities include: a) rice and corn farming, b)
poultry/piggery/livestock raising, and rootcrops/vegetable farming. Bigger
farmlands are found at the southwestern portions of the town especially in
barangay Alitaya, Buenlag and Malabago. In the eastern part, due to the
presence of traversing roads, the once wide and contiguous farmlands are
reduced into smaller segments particularly in barangays Gueguesangen, Landas,
Osiem, Navaluan, Nibaliw, Palua, Salaan and Tebag.
The strategic agriculture protection zone covers all irrigated ricelands as
implemented thru the Department of Agrarian Reform (DAR). This covers an
area of 1,350 hectares which remain the same from the last planning period.
b. Residential Uses
Residential areas are intermingled with agricultural areas and built along major
thoroughfares. The residential neighbourhoods are characterized by residential
uses together with accessory and secondary uses such as sari-sari stores, home
industries and the line. This use occupies an aggregate of 836.39 hectares or
17.25% of the total municipal area.
High density neighbourhoods are located along the national road going to
Dagupan City in barangays Bari, Malabago and Anolid. Other high density
neighborhoods are found in Maasin; that portion of Salay and Bantayanalong
the road leading to San Fabian; that portion of Guiguilonen and Embarcadero
along the road leading to San Jacinto and along the minor roads; and those
portions in Buenlag and Gueguesangen along the road leading to Sta. Barbara
and that portion of Gueguesangen along the road leading to Mapandan.
The rest of the residential neighborhoods could be considered as medium to low density characterized by intermittence with agricultural uses.
Socio-Economic/ Ecological Profile|2019
MMaannggaallddaann,, PPaannggaassiinnaann 20
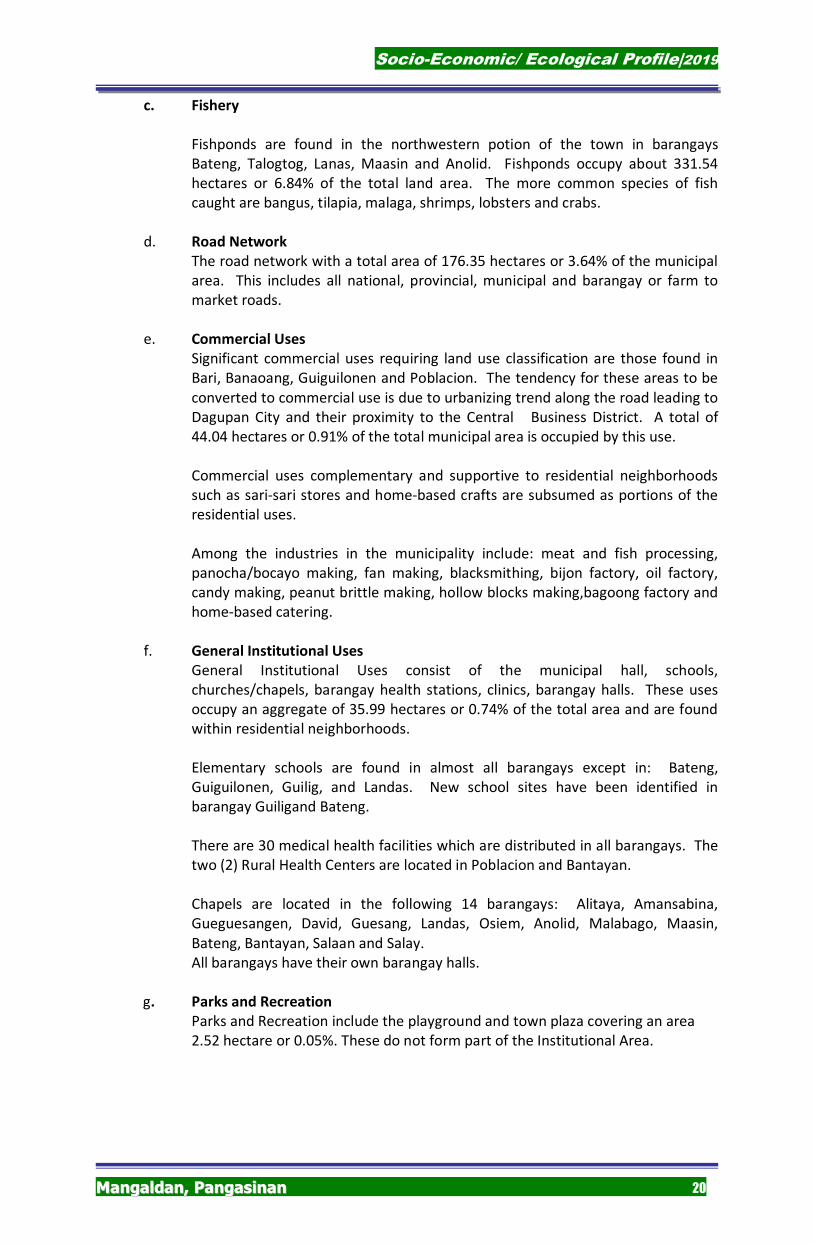
c. Fishery
Fishponds are found in the northwestern potion of the town in barangays
Bateng, Talogtog, Lanas, Maasin and Anolid. Fishponds occupy about 331.54
hectares or 6.84% of the total land area. The more common species of fish
caught are bangus, tilapia, malaga, shrimps, lobsters and crabs.
d. Road Network
The road network with a total area of 176.35 hectares or 3.64% of the municipal
area. This includes all national, provincial, municipal and barangay or farm to
market roads.
e. Commercial Uses
Significant commercial uses requiring land use classification are those found in
Bari, Banaoang, Guiguilonen and Poblacion. The tendency for these areas to be
converted to commercial use is due to urbanizing trend along the road leading to
Dagupan City and their proximity to the Central Business District. A total of
44.04 hectares or 0.91% of the total municipal area is occupied by this use.
Commercial uses complementary and supportive to residential neighborhoods
such as sari-sari stores and home-based crafts are subsumed as portions of the
residential uses.
Among the industries in the municipality include: meat and fish processing,
panocha/bocayo making, fan making, blacksmithing, bijon factory, oil factory,
candy making, peanut brittle making, hollow blocks making,bagoong factory and
home-based catering.
f. General Institutional Uses
General Institutional Uses consist of the municipal hall, schools,
churches/chapels, barangay health stations, clinics, barangay halls. These uses
occupy an aggregate of 35.99 hectares or 0.74% of the total area and are found
within residential neighborhoods.
Elementary schools are found in almost all barangays except in: Bateng,
Guiguilonen, Guilig, and Landas. New school sites have been identified in
barangay Guiligand Bateng.
There are 30 medical health facilities which are distributed in all barangays. The
two (2) Rural Health Centers are located in Poblacion and Bantayan.
Chapels are located in the following 14 barangays: Alitaya, Amansabina,
Gueguesangen, David, Guesang, Landas, Osiem, Anolid, Malabago, Maasin,
Bateng, Bantayan, Salaan and Salay.
All barangays have their own barangay halls.
g. Parks and Recreation
Parks and Recreation include the playground and town plaza covering an area
2.52 hectare or 0.05%. These do not form part of the Institutional Area.
Socio-Economic/ Ecological Profile|2019
MMaannggaallddaann,, PPaannggaassiinnaann 21
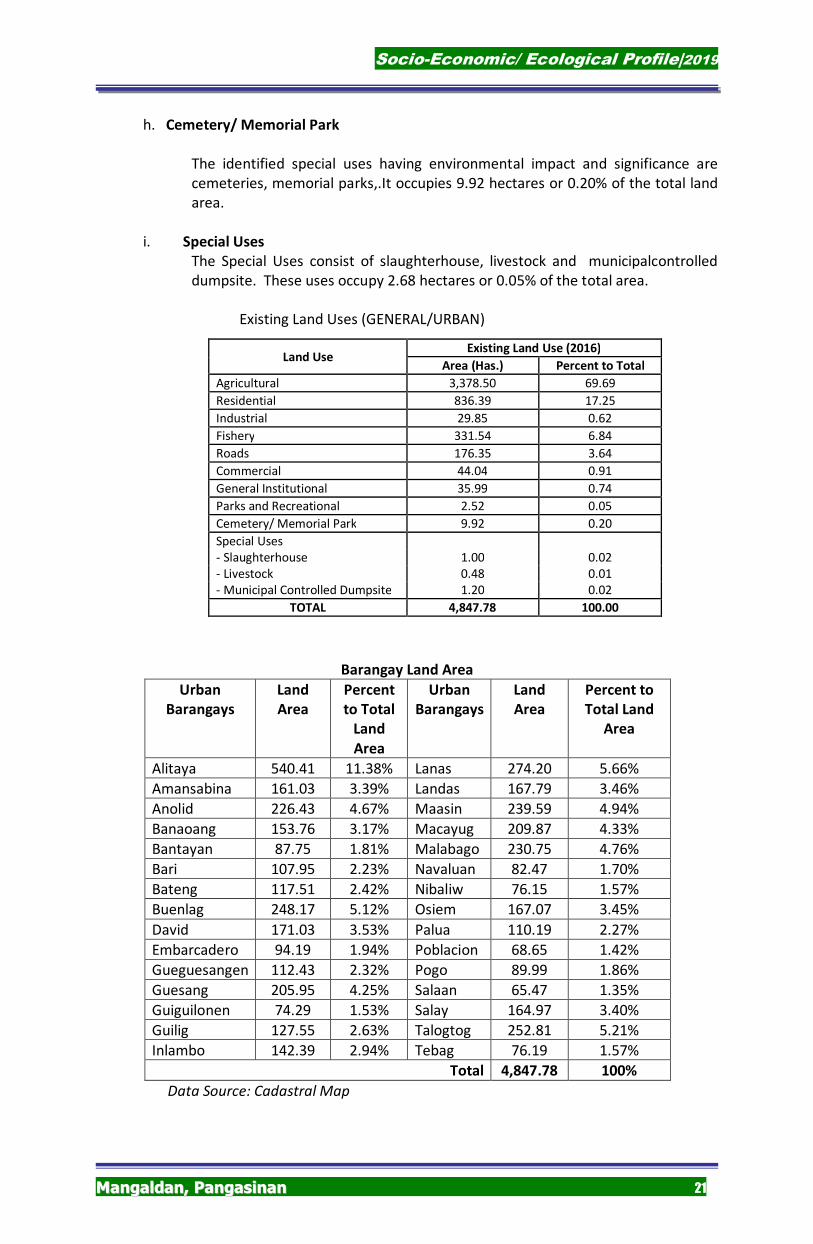
h. Cemetery/ Memorial Park
The identified special uses having environmental impact and significance are
cemeteries, memorial parks,.It occupies 9.92 hectares or 0.20% of the total land
area.
i. Special Uses
The Special Uses consist of slaughterhouse, livestock and municipalcontrolled
dumpsite. These uses occupy 2.68 hectares or 0.05% of the total area.
Existing Land Uses (GENERAL/URBAN)
Land Use Existing Land Use (2016)
Area (Has.) Percent to Total
Agricultural 3,378.50 69.69
Residential 836.39 17.25
Industrial 29.85 0.62
Fishery 331.54 6.84
Roads 176.35 3.64
Commercial 44.04 0.91
General Institutional 35.99 0.74
Parks and Recreational 2.52 0.05
Cemetery/ Memorial Park 9.92 0.20
Special Uses - Slaughterhouse 1.00 0.02 - Livestock 0.48 0.01 - Municipal Controlled Dumpsite 1.20 0.02
TOTAL 4,847.78 100.00
Barangay Land Area
Urban
Barangays
Land
Area
Percent
to Total
Land
Area
Urban
Barangays
Land
Area
Percent to
Total Land
Area
Alitaya 540.41 11.38% Lanas 274.20 5.66%
Amansabina 161.03 3.39% Landas 167.79 3.46%
Anolid 226.43 4.67% Maasin 239.59 4.94%
Banaoang 153.76 3.17% Macayug 209.87 4.33%
Bantayan 87.75 1.81% Malabago 230.75 4.76%
Bari 107.95 2.23% Navaluan 82.47 1.70%
Bateng 117.51 2.42% Nibaliw 76.15 1.57%
Buenlag 248.17 5.12% Osiem 167.07 3.45%
David 171.03 3.53% Palua 110.19 2.27%
Embarcadero 94.19 1.94% Poblacion 68.65 1.42%
Gueguesangen 112.43 2.32% Pogo 89.99 1.86%
Guesang 205.95 4.25% Salaan 65.47 1.35%
Guiguilonen 74.29 1.53% Salay 164.97 3.40%
Guilig 127.55 2.63% Talogtog 252.81 5.21%
Inlambo 142.39 2.94% Tebag 76.19 1.57%
Total 4,847.78 100%
Data Source: Cadastral Map
Socio-Economic/ Ecological Profile|2019
MMaannggaallddaann,, PPaannggaassiinnaann 22
2.8 Freshwater Resources
As per above-stated on the existing landuse.
Fishponds are found in the northwestern potion of the town in barangays Bateng,
Talogtog, Lanas, Maasin and Anolid. Fishponds occupy about 331.54 hectares or 6.84%
of the total land area. The more common species of fish caught are bangus, tilapia,
malaga, shrimps, lobsters and crabs.
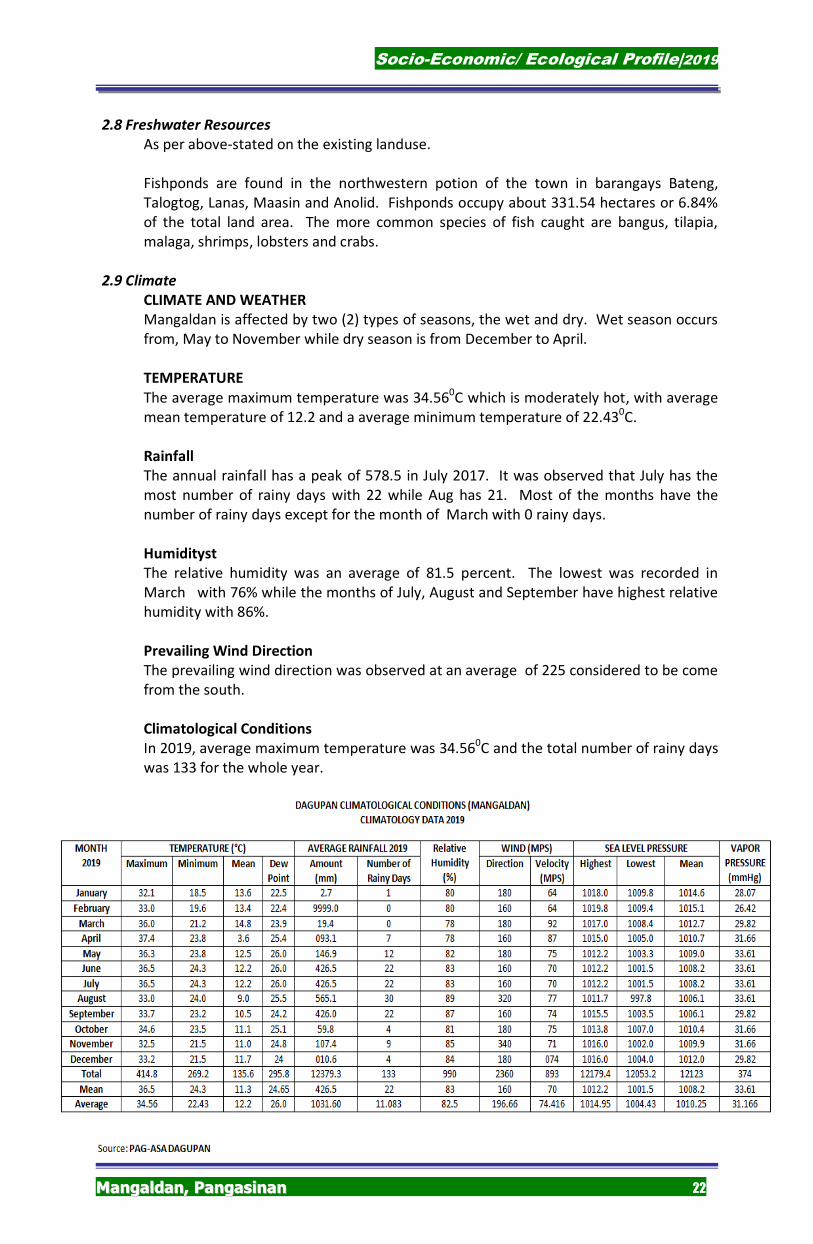
2.9 Climate
CLIMATE AND WEATHER
Mangaldan is affected by two (2) types of seasons, the wet and dry. Wet season occurs
from, May to November while dry season is from December to April.
TEMPERATURE
The average maximum temperature was 34.560C which is moderately hot, with average
mean temperature of 12.2 and a average minimum temperature of 22.430C.
Rainfall
The annual rainfall has a peak of 578.5 in July 2017. It was observed that July has the
most number of rainy days with 22 while Aug has 21. Most of the months have the
number of rainy days except for the month of March with 0 rainy days.
Humidityst
The relative humidity was an average of 81.5 percent. The lowest was recorded in
March with 76% while the months of July, August and September have highest relative
humidity with 86%.
Prevailing Wind Direction
The prevailing wind direction was observed at an average of 225 considered to be come
from the south.
Climatological Conditions
In 2019, average maximum temperature was 34.560C and the total number of rainy days
was 133 for the whole year.
Socio-Economic/ Ecological Profile|2019
MMaannggaallddaann,, PPaannggaassiinnaann 23
2.10 Natural Hazards / Constraints
Natural Risk Areas
Mangaldan is located in the Central Plain of Luzon specifically on the northern part
of Pangasinan and forms part of the southern shores of the Lingayen Gulf. The plain
is bounded by a ring of inactive volcanoes to the south, some of which have been
active within recorded history. There is a theoretical possibility that any of these
may become active again but this is highly unlikely and too remote to justify being
incorporated in these planning considerations. Mount Pinatubo that lies 95 km to
the south and erupted in 1991 and 1992 ensued light ash fall in the municipality.
The Cayanga-Patalan River System between Mangaldan and San Fabian is one of
the Allied River that discharges into the Lingayen Gulf. This river system carries
sediments from mine tailings and eroded top soils from the highlands to the
Lingayen Gulf. It has been noted that many fishponds become dry during the
summer months. It is believed that siltation of the river beds is the cause of this
problem.
Most of the area along the riverbanks is underlain by quaternary alluvial deposits,
composed of sand, gravel and clay. The accumulation of sands and gravel are the
result of repeated flooding and meandering of the rivers.
Ground deformations caused by the Luzon Earthquake of July 16, 1990 affected
only the areas in Mangaldan along the river banks. A number of residential
buildings were tilted at various degrees due to the liquefaction of their foundation
soil. While in other cases, structural damages were also observed. The magnitude
of the earthquake was 7.8 on the Ritcher scale. Not only were the loose alluvial
deposits subjected to liquefaction during earthquakes but also the
uncompactedman-made fills, placed in the fishponds and swampy areas. The
liquefaction produced sand boils which were the most common evidence for the
liquefaction phenomenon. Witnesses observed sand and water fountains a meter
high or even greater.
Another considered natural risk areas are the flood and erosion prone areas along the
northern most and eastern portions of the town which is being traversed by the
Angalacan River and the Old Mangaldan River. Affected areas are 17 barangays namely:
Inlambo, Pogo, Palua, Salaan, Macayug, Tebag, Nibaliw, Embarcadero, Guiguilonen,
Navaluan, Osiem, Landas, Guesang, Bantayan, Talogtog, Bateng and Maasin. The most
affected of these are Barangays Inlambo, Macayug and Guesang as they become
isolated during floods.
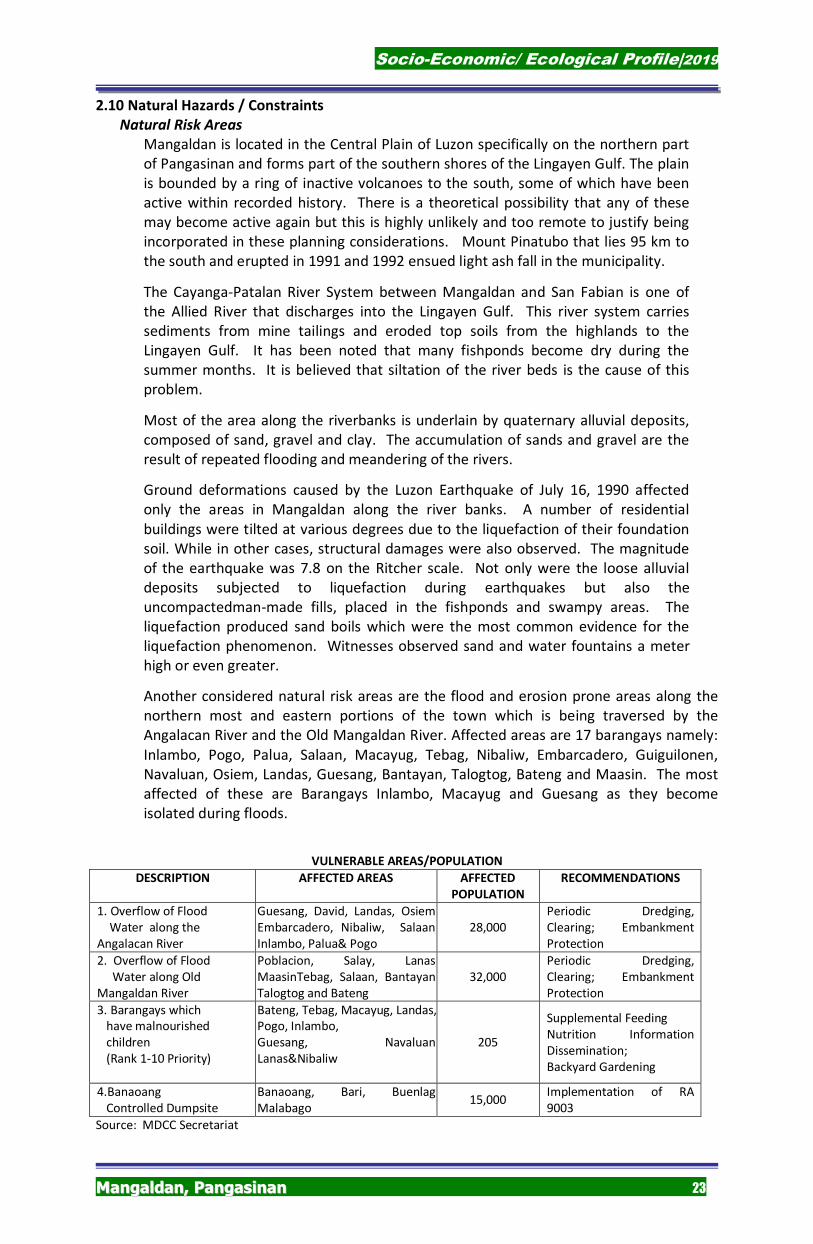
VULNERABLE AREAS/POPULATION
DESCRIPTION AFFECTED AREAS AFFECTED
POPULATION
RECOMMENDATIONS
1. Overflow of Flood Water along the Angalacan River
Guesang, David, Landas, Osiem, Embarcadero, Nibaliw, Salaan, Inlambo, Palua& Pogo
28,000 Periodic Dredging, Clearing; Embankment Protection
2. Overflow of Flood Water along Old Mangaldan River
Poblacion, Salay, Lanas, MaasinTebag, Salaan, Bantayan, Talogtog and Bateng
32,000 Periodic Dredging, Clearing; Embankment Protection
3. Barangays which have malnourished children (Rank 1-10 Priority)
Bateng, Tebag, Macayug, Landas,Pogo, Inlambo, Guesang, Navaluan, Lanas&Nibaliw
205
Supplemental Feeding Nutrition Information Dissemination; Backyard Gardening
4.Banaoang Controlled Dumpsite
Banaoang, Bari, Buenlag, Malabago
15,000 Implementation of RA 9003
Source: MDCC Secretariat
Socio-Economic/ Ecological Profile|2019
MMaannggaallddaann,, PPaannggaassiinnaann 24
CHAPTER III POPULATION AND SOCIAL PROFILE
3.1 Population Size and Growth Rate
The study of population is required in planning so as to determine the size of human
resources in a locality and ascertain their various needs and consider their interests and traits
for the economic growth, structure, distribution, density, composition and change due to
births, deaths, immigration, separation, divorce and other socio-economic characteristics and
the cause and consequences of those factors. Likewise, the age of the population determines
potential labor force and identifies the areas with considerable unemployment rates.
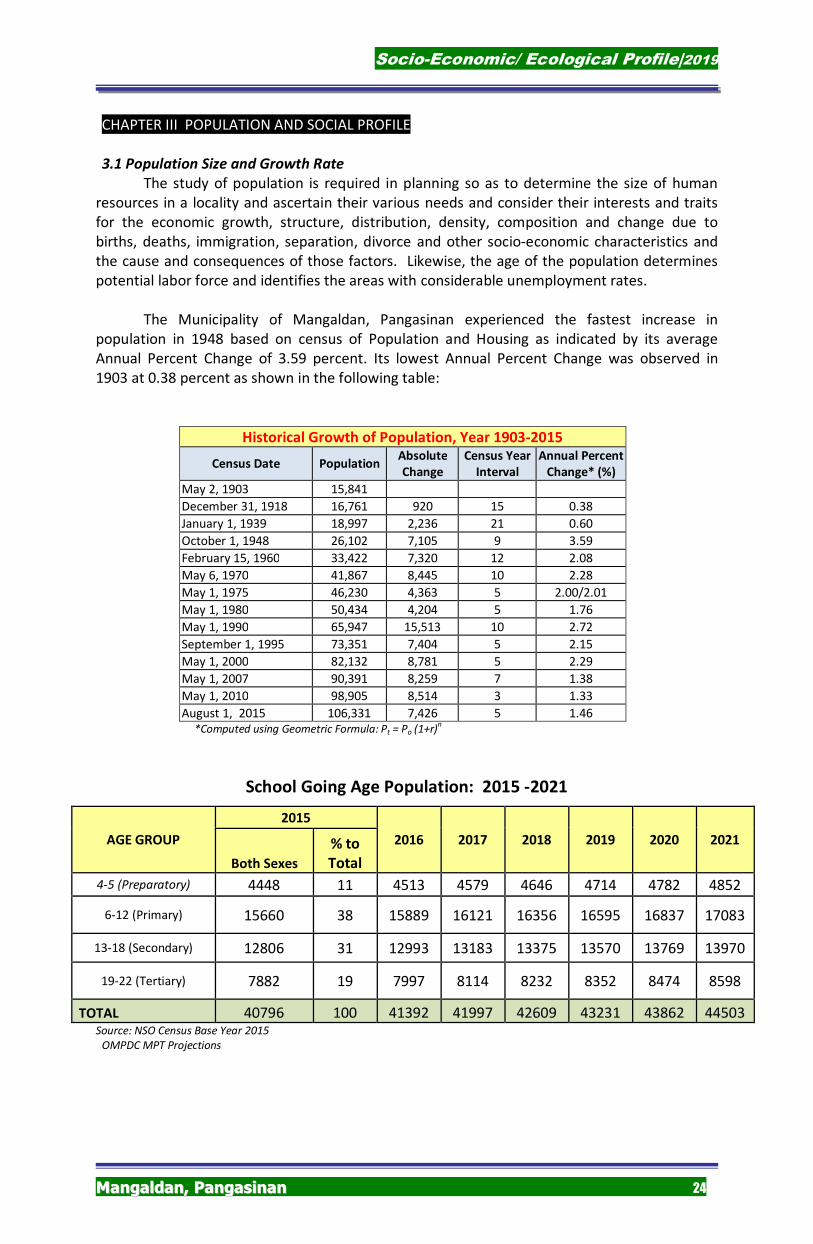
The Municipality of Mangaldan, Pangasinan experienced the fastest increase in
population in 1948 based on census of Population and Housing as indicated by its average
Annual Percent Change of 3.59 percent. Its lowest Annual Percent Change was observed in
1903 at 0.38 percent as shown in the following table:
Historical Growth of Population, Year 1903-2015
Census Date Population Absolute
Change
Census Year
Interval
Annual Percent
Change* (%)
May 2, 1903 15,841
December 31, 1918 16,761 920 15 0.38
January 1, 1939 18,997 2,236 21 0.60
October 1, 1948 26,102 7,105 9 3.59
February 15, 1960 33,422 7,320 12 2.08
May 6, 1970 41,867 8,445 10 2.28
May 1, 1975 46,230 4,363 5 2.00/2.01
May 1, 1980 50,434 4,204 5 1.76
May 1, 1990 65,947 15,513 10 2.72
September 1, 1995 73,351 7,404 5 2.15
May 1, 2000 82,132 8,781 5 2.29
May 1, 2007 90,391 8,259 7 1.38
May 1, 2010 98,905 8,514 3 1.33
August 1, 2015 106,331 7,426 5 1.46 *Computed using Geometric Formula: Pt = Po (1+r)
n
School Going Age Population: 2015 -2021
AGE GROUP
2015
2016 2017 2018 2019 2020 2021
Both Sexes
% to
Total
4-5 (Preparatory) 4448 11 4513 4579 4646 4714 4782 4852
6-12 (Primary) 15660 38 15889 16121 16356 16595 16837 17083
13-18 (Secondary) 12806 31 12993 13183 13375 13570 13769 13970
19-22 (Tertiary) 7882 19 7997 8114 8232 8352 8474 8598
TOTAL 40796 100 41392 41997 42609 43231 43862 44503 Source: NSO Census Base Year 2015
OMPDC MPT Projections
Socio-Economic/ Ecological Profile|2019
MMaannggaallddaann,, PPaannggaassiinnaann 25
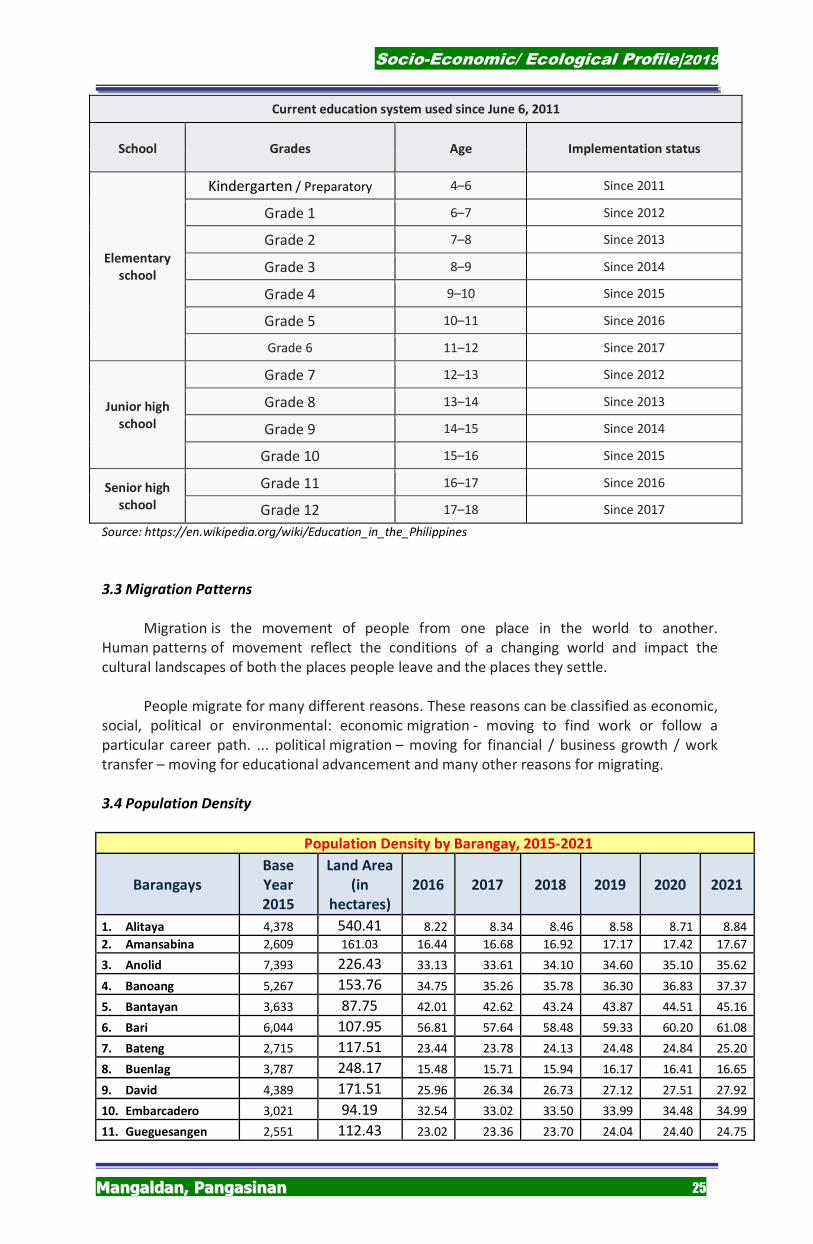
Current education system used since June 6, 2011
School Grades Age Implementation status
Elementary
school
Kindergarten / Preparatory 4–6 Since 2011
Grade 1 6–7 Since 2012
Grade 2 7–8 Since 2013
Grade 3 8–9 Since 2014
Grade 4 9–10 Since 2015
Grade 5 10–11 Since 2016
Grade 6 11–12 Since 2017
Junior high
school
Grade 7 12–13 Since 2012
Grade 8 13–14 Since 2013
Grade 9 14–15 Since 2014
Grade 10 15–16 Since 2015
Senior high
school
Grade 11 16–17 Since 2016
Grade 12 17–18 Since 2017
Source: https://en.wikipedia.org/wiki/Education_in_the_Philippines
3.3 Migration Patterns
Migration is the movement of people from one place in the world to another.
Human patterns of movement reflect the conditions of a changing world and impact the
cultural landscapes of both the places people leave and the places they settle.
People migrate for many different reasons. These reasons can be classified as economic,
social, political or environmental: economic migration - moving to find work or follow a
particular career path. ... political migration – moving for financial / business growth / work
transfer – moving for educational advancement and many other reasons for migrating.
3.4 Population Density
Population Density by Barangay, 2015-2021
Barangays
Base
Year
2015
Land Area
(in
hectares)
2016 2017 2018 2019 2020 2021
1. Alitaya 4,378 540.41 8.22 8.34 8.46 8.58 8.71 8.84
2. Amansabina 2,609 161.03 16.44 16.68 16.92 17.17 17.42 17.67
3. Anolid 7,393 226.43 33.13 33.61 34.10 34.60 35.10 35.62
4. Banoang 5,267 153.76 34.75 35.26 35.78 36.30 36.83 37.37
5. Bantayan 3,633 87.75 42.01 42.62 43.24 43.87 44.51 45.16
6. Bari 6,044 107.95 56.81 57.64 58.48 59.33 60.20 61.08
7. Bateng 2,715 117.51 23.44 23.78 24.13 24.48 24.84 25.20
8. Buenlag 3,787 248.17 15.48 15.71 15.94 16.17 16.41 16.65
9. David 4,389 171.51 25.96 26.34 26.73 27.12 27.51 27.92
10. Embarcadero 3,021 94.19 32.54 33.02 33.50 33.99 34.48 34.99
11. Gueguesangen 2,551 112.43 23.02 23.36 23.70 24.04 24.40 24.75
Socio-Economic/ Ecological Profile|2019
MMaannggaallddaann,, PPaannggaassiinnaann 26
12. Guesang 3,935 205.95 19.39 19.67 19.96 20.25 20.54 20.84
13. Guiguilonen 2,945 74.79 39.95 40.54 41.13 41.73 42.34 42.95
14. Guillig 3,491 127.55 27.77 28.17 28.59 29.00 29.43 29.86
15. Inlambo 1,673 142.39 11.92 12.10 12.27 12.45 12.63 12.82
16. Lanas 3,285 274.2 12.16 12.33 12.51 12.70 12.88 13.07
17. Landas 2,023 167.79 12.23 12.41 12.59 12.78 12.96 13.15
18. Maasin 3,862 239.59 16.35 16.59 16.84 17.08 17.33 17.58
19. Macayug 2,485 209.67 12.02 12.20 12.38 12.56 12.74 12.93
20. Malabago 5,095 230.75 22.40 22.73 23.06 23.40 23.74 24.09
21. Navaluan 3,678 82.47 45.25 45.91 46.58 47.26 47.95 48.65
22. Nibaliw 3,105 76.15 41.37 41.97 42.59 43.21 43.84 44.48
23. Osiem 3,437 167.07 20.87 21.18 21.49 21.80 22.12 22.44
24. Palua 2,013 110.19 18.54 18.81 19.08 19.36 19.64 19.93
25. Poblacion 4,639 68.65 68.56 69.56 70.58 71.61 72.65 73.71
26. Pogo 1,631 89.99 18.39 18.66 18.93 19.21 19.49 19.77
27. Salaan 2,598 65.47 40.26 40.85 41.45 42.05 42.66 43.29
28. Salay 5,331 164.97 32.79 33.27 33.75 34.24 34.74 35.25
29. Talogtog 2,486 252.81 9.98 10.12 10.27 10.42 10.57 10.73
30. Tebag 2,832 76.19 37.71 38.26 38.82 39.39 39.96 40.55
T O T A L 106,331 4847.78 21.93 22.58 22.91 23.24 23.58 23.93
Source: NSO 2015 & MPT Computation
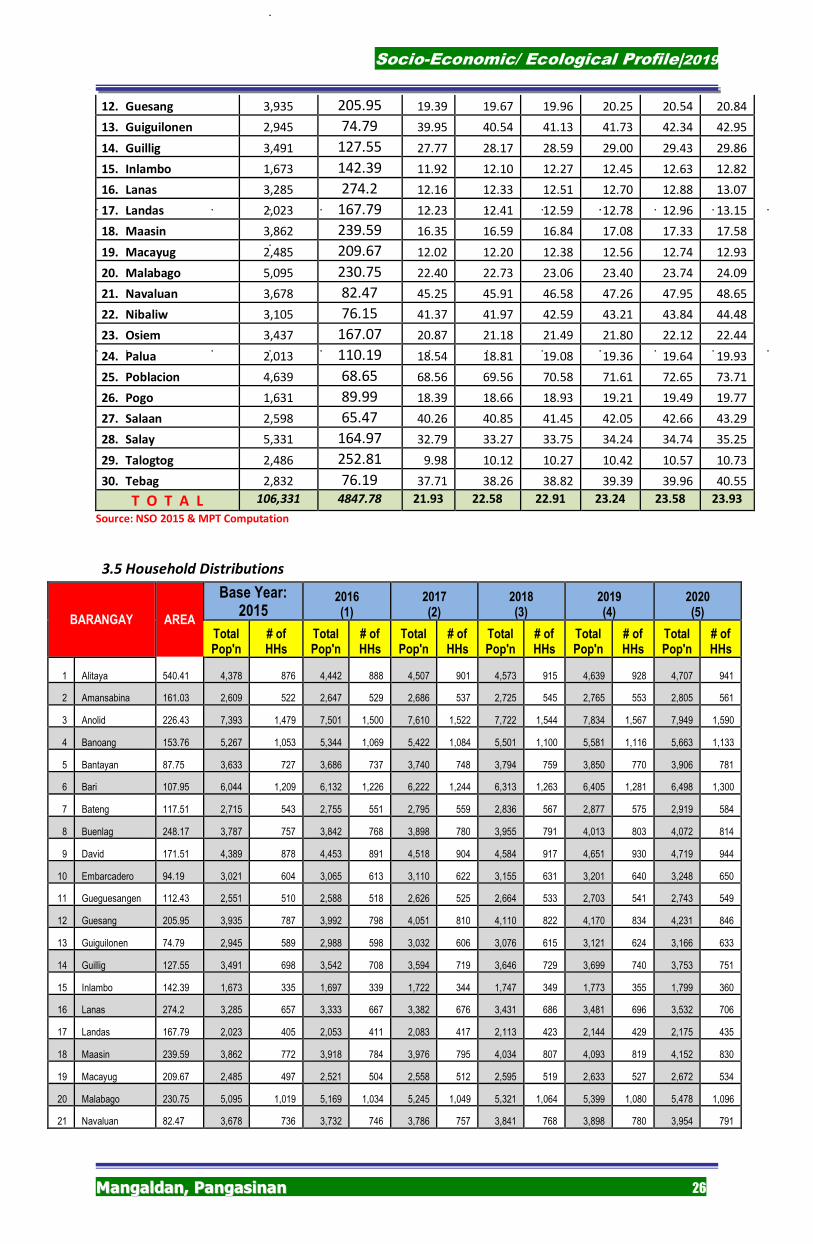
3.5 Household Distributions
BARANGAY AREA
Base Year: 2015
2016 (1)
2017 (2)
2018 (3)
2019 (4)
2020 (5)
Total Pop'n
# of HHs
Total Pop'n
# of HHs
Total Pop'n
# of HHs
Total Pop'n
# of HHs
Total Pop'n
# of HHs
Total Pop'n
# of HHs
1 Alitaya 540.41 4,378 876 4,442 888 4,507 901 4,573 915 4,639 928 4,707 941
2 Amansabina 161.03 2,609 522 2,647 529 2,686 537 2,725 545 2,765 553 2,805 561
3 Anolid 226.43 7,393 1,479 7,501 1,500 7,610 1,522 7,722 1,544 7,834 1,567 7,949 1,590
4 Banoang 153.76 5,267 1,053 5,344 1,069 5,422 1,084 5,501 1,100 5,581 1,116 5,663 1,133
5 Bantayan 87.75 3,633 727 3,686 737 3,740 748 3,794 759 3,850 770 3,906 781
6 Bari 107.95 6,044 1,209 6,132 1,226 6,222 1,244 6,313 1,263 6,405 1,281 6,498 1,300
7 Bateng 117.51 2,715 543 2,755 551 2,795 559 2,836 567 2,877 575 2,919 584
8 Buenlag 248.17 3,787 757 3,842 768 3,898 780 3,955 791 4,013 803 4,072 814
9 David 171.51 4,389 878 4,453 891 4,518 904 4,584 917 4,651 930 4,719 944
10 Embarcadero 94.19 3,021 604 3,065 613 3,110 622 3,155 631 3,201 640 3,248 650
11 Gueguesangen 112.43 2,551 510 2,588 518 2,626 525 2,664 533 2,703 541 2,743 549
12 Guesang 205.95 3,935 787 3,992 798 4,051 810 4,110 822 4,170 834 4,231 846
13 Guiguilonen 74.79 2,945 589 2,988 598 3,032 606 3,076 615 3,121 624 3,166 633
14 Guillig 127.55 3,491 698 3,542 708 3,594 719 3,646 729 3,699 740 3,753 751
15 Inlambo 142.39 1,673 335 1,697 339 1,722 344 1,747 349 1,773 355 1,799 360
16 Lanas 274.2 3,285 657 3,333 667 3,382 676 3,431 686 3,481 696 3,532 706
17 Landas 167.79 2,023 405 2,053 411 2,083 417 2,113 423 2,144 429 2,175 435
18 Maasin 239.59 3,862 772 3,918 784 3,976 795 4,034 807 4,093 819 4,152 830
19 Macayug 209.67 2,485 497 2,521 504 2,558 512 2,595 519 2,633 527 2,672 534
20 Malabago 230.75 5,095 1,019 5,169 1,034 5,245 1,049 5,321 1,064 5,399 1,080 5,478 1,096
21 Navaluan 82.47 3,678 736 3,732 746 3,786 757 3,841 768 3,898 780 3,954 791
Socio-Economic/ Ecological Profile|2019
MMaannggaallddaann,, PPaannggaassiinnaann 27
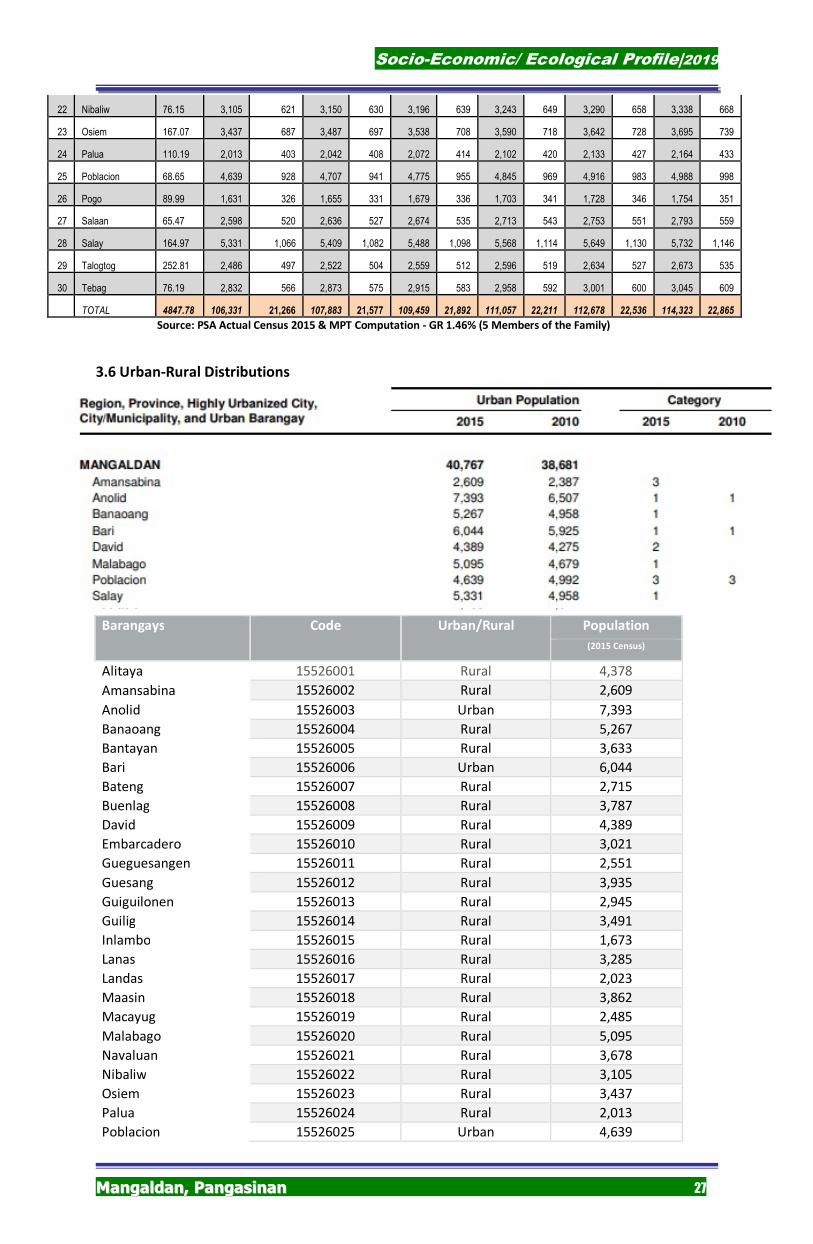
22 Nibaliw 76.15 3,105 621 3,150 630 3,196 639 3,243 649 3,290 658 3,338 668
23 Osiem 167.07 3,437 687 3,487 697 3,538 708 3,590 718 3,642 728 3,695 739
24 Palua 110.19 2,013 403 2,042 408 2,072 414 2,102 420 2,133 427 2,164 433
25 Poblacion 68.65 4,639 928 4,707 941 4,775 955 4,845 969 4,916 983 4,988 998
26 Pogo 89.99 1,631 326 1,655 331 1,679 336 1,703 341 1,728 346 1,754 351
27 Salaan 65.47 2,598 520 2,636 527 2,674 535 2,713 543 2,753 551 2,793 559
28 Salay 164.97 5,331 1,066 5,409 1,082 5,488 1,098 5,568 1,114 5,649 1,130 5,732 1,146
29 Talogtog 252.81 2,486 497 2,522 504 2,559 512 2,596 519 2,634 527 2,673 535
30 Tebag 76.19 2,832 566 2,873 575 2,915 583 2,958 592 3,001 600 3,045 609
TOTAL 4847.78 106,331 21,266 107,883 21,577 109,459 21,892 111,057 22,211 112,678 22,536 114,323 22,865
Source: PSA Actual Census 2015 & MPT Computation - GR 1.46% (5 Members of the Family)
3.6 Urban-Rural Distributions
Barangays Code Urban/Rural Population
(2015 Census)
Alitaya 15526001 Rural 4,378
Amansabina 15526002 Rural 2,609
Anolid 15526003 Urban 7,393
Banaoang 15526004 Rural 5,267
Bantayan 15526005 Rural 3,633
Bari 15526006 Urban 6,044
Bateng 15526007 Rural 2,715
Buenlag 15526008 Rural 3,787
David 15526009 Rural 4,389
Embarcadero 15526010 Rural 3,021
Gueguesangen 15526011 Rural 2,551
Guesang 15526012 Rural 3,935
Guiguilonen 15526013 Rural 2,945
Guilig 15526014 Rural 3,491
Inlambo 15526015 Rural 1,673
Lanas 15526016 Rural 3,285
Landas 15526017 Rural 2,023
Maasin 15526018 Rural 3,862
Macayug 15526019 Rural 2,485
Malabago 15526020 Rural 5,095
Navaluan 15526021 Rural 3,678
Nibaliw 15526022 Rural 3,105
Osiem 15526023 Rural 3,437
Palua 15526024 Rural 2,013
Poblacion 15526025 Urban 4,639
Socio-Economic/ Ecological Profile|2019
MMaannggaallddaann,, PPaannggaassiinnaann 28
Pogo 15526026 Rural 1,631
Salaan 15526027 Rural 2,598
Salay 15526028 Rural 5,331
Talogtog 15526030 Rural 2,486
Tebag 15526029 Rural 2,832
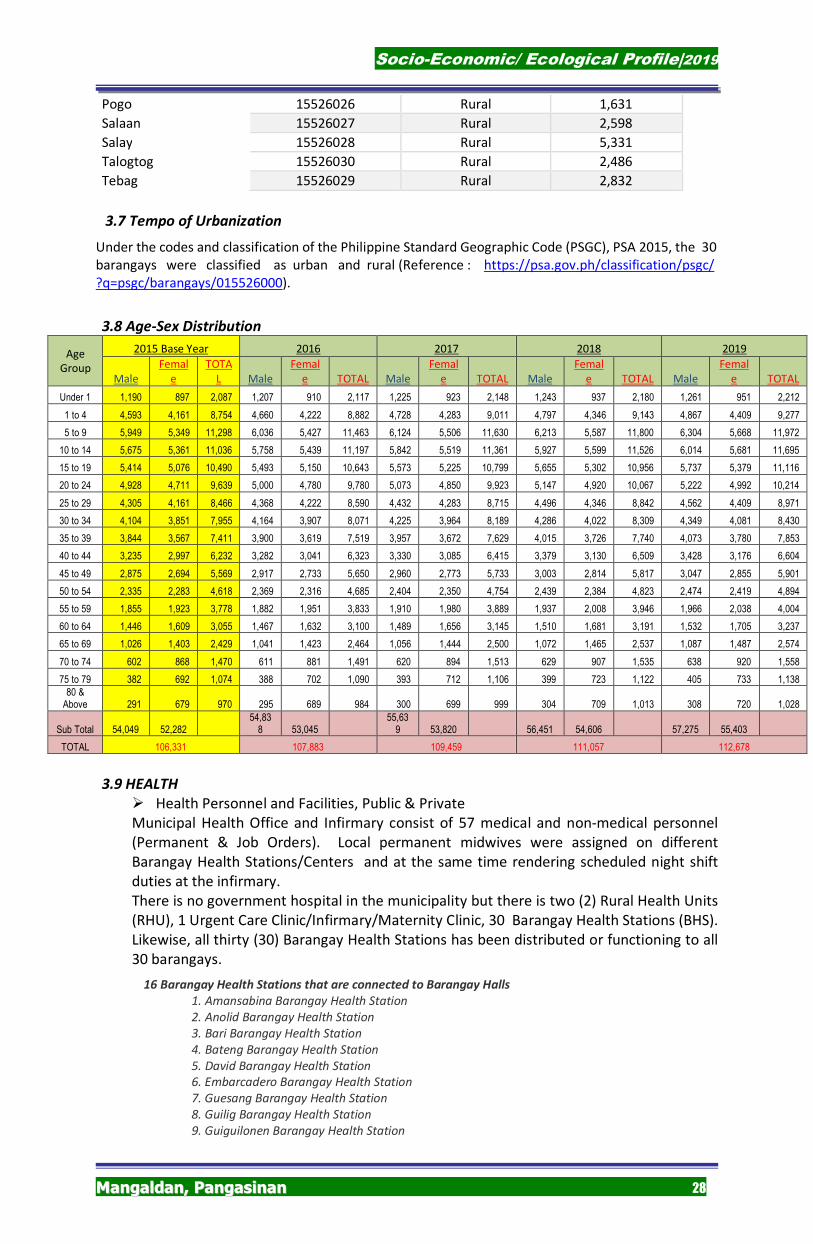
3.7 Tempo of Urbanization
Under the codes and classification of the Philippine Standard Geographic Code (PSGC), PSA 2015, the 30 barangays were classified as urban and rural (Reference : https://psa.gov.ph/classification/psgc/ ?q=psgc/barangays/015526000).
3.8 Age-Sex Distribution
Age Group
2015 Base Year 2016 2017 2018 2019
Male Femal
e TOTA
L Male Femal
e TOTAL Male Femal
e TOTAL Male Femal
e TOTAL Male Femal
e TOTAL
Under 1 1,190 897 2,087 1,207 910 2,117 1,225 923 2,148 1,243 937 2,180 1,261 951 2,212
1 to 4 4,593 4,161 8,754 4,660 4,222 8,882 4,728 4,283 9,011 4,797 4,346 9,143 4,867 4,409 9,277
5 to 9 5,949 5,349 11,298 6,036 5,427 11,463 6,124 5,506 11,630 6,213 5,587 11,800 6,304 5,668 11,972
10 to 14 5,675 5,361 11,036 5,758 5,439 11,197 5,842 5,519 11,361 5,927 5,599 11,526 6,014 5,681 11,695
15 to 19 5,414 5,076 10,490 5,493 5,150 10,643 5,573 5,225 10,799 5,655 5,302 10,956 5,737 5,379 11,116
20 to 24 4,928 4,711 9,639 5,000 4,780 9,780 5,073 4,850 9,923 5,147 4,920 10,067 5,222 4,992 10,214
25 to 29 4,305 4,161 8,466 4,368 4,222 8,590 4,432 4,283 8,715 4,496 4,346 8,842 4,562 4,409 8,971
30 to 34 4,104 3,851 7,955 4,164 3,907 8,071 4,225 3,964 8,189 4,286 4,022 8,309 4,349 4,081 8,430
35 to 39 3,844 3,567 7,411 3,900 3,619 7,519 3,957 3,672 7,629 4,015 3,726 7,740 4,073 3,780 7,853
40 to 44 3,235 2,997 6,232 3,282 3,041 6,323 3,330 3,085 6,415 3,379 3,130 6,509 3,428 3,176 6,604
45 to 49 2,875 2,694 5,569 2,917 2,733 5,650 2,960 2,773 5,733 3,003 2,814 5,817 3,047 2,855 5,901
50 to 54 2,335 2,283 4,618 2,369 2,316 4,685 2,404 2,350 4,754 2,439 2,384 4,823 2,474 2,419 4,894
55 to 59 1,855 1,923 3,778 1,882 1,951 3,833 1,910 1,980 3,889 1,937 2,008 3,946 1,966 2,038 4,004
60 to 64 1,446 1,609 3,055 1,467 1,632 3,100 1,489 1,656 3,145 1,510 1,681 3,191 1,532 1,705 3,237
65 to 69 1,026 1,403 2,429 1,041 1,423 2,464 1,056 1,444 2,500 1,072 1,465 2,537 1,087 1,487 2,574
70 to 74 602 868 1,470 611 881 1,491 620 894 1,513 629 907 1,535 638 920 1,558
75 to 79 382 692 1,074 388 702 1,090 393 712 1,106 399 723 1,122 405 733 1,138
80 & Above 291 679 970 295 689 984 300 699 999 304 709 1,013 308 720 1,028
Sub Total 54,049 52,282
54,838 53,045
55,639 53,820
56,451 54,606
57,275 55,403
TOTAL 106,331 107,883 109,459 111,057 112,678
3.9 HEALTH
� Health Personnel and Facilities, Public & Private
Municipal Health Office and Infirmary consist of 57 medical and non-medical personnel
(Permanent & Job Orders). Local permanent midwives were assigned on different
Barangay Health Stations/Centers and at the same time rendering scheduled night shift
duties at the infirmary.
There is no government hospital in the municipality but there is two (2) Rural Health Units
(RHU), 1 Urgent Care Clinic/Infirmary/Maternity Clinic, 30 Barangay Health Stations (BHS). Likewise, all thirty (30) Barangay Health Stations has been distributed or functioning to all
30 barangays.
16 Barangay Health Stations that are connected to Barangay Halls
1. Amansabina Barangay Health Station
2. Anolid Barangay Health Station
3. Bari Barangay Health Station
4. Bateng Barangay Health Station
5. David Barangay Health Station
6. Embarcadero Barangay Health Station
7. Guesang Barangay Health Station
8. Guilig Barangay Health Station
9. Guiguilonen Barangay Health Station
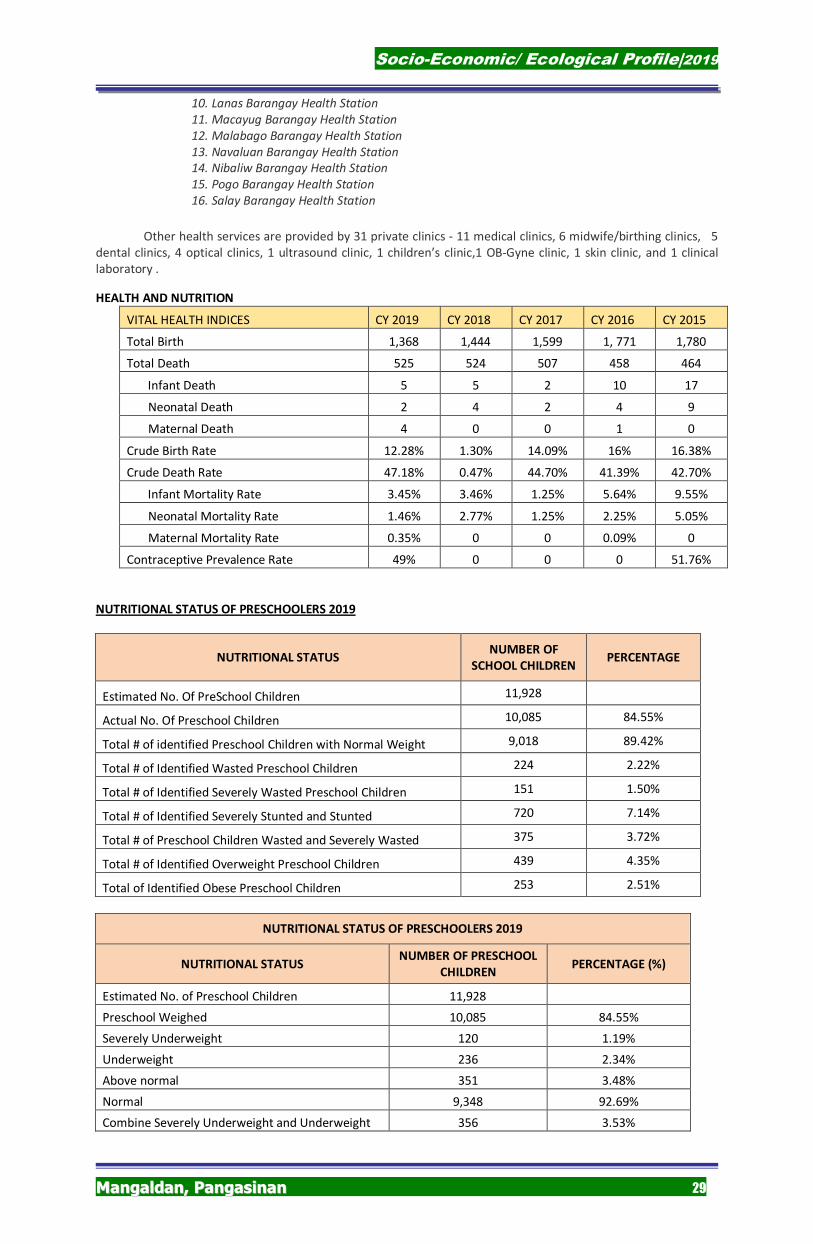
Socio-Economic/ Ecological Profile|2019
MMaannggaallddaann,, PPaannggaassiinnaann 29
10. Lanas Barangay Health Station
11. Macayug Barangay Health Station
12. Malabago Barangay Health Station
13. Navaluan Barangay Health Station
14. Nibaliw Barangay Health Station
15. Pogo Barangay Health Station
16. Salay Barangay Health Station
Other health services are provided by 31 private clinics - 11 medical clinics, 6 midwife/birthing clinics, 5
dental clinics, 4 optical clinics, 1 ultrasound clinic, 1 children’s clinic,1 OB-Gyne clinic, 1 skin clinic, and 1 clinical laboratory .
HEALTH AND NUTRITION
VITAL HEALTH INDICES CY 2019 CY 2018 CY 2017 CY 2016 CY 2015
Total Birth 1,368 1,444 1,599 1, 771 1,780
Total Death 525 524 507 458 464
Infant Death 5 5 2 10 17
Neonatal Death 2 4 2 4 9
Maternal Death 4 0 0 1 0
Crude Birth Rate 12.28% 1.30% 14.09% 16% 16.38%
Crude Death Rate 47.18% 0.47% 44.70% 41.39% 42.70%
Infant Mortality Rate 3.45% 3.46% 1.25% 5.64% 9.55%
Neonatal Mortality Rate 1.46% 2.77% 1.25% 2.25% 5.05%
Maternal Mortality Rate 0.35% 0 0 0.09% 0
Contraceptive Prevalence Rate 49% 0 0 0 51.76%
NUTRITIONAL STATUS OF PRESCHOOLERS 2019
NUTRITIONAL STATUS NUMBER OF
SCHOOL CHILDREN PERCENTAGE
Estimated No. Of PreSchool Children 11,928
Actual No. Of Preschool Children 10,085 84.55%
Total # of identified Preschool Children with Normal Weight 9,018 89.42%
Total # of Identified Wasted Preschool Children 224 2.22%
Total # of Identified Severely Wasted Preschool Children 151 1.50%
Total # of Identified Severely Stunted and Stunted 720 7.14%
Total # of Preschool Children Wasted and Severely Wasted 375 3.72%
Total # of Identified Overweight Preschool Children 439 4.35%
Total of Identified Obese Preschool Children 253 2.51%
NUTRITIONAL STATUS OF PRESCHOOLERS 2019
NUTRITIONAL STATUS NUMBER OF PRESCHOOL
CHILDREN PERCENTAGE (%)
Estimated No. of Preschool Children 11,928
Preschool Weighed 10,085 84.55%
Severely Underweight 120 1.19%
Underweight 236 2.34%
Above normal 351 3.48%
Normal 9,348 92.69%
Combine Severely Underweight and Underweight 356 3.53%
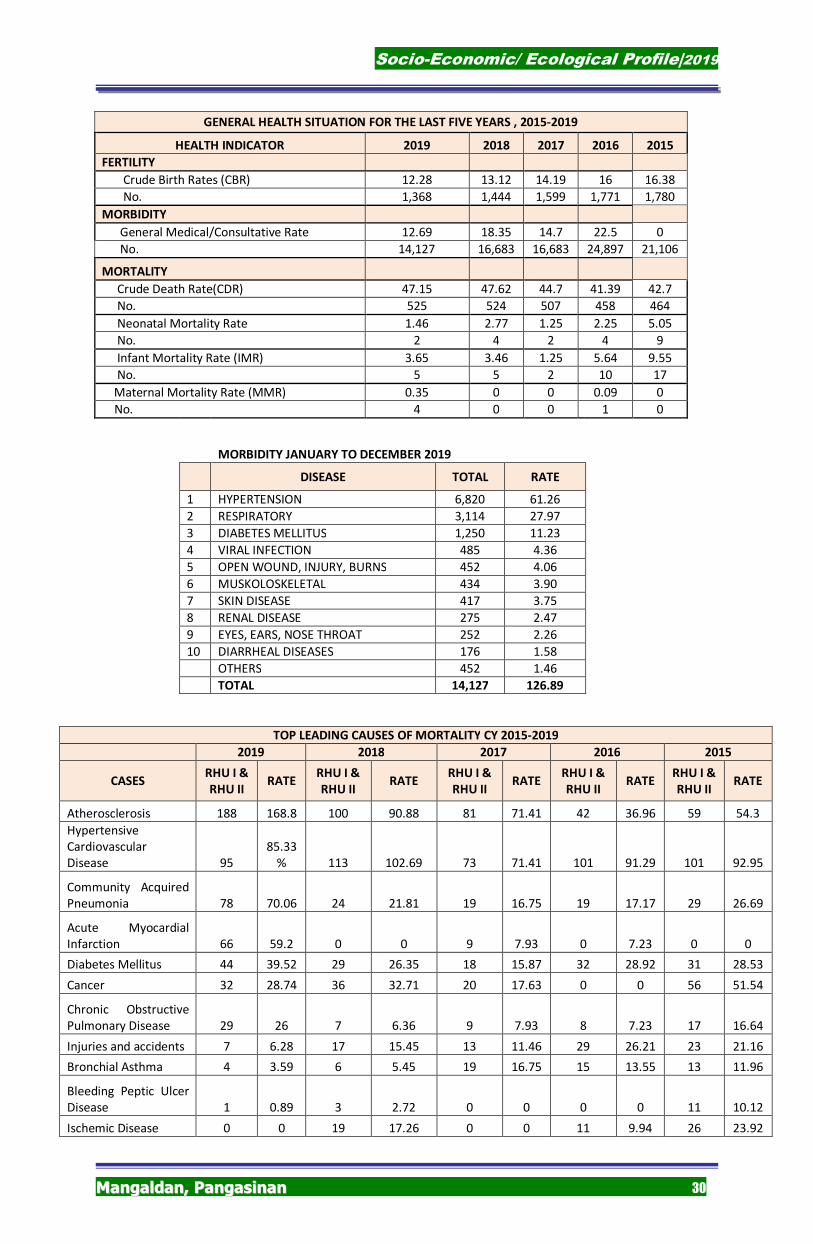
Socio-Economic/ Ecological Profile|2019
MMaannggaallddaann,, PPaannggaassiinnaann 30
GENERAL HEALTH SITUATION FOR THE LAST FIVE YEARS , 2015-2019
HEALTH INDICATOR 2019 2018 2017 2016 2015
FERTILITY
Crude Birth Rates (CBR) 12.28 13.12 14.19 16 16.38
No. 1,368 1,444 1,599 1,771 1,780
MORBIDITY
General Medical/Consultative Rate 12.69 18.35 14.7 22.5 0
No. 14,127 16,683 16,683 24,897 21,106
MORTALITY
Crude Death Rate(CDR) 47.15 47.62 44.7 41.39 42.7
No. 525 524 507 458 464
Neonatal Mortality Rate 1.46 2.77 1.25 2.25 5.05
No. 2 4 2 4 9
Infant Mortality Rate (IMR) 3.65 3.46 1.25 5.64 9.55
No. 5 5 2 10 17
Maternal Mortality Rate (MMR) 0.35 0 0 0.09 0
No. 4 0 0 1 0
MORBIDITY JANUARY TO DECEMBER 2019
DISEASE TOTAL RATE
1 HYPERTENSION 6,820 61.26
2 RESPIRATORY 3,114 27.97
3 DIABETES MELLITUS 1,250 11.23
4 VIRAL INFECTION 485 4.36
5 OPEN WOUND, INJURY, BURNS 452 4.06
6 MUSKOLOSKELETAL 434 3.90
7 SKIN DISEASE 417 3.75
8 RENAL DISEASE 275 2.47
9 EYES, EARS, NOSE THROAT 252 2.26
10 DIARRHEAL DISEASES 176 1.58
OTHERS 452 1.46
TOTAL 14,127 126.89
TOP LEADING CAUSES OF MORTALITY CY 2015-2019
2019 2018 2017 2016 2015
CASES RHU I &
RHU II RATE
RHU I &
RHU II RATE
RHU I &
RHU II RATE
RHU I &
RHU II RATE
RHU I &
RHU II RATE
Atherosclerosis 188 168.8 100 90.88 81 71.41 42 36.96 59 54.3
Hypertensive Cardiovascular Disease 95
85.33% 113 102.69 73 71.41 101 91.29 101 92.95
Community Acquired Pneumonia 78 70.06 24 21.81 19 16.75 19 17.17 29 26.69
Acute Myocardial Infarction 66 59.2 0 0 9 7.93 0 7.23 0 0
Diabetes Mellitus 44 39.52 29 26.35 18 15.87 32 28.92 31 28.53
Cancer 32 28.74 36 32.71 20 17.63 0 0 56 51.54
Chronic Obstructive Pulmonary Disease 29 26 7 6.36 9 7.93 8 7.23 17 16.64
Injuries and accidents 7 6.28 17 15.45 13 11.46 29 26.21 23 21.16
Bronchial Asthma 4 3.59 6 5.45 19 16.75 15 13.55 13 11.96
Bleeding Peptic Ulcer Disease 1 0.89 3 2.72 0 0 0 0 11 10.12
Ischemic Disease 0 0 19 17.26 0 0 11 9.94 26 23.92
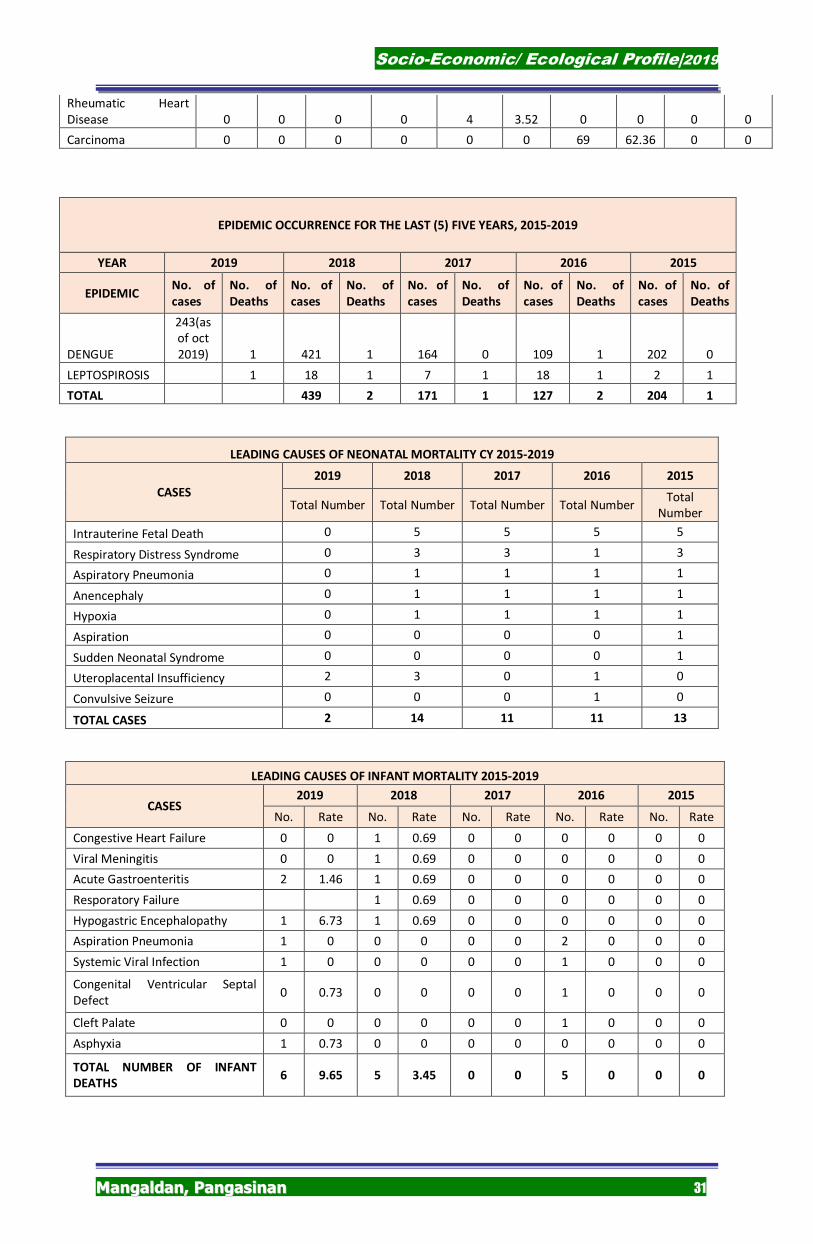
Socio-Economic/ Ecological Profile|2019
MMaannggaallddaann,, PPaannggaassiinnaann 31
Rheumatic Heart Disease 0 0 0 0 4 3.52 0 0 0 0
Carcinoma 0 0 0 0 0 0 69 62.36 0 0
EPIDEMIC OCCURRENCE FOR THE LAST (5) FIVE YEARS, 2015-2019
YEAR 2019 2018 2017 2016 2015
EPIDEMIC No. of
cases
No. of
Deaths
No. of
cases
No. of
Deaths
No. of
cases
No. of
Deaths
No. of
cases
No. of
Deaths
No. of
cases
No. of
Deaths
DENGUE
243(as of oct 2019) 1 421 1 164 0
109 1 202 0
LEPTOSPIROSIS
1 18 1 7 1 18 1 2 1
TOTAL 439 2 171 1 127 2 204 1
LEADING CAUSES OF NEONATAL MORTALITY CY 2015-2019
CASES
2019 2018 2017 2016 2015
Total Number Total Number Total Number Total Number Total
Number
Intrauterine Fetal Death 0 5 5 5 5
Respiratory Distress Syndrome 0 3 3 1 3
Aspiratory Pneumonia 0 1 1 1 1
Anencephaly 0 1 1 1 1
Hypoxia 0 1 1 1 1
Aspiration 0 0 0 0 1
Sudden Neonatal Syndrome 0 0 0 0 1
Uteroplacental Insufficiency 2 3 0 1 0
Convulsive Seizure 0 0 0 1 0
TOTAL CASES 2 14 11 11 13
LEADING CAUSES OF INFANT MORTALITY 2015-2019
CASES 2019 2018 2017 2016 2015
No. Rate No. Rate No. Rate No. Rate No. Rate
Congestive Heart Failure 0 0 1 0.69 0 0 0 0 0 0
Viral Meningitis 0 0 1 0.69 0 0 0 0 0 0
Acute Gastroenteritis 2 1.46 1 0.69 0 0 0 0 0 0
Resporatory Failure 1 0.69 0 0 0 0 0 0
Hypogastric Encephalopathy 1 6.73 1 0.69 0 0 0 0 0 0
Aspiration Pneumonia 1 0 0 0 0 0 2 0 0 0
Systemic Viral Infection 1 0 0 0 0 0 1 0 0 0
Congenital Ventricular Septal Defect
0 0.73 0 0 0 0 1 0 0 0
Cleft Palate 0 0 0 0 0 0 1 0 0 0
Asphyxia 1 0.73 0 0 0 0 0 0 0 0
TOTAL NUMBER OF INFANT
DEATHS 6 9.65 5 3.45 0 0 5 0 0 0
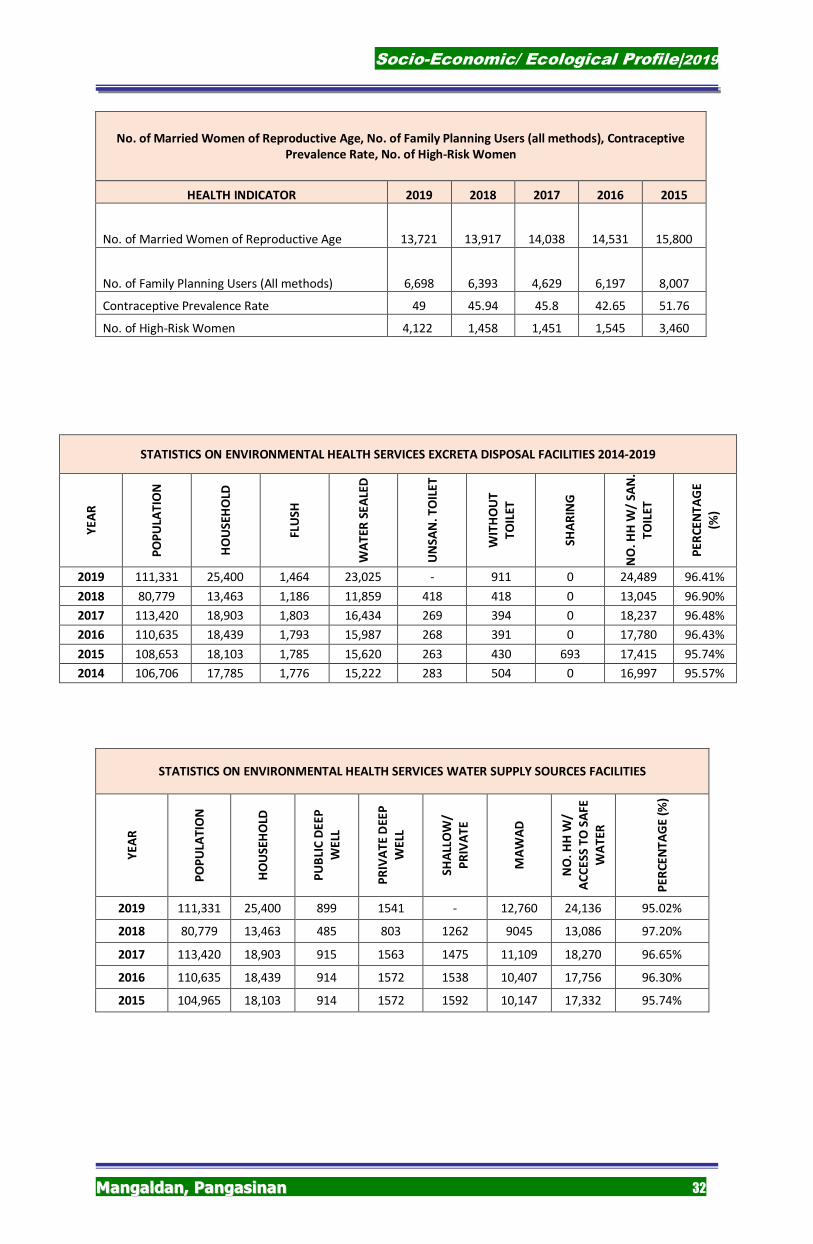
Socio-Economic/ Ecological Profile|2019
MMaannggaallddaann,, PPaannggaassiinnaann 32
No. of Married Women of Reproductive Age, No. of Family Planning Users (all methods), Contraceptive
Prevalence Rate, No. of High-Risk Women
HEALTH INDICATOR 2019 2018 2017 2016 2015
No. of Married Women of Reproductive Age 13,721 13,917 14,038 14,531 15,800
No. of Family Planning Users (All methods) 6,698 6,393 4,629 6,197 8,007
Contraceptive Prevalence Rate 49 45.94 45.8 42.65 51.76
No. of High-Risk Women 4,122 1,458 1,451 1,545 3,460
STATISTICS ON ENVIRONMENTAL HEALTH SERVICES EXCRETA DISPOSAL FACILITIES 2014-2019
YE
AR
PO
PU
LAT
ION
HO
US
EH
OLD
FLU
SH
WA
TE
R S
EA
LED
UN
SA
N.
TO
ILE
T
WIT
HO
UT
TO
ILE
T
SH
AR
ING
NO
. H
H W
/ S
AN
.
TO
ILE
T
PE
RC
EN
TA
GE
(%)
2019 111,331 25,400 1,464 23,025 - 911 0 24,489 96.41%
2018 80,779 13,463 1,186 11,859 418 418 0 13,045 96.90%
2017 113,420 18,903 1,803 16,434 269 394 0 18,237 96.48%
2016 110,635 18,439 1,793 15,987 268 391 0 17,780 96.43%
2015 108,653 18,103 1,785 15,620 263 430 693 17,415 95.74%
2014 106,706 17,785 1,776 15,222 283 504 0 16,997 95.57%
STATISTICS ON ENVIRONMENTAL HEALTH SERVICES WATER SUPPLY SOURCES FACILITIES
YE
AR
PO
PU
LAT
ION
HO
US
EH
OLD
PU
BLI
C D
EE
P
WE
LL
PR
IVA
TE
DE
EP
WE
LL
SH
ALL
OW
/
PR
IVA
TE
MA
WA
D
NO
. H
H W
/
AC
CE
SS
TO
SA
FE
WA
TE
R
PE
RC
EN
TA
GE
(%
)
2019 111,331 25,400 899 1541 - 12,760 24,136 95.02%
2018 80,779 13,463 485 803 1262 9045 13,086 97.20%
2017 113,420 18,903 915 1563 1475 11,109 18,270 96.65%
2016 110,635 18,439 914 1572 1538 10,407 17,756 96.30%
2015 104,965 18,103 914 1572 1592 10,147 17,332 95.74%
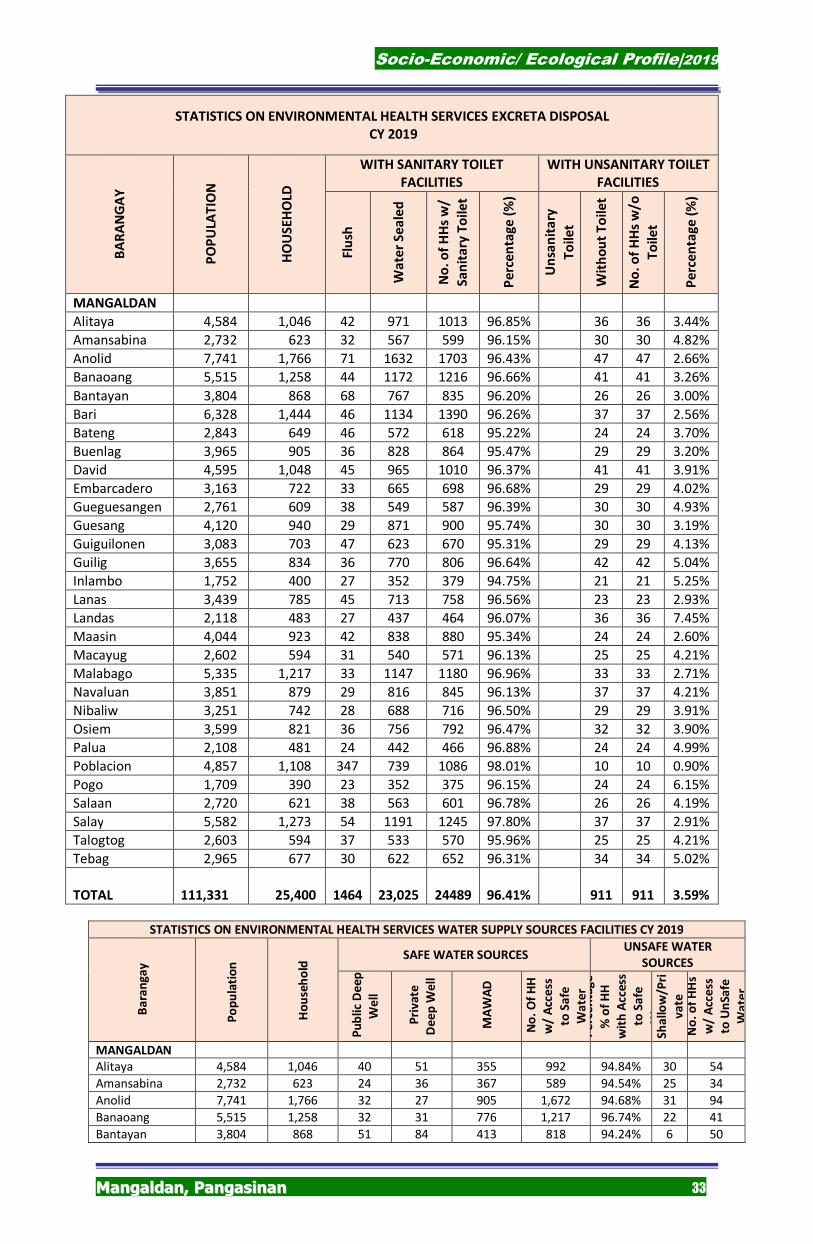
Socio-Economic/ Ecological Profile|2019
MMaannggaallddaann,, PPaannggaassiinnaann 33
STATISTICS ON ENVIRONMENTAL HEALTH SERVICES EXCRETA DISPOSAL
CY 2019 B
AR
AN
GA
Y
PO
PU
LAT
ION
HO
US
EH
OLD
WITH SANITARY TOILET
FACILITIES
WITH UNSANITARY TOILET
FACILITIES
Flu
sh
Wa
ter
Se
ale
d
No
. o
f H
Hs
w/
Sa
nit
ary
To
ile
t
Pe
rce
nta
ge
(%
)
Un
san
ita
ry
To
ile
t
Wit
ho
ut
To
ile
t
No
. o
f H
Hs
w/o
To
ile
t
Pe
rce
nta
ge
(%
)
MANGALDAN
Alitaya 4,584 1,046 42 971 1013 96.85% 36 36 3.44%
Amansabina 2,732 623 32 567 599 96.15% 30 30 4.82%
Anolid 7,741 1,766 71 1632 1703 96.43% 47 47 2.66%
Banaoang 5,515 1,258 44 1172 1216 96.66% 41 41 3.26%
Bantayan 3,804 868 68 767 835 96.20% 26 26 3.00%
Bari 6,328 1,444 46 1134 1390 96.26% 37 37 2.56%
Bateng 2,843 649 46 572 618 95.22% 24 24 3.70%
Buenlag 3,965 905 36 828 864 95.47% 29 29 3.20%
David 4,595 1,048 45 965 1010 96.37% 41 41 3.91%
Embarcadero 3,163 722 33 665 698 96.68% 29 29 4.02%
Gueguesangen 2,761 609 38 549 587 96.39% 30 30 4.93%
Guesang 4,120 940 29 871 900 95.74% 30 30 3.19%
Guiguilonen 3,083 703 47 623 670 95.31% 29 29 4.13%
Guilig 3,655 834 36 770 806 96.64% 42 42 5.04%
Inlambo 1,752 400 27 352 379 94.75% 21 21 5.25%
Lanas 3,439 785 45 713 758 96.56% 23 23 2.93%
Landas 2,118 483 27 437 464 96.07% 36 36 7.45%
Maasin 4,044 923 42 838 880 95.34% 24 24 2.60%
Macayug 2,602 594 31 540 571 96.13% 25 25 4.21%
Malabago 5,335 1,217 33 1147 1180 96.96% 33 33 2.71%
Navaluan 3,851 879 29 816 845 96.13% 37 37 4.21%
Nibaliw 3,251 742 28 688 716 96.50% 29 29 3.91%
Osiem 3,599 821 36 756 792 96.47% 32 32 3.90%
Palua 2,108 481 24 442 466 96.88% 24 24 4.99%
Poblacion 4,857 1,108 347 739 1086 98.01% 10 10 0.90%
Pogo 1,709 390 23 352 375 96.15% 24 24 6.15%
Salaan 2,720 621 38 563 601 96.78% 26 26 4.19%
Salay 5,582 1,273 54 1191 1245 97.80% 37 37 2.91%
Talogtog 2,603 594 37 533 570 95.96% 25 25 4.21%
Tebag 2,965 677 30 622 652 96.31% 34 34 5.02%
TOTAL
111,331 25,400 1464 23,025 24489 96.41% 911 911 3.59%
STATISTICS ON ENVIRONMENTAL HEALTH SERVICES WATER SUPPLY SOURCES FACILITIES CY 2019
Ba
ran
ga
y
P
op
ula
tio
n
H
ou
seh
old
SAFE WATER SOURCES UNSAFE WATER
SOURCES
Pu
bli
c D
ee
p
We
ll
Pri
va
te
De
ep
We
ll
MA
WA
D
No
. O
f H
H
w/
Acc
ess
to S
afe
Wa
ter
P
erc
en
tag
e
% o
f H
H
wit
h A
cce
ss
to S
afe
Wa
ter
Sh
all
ow
/Pri
va
te
No
. o
f H
Hs
w/
Acc
ess
to U
nS
afe
Wa
ter
MANGALDAN Alitaya 4,584 1,046 40 51 355 992 94.84% 30 54
Amansabina 2,732 623 24 36 367 589 94.54% 25 34
Anolid 7,741 1,766 32 27 905 1,672 94.68% 31 94
Banaoang 5,515 1,258 32 31 776 1,217 96.74% 22 41
Bantayan 3,804 868 51 84 413 818 94.24% 6 50
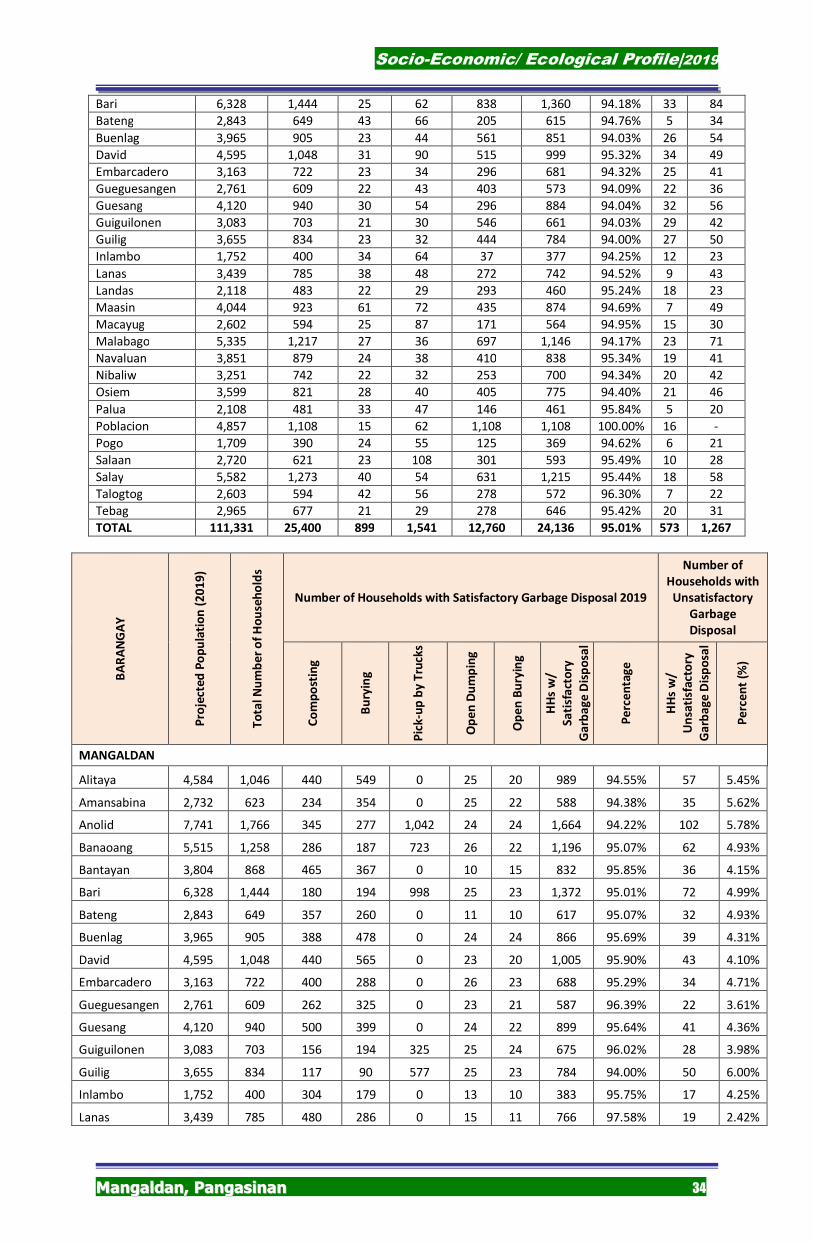
Socio-Economic/ Ecological Profile|2019
MMaannggaallddaann,, PPaannggaassiinnaann 34
Bari 6,328 1,444 25 62 838 1,360 94.18% 33 84
Bateng 2,843 649 43 66 205 615 94.76% 5 34
Buenlag 3,965 905 23 44 561 851 94.03% 26 54
David 4,595 1,048 31 90 515 999 95.32% 34 49
Embarcadero 3,163 722 23 34 296 681 94.32% 25 41
Gueguesangen 2,761 609 22 43 403 573 94.09% 22 36
Guesang 4,120 940 30 54 296 884 94.04% 32 56
Guiguilonen 3,083 703 21 30 546 661 94.03% 29 42
Guilig 3,655 834 23 32 444 784 94.00% 27 50
Inlambo 1,752 400 34 64 37 377 94.25% 12 23
Lanas 3,439 785 38 48 272 742 94.52% 9 43
Landas 2,118 483 22 29 293 460 95.24% 18 23
Maasin 4,044 923 61 72 435 874 94.69% 7 49
Macayug 2,602 594 25 87 171 564 94.95% 15 30
Malabago 5,335 1,217 27 36 697 1,146 94.17% 23 71
Navaluan 3,851 879 24 38 410 838 95.34% 19 41
Nibaliw 3,251 742 22 32 253 700 94.34% 20 42
Osiem 3,599 821 28 40 405 775 94.40% 21 46
Palua 2,108 481 33 47 146 461 95.84% 5 20
Poblacion 4,857 1,108 15 62 1,108 1,108 100.00% 16 -
Pogo 1,709 390 24 55 125 369 94.62% 6 21
Salaan 2,720 621 23 108 301 593 95.49% 10 28
Salay 5,582 1,273 40 54 631 1,215 95.44% 18 58
Talogtog 2,603 594 42 56 278 572 96.30% 7 22
Tebag 2,965 677 21 29 278 646 95.42% 20 31
TOTAL 111,331 25,400 899 1,541 12,760 24,136 95.01% 573 1,267
BA
RA
NG
AY
Pro
ject
ed
Po
pu
lati
on
(2
01
9)
To
tal
Nu
mb
er
of
Ho
use
ho
lds
Number of Households with Satisfactory Garbage Disposal 2019
Number of
Households with
Unsatisfactory
Garbage
Disposal
Co
mp
ost
ing
Bu
ryin
g
Pic
k-u
p b
y T
ruck
s
Op
en
Du
mp
ing
Op
en
Bu
ryin
g
HH
s w
/
Sa
tisf
act
ory
Ga
rba
ge
Dis
po
sal
Pe
rce
nta
ge
HH
s w
/
Un
sati
sfa
cto
ry
Ga
rba
ge
Dis
po
sal
Pe
rce
nt
(%)
MANGALDAN
Alitaya 4,584 1,046 440 549 0 25 20 989 94.55% 57 5.45%
Amansabina 2,732 623 234 354 0 25 22 588 94.38% 35 5.62%
Anolid 7,741 1,766 345 277 1,042 24 24 1,664 94.22% 102 5.78%
Banaoang 5,515 1,258 286 187 723 26 22 1,196 95.07% 62 4.93%
Bantayan 3,804 868 465 367 0 10 15 832 95.85% 36 4.15%
Bari 6,328 1,444 180 194 998 25 23 1,372 95.01% 72 4.99%
Bateng 2,843 649 357 260 0 11 10 617 95.07% 32 4.93%
Buenlag 3,965 905 388 478 0 24 24 866 95.69% 39 4.31%
David 4,595 1,048 440 565 0 23 20 1,005 95.90% 43 4.10%
Embarcadero 3,163 722 400 288 0 26 23 688 95.29% 34 4.71%
Gueguesangen 2,761 609 262 325 0 23 21 587 96.39% 22 3.61%
Guesang 4,120 940 500 399 0 24 22 899 95.64% 41 4.36%
Guiguilonen 3,083 703 156 194 325 25 24 675 96.02% 28 3.98%
Guilig 3,655 834 117 90 577 25 23 784 94.00% 50 6.00%
Inlambo 1,752 400 304 179 0 13 10 383 95.75% 17 4.25%
Lanas 3,439 785 480 286 0 15 11 766 97.58% 19 2.42%
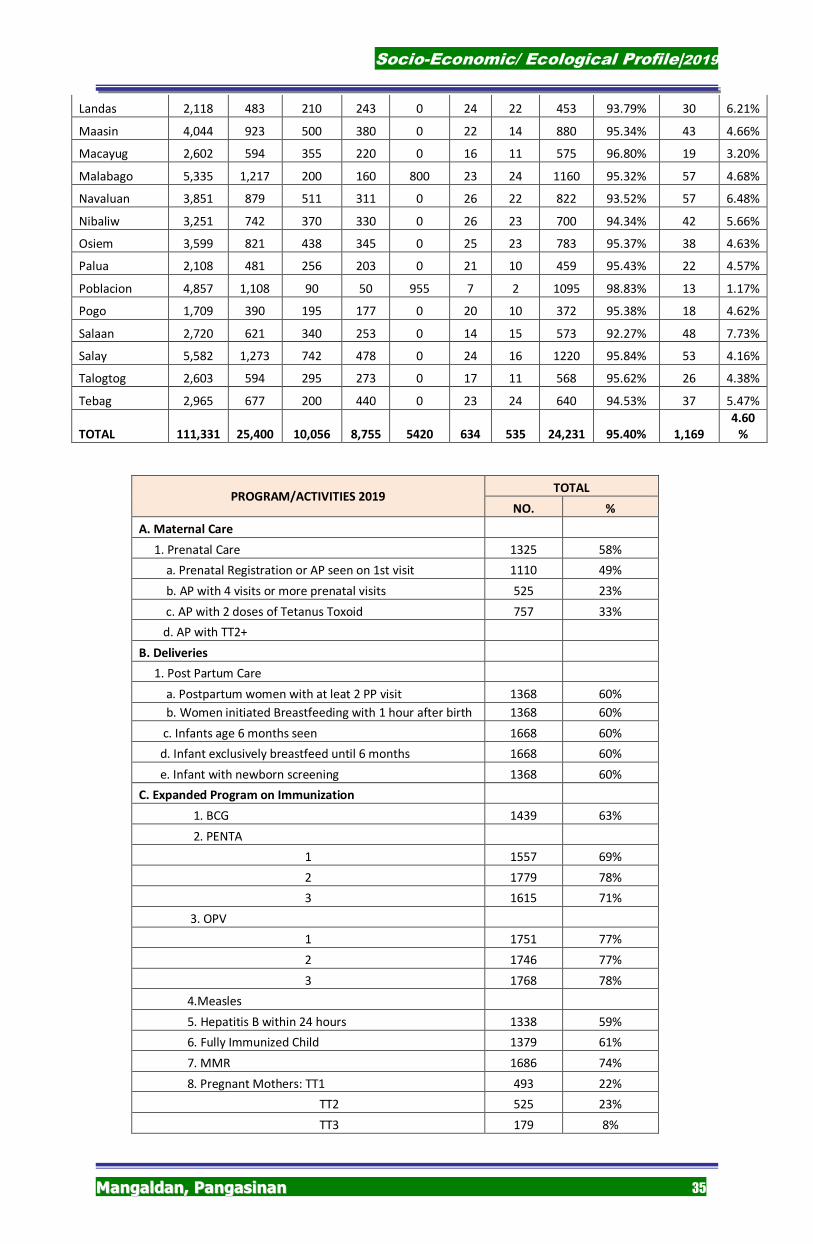
Socio-Economic/ Ecological Profile|2019
MMaannggaallddaann,, PPaannggaassiinnaann 35
Landas 2,118 483 210 243 0 24 22 453 93.79% 30 6.21%
Maasin 4,044 923 500 380 0 22 14 880 95.34% 43 4.66%
Macayug 2,602 594 355 220 0 16 11 575 96.80% 19 3.20%
Malabago 5,335 1,217 200 160 800 23 24 1160 95.32% 57 4.68%
Navaluan 3,851 879 511 311 0 26 22 822 93.52% 57 6.48%
Nibaliw 3,251 742 370 330 0 26 23 700 94.34% 42 5.66%
Osiem 3,599 821 438 345 0 25 23 783 95.37% 38 4.63%
Palua 2,108 481 256 203 0 21 10 459 95.43% 22 4.57%
Poblacion 4,857 1,108 90 50 955 7 2 1095 98.83% 13 1.17%
Pogo 1,709 390 195 177 0 20 10 372 95.38% 18 4.62%
Salaan 2,720 621 340 253 0 14 15 573 92.27% 48 7.73%
Salay 5,582 1,273 742 478 0 24 16 1220 95.84% 53 4.16%
Talogtog 2,603 594 295 273 0 17 11 568 95.62% 26 4.38%
Tebag 2,965 677 200 440 0 23 24 640 94.53% 37 5.47%
TOTAL 111,331 25,400 10,056 8,755 5420 634 535 24,231 95.40% 1,169
4.60
%
PROGRAM/ACTIVITIES 2019 TOTAL
NO. %
A. Maternal Care
1. Prenatal Care 1325 58%
a. Prenatal Registration or AP seen on 1st visit 1110 49%
b. AP with 4 visits or more prenatal visits 525 23%
c. AP with 2 doses of Tetanus Toxoid 757 33%
d. AP with TT2+
B. Deliveries
1. Post Partum Care
a. Postpartum women with at leat 2 PP visit 1368 60%
b. Women initiated Breastfeeding with 1 hour after birth 1368 60%
c. Infants age 6 months seen 1668 60%
d. Infant exclusively breastfeed until 6 months 1668 60%
e. Infant with newborn screening 1368 60%
C. Expanded Program on Immunization
1. BCG 1439 63%
2. PENTA
1 1557 69%
2 1779 78%
3 1615 71%
3. OPV
1 1751 77%
2 1746 77%
3 1768 78%
4.Measles
5. Hepatitis B within 24 hours 1338 59%
6. Fully Immunized Child 1379 61%
7. MMR 1686 74%
8. Pregnant Mothers: TT1 493 22%
TT2 525 23%
TT3 179 8%
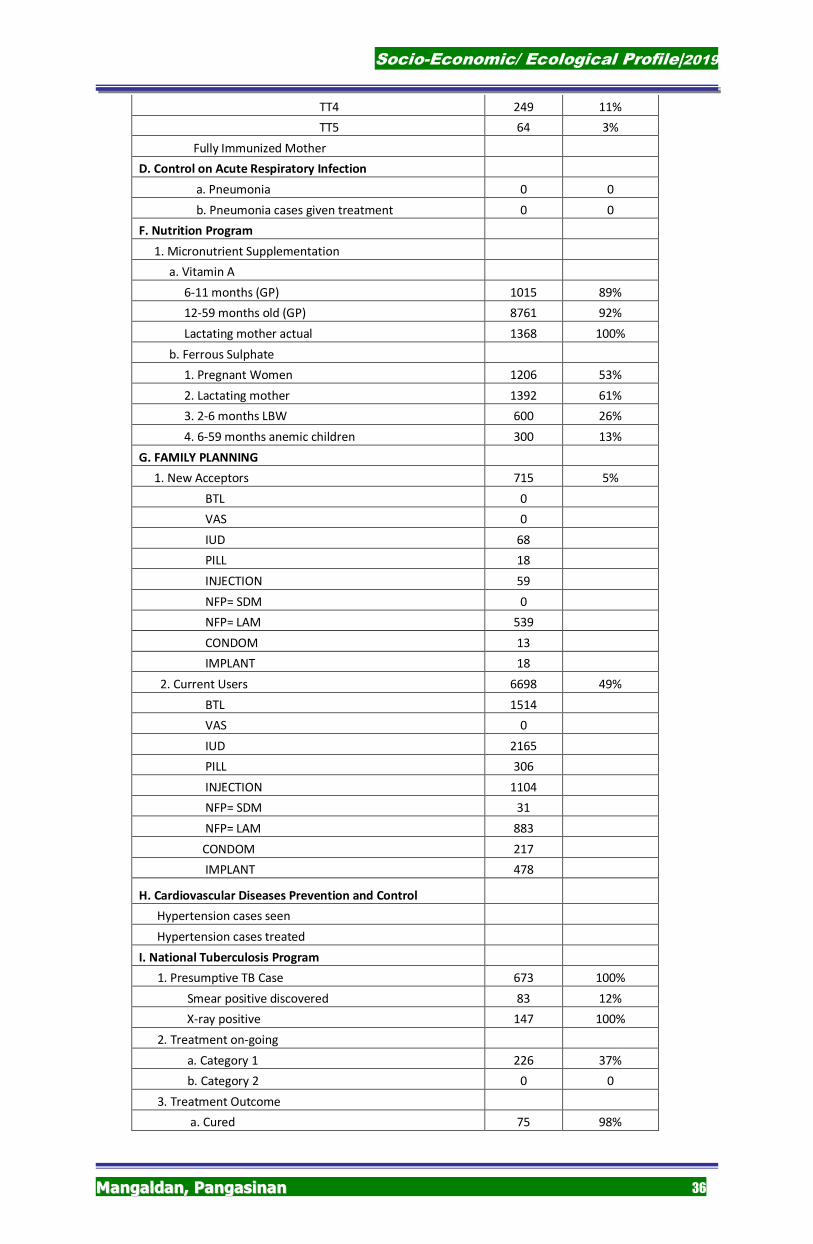
Socio-Economic/ Ecological Profile|2019
MMaannggaallddaann,, PPaannggaassiinnaann 36
TT4 249 11%
TT5 64 3%
Fully Immunized Mother
D. Control on Acute Respiratory Infection
a. Pneumonia 0 0
b. Pneumonia cases given treatment 0 0
F. Nutrition Program
1. Micronutrient Supplementation
a. Vitamin A
6-11 months (GP) 1015 89%
12-59 months old (GP) 8761 92%
Lactating mother actual 1368 100%
b. Ferrous Sulphate
1. Pregnant Women 1206 53%
2. Lactating mother 1392 61%
3. 2-6 months LBW 600 26%
4. 6-59 months anemic children 300 13%
G. FAMILY PLANNING
1. New Acceptors 715 5%
BTL 0
VAS 0
IUD 68
PILL 18
INJECTION 59
NFP= SDM 0
NFP= LAM 539
CONDOM 13
IMPLANT 18
2. Current Users 6698 49%
BTL 1514
VAS 0
IUD 2165
PILL 306
INJECTION 1104
NFP= SDM 31
NFP= LAM 883
CONDOM 217
IMPLANT 478
H. Cardiovascular Diseases Prevention and Control
Hypertension cases seen
Hypertension cases treated
I. National Tuberculosis Program
1. Presumptive TB Case 673 100%
Smear positive discovered 83 12%
X-ray positive 147 100%
2. Treatment on-going
a. Category 1 226 37%
b. Category 2 0 0
3. Treatment Outcome
a. Cured 75 98%
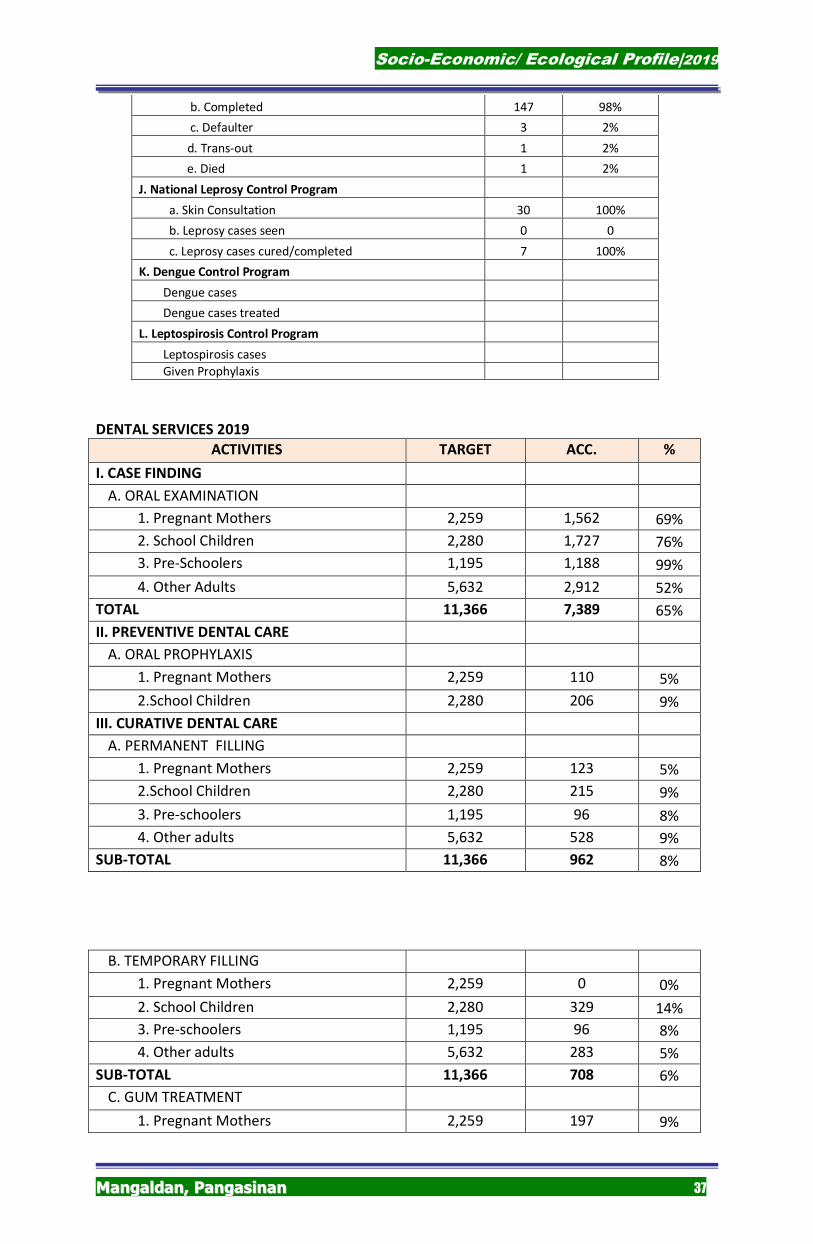
Socio-Economic/ Ecological Profile|2019
MMaannggaallddaann,, PPaannggaassiinnaann 37
b. Completed 147 98%
c. Defaulter 3 2%
d. Trans-out 1 2%
e. Died 1 2%
J. National Leprosy Control Program
a. Skin Consultation 30 100%
b. Leprosy cases seen 0 0
c. Leprosy cases cured/completed 7 100%
K. Dengue Control Program
Dengue cases
Dengue cases treated
L. Leptospirosis Control Program
Leptospirosis cases
Given Prophylaxis
DENTAL SERVICES 2019
ACTIVITIES TARGET ACC. %
I. CASE FINDING
A. ORAL EXAMINATION
1. Pregnant Mothers 2,259 1,562 69%
2. School Children 2,280 1,727 76%
3. Pre-Schoolers 1,195 1,188 99%
4. Other Adults 5,632 2,912 52%
TOTAL 11,366 7,389 65%
II. PREVENTIVE DENTAL CARE
A. ORAL PROPHYLAXIS
1. Pregnant Mothers 2,259 110 5%
2.School Children 2,280 206 9%
III. CURATIVE DENTAL CARE
A. PERMANENT FILLING
1. Pregnant Mothers 2,259 123 5%
2.School Children 2,280 215 9%
3. Pre-schoolers 1,195 96 8%
4. Other adults 5,632 528 9%
SUB-TOTAL 11,366 962 8%
B. TEMPORARY FILLING
1. Pregnant Mothers 2,259 0 0%
2. School Children 2,280 329 14%
3. Pre-schoolers 1,195 96 8%
4. Other adults 5,632 283 5%
SUB-TOTAL 11,366 708 6%
C. GUM TREATMENT
1. Pregnant Mothers 2,259 197 9%
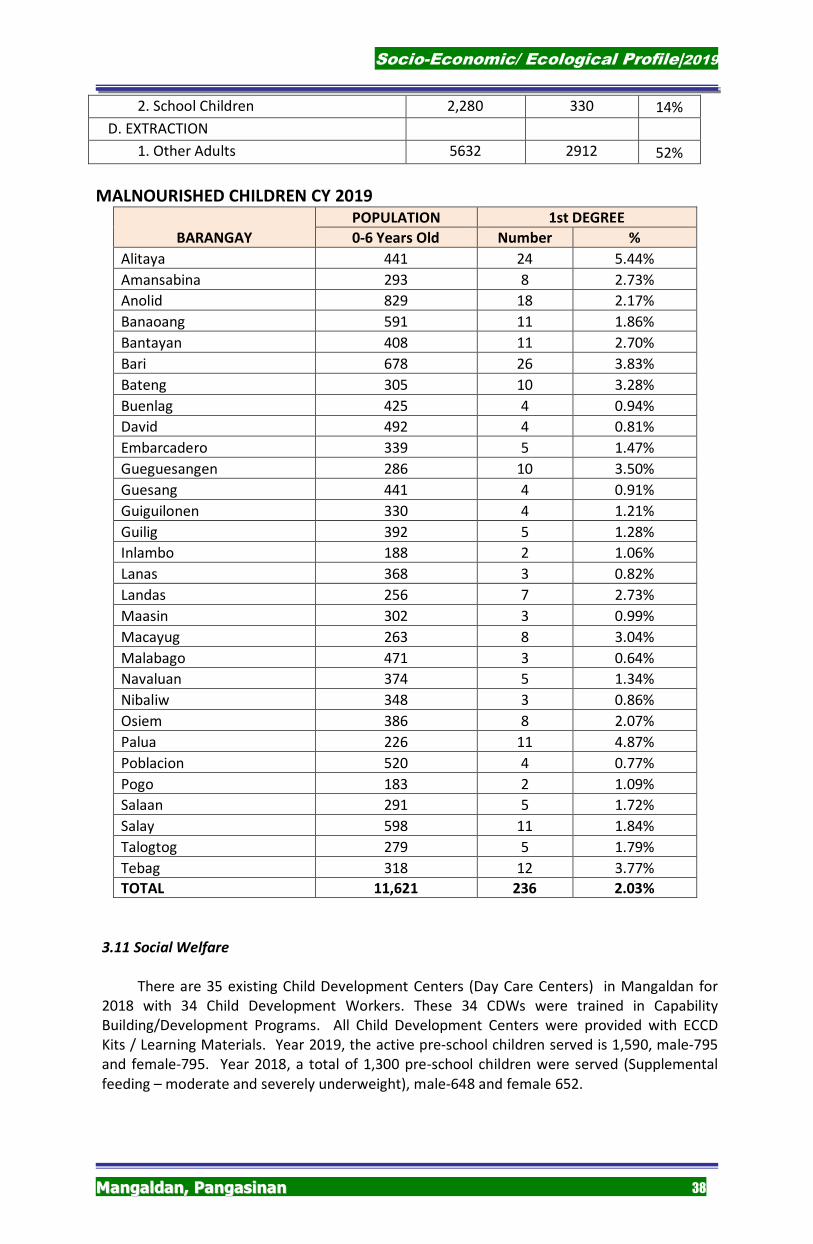
Socio-Economic/ Ecological Profile|2019
MMaannggaallddaann,, PPaannggaassiinnaann 38
2. School Children 2,280 330 14%
D. EXTRACTION
1. Other Adults 5632 2912 52%
MALNOURISHED CHILDREN CY 2019
BARANGAY
POPULATION 1st DEGREE
0-6 Years Old Number %
Alitaya 441 24 5.44%
Amansabina 293 8 2.73%
Anolid 829 18 2.17%
Banaoang 591 11 1.86%
Bantayan 408 11 2.70%
Bari 678 26 3.83%
Bateng 305 10 3.28%
Buenlag 425 4 0.94%
David 492 4 0.81%
Embarcadero 339 5 1.47%
Gueguesangen 286 10 3.50%
Guesang 441 4 0.91%
Guiguilonen 330 4 1.21%
Guilig 392 5 1.28%
Inlambo 188 2 1.06%
Lanas 368 3 0.82%
Landas 256 7 2.73%
Maasin 302 3 0.99%
Macayug 263 8 3.04%
Malabago 471 3 0.64%
Navaluan 374 5 1.34%
Nibaliw 348 3 0.86%
Osiem 386 8 2.07%
Palua 226 11 4.87%
Poblacion 520 4 0.77%
Pogo 183 2 1.09%
Salaan 291 5 1.72%
Salay 598 11 1.84%
Talogtog 279 5 1.79%
Tebag 318 12 3.77%
TOTAL 11,621 236 2.03%
3.11 Social Welfare
There are 35 existing Child Development Centers (Day Care Centers) in Mangaldan for
2018 with 34 Child Development Workers. These 34 CDWs were trained in Capability
Building/Development Programs. All Child Development Centers were provided with ECCD
Kits / Learning Materials. Year 2019, the active pre-school children served is 1,590, male-795
and female-795. Year 2018, a total of 1,300 pre-school children were served (Supplemental
feeding – moderate and severely underweight), male-648 and female 652.
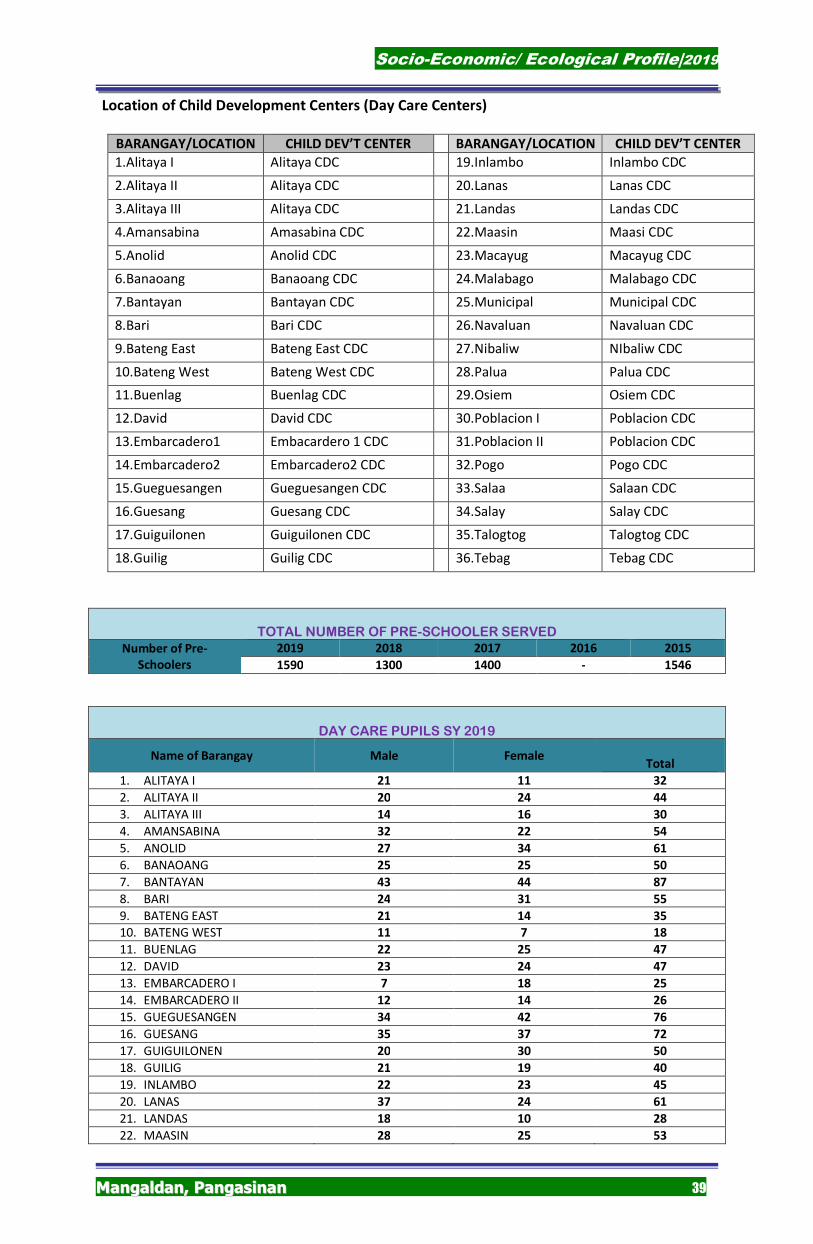
Socio-Economic/ Ecological Profile|2019
MMaannggaallddaann,, PPaannggaassiinnaann 39
Location of Child Development Centers (Day Care Centers)
BARANGAY/LOCATION CHILD DEV’T CENTER BARANGAY/LOCATION CHILD DEV’T CENTER
1.Alitaya I Alitaya CDC 19.Inlambo Inlambo CDC
2.Alitaya II Alitaya CDC 20.Lanas Lanas CDC
3.Alitaya III Alitaya CDC 21.Landas Landas CDC
4.Amansabina Amasabina CDC 22.Maasin Maasi CDC
5.Anolid Anolid CDC 23.Macayug Macayug CDC
6.Banaoang Banaoang CDC 24.Malabago Malabago CDC
7.Bantayan Bantayan CDC 25.Municipal Municipal CDC
8.Bari Bari CDC 26.Navaluan Navaluan CDC
9.Bateng East Bateng East CDC 27.Nibaliw NIbaliw CDC
10.Bateng West Bateng West CDC 28.Palua Palua CDC
11.Buenlag Buenlag CDC 29.Osiem Osiem CDC
12.David David CDC 30.Poblacion I Poblacion CDC
13.Embarcadero1 Embacardero 1 CDC 31.Poblacion II Poblacion CDC
14.Embarcadero2 Embarcadero2 CDC 32.Pogo Pogo CDC
15.Gueguesangen Gueguesangen CDC 33.Salaa Salaan CDC
16.Guesang Guesang CDC 34.Salay Salay CDC
17.Guiguilonen Guiguilonen CDC 35.Talogtog Talogtog CDC
18.Guilig Guilig CDC 36.Tebag Tebag CDC
TOTAL NUMBER OF PRE-SCHOOLER SERVED
Number of Pre-
Schoolers
2019 2018 2017 2016 2015
1590 1300 1400 - 1546
DAY CARE PUPILS SY 2019
Name of Barangay Male Female
Total
1. ALITAYA I 21 11 32
2. ALITAYA II 20 24 44
3. ALITAYA III 14 16 30
4. AMANSABINA 32 22 54
5. ANOLID 27 34 61
6. BANAOANG 25 25 50
7. BANTAYAN 43 44 87
8. BARI 24 31 55
9. BATENG EAST 21 14 35
10. BATENG WEST 11 7 18
11. BUENLAG 22 25 47
12. DAVID 23 24 47
13. EMBARCADERO I 7 18 25
14. EMBARCADERO II 12 14 26
15. GUEGUESANGEN 34 42 76
16. GUESANG 35 37 72
17. GUIGUILONEN 20 30 50
18. GUILIG 21 19 40
19. INLAMBO 22 23 45
20. LANAS 37 24 61
21. LANDAS 18 10 28
22. MAASIN 28 25 53
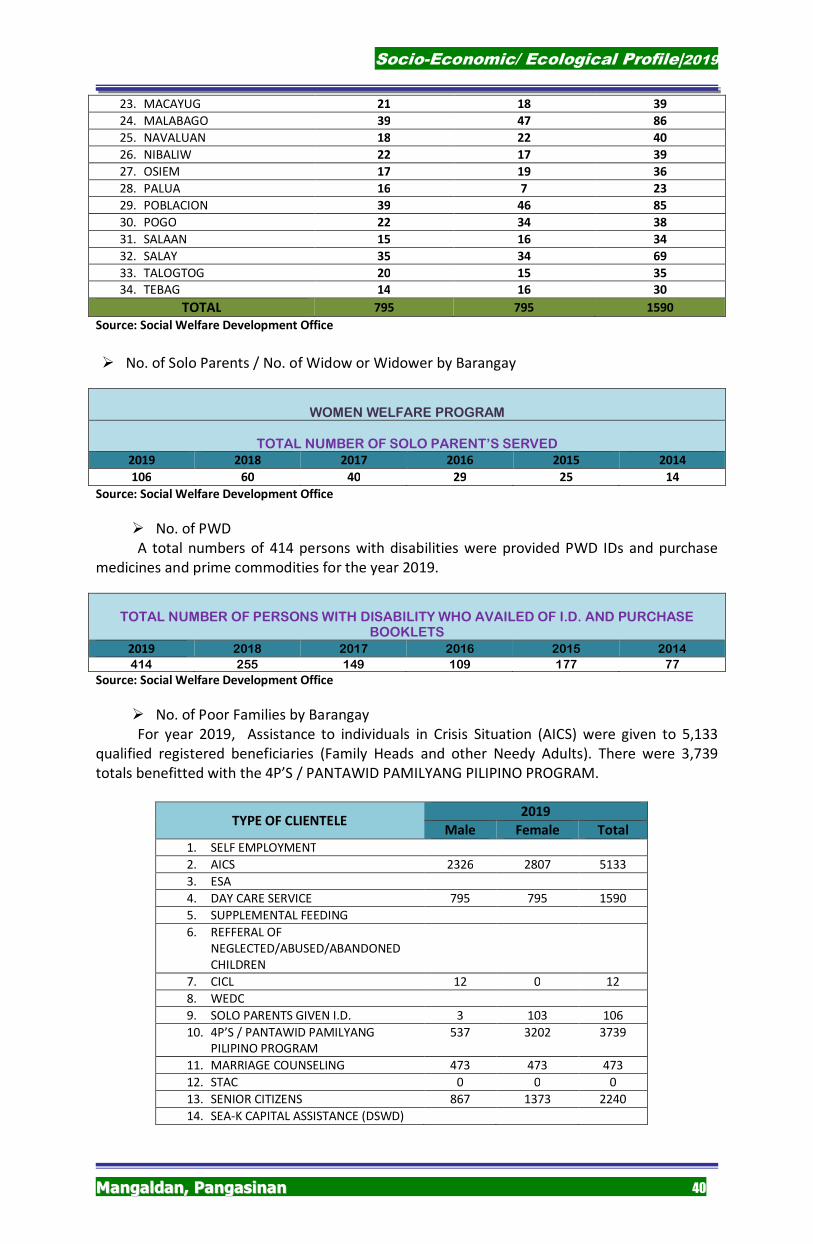
Socio-Economic/ Ecological Profile|2019
MMaannggaallddaann,, PPaannggaassiinnaann 40
23. MACAYUG 21 18 39
24. MALABAGO 39 47 86
25. NAVALUAN 18 22 40
26. NIBALIW 22 17 39
27. OSIEM 17 19 36
28. PALUA 16 7 23
29. POBLACION 39 46 85
30. POGO 22 34 38
31. SALAAN 15 16 34
32. SALAY 35 34 69
33. TALOGTOG 20 15 35
34. TEBAG 14 16 30
TOTAL 795 795 1590
Source: Social Welfare Development Office
� No. of Solo Parents / No. of Widow or Widower by Barangay
WOMEN WELFARE PROGRAM
TOTAL NUMBER OF SOLO PARENT’S SERVED
2019 2018 2017 2016 2015 2014
106 60 40 29 25 14
Source: Social Welfare Development Office
� No. of PWD
A total numbers of 414 persons with disabilities were provided PWD IDs and purchase
medicines and prime commodities for the year 2019.
TOTAL NUMBER OF PERSONS WITH DISABILITY WHO AVAILED OF I.D. AND PURCHASE
BOOKLETS
2019 2018 2017 2016 2015 2014
414 255 149 109 177 77
Source: Social Welfare Development Office
� No. of Poor Families by Barangay
For year 2019, Assistance to individuals in Crisis Situation (AICS) were given to 5,133
qualified registered beneficiaries (Family Heads and other Needy Adults). There were 3,739
totals benefitted with the 4P’S / PANTAWID PAMILYANG PILIPINO PROGRAM.
TYPE OF CLIENTELE 2019
Male Female Total
1. SELF EMPLOYMENT
2. AICS 2326 2807 5133
3. ESA
4. DAY CARE SERVICE 795 795 1590
5. SUPPLEMENTAL FEEDING
6. REFFERAL OF NEGLECTED/ABUSED/ABANDONED CHILDREN
7. CICL 12 0 12
8. WEDC
9. SOLO PARENTS GIVEN I.D. 3 103 106
10. 4P’S / PANTAWID PAMILYANG PILIPINO PROGRAM
537 3202 3739
11. MARRIAGE COUNSELING 473 473 473
12. STAC 0 0 0
13. SENIOR CITIZENS 867 1373 2240
14. SEA-K CAPITAL ASSISTANCE (DSWD)

Socio-Economic/ Ecological Profile|2019
MMaannggaallddaann,, PPaannggaassiinnaann 41
FINANCIAL ASSISTANCE (2015-2019)
2019 2018 2017 2016 2015
No. of clients
served
No. of clients
served
No. of clients
served
No. of clients
served
No. of clients
served
AICS Fund
(Assistance to
Individuals in
Crisis Situation)
5,133
Individuals/family
Heads and other
needy Adult
3861
Individuals/family
Heads and other
needy Adult
4306
Individuals/fami
ly Heads and
other needy
Adult
_________
Individuals/fam
ily Heads and
other needy
Adult
1409
Individuals/fami
ly Heads and
other needy
Adult
SEA Fund
(Self-
Employment
Assistance)
_________
Individuals/family
Heads and other
needy Adult
2
Individuals/family
Heads and other
needy Adult
527
Individuals/fami
ly Heads and
other needy
Adult
_________
Individuals/fam
ily Heads and
other needy
Adult
162
Individuals/fami
ly Heads and
other needy
Adult
ESA Fund
(Emergency
Shelter
Assistance)
_________
Individuals/family
Heads and other
needy Adult
11
Individuals/family
Heads and other
needy Adult
1278
Individuals/fami
ly Heads and
other needy
Adult
_________
Individuals/fam
ily Heads and
other needy
Adult
13
Individuals/fami
ly Heads and
other needy
Adult
� ELDERLY WELFARE PROGRAM ( No. of Senior Citizens)
NUMBER OF ISSUED I.D. CARDS AND PURCHASE BOOKLETS FOR SENIOR CITIZENS
Total Number of I.D.
Cards Issued
Total Number of Purchase
Booklets Issued
2019 2240 2226
2018 2072 1459
2017 1970 3396
2016 - -
2015 2640 2640
2014 1477 1303
PHILHEALTH Status of Registered Members and Dependent
as of December 31, 2019
MUNICIPALITY Sponsored Indigent Employed Self Employed (IPP)
Mem Dep Mem Dep Mem Dep Mem Dep Mem Dep
MANGALDAN 1,742 1,846 10,361 13,024 1,908 2,895 11,334 9,296 10,845 12,103
MUNICIPALITY OFW Lifetime Senior Citizen TOTAL MEMBER
TOTAL DEPENDENT Mem Dep Mem Dep Mem Dep
MANGALDAN 5,884 5,024 1,672 936 8,402 888 52,148 46,012
3.12 Education
� Literacy rate
Illiteracy rate by sex (CBMS 2016)
Municipality Number of persons 10 years old and above
Illiterate persons 10 years old and above*
Magnitude* Proportion**
Total Male Female Total Male Female Total Male Female
MANGALDAN 72948 36755 36193 1408 698 710 1.93 1.9 1.96
*Persons 10 years old and above who cannot read/write simple messages in any language or dialect
**Number of illiterate persons 10 years old and above over total number of persons 10 years old and above
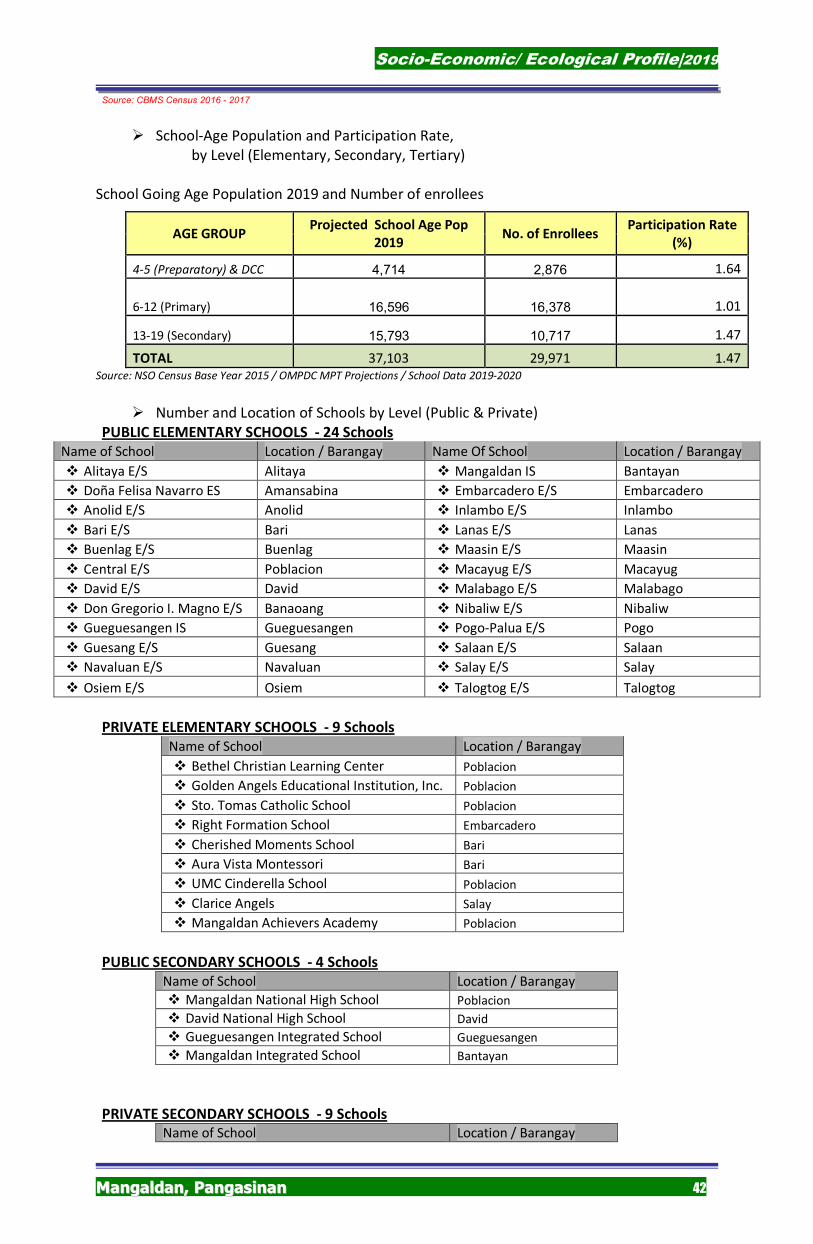
Socio-Economic/ Ecological Profile|2019
MMaannggaallddaann,, PPaannggaassiinnaann 42
Source: CBMS Census 2016 - 2017
� School-Age Population and Participation Rate,
by Level (Elementary, Secondary, Tertiary)
School Going Age Population 2019 and Number of enrollees
AGE GROUP Projected School Age Pop
2019 No. of Enrollees
Participation Rate
(%)
4-5 (Preparatory) & DCC 4,714 2,876 1.64
6-12 (Primary) 16,596 16,378 1.01
13-19 (Secondary) 15,793 10,717 1.47
TOTAL 37,103 29,971 1.47 Source: NSO Census Base Year 2015 / OMPDC MPT Projections / School Data 2019-2020
� Number and Location of Schools by Level (Public & Private)
PUBLIC ELEMENTARY SCHOOLS - 24 Schools
Name of School Location / Barangay Name Of School Location / Barangay
� Alitaya E/S Alitaya � Mangaldan IS Bantayan
� Doña Felisa Navarro ES Amansabina � Embarcadero E/S Embarcadero
� Anolid E/S Anolid � Inlambo E/S Inlambo
� Bari E/S Bari � Lanas E/S Lanas
� Buenlag E/S Buenlag � Maasin E/S Maasin
� Central E/S Poblacion � Macayug E/S Macayug
� David E/S David � Malabago E/S Malabago
� Don Gregorio I. Magno E/S Banaoang � Nibaliw E/S Nibaliw
� Gueguesangen IS Gueguesangen � Pogo-Palua E/S Pogo
� Guesang E/S Guesang � Salaan E/S Salaan
� Navaluan E/S Navaluan � Salay E/S Salay
� Osiem E/S Osiem � Talogtog E/S Talogtog
PRIVATE ELEMENTARY SCHOOLS - 9 Schools
Name of School Location / Barangay
� Bethel Christian Learning Center Poblacion
� Golden Angels Educational Institution, Inc. Poblacion
� Sto. Tomas Catholic School Poblacion
� Right Formation School Embarcadero
� Cherished Moments School Bari
� Aura Vista Montessori Bari
� UMC Cinderella School Poblacion
� Clarice Angels Salay
� Mangaldan Achievers Academy Poblacion
PUBLIC SECONDARY SCHOOLS - 4 Schools
Name of School Location / Barangay
� Mangaldan National High School Poblacion
� David National High School David
� Gueguesangen Integrated School Gueguesangen
� Mangaldan Integrated School Bantayan
PRIVATE SECONDARY SCHOOLS - 9 Schools
Name of School Location / Barangay
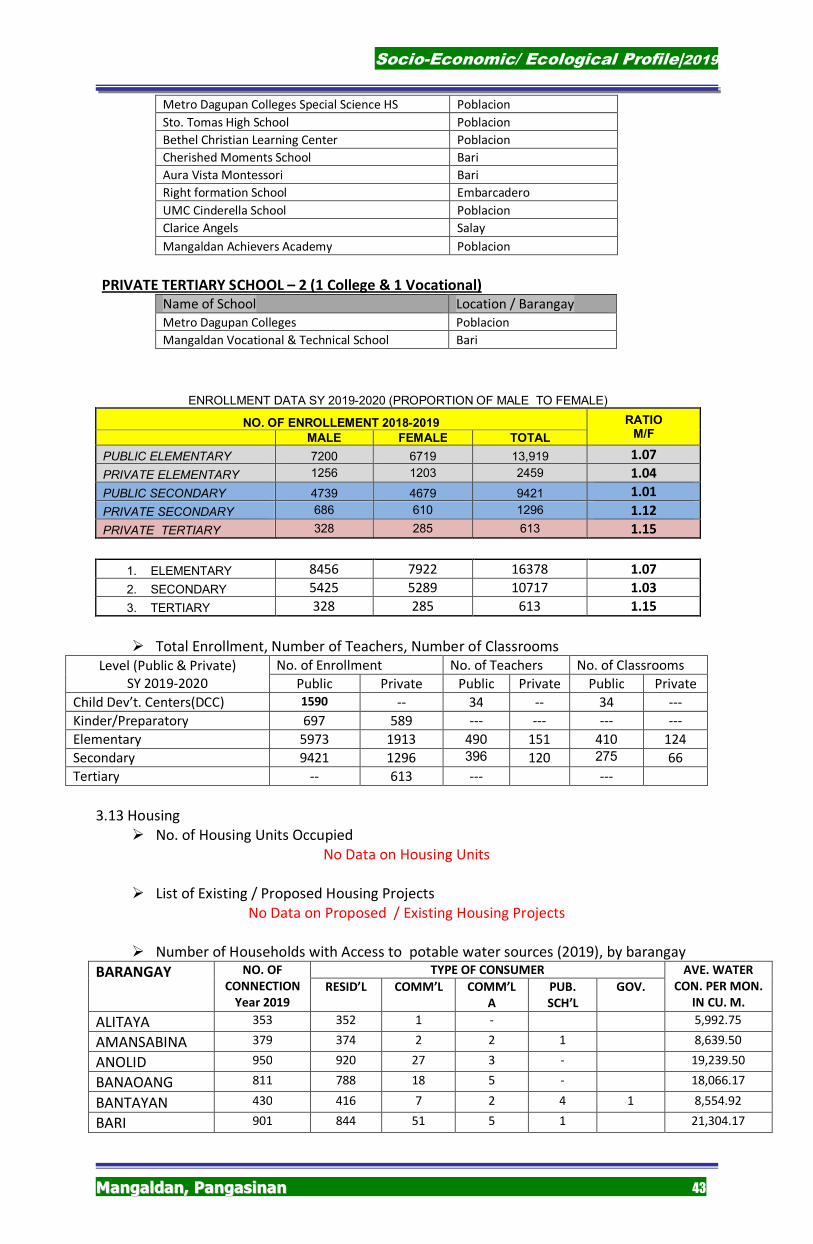
Socio-Economic/ Ecological Profile|2019
MMaannggaallddaann,, PPaannggaassiinnaann 43
Metro Dagupan Colleges Special Science HS Poblacion
Sto. Tomas High School Poblacion
Bethel Christian Learning Center Poblacion
Cherished Moments School Bari
Aura Vista Montessori Bari
Right formation School Embarcadero
UMC Cinderella School Poblacion
Clarice Angels Salay
Mangaldan Achievers Academy Poblacion
PRIVATE TERTIARY SCHOOL – 2 (1 College & 1 Vocational) Name of School Location / Barangay
Metro Dagupan Colleges Poblacion
Mangaldan Vocational & Technical School Bari
ENROLLMENT DATA SY 2019-2020 (PROPORTION OF MALE TO FEMALE)
NO. OF ENROLLEMENT 2018-2019 RATIO M/F MALE FEMALE TOTAL
PUBLIC ELEMENTARY 7200 6719 13,919 1.07
PRIVATE ELEMENTARY 1256 1203 2459 1.04
PUBLIC SECONDARY 4739 4679 9421 1.01
PRIVATE SECONDARY 686 610 1296 1.12
PRIVATE TERTIARY 328 285 613 1.15
1. ELEMENTARY 8456 7922 16378 1.07
2. SECONDARY 5425 5289 10717 1.03
3. TERTIARY 328 285 613 1.15
� Total Enrollment, Number of Teachers, Number of Classrooms Level (Public & Private)
SY 2019-2020
No. of Enrollment No. of Teachers No. of Classrooms
Public Private Public Private Public Private
Child Dev’t. Centers(DCC) 1590 -- 34 -- 34 ---
Kinder/Preparatory 697 589 --- --- --- ---
Elementary 5973 1913 490 151 410 124
Secondary 9421 1296 396 120 275 66
Tertiary -- 613 --- ---
3.13 Housing
� No. of Housing Units Occupied
No Data on Housing Units
� List of Existing / Proposed Housing Projects
No Data on Proposed / Existing Housing Projects
� Number of Households with Access to potable water sources (2019), by barangay
BARANGAY NO. OF
CONNECTION
Year 2019
TYPE OF CONSUMER AVE. WATER
CON. PER MON.
IN CU. M.
RESID’L COMM’L COMM’L
A
PUB.
SCH’L
GOV.
ALITAYA 353 352 1 - 5,992.75
AMANSABINA 379 374 2 2 1 8,639.50
ANOLID 950 920 27 3 - 19,239.50
BANAOANG 811 788 18 5 - 18,066.17
BANTAYAN 430 416 7 2 4 1 8,554.92
BARI 901 844 51 5 1 21,304.17
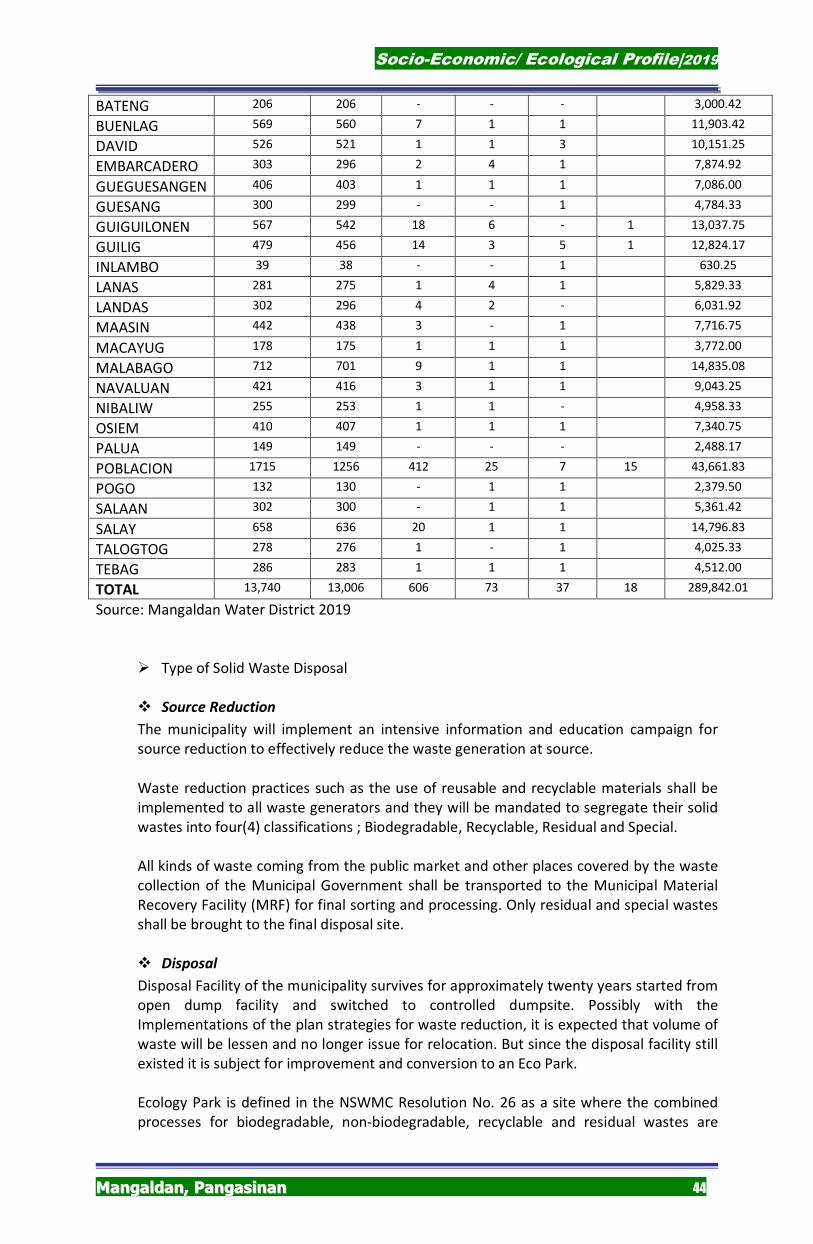
Socio-Economic/ Ecological Profile|2019
MMaannggaallddaann,, PPaannggaassiinnaann 44
BATENG 206 206 - - - 3,000.42
BUENLAG 569 560 7 1 1 11,903.42
DAVID 526 521 1 1 3 10,151.25
EMBARCADERO 303 296 2 4 1 7,874.92
GUEGUESANGEN 406 403 1 1 1 7,086.00
GUESANG 300 299 - - 1 4,784.33
GUIGUILONEN 567 542 18 6 - 1 13,037.75
GUILIG 479 456 14 3 5 1 12,824.17
INLAMBO 39 38 - - 1 630.25
LANAS 281 275 1 4 1 5,829.33
LANDAS 302 296 4 2 - 6,031.92
MAASIN 442 438 3 - 1 7,716.75
MACAYUG 178 175 1 1 1 3,772.00
MALABAGO 712 701 9 1 1 14,835.08
NAVALUAN 421 416 3 1 1 9,043.25
NIBALIW 255 253 1 1 - 4,958.33
OSIEM 410 407 1 1 1 7,340.75
PALUA 149 149 - - - 2,488.17
POBLACION 1715 1256 412 25 7 15 43,661.83
POGO 132 130 - 1 1 2,379.50
SALAAN 302 300 - 1 1 5,361.42
SALAY 658 636 20 1 1 14,796.83
TALOGTOG 278 276 1 - 1 4,025.33
TEBAG 286 283 1 1 1 4,512.00
TOTAL 13,740 13,006 606 73 37 18 289,842.01
Source: Mangaldan Water District 2019
� Type of Solid Waste Disposal
� Source Reduction
The municipality will implement an intensive information and education campaign for
source reduction to effectively reduce the waste generation at source.
Waste reduction practices such as the use of reusable and recyclable materials shall be
implemented to all waste generators and they will be mandated to segregate their solid
wastes into four(4) classifications ; Biodegradable, Recyclable, Residual and Special.
All kinds of waste coming from the public market and other places covered by the waste
collection of the Municipal Government shall be transported to the Municipal Material
Recovery Facility (MRF) for final sorting and processing. Only residual and special wastes
shall be brought to the final disposal site.
� Disposal
Disposal Facility of the municipality survives for approximately twenty years started from
open dump facility and switched to controlled dumpsite. Possibly with the Implementations of the plan strategies for waste reduction, it is expected that volume of
waste will be lessen and no longer issue for relocation. But since the disposal facility still
existed it is subject for improvement and conversion to an Eco Park.
Ecology Park is defined in the NSWMC Resolution No. 26 as a site where the combined
processes for biodegradable, non-biodegradable, recyclable and residual wastes are
Socio-Economic/ Ecological Profile|2019
MMaannggaallddaann,, PPaannggaassiinnaann 45
being conducted which may include composting, vermi composting, MRFs, recycling and
other processes;
As the initial activity of the municipality the adjacent land situated south east of the
controlled dumpsite which was acquired lately have been planted with forest trees in
order to prepare for an Eco Park. The other closest land of the controlled dumpsite
should be procured to land owners with precise compensation requirement for the
expansion. This project will help lessen the unconstructive image of mountainous
residuals and to organize treatment of the collected wastes.
Materials Recovery Facility (MRF) shall be transfer from brgy Guilig to the adjacent land
of the Controlled Dumpsite for an accessible upturn of the dumped waste materials.
Income generating project shall be one of the functions of the MRF. Since Biodegradable
composting is actively done presently at the MRF with the use of mechanical Shredder
Machine by natural composting. As the MRF transferred, animal manure from municipal
slaughterhouse and livestock auction market shall be collected for the improvement and
production of Organic Fertilizers. In order to take full advantage, conduct of field study
may provide great help for faster decomposition process. The Field Research shall be
organize using the effective treatments such as cultured beneficial microorganisms as the
catalysts for faster composting of biodegradable waste materials with different
parameters to determine the comparative effect to composting materials. If this study
turns high significant the production of organic fertilizers will be constantly supplying
farmer’s needs and this shall be one of the income generating project of the municipal
government and a documentary evidence of the quoted words “My Pera Sa Basura”.
Upon operation gardening or farming shall be prioritize for the beautification of the area
and for the promotion of quality organic fertilizers produced from the biodegradable
wastes.
� Disposal Capacity
The controlled dumpsite is currently accommodating 318 m3 of municipal waste per
week. It was scheduled twice a year for waste compaction using the Provincial bulldozer
for rehabilitation and it was also subject for a regular wastes scraping using a payloader
with an interval of two weeks. Conversion of the controlled dumpsite to an Eco park
projected 15 years of operation, and is expected to exceed with the success of the
implementation on waste reduction plan
� Existing Facilities
The municipality of Mangaldan owns a 1.2 hectare lot at Barangay Banaoang that is being
used as Municipal Controlled Dumpsite. It is a 2.5 kilometers from the town proper. The
controlled dumpsite was established in the year 1988. It is enclosed with concrete
perimeter fence and recently, had been planted with mahogany seedlings at the backside. With the compliance to R.A. 9003 the controlled Dumpsite is subject for
assessment by the DENR for Pre-Closure and Rehabilitation.
Other facility compliance to the RA 9003 are the Materials Recovery Facilities(MRF) of
barangay Malabago and Anolid these are considered as industrialized barangay and
situated going to Dagupan City.
� New Proposed Facilities
Since the municipality of Mangaldan is a flood prone area. There are proposals to cluster
with the municipality of San Jacinto. Based on the initial interview with Municipal
Administrator of San Jacinto and an on-site visit, a certain area located in Barangay Away
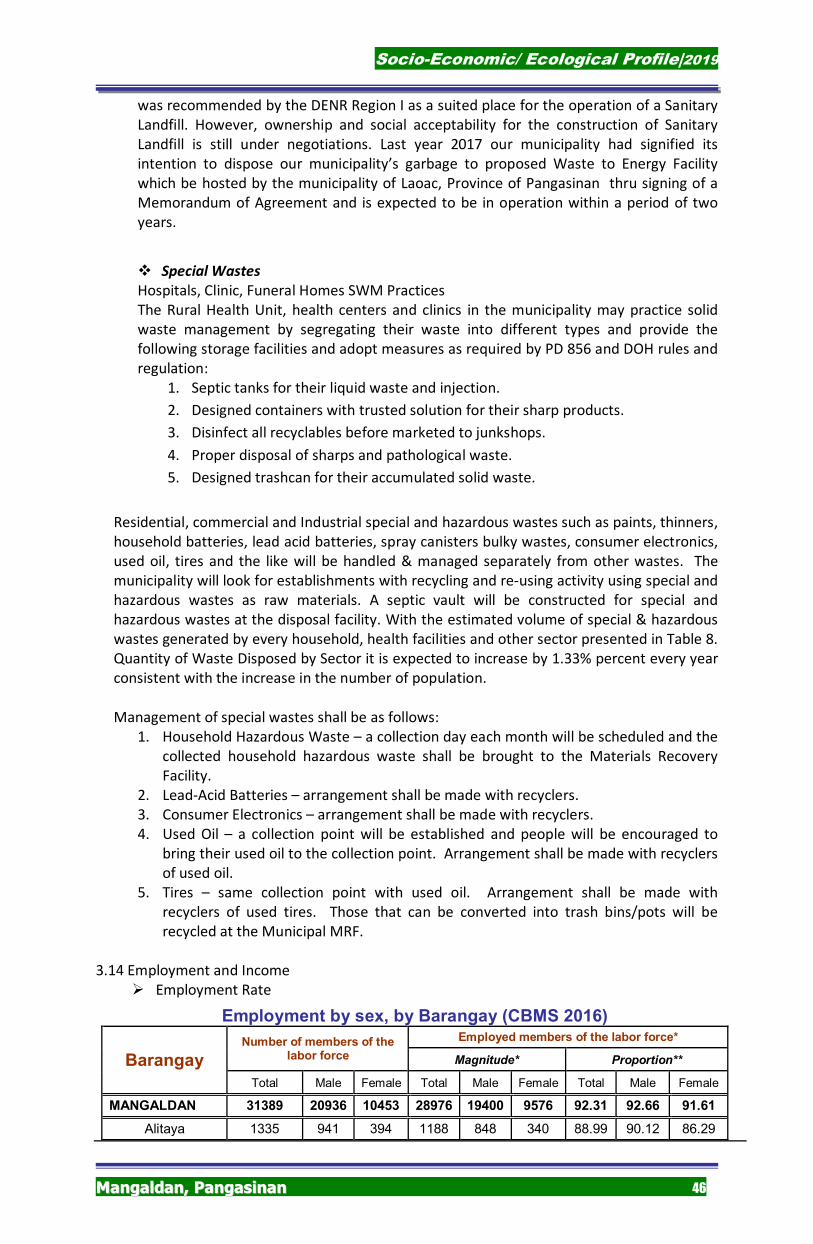
Socio-Economic/ Ecological Profile|2019
MMaannggaallddaann,, PPaannggaassiinnaann 46
was recommended by the DENR Region I as a suited place for the operation of a Sanitary
Landfill. However, ownership and social acceptability for the construction of Sanitary
Landfill is still under negotiations. Last year 2017 our municipality had signified its
intention to dispose our municipality’s garbage to proposed Waste to Energy Facility
which be hosted by the municipality of Laoac, Province of Pangasinan thru signing of a
Memorandum of Agreement and is expected to be in operation within a period of two
years.
� Special Wastes
Hospitals, Clinic, Funeral Homes SWM Practices
The Rural Health Unit, health centers and clinics in the municipality may practice solid
waste management by segregating their waste into different types and provide the
following storage facilities and adopt measures as required by PD 856 and DOH rules and
regulation:
1. Septic tanks for their liquid waste and injection.
2. Designed containers with trusted solution for their sharp products.
3. Disinfect all recyclables before marketed to junkshops.
4. Proper disposal of sharps and pathological waste.
5. Designed trashcan for their accumulated solid waste.
Residential, commercial and Industrial special and hazardous wastes such as paints, thinners,
household batteries, lead acid batteries, spray canisters bulky wastes, consumer electronics,
used oil, tires and the like will be handled & managed separately from other wastes. The
municipality will look for establishments with recycling and re-using activity using special and
hazardous wastes as raw materials. A septic vault will be constructed for special and
hazardous wastes at the disposal facility. With the estimated volume of special & hazardous
wastes generated by every household, health facilities and other sector presented in Table 8.
Quantity of Waste Disposed by Sector it is expected to increase by 1.33% percent every year
consistent with the increase in the number of population.
Management of special wastes shall be as follows:
1. Household Hazardous Waste – a collection day each month will be scheduled and the
collected household hazardous waste shall be brought to the Materials Recovery
Facility.
2. Lead-Acid Batteries – arrangement shall be made with recyclers.
3. Consumer Electronics – arrangement shall be made with recyclers.
4. Used Oil – a collection point will be established and people will be encouraged to
bring their used oil to the collection point. Arrangement shall be made with recyclers
of used oil.
5. Tires – same collection point with used oil. Arrangement shall be made with
recyclers of used tires. Those that can be converted into trash bins/pots will be
recycled at the Municipal MRF.
3.14 Employment and Income � Employment Rate
Employment by sex, by Barangay (CBMS 2016)
Barangay Number of members of the
labor force
Employed members of the labor force*
Magnitude* Proportion**
Total Male Female Total Male Female Total Male Female
MANGALDAN 31389 20936 10453 28976 19400 9576 92.31 92.66 91.61
Alitaya 1335 941 394 1188 848 340 88.99 90.12 86.29
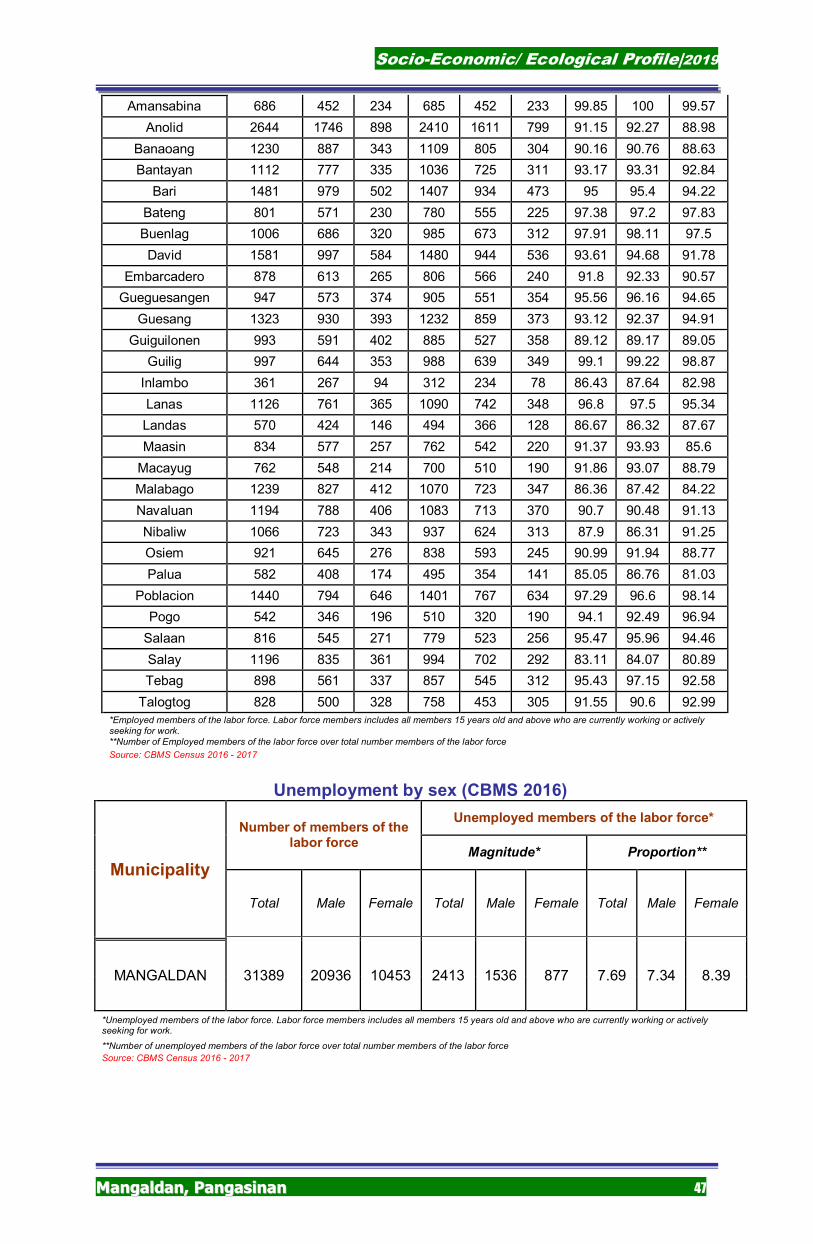
Socio-Economic/ Ecological Profile|2019
MMaannggaallddaann,, PPaannggaassiinnaann 47
Amansabina 686 452 234 685 452 233 99.85 100 99.57
Anolid 2644 1746 898 2410 1611 799 91.15 92.27 88.98
Banaoang 1230 887 343 1109 805 304 90.16 90.76 88.63
Bantayan 1112 777 335 1036 725 311 93.17 93.31 92.84
Bari 1481 979 502 1407 934 473 95 95.4 94.22
Bateng 801 571 230 780 555 225 97.38 97.2 97.83
Buenlag 1006 686 320 985 673 312 97.91 98.11 97.5
David 1581 997 584 1480 944 536 93.61 94.68 91.78
Embarcadero 878 613 265 806 566 240 91.8 92.33 90.57
Gueguesangen 947 573 374 905 551 354 95.56 96.16 94.65
Guesang 1323 930 393 1232 859 373 93.12 92.37 94.91
Guiguilonen 993 591 402 885 527 358 89.12 89.17 89.05
Guilig 997 644 353 988 639 349 99.1 99.22 98.87
Inlambo 361 267 94 312 234 78 86.43 87.64 82.98
Lanas 1126 761 365 1090 742 348 96.8 97.5 95.34
Landas 570 424 146 494 366 128 86.67 86.32 87.67
Maasin 834 577 257 762 542 220 91.37 93.93 85.6
Macayug 762 548 214 700 510 190 91.86 93.07 88.79
Malabago 1239 827 412 1070 723 347 86.36 87.42 84.22
Navaluan 1194 788 406 1083 713 370 90.7 90.48 91.13
Nibaliw 1066 723 343 937 624 313 87.9 86.31 91.25
Osiem 921 645 276 838 593 245 90.99 91.94 88.77
Palua 582 408 174 495 354 141 85.05 86.76 81.03
Poblacion 1440 794 646 1401 767 634 97.29 96.6 98.14
Pogo 542 346 196 510 320 190 94.1 92.49 96.94
Salaan 816 545 271 779 523 256 95.47 95.96 94.46
Salay 1196 835 361 994 702 292 83.11 84.07 80.89
Tebag 898 561 337 857 545 312 95.43 97.15 92.58
Talogtog 828 500 328 758 453 305 91.55 90.6 92.99
*Employed members of the labor force. Labor force members includes all members 15 years old and above who are currently working or actively seeking for work. **Number of Employed members of the labor force over total number members of the labor force
Source: CBMS Census 2016 - 2017
Unemployment by sex (CBMS 2016)
Municipality
Number of members of the labor force
Unemployed members of the labor force*
Magnitude* Proportion**
Total Male Female Total Male Female Total Male Female
MANGALDAN 31389 20936 10453 2413 1536 877 7.69 7.34 8.39
*Unemployed members of the labor force. Labor force members includes all members 15 years old and above who are currently working or actively seeking for work.
**Number of unemployed members of the labor force over total number members of the labor force
Source: CBMS Census 2016 - 2017
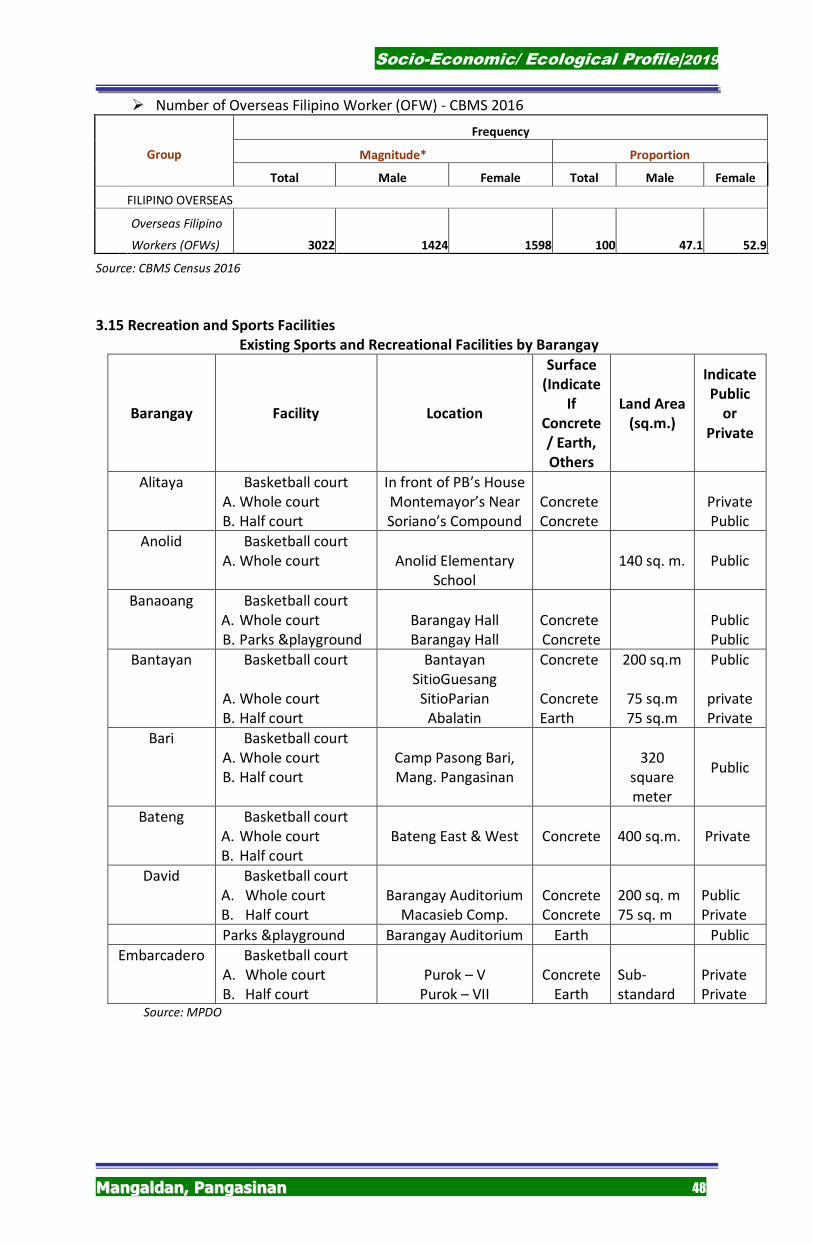
Socio-Economic/ Ecological Profile|2019
MMaannggaallddaann,, PPaannggaassiinnaann 48
� Number of Overseas Filipino Worker (OFW) - CBMS 2016
Group
Frequency
Magnitude* Proportion
Total Male Female Total Male Female
FILIPINO OVERSEAS
Overseas Filipino
Workers (OFWs) 3022 1424 1598 100 47.1 52.9
Source: CBMS Census 2016
3.15 Recreation and Sports Facilities
Existing Sports and Recreational Facilities by Barangay
Barangay Facility Location
Surface
(Indicate
If
Concrete
/ Earth,
Others
Land Area
(sq.m.)
Indicate
Public
or
Private
Alitaya Basketball court
A. Whole court
B. Half court
In front of PB’s House
Montemayor’s Near
Soriano’s Compound
Concrete
Concrete
Private
Public
Anolid Basketball court
A. Whole court
Anolid Elementary
School
140 sq. m.
Public
Banaoang Basketball court
A. Whole court
B. Parks &playground
Barangay Hall
Barangay Hall
Concrete
Concrete
Public
Public
Bantayan Basketball court
A. Whole court
B. Half court
Bantayan
SitioGuesang
SitioParian
Abalatin
Concrete
Concrete
Earth
200 sq.m
75 sq.m
75 sq.m
Public
private
Private
Bari Basketball court
A. Whole court
B. Half court
Camp Pasong Bari,
Mang. Pangasinan
320
square
meter
Public
Bateng Basketball court
A. Whole court
B. Half court
Bateng East & West
Concrete
400 sq.m.
Private
David Basketball court
A. Whole court
B. Half court
Barangay Auditorium
Macasieb Comp.
Concrete
Concrete
200 sq. m
75 sq. m
Public
Private
Parks &playground Barangay Auditorium Earth Public
Embarcadero Basketball court
A. Whole court
B. Half court
Purok – V
Purok – VII
Concrete
Earth
Sub-
standard
Private
Private Source: MPDO
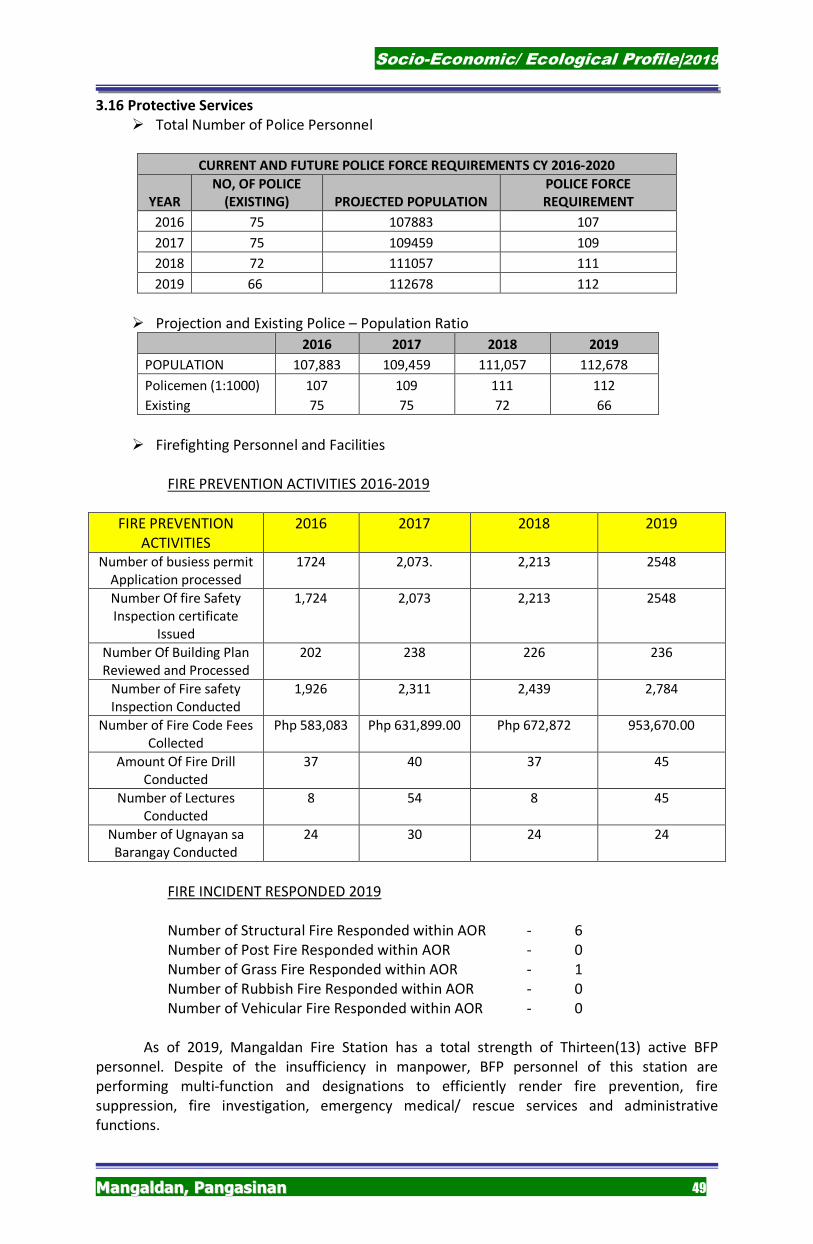
Socio-Economic/ Ecological Profile|2019
MMaannggaallddaann,, PPaannggaassiinnaann 49
3.16 Protective Services
� Total Number of Police Personnel
CURRENT AND FUTURE POLICE FORCE REQUIREMENTS CY 2016-2020
YEAR
NO, OF POLICE
(EXISTING) PROJECTED POPULATION
POLICE FORCE
REQUIREMENT
2016 75 107883 107
2017 75 109459 109
2018 72 111057 111
2019 66 112678 112
� Projection and Existing Police – Population Ratio
2016 2017 2018 2019
POPULATION 107,883 109,459 111,057 112,678
Policemen (1:1000) 107 109 111 112
Existing 75 75 72 66
� Firefighting Personnel and Facilities
FIRE PREVENTION ACTIVITIES 2016-2019
FIRE INCIDENT RESPONDED 2019
Number of Structural Fire Responded within AOR - 6
Number of Post Fire Responded within AOR - 0 Number of Grass Fire Responded within AOR - 1
Number of Rubbish Fire Responded within AOR - 0
Number of Vehicular Fire Responded within AOR - 0
As of 2019, Mangaldan Fire Station has a total strength of Thirteen(13) active BFP
personnel. Despite of the insufficiency in manpower, BFP personnel of this station are
performing multi-function and designations to efficiently render fire prevention, fire
suppression, fire investigation, emergency medical/ rescue services and administrative
functions.
FIRE PREVENTION
ACTIVITIES
2016 2017 2018 2019
Number of busiess permit Application processed
1724 2,073. 2,213 2548
Number Of fire Safety Inspection certificate
Issued
1,724 2,073 2,213 2548
Number Of Building Plan Reviewed and Processed
202 238 226 236
Number of Fire safety Inspection Conducted
1,926 2,311 2,439 2,784
Number of Fire Code Fees Collected
Php 583,083 Php 631,899.00 Php 672,872 953,670.00
Amount Of Fire Drill Conducted
37 40 37 45
Number of Lectures Conducted
8 54 8 45
Number of Ugnayan sa Barangay Conducted
24 30 24 24
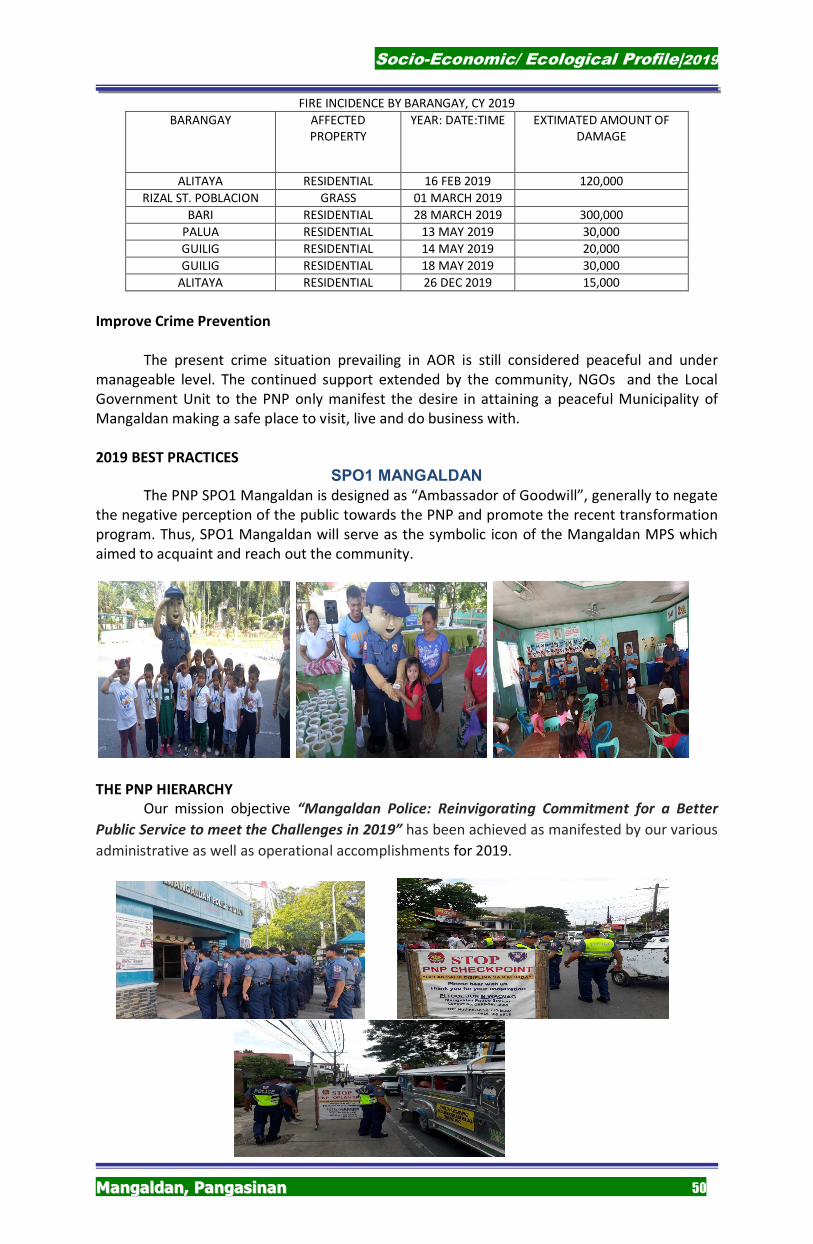
Socio-Economic/ Ecological Profile|2019
MMaannggaallddaann,, PPaannggaassiinnaann 50
FIRE INCIDENCE BY BARANGAY, CY 2019
BARANGAY AFFECTED PROPERTY
YEAR: DATE:TIME EXTIMATED AMOUNT OF DAMAGE
ALITAYA RESIDENTIAL 16 FEB 2019 120,000
RIZAL ST. POBLACION GRASS 01 MARCH 2019
BARI RESIDENTIAL 28 MARCH 2019 300,000
PALUA RESIDENTIAL 13 MAY 2019 30,000
GUILIG RESIDENTIAL 14 MAY 2019 20,000
GUILIG RESIDENTIAL 18 MAY 2019 30,000
ALITAYA RESIDENTIAL 26 DEC 2019 15,000
Improve Crime Prevention
The present crime situation prevailing in AOR is still considered peaceful and under
manageable level. The continued support extended by the community, NGOs and the Local
Government Unit to the PNP only manifest the desire in attaining a peaceful Municipality of
Mangaldan making a safe place to visit, live and do business with.
2019 BEST PRACTICES
SPO1 MANGALDAN
The PNP SPO1 Mangaldan is designed as “Ambassador of Goodwill”, generally to negate
the negative perception of the public towards the PNP and promote the recent transformation
program. Thus, SPO1 Mangaldan will serve as the symbolic icon of the Mangaldan MPS which
aimed to acquaint and reach out the community.
THE PNP HIERARCHY
Our mission objective “Mangaldan Police: Reinvigorating Commitment for a Better
Public Service to meet the Challenges in 2019” has been achieved as manifested by our various
administrative as well as operational accomplishments for 2019.
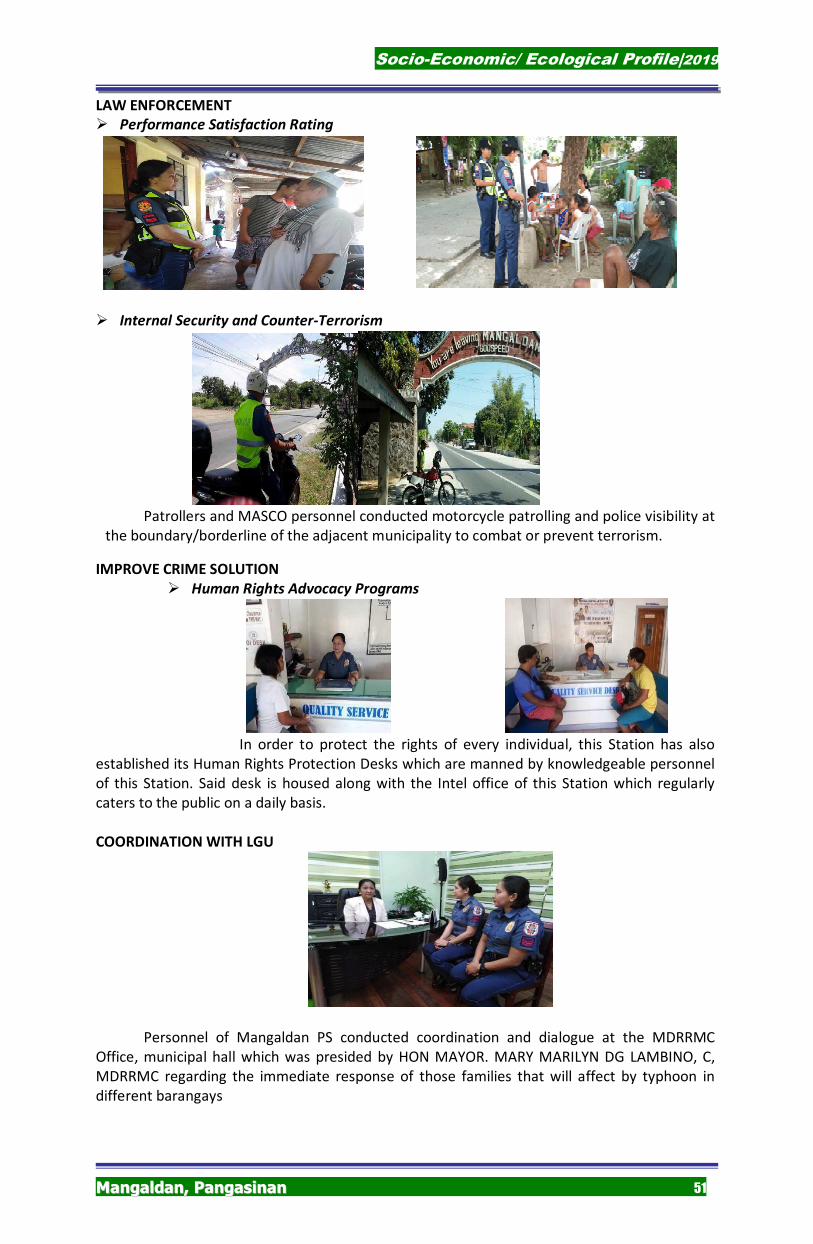
Socio-Economic/ Ecological Profile|2019
MMaannggaallddaann,, PPaannggaassiinnaann 51
LAW ENFORCEMENT
� Performance Satisfaction Rating
� Internal Security and Counter-Terrorism
Patrollers and MASCO personnel conducted motorcycle patrolling and police visibility at
the boundary/borderline of the adjacent municipality to combat or prevent terrorism.
IMPROVE CRIME SOLUTION
� Human Rights Advocacy Programs
In order to protect the rights of every individual, this Station has also
established its Human Rights Protection Desks which are manned by knowledgeable personnel
of this Station. Said desk is housed along with the Intel office of this Station which regularly
caters to the public on a daily basis.
COORDINATION WITH LGU
Personnel of Mangaldan PS conducted coordination and dialogue at the MDRRMC
Office, municipal hall which was presided by HON MAYOR. MARY MARILYN DG LAMBINO, C,
MDRRMC regarding the immediate response of those families that will affect by typhoon in
different barangays
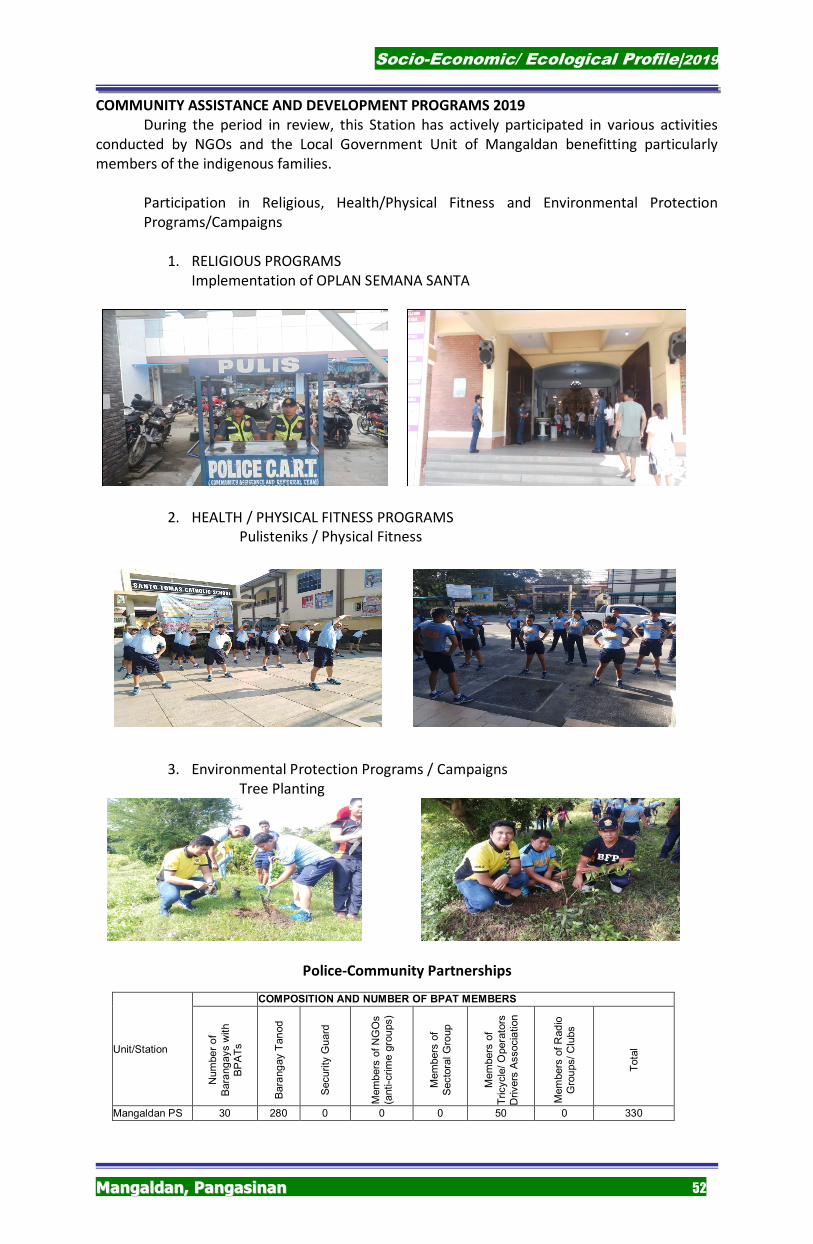
Socio-Economic/ Ecological Profile|2019
MMaannggaallddaann,, PPaannggaassiinnaann 52
COMMUNITY ASSISTANCE AND DEVELOPMENT PROGRAMS 2019
During the period in review, this Station has actively participated in various activities
conducted by NGOs and the Local Government Unit of Mangaldan benefitting particularly
members of the indigenous families.
Participation in Religious, Health/Physical Fitness and Environmental Protection
Programs/Campaigns
1. RELIGIOUS PROGRAMS
Implementation of OPLAN SEMANA SANTA
2. HEALTH / PHYSICAL FITNESS PROGRAMS Pulisteniks / Physical Fitness
3. Environmental Protection Programs / Campaigns
Tree Planting
Police-Community Partnerships
Unit/Station
COMPOSITION AND NUMBER OF BPAT MEMBERS
Num
be
r o
f
Bara
ng
ays w
ith
BP
AT
s
Bara
ng
ay T
an
od
Securi
ty G
uard
Mem
bers
of N
GO
s
(anti-c
rim
e g
rou
ps)
Mem
bers
of
Secto
ral G
roup
Mem
bers
of
Tricycle
/ O
pera
tors
Drivers
Associa
tion
Mem
bers
of R
ad
io
Gro
ups/ C
lubs
Tota
l
Mangaldan PS 30 280 0 0 0 50 0 330
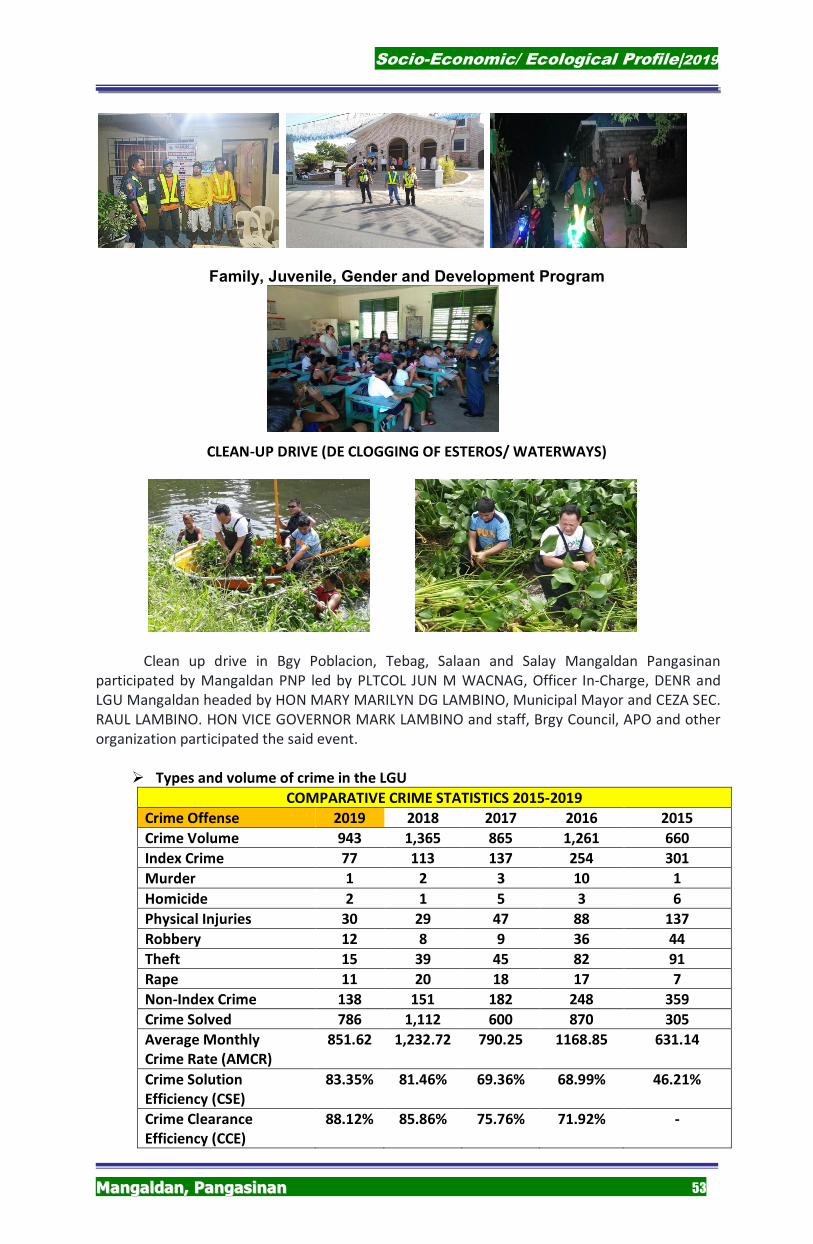
Socio-Economic/ Ecological Profile|2019
MMaannggaallddaann,, PPaannggaassiinnaann 53
Family, Juvenile, Gender and Development Program
CLEAN-UP DRIVE (DE CLOGGING OF ESTEROS/ WATERWAYS)
Clean up drive in Bgy Poblacion, Tebag, Salaan and Salay Mangaldan Pangasinan
participated by Mangaldan PNP led by PLTCOL JUN M WACNAG, Officer In-Charge, DENR and
LGU Mangaldan headed by HON MARY MARILYN DG LAMBINO, Municipal Mayor and CEZA SEC.
RAUL LAMBINO. HON VICE GOVERNOR MARK LAMBINO and staff, Brgy Council, APO and other
organization participated the said event.
� Types and volume of crime in the LGU
COMPARATIVE CRIME STATISTICS 2015-2019
Crime Offense 2019 2018 2017 2016 2015
Crime Volume 943 1,365 865 1,261 660
Index Crime 77 113 137 254 301
Murder 1 2 3 10 1
Homicide 2 1 5 3 6
Physical Injuries 30 29 47 88 137
Robbery 12 8 9 36 44
Theft 15 39 45 82 91
Rape 11 20 18 17 7
Non-Index Crime 138 151 182 248 359
Crime Solved 786 1,112 600 870 305
Average Monthly
Crime Rate (AMCR)
851.62 1,232.72 790.25 1168.85 631.14
Crime Solution
Efficiency (CSE)
83.35% 81.46% 69.36% 68.99% 46.21%
Crime Clearance
Efficiency (CCE)
88.12% 85.86% 75.76% 71.92% -
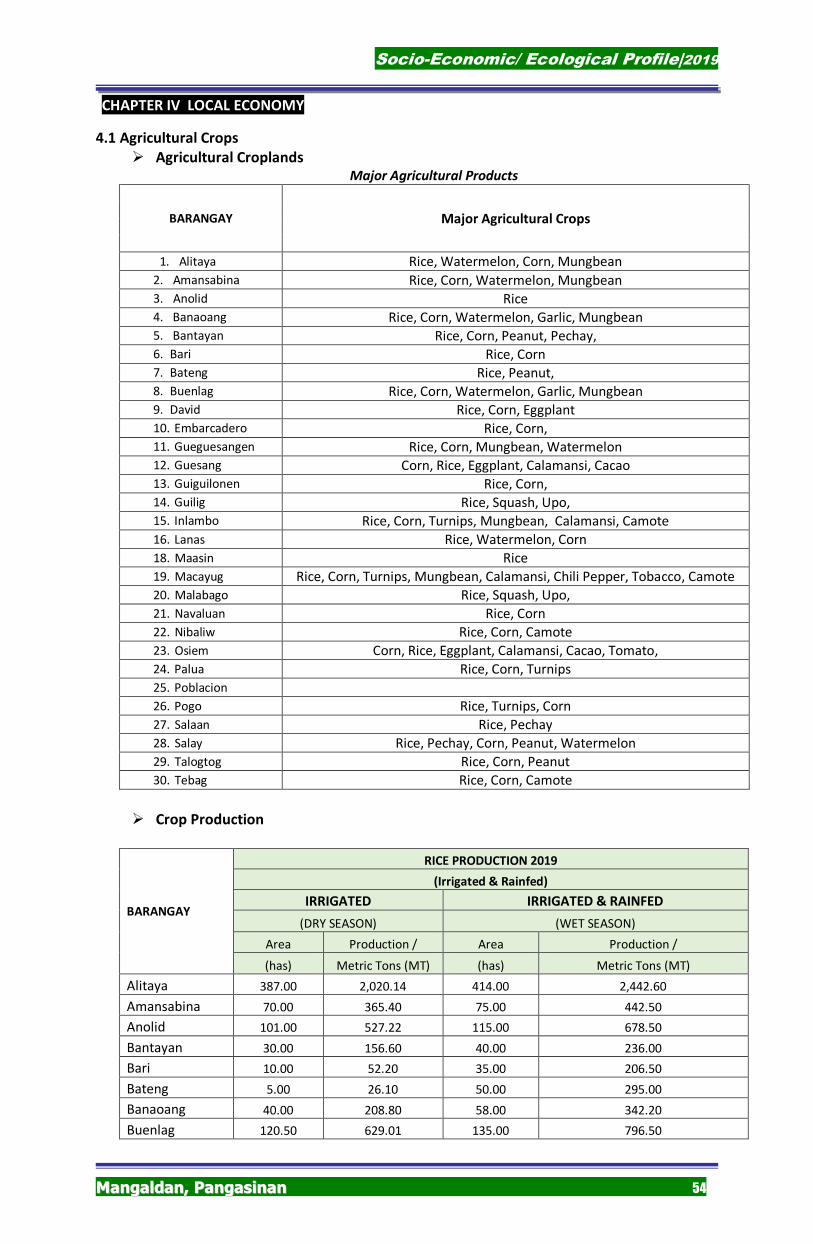
Socio-Economic/ Ecological Profile|2019
MMaannggaallddaann,, PPaannggaassiinnaann 54
CHAPTER IV LOCAL ECONOMY
4.1 Agricultural Crops
� Agricultural Croplands Major Agricultural Products
BARANGAY Major Agricultural Crops
1. Alitaya Rice, Watermelon, Corn, Mungbean
2. Amansabina Rice, Corn, Watermelon, Mungbean 3. Anolid Rice 4. Banaoang Rice, Corn, Watermelon, Garlic, Mungbean 5. Bantayan Rice, Corn, Peanut, Pechay, 6. Bari Rice, Corn 7. Bateng Rice, Peanut, 8. Buenlag Rice, Corn, Watermelon, Garlic, Mungbean 9. David Rice, Corn, Eggplant 10. Embarcadero Rice, Corn, 11. Gueguesangen Rice, Corn, Mungbean, Watermelon 12. Guesang Corn, Rice, Eggplant, Calamansi, Cacao 13. Guiguilonen Rice, Corn, 14. Guilig Rice, Squash, Upo, 15. Inlambo Rice, Corn, Turnips, Mungbean, Calamansi, Camote
16. Lanas Rice, Watermelon, Corn
18. Maasin Rice
19. Macayug Rice, Corn, Turnips, Mungbean, Calamansi, Chili Pepper, Tobacco, Camote
20. Malabago Rice, Squash, Upo,
21. Navaluan Rice, Corn
22. Nibaliw Rice, Corn, Camote
23. Osiem Corn, Rice, Eggplant, Calamansi, Cacao, Tomato,
24. Palua Rice, Corn, Turnips
25. Poblacion
26. Pogo Rice, Turnips, Corn
27. Salaan Rice, Pechay
28. Salay Rice, Pechay, Corn, Peanut, Watermelon
29. Talogtog Rice, Corn, Peanut
30. Tebag Rice, Corn, Camote
� Crop Production
BARANGAY
RICE PRODUCTION 2019
(Irrigated & Rainfed)
IRRIGATED IRRIGATED & RAINFED
(DRY SEASON) (WET SEASON)
Area Production / Area Production /
(has) Metric Tons (MT) (has) Metric Tons (MT)
Alitaya 387.00 2,020.14 414.00 2,442.60
Amansabina 70.00 365.40 75.00 442.50
Anolid 101.00 527.22 115.00 678.50
Bantayan 30.00 156.60 40.00 236.00
Bari 10.00 52.20 35.00 206.50
Bateng 5.00 26.10 50.00 295.00
Banaoang 40.00 208.80 58.00 342.20
Buenlag 120.50 629.01 135.00 796.50
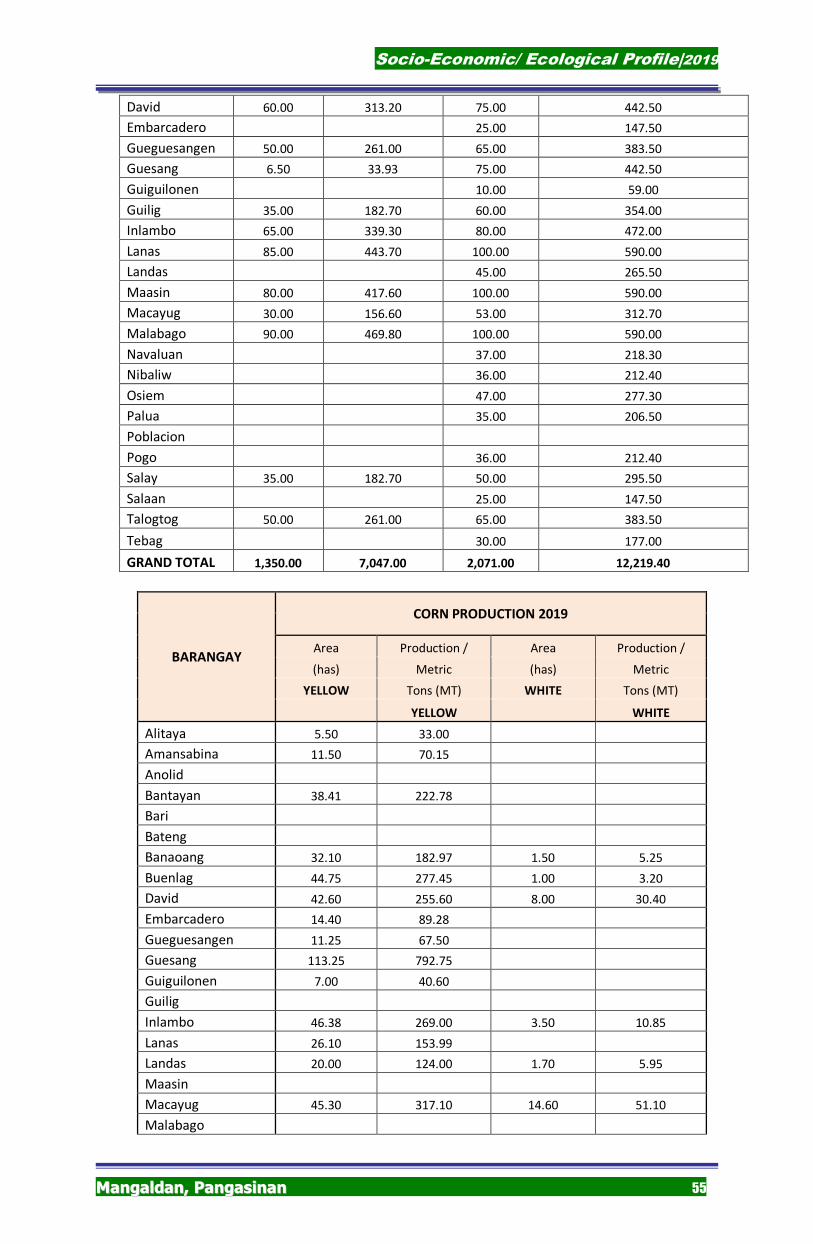
Socio-Economic/ Ecological Profile|2019
MMaannggaallddaann,, PPaannggaassiinnaann 55
David 60.00 313.20 75.00 442.50
Embarcadero 25.00 147.50
Gueguesangen 50.00 261.00 65.00 383.50
Guesang 6.50 33.93 75.00 442.50
Guiguilonen 10.00 59.00
Guilig 35.00 182.70 60.00 354.00
Inlambo 65.00 339.30 80.00 472.00
Lanas 85.00 443.70 100.00 590.00
Landas 45.00 265.50
Maasin 80.00 417.60 100.00 590.00
Macayug 30.00 156.60 53.00 312.70
Malabago 90.00 469.80 100.00 590.00
Navaluan 37.00 218.30
Nibaliw 36.00 212.40
Osiem 47.00 277.30
Palua 35.00 206.50
Poblacion
Pogo 36.00 212.40
Salay 35.00 182.70 50.00 295.50
Salaan 25.00 147.50
Talogtog 50.00 261.00 65.00 383.50
Tebag 30.00 177.00
GRAND TOTAL 1,350.00 7,047.00 2,071.00 12,219.40
BARANGAY
CORN PRODUCTION 2019
Area Production / Area Production /
(has) Metric (has) Metric
YELLOW Tons (MT) WHITE Tons (MT)
YELLOW WHITE
Alitaya 5.50 33.00
Amansabina 11.50 70.15
Anolid
Bantayan 38.41 222.78
Bari
Bateng
Banaoang 32.10 182.97 1.50 5.25
Buenlag 44.75 277.45 1.00 3.20
David 42.60 255.60 8.00 30.40
Embarcadero 14.40 89.28
Gueguesangen 11.25 67.50
Guesang 113.25 792.75
Guiguilonen 7.00 40.60
Guilig
Inlambo 46.38 269.00 3.50 10.85
Lanas 26.10 153.99
Landas 20.00 124.00 1.70 5.95
Maasin
Macayug 45.30 317.10 14.60 51.10
Malabago
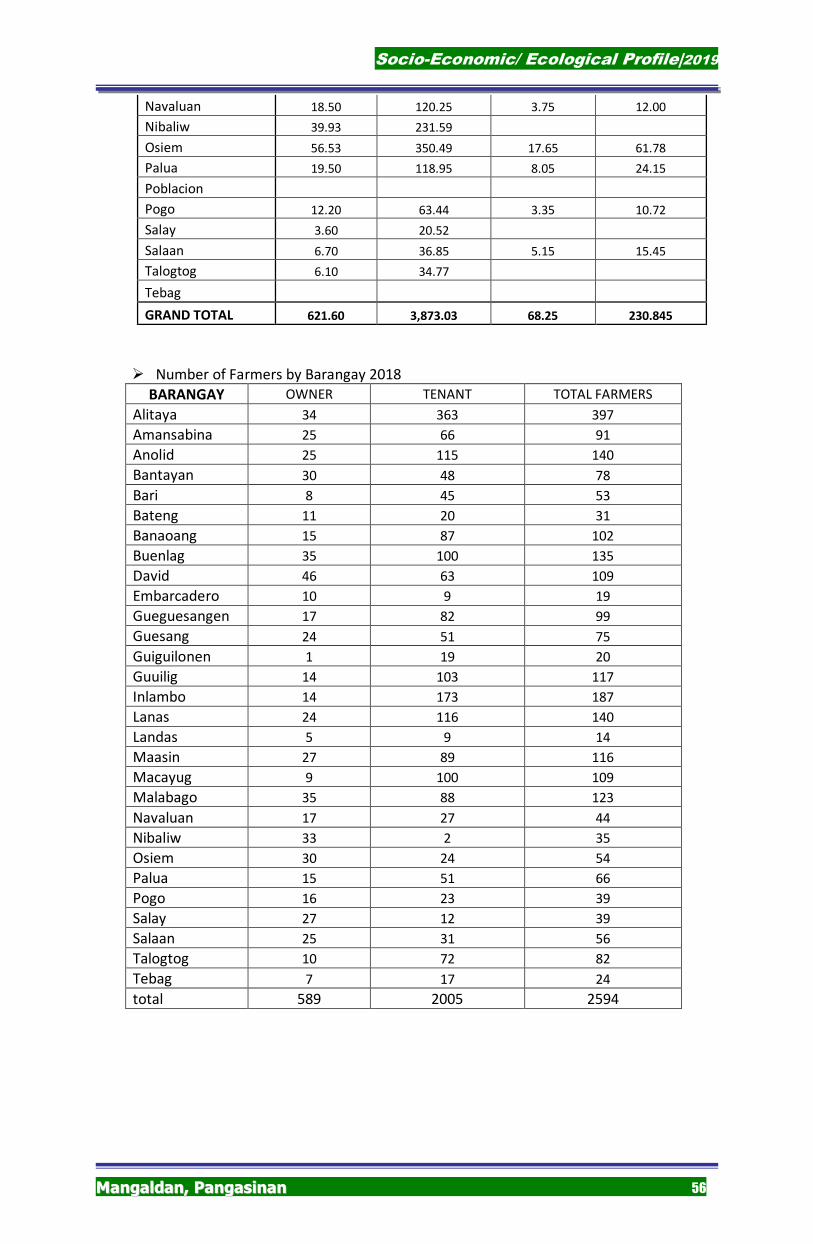
Socio-Economic/ Ecological Profile|2019
MMaannggaallddaann,, PPaannggaassiinnaann 56
Navaluan 18.50 120.25 3.75 12.00
Nibaliw 39.93 231.59
Osiem 56.53 350.49 17.65 61.78
Palua 19.50 118.95 8.05 24.15
Poblacion
Pogo 12.20 63.44 3.35 10.72
Salay 3.60 20.52
Salaan 6.70 36.85 5.15 15.45
Talogtog 6.10 34.77
Tebag
GRAND TOTAL 621.60 3,873.03 68.25 230.845
� Number of Farmers by Barangay 2018
BARANGAY OWNER TENANT TOTAL FARMERS
Alitaya 34 363 397
Amansabina 25 66 91
Anolid 25 115 140
Bantayan 30 48 78
Bari 8 45 53
Bateng 11 20 31
Banaoang 15 87 102
Buenlag 35 100 135
David 46 63 109
Embarcadero 10 9 19
Gueguesangen 17 82 99
Guesang 24 51 75
Guiguilonen 1 19 20
Guuilig 14 103 117
Inlambo 14 173 187
Lanas 24 116 140
Landas 5 9 14
Maasin 27 89 116
Macayug 9 100 109
Malabago 35 88 123
Navaluan 17 27 44
Nibaliw 33 2 35
Osiem 30 24 54
Palua 15 51 66
Pogo 16 23 39
Salay 27 12 39
Salaan 25 31 56
Talogtog 10 72 82
Tebag 7 17 24
total 589 2005 2594
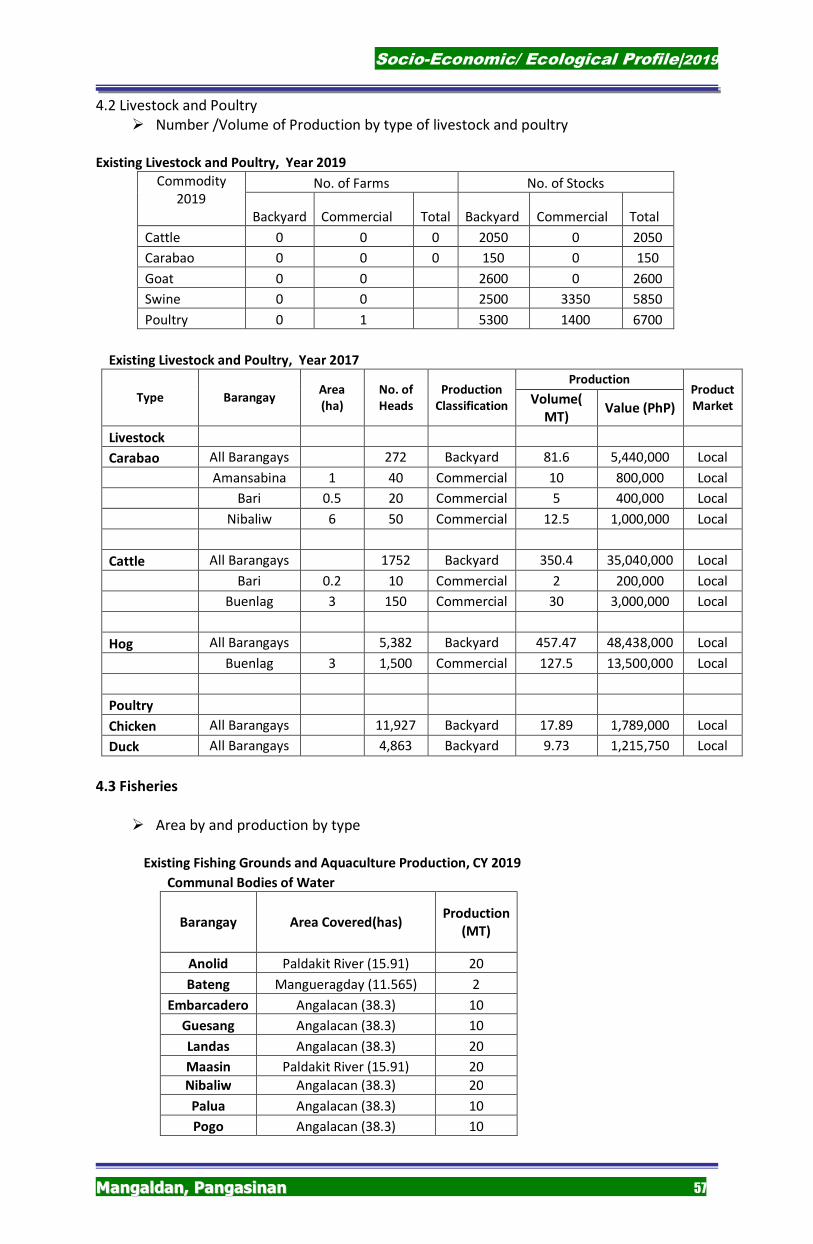
Socio-Economic/ Ecological Profile|2019
MMaannggaallddaann,, PPaannggaassiinnaann 57
4.2 Livestock and Poultry
� Number /Volume of Production by type of livestock and poultry
Existing Livestock and Poultry, Year 2019
Commodity 2019
No. of Farms No. of Stocks
Backyard Commercial Total Backyard Commercial Total
Cattle 0 0 0 2050 0 2050
Carabao 0 0 0 150 0 150
Goat 0 0
2600 0 2600
Swine 0 0
2500 3350 5850
Poultry 0 1
5300 1400 6700
Existing Livestock and Poultry, Year 2017
Type Barangay Area
(ha)
No. of
Heads
Production
Classification
Production Product
Market Volume(
MT) Value (PhP)
Livestock
Carabao All Barangays 272 Backyard 81.6 5,440,000 Local
Amansabina 1 40 Commercial 10 800,000 Local
Bari 0.5 20 Commercial 5 400,000 Local
Nibaliw 6 50 Commercial 12.5 1,000,000 Local
Cattle All Barangays 1752 Backyard 350.4 35,040,000 Local
Bari 0.2 10 Commercial 2 200,000 Local
Buenlag 3 150 Commercial 30 3,000,000 Local
Hog All Barangays 5,382 Backyard 457.47 48,438,000 Local
Buenlag 3 1,500 Commercial 127.5 13,500,000 Local
Poultry
Chicken All Barangays 11,927 Backyard 17.89 1,789,000 Local
Duck All Barangays 4,863 Backyard 9.73 1,215,750 Local
4.3 Fisheries
� Area by and production by type
Existing Fishing Grounds and Aquaculture Production, CY 2019
Communal Bodies of Water
Barangay Area Covered(has) Production
(MT)
Anolid Paldakit River (15.91) 20
Bateng Mangueragday (11.565) 2
Embarcadero Angalacan (38.3) 10
Guesang Angalacan (38.3) 10
Landas Angalacan (38.3) 20
Maasin Paldakit River (15.91) 20
Nibaliw Angalacan (38.3) 20
Palua Angalacan (38.3) 10
Pogo Angalacan (38.3) 10
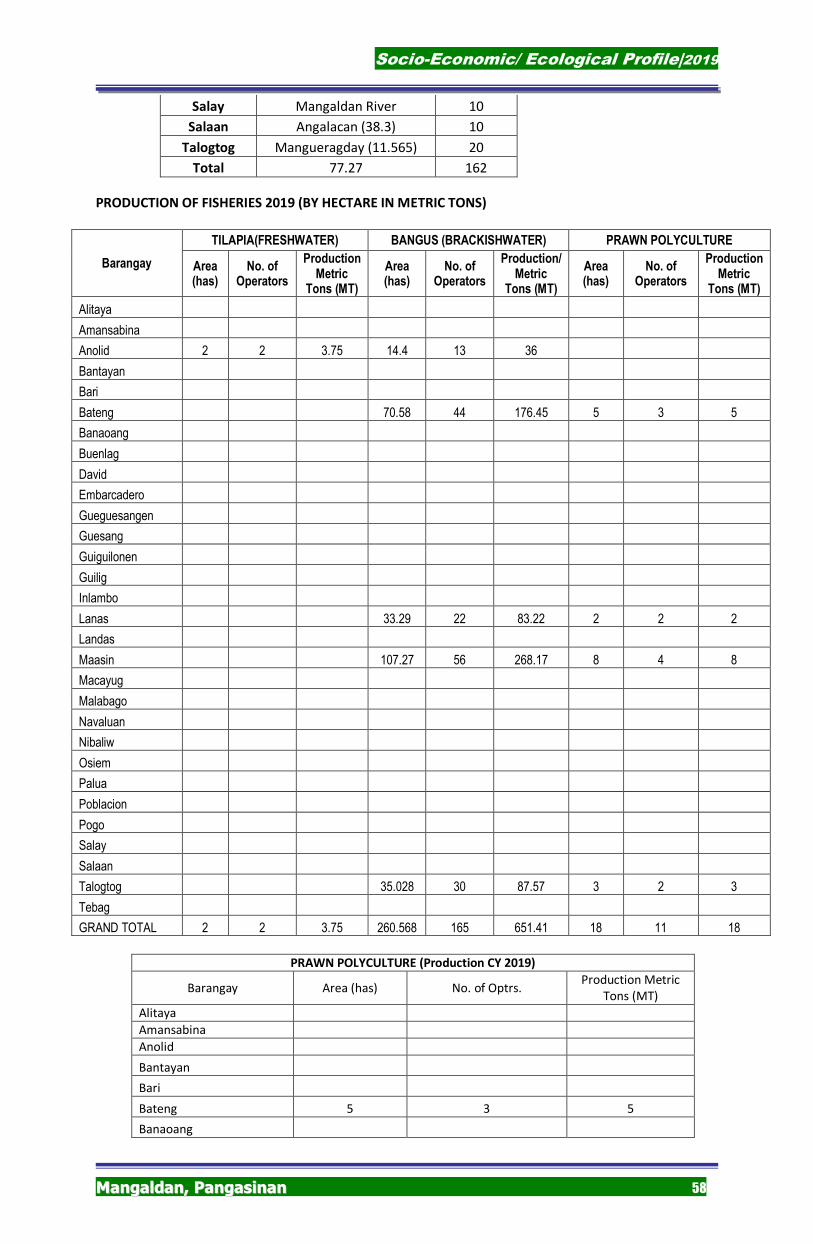
Socio-Economic/ Ecological Profile|2019
MMaannggaallddaann,, PPaannggaassiinnaann 58
Salay Mangaldan River 10
Salaan Angalacan (38.3) 10
Talogtog Mangueragday (11.565) 20
Total 77.27 162
PRODUCTION OF FISHERIES 2019 (BY HECTARE IN METRIC TONS)
Barangay
TILAPIA(FRESHWATER) BANGUS (BRACKISHWATER) PRAWN POLYCULTURE
Area (has)
No. of Operators
Production Metric
Tons (MT)
Area (has)
No. of Operators
Production/ Metric
Tons (MT)
Area (has)
No. of Operators
Production Metric
Tons (MT)
Alitaya
Amansabina
Anolid 2 2 3.75 14.4 13 36
Bantayan
Bari
Bateng 70.58 44 176.45 5 3 5
Banaoang
Buenlag
David
Embarcadero
Gueguesangen
Guesang
Guiguilonen
Guilig
Inlambo
Lanas 33.29 22 83.22 2 2 2
Landas
Maasin 107.27 56 268.17 8 4 8
Macayug
Malabago
Navaluan
Nibaliw
Osiem
Palua
Poblacion
Pogo
Salay
Salaan
Talogtog 35.028 30 87.57 3 2 3
Tebag
GRAND TOTAL 2 2 3.75 260.568 165 651.41 18 11 18
PRAWN POLYCULTURE (Production CY 2019)
Barangay Area (has) No. of Optrs. Production Metric
Tons (MT)
Alitaya Amansabina Anolid Bantayan Bari Bateng 5 3 5
Banaoang
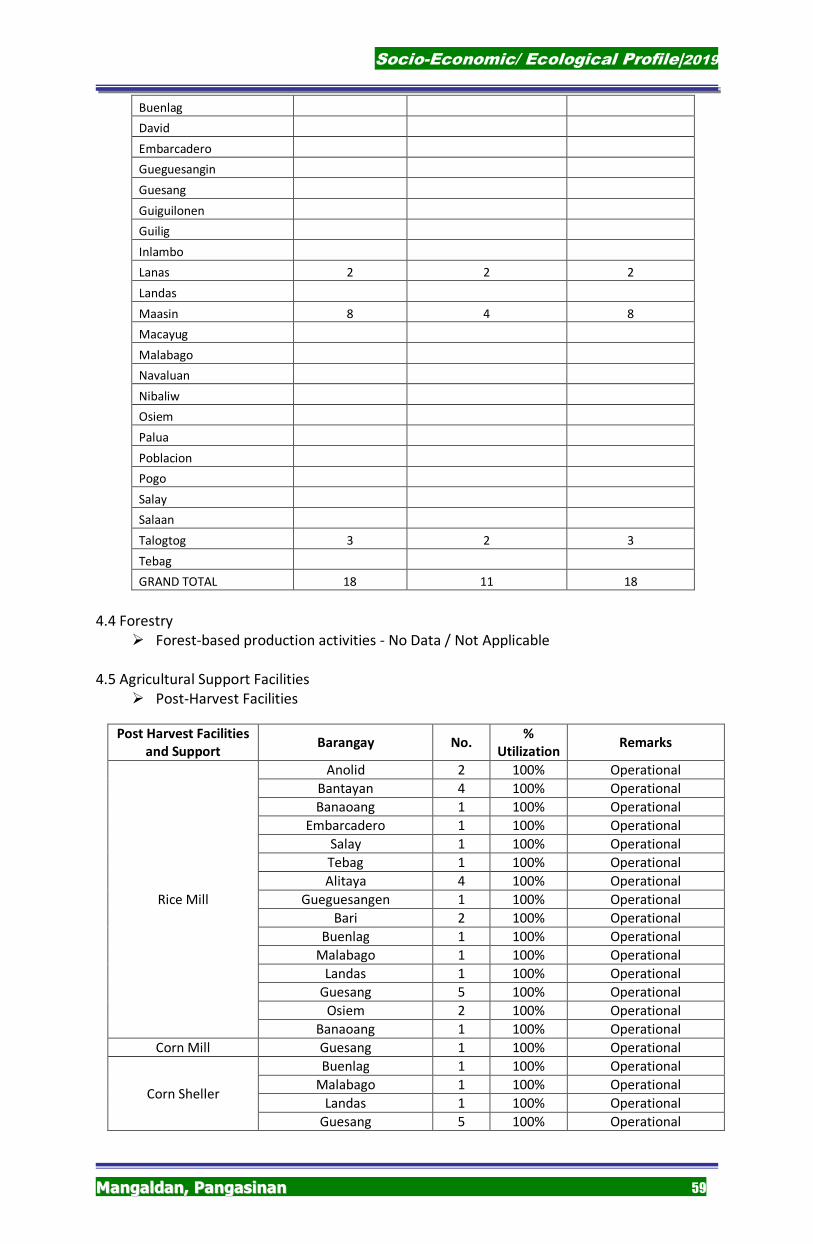
Socio-Economic/ Ecological Profile|2019
MMaannggaallddaann,, PPaannggaassiinnaann 59
Buenlag David Embarcadero Gueguesangin Guesang Guiguilonen Guilig Inlambo Lanas 2 2 2
Landas Maasin 8 4 8
Macayug Malabago Navaluan Nibaliw Osiem Palua Poblacion Pogo Salay Salaan Talogtog 3 2 3
Tebag GRAND TOTAL 18 11 18
4.4 Forestry
� Forest-based production activities - No Data / Not Applicable
4.5 Agricultural Support Facilities
� Post-Harvest Facilities
Post Harvest Facilities
and Support Barangay No.
%
Utilization Remarks
Rice Mill
Anolid 2 100% Operational
Bantayan 4 100% Operational
Banaoang 1 100% Operational
Embarcadero 1 100% Operational
Salay 1 100% Operational
Tebag 1 100% Operational
Alitaya 4 100% Operational
Gueguesangen 1 100% Operational
Bari 2 100% Operational
Buenlag 1 100% Operational
Malabago 1 100% Operational
Landas 1 100% Operational
Guesang 5 100% Operational
Osiem 2 100% Operational
Banaoang 1 100% Operational
Corn Mill Guesang 1 100% Operational
Corn Sheller
Buenlag 1 100% Operational
Malabago 1 100% Operational
Landas 1 100% Operational
Guesang 5 100% Operational
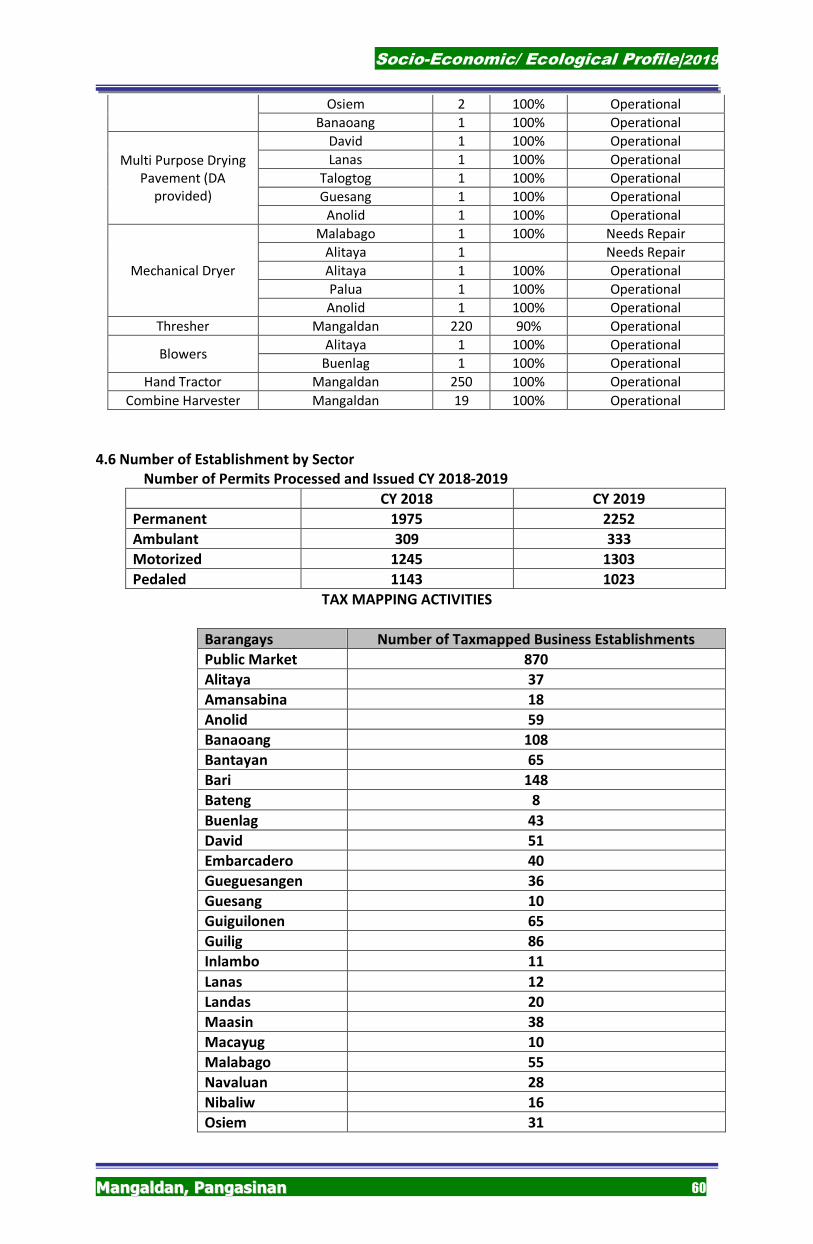
Socio-Economic/ Ecological Profile|2019
MMaannggaallddaann,, PPaannggaassiinnaann 60
Osiem 2 100% Operational
Banaoang 1 100% Operational
Multi Purpose Drying Pavement (DA
provided)
David 1 100% Operational
Lanas 1 100% Operational
Talogtog 1 100% Operational
Guesang 1 100% Operational
Anolid 1 100% Operational
Mechanical Dryer
Malabago 1 100% Needs Repair
Alitaya 1 Needs Repair
Alitaya 1 100% Operational
Palua 1 100% Operational
Anolid 1 100% Operational
Thresher Mangaldan 220 90% Operational
Blowers Alitaya 1 100% Operational
Buenlag 1 100% Operational
Hand Tractor Mangaldan 250 100% Operational
Combine Harvester Mangaldan 19 100% Operational
4.6 Number of Establishment by Sector
Number of Permits Processed and Issued CY 2018-2019
CY 2018 CY 2019
Permanent 1975 2252
Ambulant 309 333
Motorized 1245 1303
Pedaled 1143 1023
TAX MAPPING ACTIVITIES
Barangays Number of Taxmapped Business Establishments
Public Market 870
Alitaya 37
Amansabina 18
Anolid 59
Banaoang 108
Bantayan 65
Bari 148
Bateng 8
Buenlag 43
David 51
Embarcadero 40
Gueguesangen 36
Guesang 10
Guiguilonen 65
Guilig 86
Inlambo 11
Lanas 12
Landas 20
Maasin 38
Macayug 10
Malabago 55
Navaluan 28
Nibaliw 16
Osiem 31
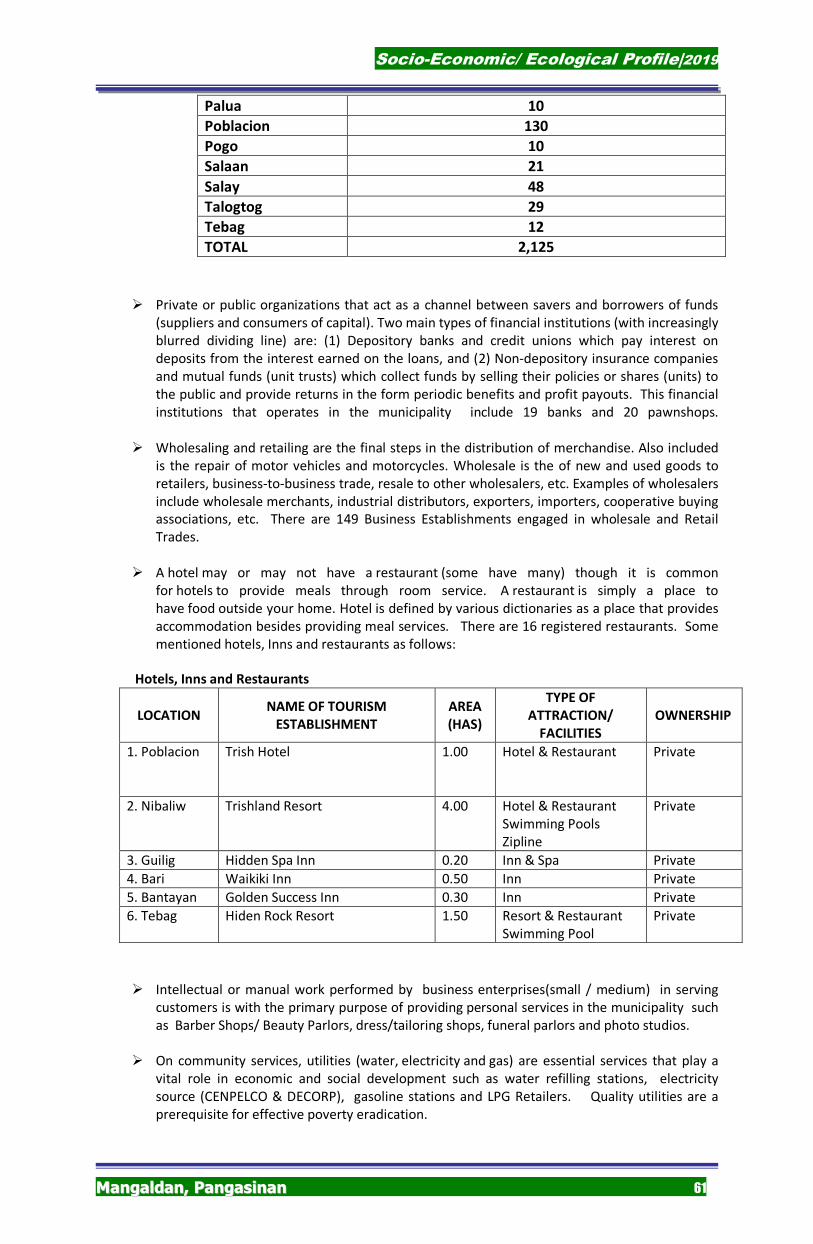
Socio-Economic/ Ecological Profile|2019
MMaannggaallddaann,, PPaannggaassiinnaann 61
Palua 10
Poblacion 130
Pogo 10
Salaan 21
Salay 48
Talogtog 29
Tebag 12
TOTAL 2,125
� Private or public organizations that act as a channel between savers and borrowers of funds
(suppliers and consumers of capital). Two main types of financial institutions (with increasingly blurred dividing line) are: (1) Depository banks and credit unions which pay interest on deposits from the interest earned on the loans, and (2) Non-depository insurance companies and mutual funds (unit trusts) which collect funds by selling their policies or shares (units) to the public and provide returns in the form periodic benefits and profit payouts. This financial institutions that operates in the municipality include 19 banks and 20 pawnshops.
� Wholesaling and retailing are the final steps in the distribution of merchandise. Also included is the repair of motor vehicles and motorcycles. Wholesale is the of new and used goods to retailers, business-to-business trade, resale to other wholesalers, etc. Examples of wholesalers include wholesale merchants, industrial distributors, exporters, importers, cooperative buying associations, etc. There are 149 Business Establishments engaged in wholesale and Retail Trades.
� A hotel may or may not have a restaurant (some have many) though it is common
for hotels to provide meals through room service. A restaurant is simply a place to have food outside your home. Hotel is defined by various dictionaries as a place that provides accommodation besides providing meal services. There are 16 registered restaurants. Some mentioned hotels, Inns and restaurants as follows:
Hotels, Inns and Restaurants
LOCATION NAME OF TOURISM
ESTABLISHMENT
AREA
(HAS)
TYPE OF
ATTRACTION/
FACILITIES
OWNERSHIP
1. Poblacion Trish Hotel
1.00
Hotel & Restaurant
Private
2. Nibaliw Trishland Resort 4.00 Hotel & Restaurant Swimming Pools Zipline
Private
3. Guilig Hidden Spa Inn 0.20 Inn & Spa Private
4. Bari Waikiki Inn 0.50 Inn Private
5. Bantayan Golden Success Inn 0.30 Inn Private
6. Tebag Hiden Rock Resort 1.50 Resort & Restaurant Swimming Pool
Private
� Intellectual or manual work performed by business enterprises(small / medium) in serving
customers is with the primary purpose of providing personal services in the municipality such as Barber Shops/ Beauty Parlors, dress/tailoring shops, funeral parlors and photo studios.
� On community services, utilities (water, electricity and gas) are essential services that play a
vital role in economic and social development such as water refilling stations, electricity source (CENPELCO & DECORP), gasoline stations and LPG Retailers. Quality utilities are a prerequisite for effective poverty eradication.
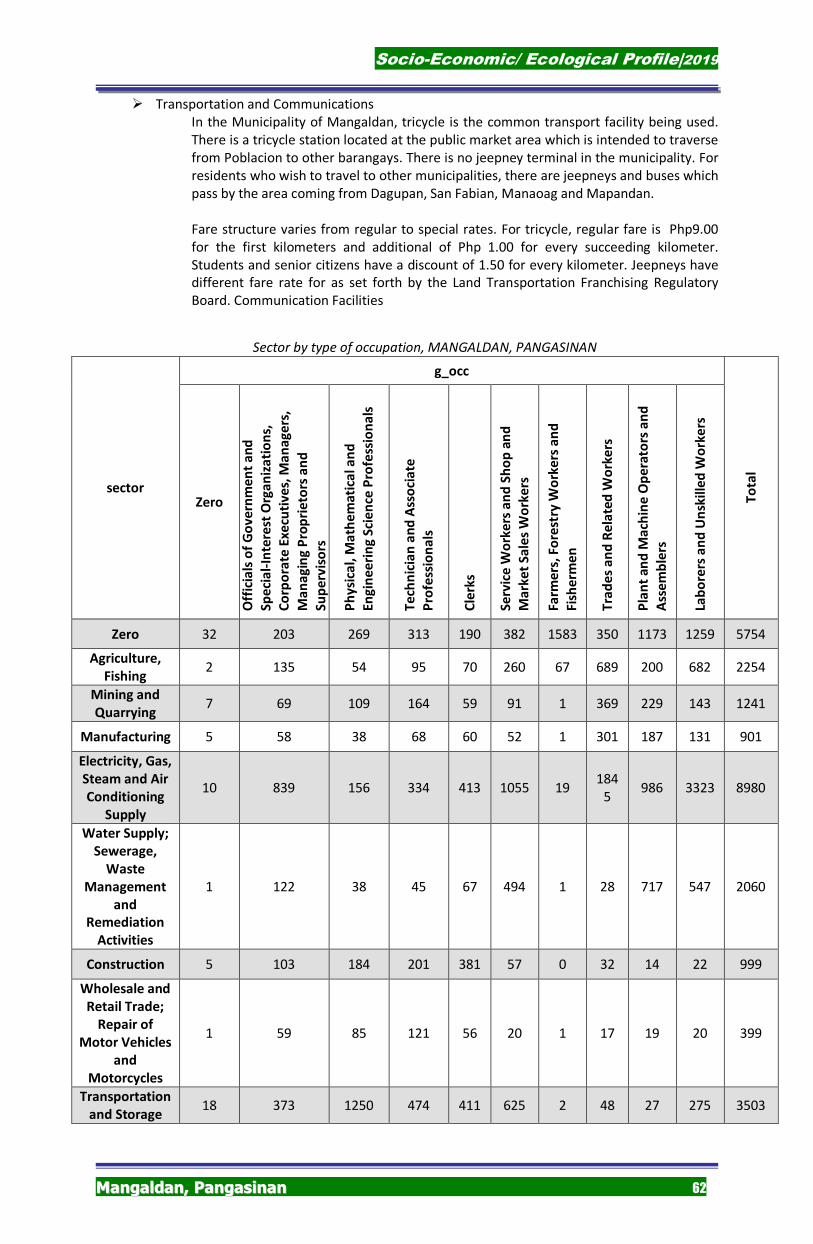
Socio-Economic/ Ecological Profile|2019
MMaannggaallddaann,, PPaannggaassiinnaann 62
� Transportation and Communications In the Municipality of Mangaldan, tricycle is the common transport facility being used. There is a tricycle station located at the public market area which is intended to traverse from Poblacion to other barangays. There is no jeepney terminal in the municipality. For residents who wish to travel to other municipalities, there are jeepneys and buses which pass by the area coming from Dagupan, San Fabian, Manaoag and Mapandan. Fare structure varies from regular to special rates. For tricycle, regular fare is Php9.00 for the first kilometers and additional of Php 1.00 for every succeeding kilometer. Students and senior citizens have a discount of 1.50 for every kilometer. Jeepneys have different fare rate for as set forth by the Land Transportation Franchising Regulatory Board. Communication Facilities
Sector by type of occupation, MANGALDAN, PANGASINAN
sector
g_occ
To
tal
Zero
Off
icia
ls o
f G
ov
ern
me
nt
an
d
Sp
eci
al-
Inte
rest
Org
an
iza
tio
ns,
Co
rpo
rate
Ex
ecu
tiv
es,
Ma
na
ge
rs,
Ma
na
gin
g P
rop
rie
tors
an
d
Su
pe
rvis
ors
Ph
ysi
cal,
Ma
the
ma
tica
l a
nd
En
gin
ee
rin
g S
cie
nce
Pro
fess
ion
als
Te
chn
icia
n a
nd
Ass
oci
ate
Pro
fess
ion
als
Cle
rks
Se
rvic
e W
ork
ers
an
d S
ho
p a
nd
Ma
rke
t S
ale
s W
ork
ers
Fa
rme
rs,
Fo
rest
ry W
ork
ers
an
d
Fis
he
rme
n
Tra
de
s a
nd
Re
late
d W
ork
ers
Pla
nt
an
d M
ach
ine
Op
era
tors
an
d
Ass
em
ble
rs
Lab
ore
rs a
nd
Un
skil
led
Wo
rke
rs
Zero 32 203 269 313 190 382 1583 350 1173 1259 5754
Agriculture,
Fishing 2 135 54 95 70 260 67 689 200 682 2254
Mining and
Quarrying 7 69 109 164 59 91 1 369 229 143 1241
Manufacturing 5 58 38 68 60 52 1 301 187 131 901
Electricity, Gas,
Steam and Air
Conditioning
Supply
10 839 156 334 413 1055 19 184
5 986 3323 8980
Water Supply;
Sewerage,
Waste
Management
and
Remediation
Activities
1 122 38 45 67 494 1 28 717 547 2060
Construction 5 103 184 201 381 57 0 32 14 22 999
Wholesale and
Retail Trade;
Repair of
Motor Vehicles
and
Motorcycles
1 59 85 121 56 20 1 17 19 20 399
Transportation
and Storage 18 373 1250 474 411 625 2 48 27 275 3503
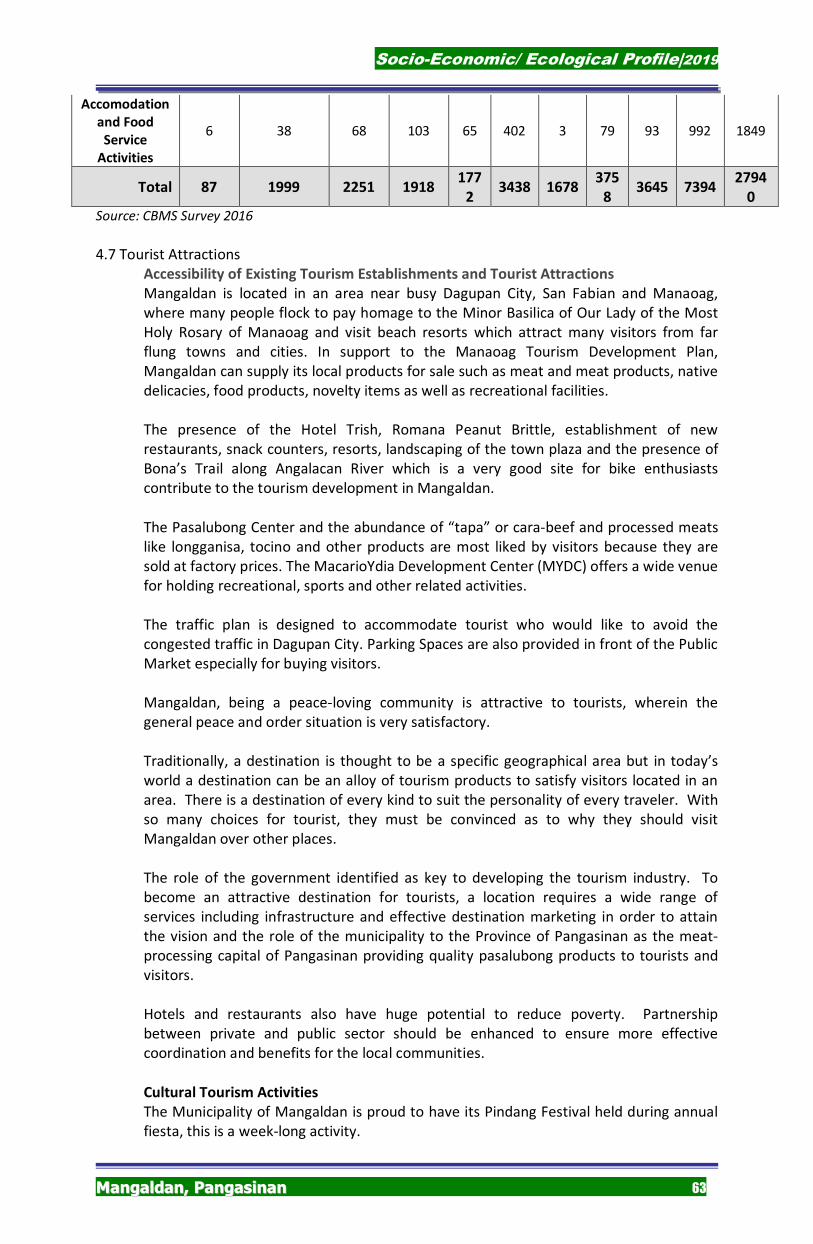
Socio-Economic/ Ecological Profile|2019
MMaannggaallddaann,, PPaannggaassiinnaann 63
Accomodation
and Food
Service
Activities
6 38 68 103 65 402 3 79 93 992 1849
Total 87 1999 2251 1918 177
2 3438 1678
375
8 3645 7394
2794
0
Source: CBMS Survey 2016
4.7 Tourist Attractions Accessibility of Existing Tourism Establishments and Tourist Attractions
Mangaldan is located in an area near busy Dagupan City, San Fabian and Manaoag,
where many people flock to pay homage to the Minor Basilica of Our Lady of the Most
Holy Rosary of Manaoag and visit beach resorts which attract many visitors from far
flung towns and cities. In support to the Manaoag Tourism Development Plan,
Mangaldan can supply its local products for sale such as meat and meat products, native
delicacies, food products, novelty items as well as recreational facilities.
The presence of the Hotel Trish, Romana Peanut Brittle, establishment of new
restaurants, snack counters, resorts, landscaping of the town plaza and the presence of
Bona’s Trail along Angalacan River which is a very good site for bike enthusiasts
contribute to the tourism development in Mangaldan.
The Pasalubong Center and the abundance of “tapa” or cara-beef and processed meats
like longganisa, tocino and other products are most liked by visitors because they are
sold at factory prices. The MacarioYdia Development Center (MYDC) offers a wide venue
for holding recreational, sports and other related activities.
The traffic plan is designed to accommodate tourist who would like to avoid the
congested traffic in Dagupan City. Parking Spaces are also provided in front of the Public
Market especially for buying visitors.
Mangaldan, being a peace-loving community is attractive to tourists, wherein the
general peace and order situation is very satisfactory.
Traditionally, a destination is thought to be a specific geographical area but in today’s
world a destination can be an alloy of tourism products to satisfy visitors located in an
area. There is a destination of every kind to suit the personality of every traveler. With
so many choices for tourist, they must be convinced as to why they should visit
Mangaldan over other places.
The role of the government identified as key to developing the tourism industry. To
become an attractive destination for tourists, a location requires a wide range of
services including infrastructure and effective destination marketing in order to attain
the vision and the role of the municipality to the Province of Pangasinan as the meat-
processing capital of Pangasinan providing quality pasalubong products to tourists and
visitors.
Hotels and restaurants also have huge potential to reduce poverty. Partnership
between private and public sector should be enhanced to ensure more effective
coordination and benefits for the local communities.
Cultural Tourism Activities
The Municipality of Mangaldan is proud to have its Pindang Festival held during annual
fiesta, this is a week-long activity.
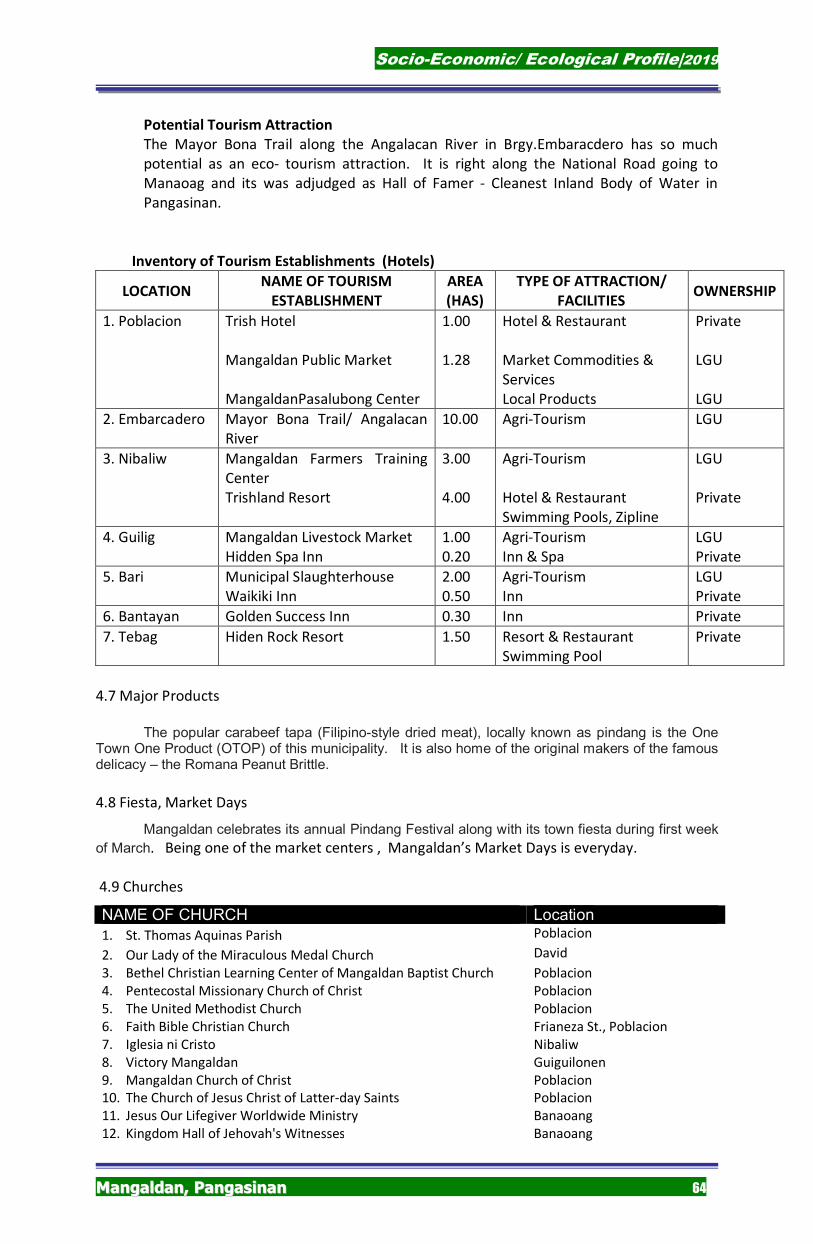
Socio-Economic/ Ecological Profile|2019
MMaannggaallddaann,, PPaannggaassiinnaann 64
Potential Tourism Attraction
The Mayor Bona Trail along the Angalacan River in Brgy.Embaracdero has so much
potential as an eco- tourism attraction. It is right along the National Road going to
Manaoag and its was adjudged as Hall of Famer - Cleanest Inland Body of Water in
Pangasinan.
Inventory of Tourism Establishments (Hotels)
LOCATION NAME OF TOURISM
ESTABLISHMENT
AREA
(HAS)
TYPE OF ATTRACTION/
FACILITIES OWNERSHIP
1. Poblacion Trish Hotel
Mangaldan Public Market
MangaldanPasalubong Center
1.00
1.28
Hotel & Restaurant
Market Commodities &
Services
Local Products
Private
LGU
LGU
2. Embarcadero Mayor Bona Trail/ Angalacan
River
10.00 Agri-Tourism
LGU
3. Nibaliw Mangaldan Farmers Training
Center
Trishland Resort
3.00
4.00
Agri-Tourism
Hotel & Restaurant
Swimming Pools, Zipline
LGU
Private
4. Guilig Mangaldan Livestock Market
Hidden Spa Inn
1.00
0.20
Agri-Tourism
Inn & Spa
LGU
Private
5. Bari Municipal Slaughterhouse
Waikiki Inn
2.00
0.50
Agri-Tourism
Inn
LGU
Private
6. Bantayan Golden Success Inn 0.30 Inn Private
7. Tebag Hiden Rock Resort 1.50 Resort & Restaurant
Swimming Pool
Private
4.7 Major Products
The popular carabeef tapa (Filipino-style dried meat), locally known as pindang is the One
Town One Product (OTOP) of this municipality. It is also home of the original makers of the famous delicacy – the Romana Peanut Brittle.
4.8 Fiesta, Market Days
Mangaldan celebrates its annual Pindang Festival along with its town fiesta during first week
of March. Being one of the market centers , Mangaldan’s Market Days is everyday.
4.9 Churches
NAME OF CHURCH Location
1. St. Thomas Aquinas Parish Poblacion
2. Our Lady of the Miraculous Medal Church David
3. Bethel Christian Learning Center of Mangaldan Baptist Church Poblacion 4. Pentecostal Missionary Church of Christ Poblacion 5. The United Methodist Church Poblacion 6. Faith Bible Christian Church Frianeza St., Poblacion 7. Iglesia ni Cristo Nibaliw 8. Victory Mangaldan Guiguilonen 9. Mangaldan Church of Christ Poblacion 10. The Church of Jesus Christ of Latter-day Saints Poblacion 11. Jesus Our Lifegiver Worldwide Ministry Banaoang 12. Kingdom Hall of Jehovah's Witnesses Banaoang
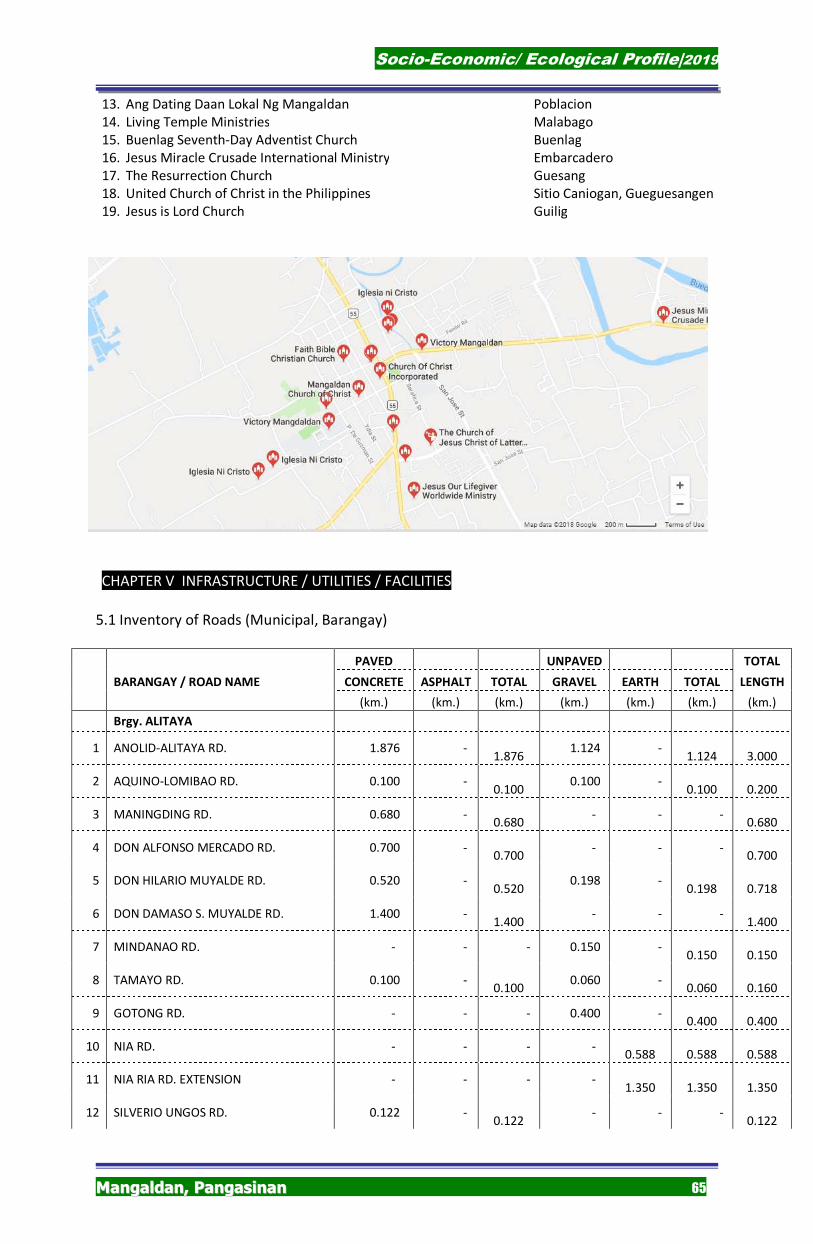
Socio-Economic/ Ecological Profile|2019
MMaannggaallddaann,, PPaannggaassiinnaann 65
13. Ang Dating Daan Lokal Ng Mangaldan Poblacion 14. Living Temple Ministries Malabago 15. Buenlag Seventh-Day Adventist Church Buenlag 16. Jesus Miracle Crusade International Ministry Embarcadero 17. The Resurrection Church Guesang 18. United Church of Christ in the Philippines Sitio Caniogan, Gueguesangen 19. Jesus is Lord Church Guilig
CHAPTER V INFRASTRUCTURE / UTILITIES / FACILITIES
5.1 Inventory of Roads (Municipal, Barangay)
PAVED UNPAVED TOTAL
BARANGAY / ROAD NAME CONCRETE ASPHALT TOTAL GRAVEL EARTH TOTAL LENGTH
(km.) (km.) (km.) (km.) (km.) (km.) (km.)
Brgy. ALITAYA
1 ANOLID-ALITAYA RD. 1.876 -
1.876 1.124 -
1.124
3.000
2 AQUINO-LOMIBAO RD. 0.100 -
0.100 0.100 -
0.100
0.200
3 MANINGDING RD. 0.680 -
0.680 - - -
0.680
4 DON ALFONSO MERCADO RD. 0.700 -
0.700 - - -
0.700
5 DON HILARIO MUYALDE RD. 0.520 -
0.520 0.198 -
0.198
0.718
6 DON DAMASO S. MUYALDE RD. 1.400 -
1.400 - - -
1.400
7 MINDANAO RD. - - - 0.150 -
0.150
0.150
8 TAMAYO RD. 0.100 -
0.100 0.060 -
0.060
0.160
9 GOTONG RD. - - - 0.400 -
0.400
0.400
10 NIA RD. - - - -
0.588
0.588
0.588
11 NIA RIA RD. EXTENSION - - - -
1.350
1.350
1.350
12 SILVERIO UNGOS RD. 0.122 -
0.122 - - -
0.122
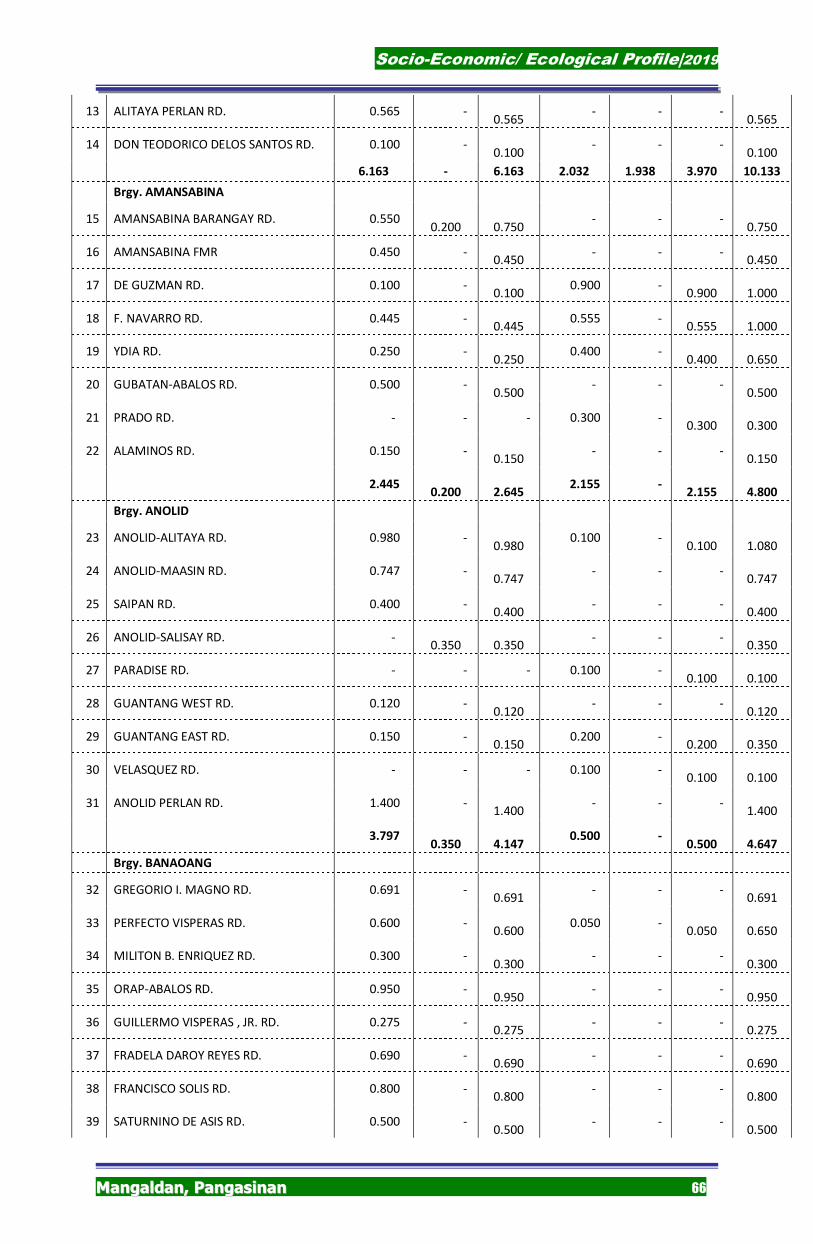
Socio-Economic/ Ecological Profile|2019
MMaannggaallddaann,, PPaannggaassiinnaann 66
13 ALITAYA PERLAN RD. 0.565 -
0.565 - - -
0.565
14 DON TEODORICO DELOS SANTOS RD. 0.100 -
0.100 - - -
0.100
6.163 - 6.163 2.032 1.938 3.970 10.133
Brgy. AMANSABINA
15 AMANSABINA BARANGAY RD. 0.550
0.200
0.750 - - -
0.750
16 AMANSABINA FMR 0.450 -
0.450 - - -
0.450
17 DE GUZMAN RD. 0.100 -
0.100 0.900 -
0.900
1.000
18 F. NAVARRO RD. 0.445 -
0.445 0.555 -
0.555
1.000
19 YDIA RD. 0.250 -
0.250 0.400 -
0.400
0.650
20 GUBATAN-ABALOS RD. 0.500 -
0.500 - - -
0.500
21 PRADO RD. - - - 0.300 -
0.300
0.300
22 ALAMINOS RD. 0.150 -
0.150 - - -
0.150
2.445
0.200
2.645 2.155 -
2.155
4.800
Brgy. ANOLID
23 ANOLID-ALITAYA RD. 0.980 -
0.980 0.100 -
0.100
1.080
24 ANOLID-MAASIN RD. 0.747 -
0.747 - - -
0.747
25 SAIPAN RD. 0.400 -
0.400 - - -
0.400
26 ANOLID-SALISAY RD. -
0.350
0.350 - - -
0.350
27 PARADISE RD. - - - 0.100 -
0.100
0.100
28 GUANTANG WEST RD. 0.120 -
0.120 - - -
0.120
29 GUANTANG EAST RD. 0.150 -
0.150 0.200 -
0.200
0.350
30 VELASQUEZ RD. - - - 0.100 -
0.100
0.100
31 ANOLID PERLAN RD. 1.400 -
1.400 - - -
1.400
3.797
0.350
4.147 0.500 -
0.500
4.647
Brgy. BANAOANG
32 GREGORIO I. MAGNO RD. 0.691 -
0.691 - - -
0.691
33 PERFECTO VISPERAS RD. 0.600 -
0.600 0.050 -
0.050
0.650
34 MILITON B. ENRIQUEZ RD. 0.300 -
0.300 - - -
0.300
35 ORAP-ABALOS RD. 0.950 -
0.950 - - -
0.950
36 GUILLERMO VISPERAS , JR. RD. 0.275 -
0.275 - - -
0.275
37 FRADELA DAROY REYES RD. 0.690 -
0.690 - - -
0.690
38 FRANCISCO SOLIS RD. 0.800 -
0.800 - - -
0.800
39 SATURNINO DE ASIS RD. 0.500 -
0.500 - - -
0.500
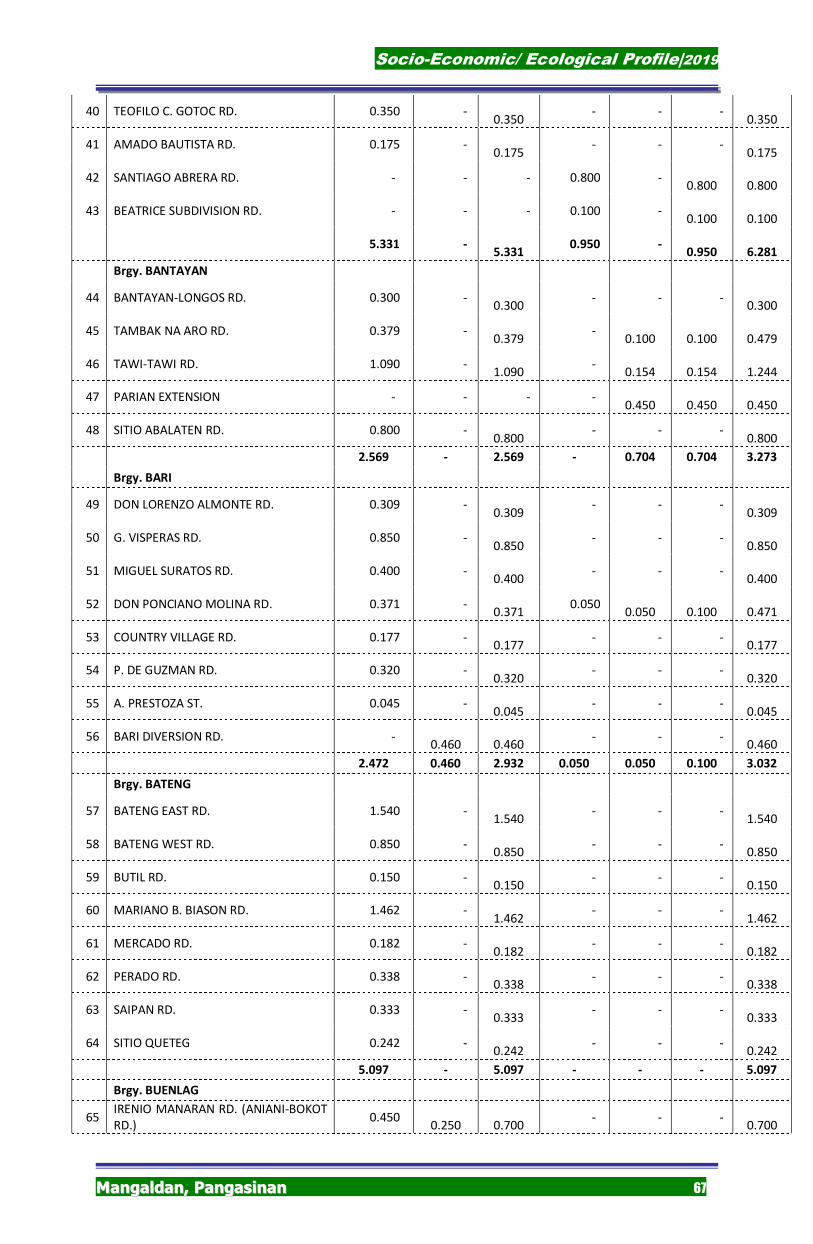
Socio-Economic/ Ecological Profile|2019
MMaannggaallddaann,, PPaannggaassiinnaann 67
40 TEOFILO C. GOTOC RD. 0.350 -
0.350 - - -
0.350
41 AMADO BAUTISTA RD. 0.175 -
0.175 - - -
0.175
42 SANTIAGO ABRERA RD. - - - 0.800 -
0.800
0.800
43 BEATRICE SUBDIVISION RD. - - - 0.100 -
0.100
0.100
5.331 -
5.331 0.950 -
0.950
6.281
Brgy. BANTAYAN
44 BANTAYAN-LONGOS RD. 0.300 -
0.300 - - -
0.300
45 TAMBAK NA ARO RD. 0.379 -
0.379 -
0.100
0.100
0.479
46 TAWI-TAWI RD. 1.090 -
1.090 -
0.154
0.154
1.244
47 PARIAN EXTENSION - - - -
0.450
0.450
0.450
48 SITIO ABALATEN RD. 0.800 -
0.800 - - -
0.800
2.569 - 2.569 - 0.704 0.704 3.273
Brgy. BARI
49 DON LORENZO ALMONTE RD. 0.309 -
0.309 - - -
0.309
50 G. VISPERAS RD. 0.850 -
0.850 - - -
0.850
51 MIGUEL SURATOS RD. 0.400 -
0.400 - - -
0.400
52 DON PONCIANO MOLINA RD. 0.371 -
0.371 0.050
0.050
0.100
0.471
53 COUNTRY VILLAGE RD. 0.177 -
0.177 - - -
0.177
54 P. DE GUZMAN RD. 0.320 -
0.320 - - -
0.320
55 A. PRESTOZA ST. 0.045 -
0.045 - - -
0.045
56 BARI DIVERSION RD. -
0.460
0.460 - - -
0.460
2.472 0.460 2.932 0.050 0.050 0.100 3.032
Brgy. BATENG
57 BATENG EAST RD. 1.540 -
1.540 - - -
1.540
58 BATENG WEST RD. 0.850 -
0.850 - - -
0.850
59 BUTIL RD. 0.150 -
0.150 - - -
0.150
60 MARIANO B. BIASON RD. 1.462 -
1.462 - - -
1.462
61 MERCADO RD. 0.182 -
0.182 - - -
0.182
62 PERADO RD. 0.338 -
0.338 - - -
0.338
63 SAIPAN RD. 0.333 -
0.333 - - -
0.333
64 SITIO QUETEG 0.242 -
0.242 - - -
0.242
5.097 - 5.097 - - - 5.097
Brgy. BUENLAG
65 IRENIO MANARAN RD. (ANIANI-BOKOT RD.)
0.450
0.250
0.700 - - -
0.700
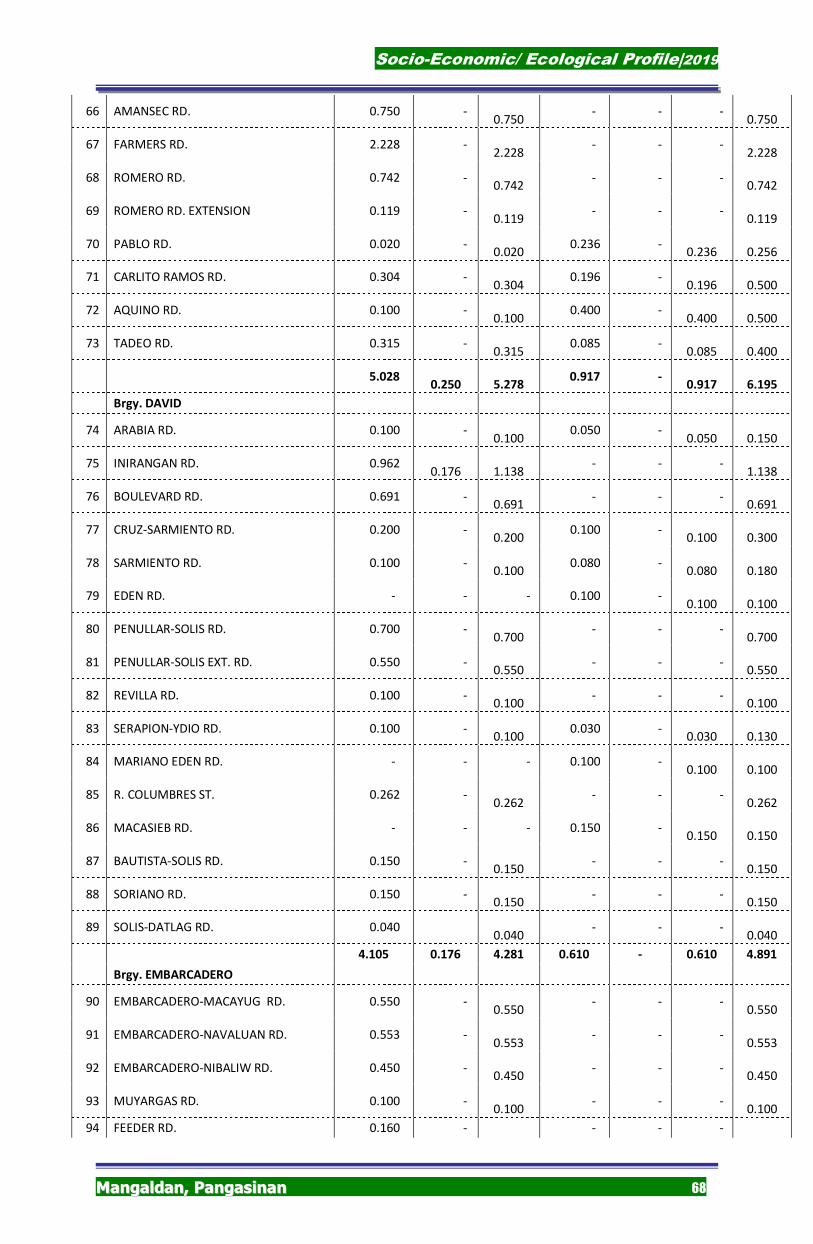
Socio-Economic/ Ecological Profile|2019
MMaannggaallddaann,, PPaannggaassiinnaann 68
66 AMANSEC RD. 0.750 -
0.750 - - -
0.750
67 FARMERS RD. 2.228 -
2.228 - - -
2.228
68 ROMERO RD. 0.742 -
0.742 - - -
0.742
69 ROMERO RD. EXTENSION 0.119 -
0.119 - - -
0.119
70 PABLO RD. 0.020 -
0.020 0.236 -
0.236
0.256
71 CARLITO RAMOS RD. 0.304 -
0.304 0.196 -
0.196
0.500
72 AQUINO RD. 0.100 -
0.100 0.400 -
0.400
0.500
73 TADEO RD. 0.315 -
0.315 0.085 -
0.085
0.400
5.028
0.250
5.278 0.917 -
0.917
6.195
Brgy. DAVID
74 ARABIA RD. 0.100 -
0.100 0.050 -
0.050
0.150
75 INIRANGAN RD. 0.962
0.176
1.138 - - -
1.138
76 BOULEVARD RD. 0.691 -
0.691 - - -
0.691
77 CRUZ-SARMIENTO RD. 0.200 -
0.200 0.100 -
0.100
0.300
78 SARMIENTO RD. 0.100 -
0.100 0.080 -
0.080
0.180
79 EDEN RD. - - - 0.100 -
0.100
0.100
80 PENULLAR-SOLIS RD. 0.700 -
0.700 - - -
0.700
81 PENULLAR-SOLIS EXT. RD. 0.550 -
0.550 - - -
0.550
82 REVILLA RD. 0.100 -
0.100 - - -
0.100
83 SERAPION-YDIO RD. 0.100 -
0.100 0.030 -
0.030
0.130
84 MARIANO EDEN RD. - - - 0.100 -
0.100
0.100
85 R. COLUMBRES ST. 0.262 -
0.262 - - -
0.262
86 MACASIEB RD. - - - 0.150 -
0.150
0.150
87 BAUTISTA-SOLIS RD. 0.150 -
0.150 - - -
0.150
88 SORIANO RD. 0.150 -
0.150 - - -
0.150
89 SOLIS-DATLAG RD. 0.040
0.040 - - -
0.040
4.105 0.176 4.281 0.610 - 0.610 4.891
Brgy. EMBARCADERO
90 EMBARCADERO-MACAYUG RD. 0.550 -
0.550 - - -
0.550
91 EMBARCADERO-NAVALUAN RD. 0.553 -
0.553 - - -
0.553
92 EMBARCADERO-NIBALIW RD. 0.450 -
0.450 - - -
0.450
93 MUYARGAS RD. 0.100 -
0.100 - - -
0.100
94 FEEDER RD. 0.160 - - - -
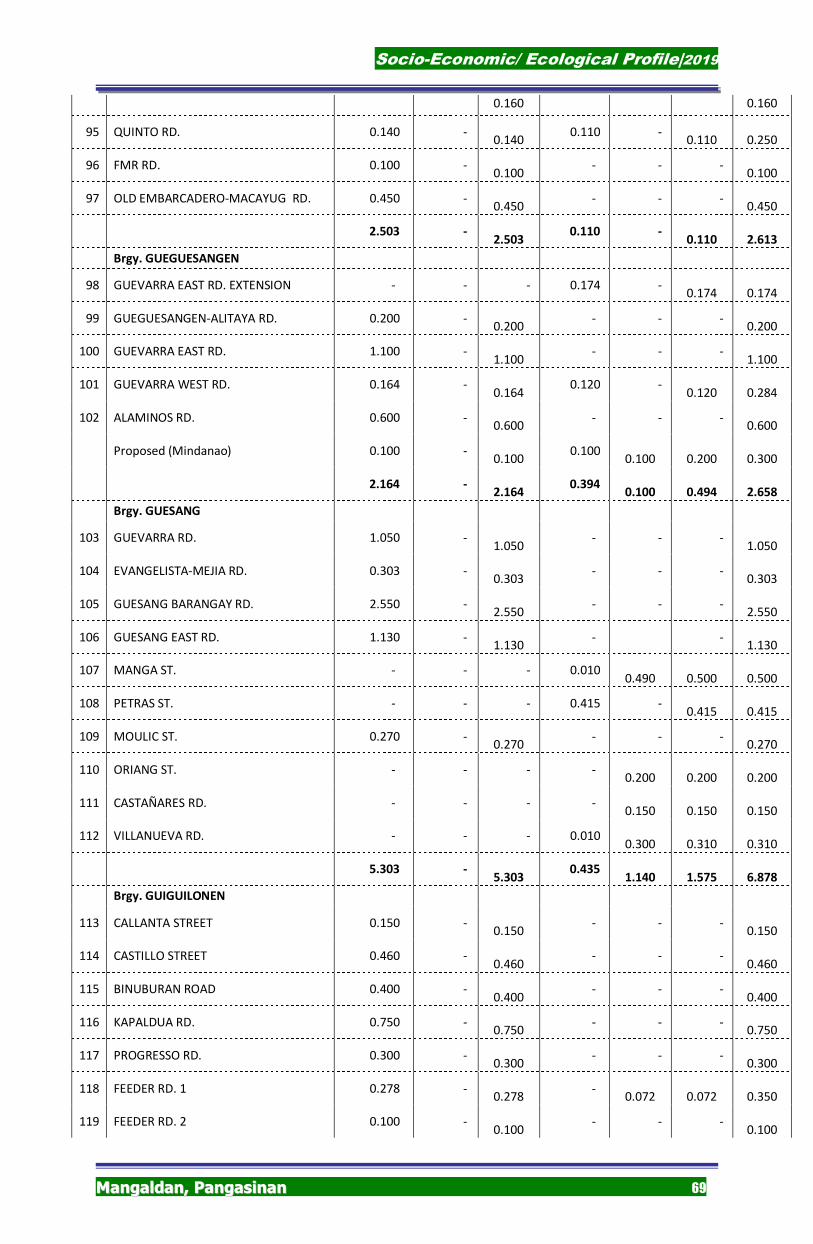
Socio-Economic/ Ecological Profile|2019
MMaannggaallddaann,, PPaannggaassiinnaann 69
0.160 0.160
95 QUINTO RD. 0.140 -
0.140 0.110 -
0.110
0.250
96 FMR RD. 0.100 -
0.100 - - -
0.100
97 OLD EMBARCADERO-MACAYUG RD. 0.450 -
0.450 - - -
0.450
2.503 -
2.503 0.110 -
0.110
2.613
Brgy. GUEGUESANGEN
98 GUEVARRA EAST RD. EXTENSION - - - 0.174 -
0.174
0.174
99 GUEGUESANGEN-ALITAYA RD. 0.200 -
0.200 - - -
0.200
100 GUEVARRA EAST RD. 1.100 -
1.100 - - -
1.100
101 GUEVARRA WEST RD. 0.164 -
0.164 0.120 -
0.120
0.284
102 ALAMINOS RD. 0.600 -
0.600 - - -
0.600
Proposed (Mindanao) 0.100 -
0.100 0.100
0.100
0.200
0.300
2.164 -
2.164 0.394
0.100
0.494
2.658
Brgy. GUESANG
103 GUEVARRA RD. 1.050 -
1.050 - - -
1.050
104 EVANGELISTA-MEJIA RD. 0.303 -
0.303 - - -
0.303
105 GUESANG BARANGAY RD. 2.550 -
2.550 - - -
2.550
106 GUESANG EAST RD. 1.130 -
1.130 - -
1.130
107 MANGA ST. - - - 0.010
0.490
0.500
0.500
108 PETRAS ST. - - - 0.415 -
0.415
0.415
109 MOULIC ST. 0.270 -
0.270 - - -
0.270
110 ORIANG ST. - - - -
0.200
0.200
0.200
111 CASTAÑARES RD. - - - -
0.150
0.150
0.150
112 VILLANUEVA RD. - - - 0.010
0.300
0.310
0.310
5.303 -
5.303 0.435
1.140
1.575
6.878
Brgy. GUIGUILONEN
113 CALLANTA STREET 0.150 -
0.150 - - -
0.150
114 CASTILLO STREET 0.460 -
0.460 - - -
0.460
115 BINUBURAN ROAD 0.400 -
0.400 - - -
0.400
116 KAPALDUA RD. 0.750 -
0.750 - - -
0.750
117 PROGRESSO RD. 0.300 -
0.300 - - -
0.300
118 FEEDER RD. 1 0.278 -
0.278 -
0.072
0.072
0.350
119 FEEDER RD. 2 0.100 -
0.100 - - -
0.100
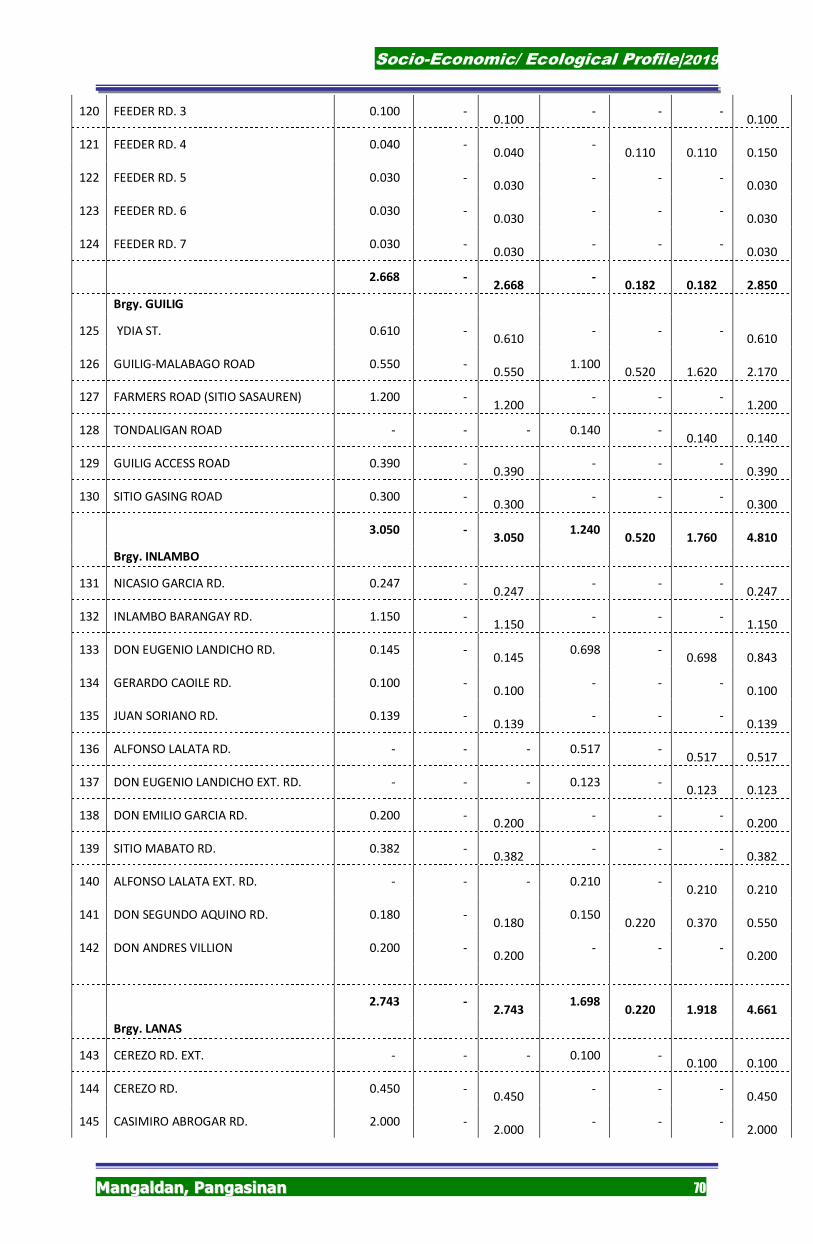
Socio-Economic/ Ecological Profile|2019
MMaannggaallddaann,, PPaannggaassiinnaann 70
120 FEEDER RD. 3 0.100 -
0.100 - - -
0.100
121 FEEDER RD. 4 0.040 -
0.040 -
0.110
0.110
0.150
122 FEEDER RD. 5 0.030 -
0.030 - - -
0.030
123 FEEDER RD. 6 0.030 -
0.030 - - -
0.030
124 FEEDER RD. 7 0.030 -
0.030 - - -
0.030
2.668 -
2.668 -
0.182
0.182
2.850
Brgy. GUILIG
125 YDIA ST. 0.610 -
0.610 - - -
0.610
126 GUILIG-MALABAGO ROAD 0.550 -
0.550 1.100
0.520
1.620
2.170
127 FARMERS ROAD (SITIO SASAUREN) 1.200 -
1.200 - - -
1.200
128 TONDALIGAN ROAD - - - 0.140 -
0.140
0.140
129 GUILIG ACCESS ROAD 0.390 -
0.390 - - -
0.390
130 SITIO GASING ROAD 0.300 -
0.300 - - -
0.300
3.050 -
3.050 1.240
0.520
1.760
4.810
Brgy. INLAMBO
131 NICASIO GARCIA RD. 0.247 -
0.247 - - -
0.247
132 INLAMBO BARANGAY RD. 1.150 -
1.150 - - -
1.150
133 DON EUGENIO LANDICHO RD. 0.145 -
0.145 0.698 -
0.698
0.843
134 GERARDO CAOILE RD. 0.100 -
0.100 - - -
0.100
135 JUAN SORIANO RD. 0.139 -
0.139 - - -
0.139
136 ALFONSO LALATA RD. - - - 0.517 -
0.517
0.517
137 DON EUGENIO LANDICHO EXT. RD. - - - 0.123 -
0.123
0.123
138 DON EMILIO GARCIA RD. 0.200 -
0.200 - - -
0.200
139 SITIO MABATO RD. 0.382 -
0.382 - - -
0.382
140 ALFONSO LALATA EXT. RD. - - - 0.210 -
0.210
0.210
141 DON SEGUNDO AQUINO RD. 0.180 -
0.180 0.150
0.220
0.370
0.550
142 DON ANDRES VILLION 0.200 -
0.200 - - -
0.200
2.743 -
2.743 1.698
0.220
1.918
4.661
Brgy. LANAS
143 CEREZO RD. EXT. - - - 0.100 -
0.100
0.100
144 CEREZO RD. 0.450 -
0.450 - - -
0.450
145 CASIMIRO ABROGAR RD. 2.000 -
2.000 - - -
2.000
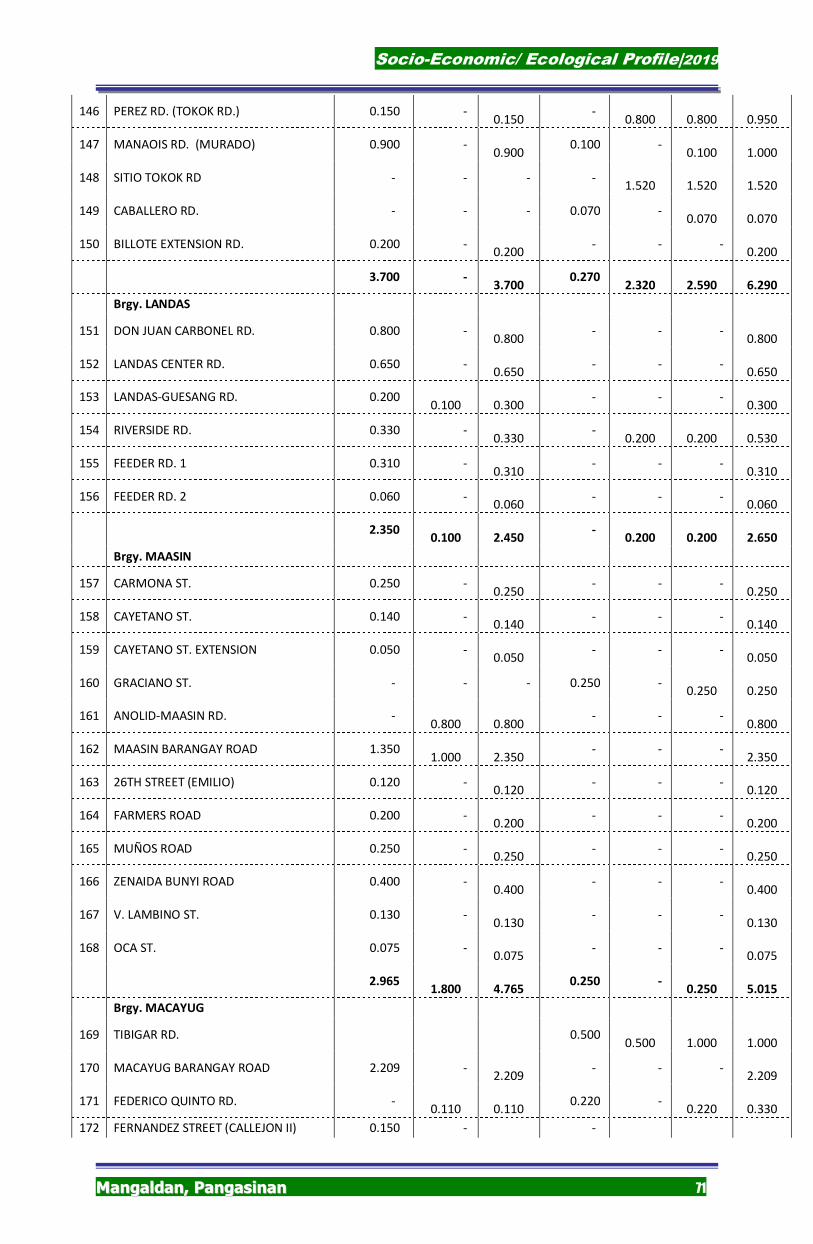
Socio-Economic/ Ecological Profile|2019
MMaannggaallddaann,, PPaannggaassiinnaann 71
146 PEREZ RD. (TOKOK RD.) 0.150 -
0.150 -
0.800
0.800
0.950
147 MANAOIS RD. (MURADO) 0.900 -
0.900 0.100 -
0.100
1.000
148 SITIO TOKOK RD - - - -
1.520
1.520
1.520
149 CABALLERO RD. - - - 0.070 -
0.070
0.070
150 BILLOTE EXTENSION RD. 0.200 -
0.200 - - -
0.200
3.700 -
3.700 0.270
2.320
2.590
6.290
Brgy. LANDAS
151 DON JUAN CARBONEL RD. 0.800 -
0.800 - - -
0.800
152 LANDAS CENTER RD. 0.650 -
0.650 - - -
0.650
153 LANDAS-GUESANG RD. 0.200
0.100
0.300 - - -
0.300
154 RIVERSIDE RD. 0.330 -
0.330 -
0.200
0.200
0.530
155 FEEDER RD. 1 0.310 -
0.310 - - -
0.310
156 FEEDER RD. 2 0.060 -
0.060 - - -
0.060
2.350
0.100
2.450 -
0.200
0.200
2.650
Brgy. MAASIN
157 CARMONA ST. 0.250 -
0.250 - - -
0.250
158 CAYETANO ST. 0.140 -
0.140 - - -
0.140
159 CAYETANO ST. EXTENSION 0.050 -
0.050 - - -
0.050
160 GRACIANO ST. - - - 0.250 -
0.250
0.250
161 ANOLID-MAASIN RD. -
0.800
0.800 - - -
0.800
162 MAASIN BARANGAY ROAD 1.350
1.000
2.350 - - -
2.350
163 26TH STREET (EMILIO) 0.120 -
0.120 - - -
0.120
164 FARMERS ROAD 0.200 -
0.200 - - -
0.200
165 MUÑOS ROAD 0.250 -
0.250 - - -
0.250
166 ZENAIDA BUNYI ROAD 0.400 -
0.400 - - -
0.400
167 V. LAMBINO ST. 0.130 -
0.130 - - -
0.130
168 OCA ST. 0.075 -
0.075 - - -
0.075
2.965
1.800
4.765 0.250 -
0.250
5.015
Brgy. MACAYUG
169 TIBIGAR RD. 0.500
0.500
1.000
1.000
170 MACAYUG BARANGAY ROAD 2.209 -
2.209 - - -
2.209
171 FEDERICO QUINTO RD. -
0.110
0.110 0.220 -
0.220
0.330
172 FERNANDEZ STREET (CALLEJON II) 0.150 - -
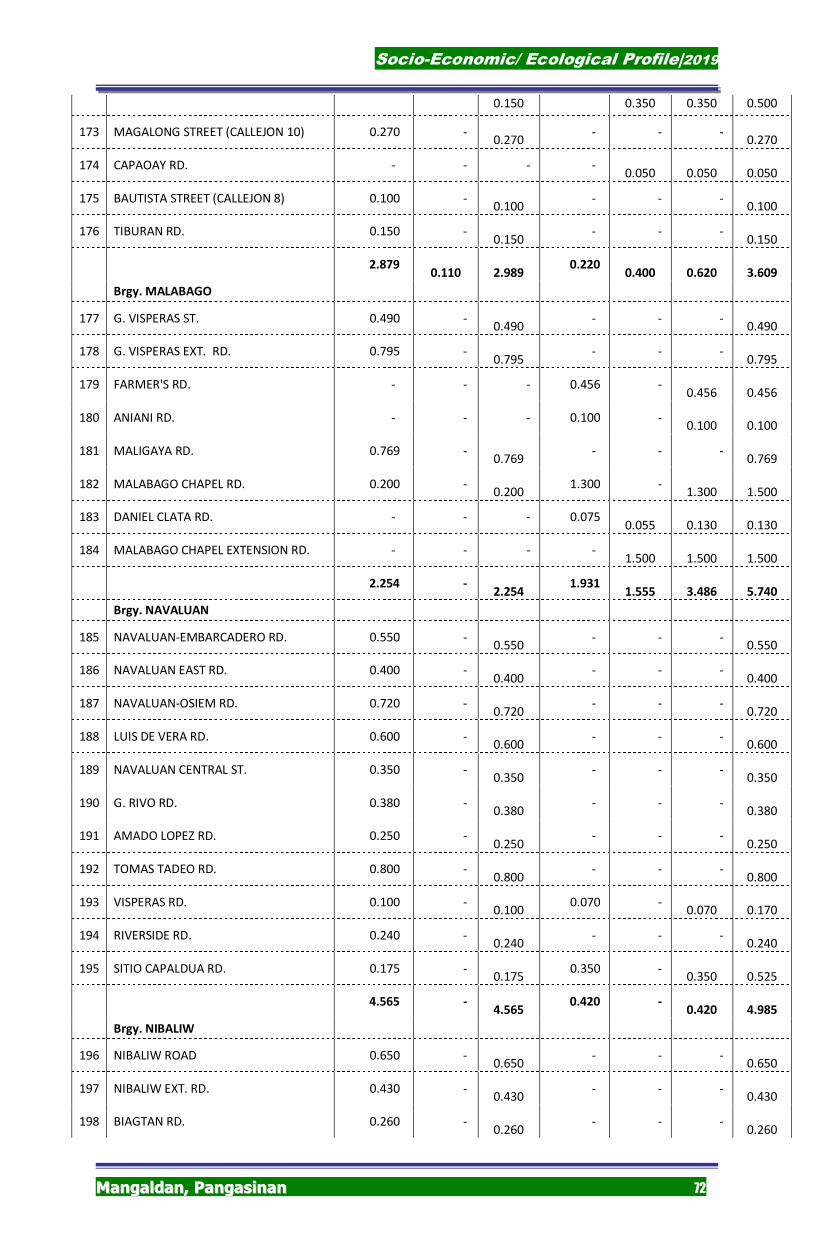
Socio-Economic/ Ecological Profile|2019
MMaannggaallddaann,, PPaannggaassiinnaann 72
0.150 0.350 0.350 0.500
173 MAGALONG STREET (CALLEJON 10) 0.270 -
0.270 - - -
0.270
174 CAPAOAY RD. - - - -
0.050
0.050
0.050
175 BAUTISTA STREET (CALLEJON 8) 0.100 -
0.100 - - -
0.100
176 TIBURAN RD. 0.150 -
0.150 - - -
0.150
2.879
0.110
2.989 0.220
0.400
0.620
3.609
Brgy. MALABAGO
177 G. VISPERAS ST. 0.490 -
0.490 - - -
0.490
178 G. VISPERAS EXT. RD. 0.795 -
0.795 - - -
0.795
179 FARMER'S RD. - - - 0.456 -
0.456
0.456
180 ANIANI RD. - - - 0.100 -
0.100
0.100
181 MALIGAYA RD. 0.769 -
0.769 - - -
0.769
182 MALABAGO CHAPEL RD. 0.200 -
0.200 1.300 -
1.300
1.500
183 DANIEL CLATA RD. - - - 0.075
0.055
0.130
0.130
184 MALABAGO CHAPEL EXTENSION RD. - - - -
1.500
1.500
1.500
2.254 -
2.254 1.931
1.555
3.486
5.740
Brgy. NAVALUAN
185 NAVALUAN-EMBARCADERO RD. 0.550 -
0.550 - - -
0.550
186 NAVALUAN EAST RD. 0.400 -
0.400 - - -
0.400
187 NAVALUAN-OSIEM RD. 0.720 -
0.720 - - -
0.720
188 LUIS DE VERA RD. 0.600 -
0.600 - - -
0.600
189 NAVALUAN CENTRAL ST. 0.350 -
0.350 - - -
0.350
190 G. RIVO RD. 0.380 -
0.380 - - -
0.380
191 AMADO LOPEZ RD. 0.250 -
0.250 - - -
0.250
192 TOMAS TADEO RD. 0.800 -
0.800 - - -
0.800
193 VISPERAS RD. 0.100 -
0.100 0.070 -
0.070
0.170
194 RIVERSIDE RD. 0.240 -
0.240 - - -
0.240
195 SITIO CAPALDUA RD. 0.175 -
0.175 0.350 -
0.350
0.525
4.565 -
4.565 0.420 -
0.420
4.985
Brgy. NIBALIW
196 NIBALIW ROAD 0.650 -
0.650 - - -
0.650
197 NIBALIW EXT. RD. 0.430 -
0.430 - - -
0.430
198 BIAGTAN RD. 0.260 -
0.260 - - -
0.260
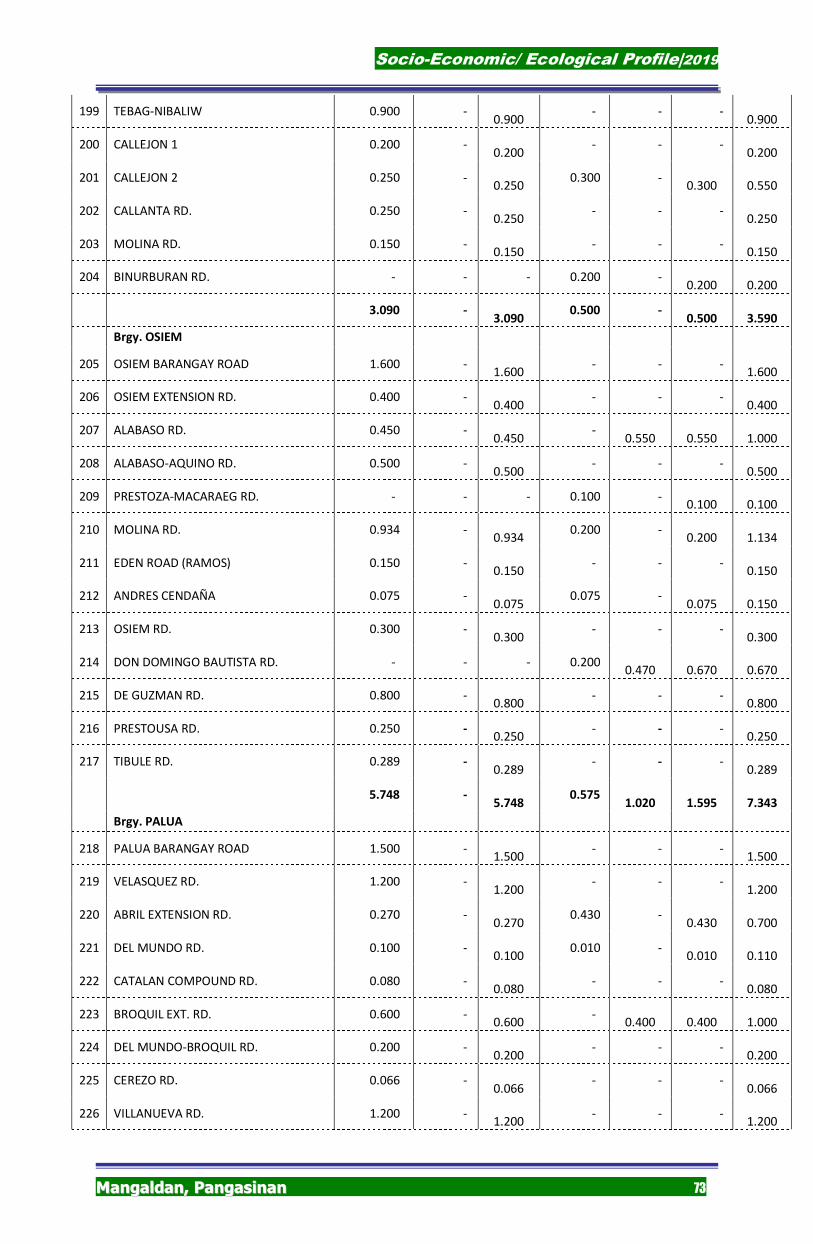
Socio-Economic/ Ecological Profile|2019
MMaannggaallddaann,, PPaannggaassiinnaann 73
199 TEBAG-NIBALIW 0.900 -
0.900 - - -
0.900
200 CALLEJON 1 0.200 -
0.200 - - -
0.200
201 CALLEJON 2 0.250 -
0.250 0.300 -
0.300
0.550
202 CALLANTA RD. 0.250 -
0.250 - - -
0.250
203 MOLINA RD. 0.150 -
0.150 - - -
0.150
204 BINURBURAN RD. - - - 0.200 -
0.200
0.200
3.090 -
3.090 0.500 -
0.500
3.590
Brgy. OSIEM
205 OSIEM BARANGAY ROAD 1.600 -
1.600 - - -
1.600
206 OSIEM EXTENSION RD. 0.400 -
0.400 - - -
0.400
207 ALABASO RD. 0.450 -
0.450 -
0.550
0.550
1.000
208 ALABASO-AQUINO RD. 0.500 -
0.500 - - -
0.500
209 PRESTOZA-MACARAEG RD. - - - 0.100 -
0.100
0.100
210 MOLINA RD. 0.934 -
0.934 0.200 -
0.200
1.134
211 EDEN ROAD (RAMOS) 0.150 -
0.150 - - -
0.150
212 ANDRES CENDAÑA 0.075 -
0.075 0.075 -
0.075
0.150
213 OSIEM RD. 0.300 -
0.300 - - -
0.300
214 DON DOMINGO BAUTISTA RD. - - - 0.200
0.470
0.670
0.670
215 DE GUZMAN RD. 0.800 -
0.800 - - -
0.800
216 PRESTOUSA RD. 0.250 -
0.250 - - -
0.250
217 TIBULE RD. 0.289 -
0.289 - - -
0.289
5.748 -
5.748 0.575
1.020
1.595
7.343
Brgy. PALUA
218 PALUA BARANGAY ROAD 1.500 -
1.500 - - -
1.500
219 VELASQUEZ RD. 1.200 -
1.200 - - -
1.200
220 ABRIL EXTENSION RD. 0.270 -
0.270 0.430 -
0.430
0.700
221 DEL MUNDO RD. 0.100 -
0.100 0.010 -
0.010
0.110
222 CATALAN COMPOUND RD. 0.080 -
0.080 - - -
0.080
223 BROQUIL EXT. RD. 0.600 -
0.600 -
0.400
0.400
1.000
224 DEL MUNDO-BROQUIL RD. 0.200 -
0.200 - - -
0.200
225 CEREZO RD. 0.066 -
0.066 - - -
0.066
226 VILLANUEVA RD. 1.200 -
1.200 - - -
1.200
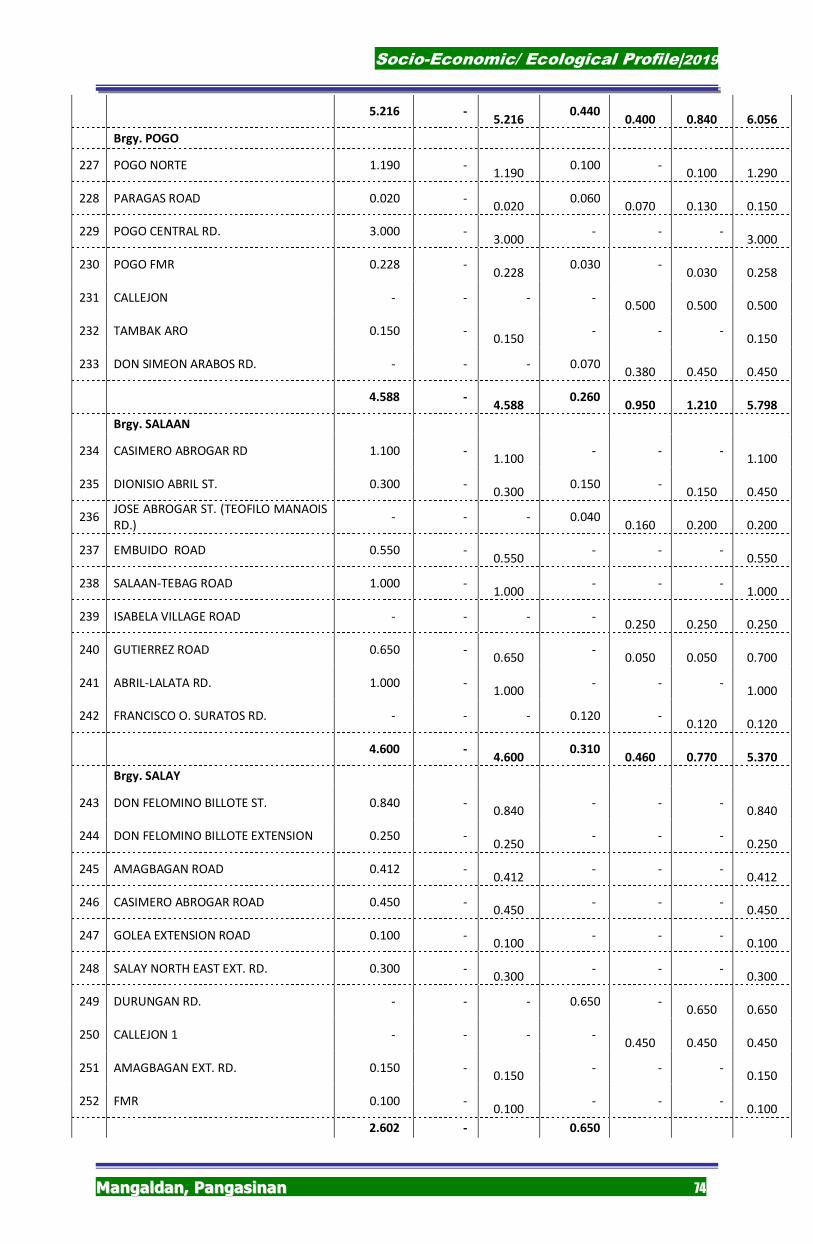
Socio-Economic/ Ecological Profile|2019
MMaannggaallddaann,, PPaannggaassiinnaann 74
5.216 -
5.216 0.440
0.400
0.840
6.056
Brgy. POGO
227 POGO NORTE 1.190 -
1.190 0.100 -
0.100
1.290
228 PARAGAS ROAD 0.020 -
0.020 0.060
0.070
0.130
0.150
229 POGO CENTRAL RD. 3.000 -
3.000 - - -
3.000
230 POGO FMR 0.228 -
0.228 0.030 -
0.030
0.258
231 CALLEJON - - - -
0.500
0.500
0.500
232 TAMBAK ARO 0.150 -
0.150 - - -
0.150
233 DON SIMEON ARABOS RD. - - - 0.070
0.380
0.450
0.450
4.588 -
4.588 0.260
0.950
1.210
5.798
Brgy. SALAAN
234 CASIMERO ABROGAR RD 1.100 -
1.100 - - -
1.100
235 DIONISIO ABRIL ST. 0.300 -
0.300 0.150 -
0.150
0.450
236 JOSE ABROGAR ST. (TEOFILO MANAOIS RD.)
- - - 0.040
0.160
0.200
0.200
237 EMBUIDO ROAD 0.550 -
0.550 - - -
0.550
238 SALAAN-TEBAG ROAD 1.000 -
1.000 - - -
1.000
239 ISABELA VILLAGE ROAD - - - -
0.250
0.250
0.250
240 GUTIERREZ ROAD 0.650 -
0.650 -
0.050
0.050
0.700
241 ABRIL-LALATA RD. 1.000 -
1.000 - - -
1.000
242 FRANCISCO O. SURATOS RD. - - - 0.120 -
0.120
0.120
4.600 -
4.600 0.310
0.460
0.770
5.370
Brgy. SALAY
243 DON FELOMINO BILLOTE ST. 0.840 -
0.840 - - -
0.840
244 DON FELOMINO BILLOTE EXTENSION 0.250 -
0.250 - - -
0.250
245 AMAGBAGAN ROAD 0.412 -
0.412 - - -
0.412
246 CASIMERO ABROGAR ROAD 0.450 -
0.450 - - -
0.450
247 GOLEA EXTENSION ROAD 0.100 -
0.100 - - -
0.100
248 SALAY NORTH EAST EXT. RD. 0.300 -
0.300 - - -
0.300
249 DURUNGAN RD. - - - 0.650 -
0.650
0.650
250 CALLEJON 1 - - - -
0.450
0.450
0.450
251 AMAGBAGAN EXT. RD. 0.150 -
0.150 - - -
0.150
252 FMR 0.100 -
0.100 - - -
0.100
2.602 - 0.650
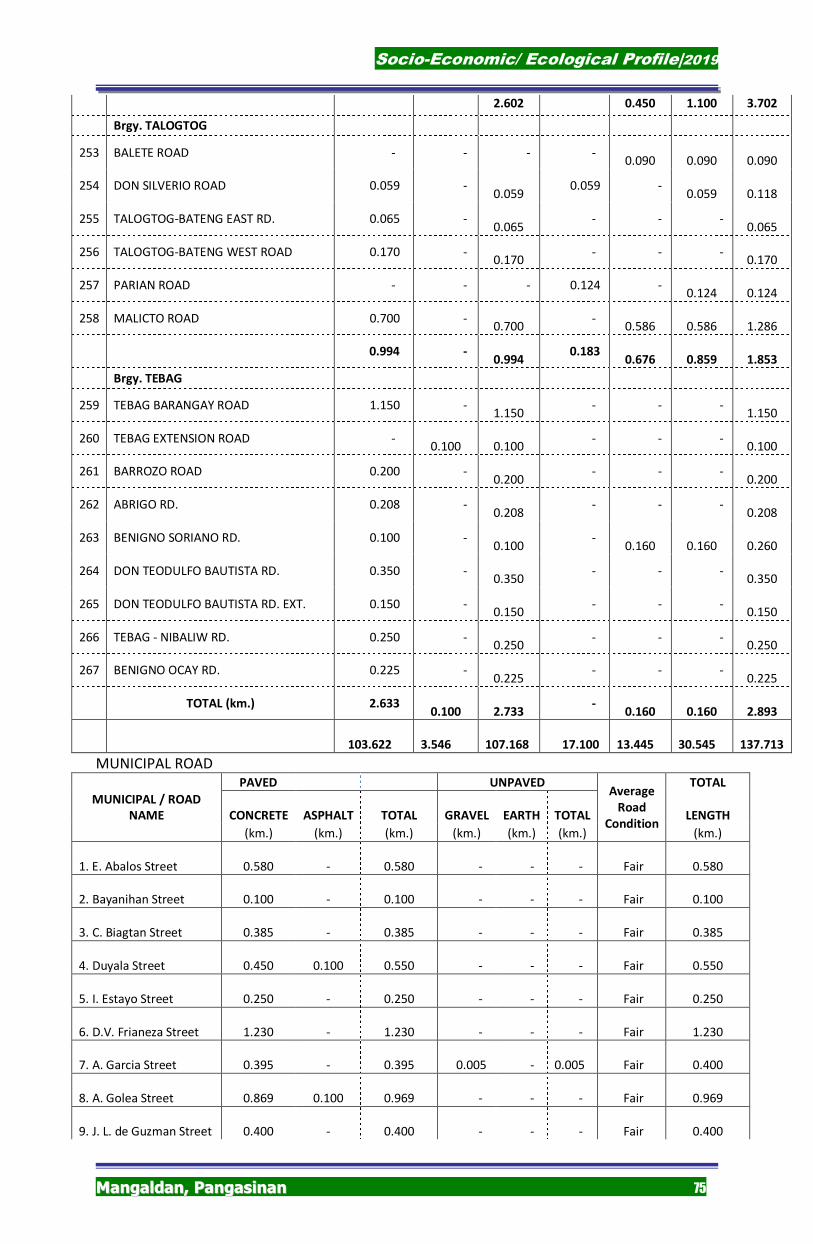
Socio-Economic/ Ecological Profile|2019
MMaannggaallddaann,, PPaannggaassiinnaann 75
2.602 0.450 1.100 3.702
Brgy. TALOGTOG
253 BALETE ROAD - - - -
0.090
0.090
0.090
254 DON SILVERIO ROAD 0.059 -
0.059 0.059 -
0.059
0.118
255 TALOGTOG-BATENG EAST RD. 0.065 -
0.065 - - -
0.065
256 TALOGTOG-BATENG WEST ROAD 0.170 -
0.170 - - -
0.170
257 PARIAN ROAD - - - 0.124 -
0.124
0.124
258 MALICTO ROAD 0.700 -
0.700 -
0.586
0.586
1.286
0.994 -
0.994 0.183
0.676
0.859
1.853
Brgy. TEBAG
259 TEBAG BARANGAY ROAD 1.150 -
1.150 - - -
1.150
260 TEBAG EXTENSION ROAD -
0.100
0.100 - - -
0.100
261 BARROZO ROAD 0.200 -
0.200 - - -
0.200
262 ABRIGO RD. 0.208 -
0.208 - - -
0.208
263 BENIGNO SORIANO RD. 0.100 -
0.100 -
0.160
0.160
0.260
264 DON TEODULFO BAUTISTA RD. 0.350 -
0.350 - - -
0.350
265 DON TEODULFO BAUTISTA RD. EXT. 0.150 -
0.150 - - -
0.150
266 TEBAG - NIBALIW RD. 0.250 -
0.250 - - -
0.250
267 BENIGNO OCAY RD. 0.225 -
0.225 - - -
0.225
TOTAL (km.) 2.633
0.100
2.733 -
0.160
0.160
2.893
103.622
3.546
107.168 17.100
13.445
30.545
137.713
MUNICIPAL ROAD PAVED UNPAVED
Average
Road
Condition
TOTAL
MUNICIPAL / ROAD
NAME CONCRETE ASPHALT TOTAL GRAVEL EARTH TOTAL LENGTH
(km.) (km.) (km.) (km.) (km.) (km.) (km.)
1. E. Abalos Street
0.580 -
0.580 - - - Fair
0.580
2. Bayanihan Street
0.100 -
0.100 - - - Fair
0.100
3. C. Biagtan Street
0.385 -
0.385 - - - Fair
0.385
4. Duyala Street
0.450
0.100
0.550 - - - Fair
0.550
5. I. Estayo Street
0.250 -
0.250 - - - Fair
0.250
6. D.V. Frianeza Street
1.230 -
1.230 - - - Fair
1.230
7. A. Garcia Street
0.395 -
0.395 0.005 -
0.005 Fair
0.400
8. A. Golea Street
0.869
0.100
0.969 - - - Fair
0.969
9. J. L. de Guzman Street
0.400 -
0.400 - - - Fair
0.400
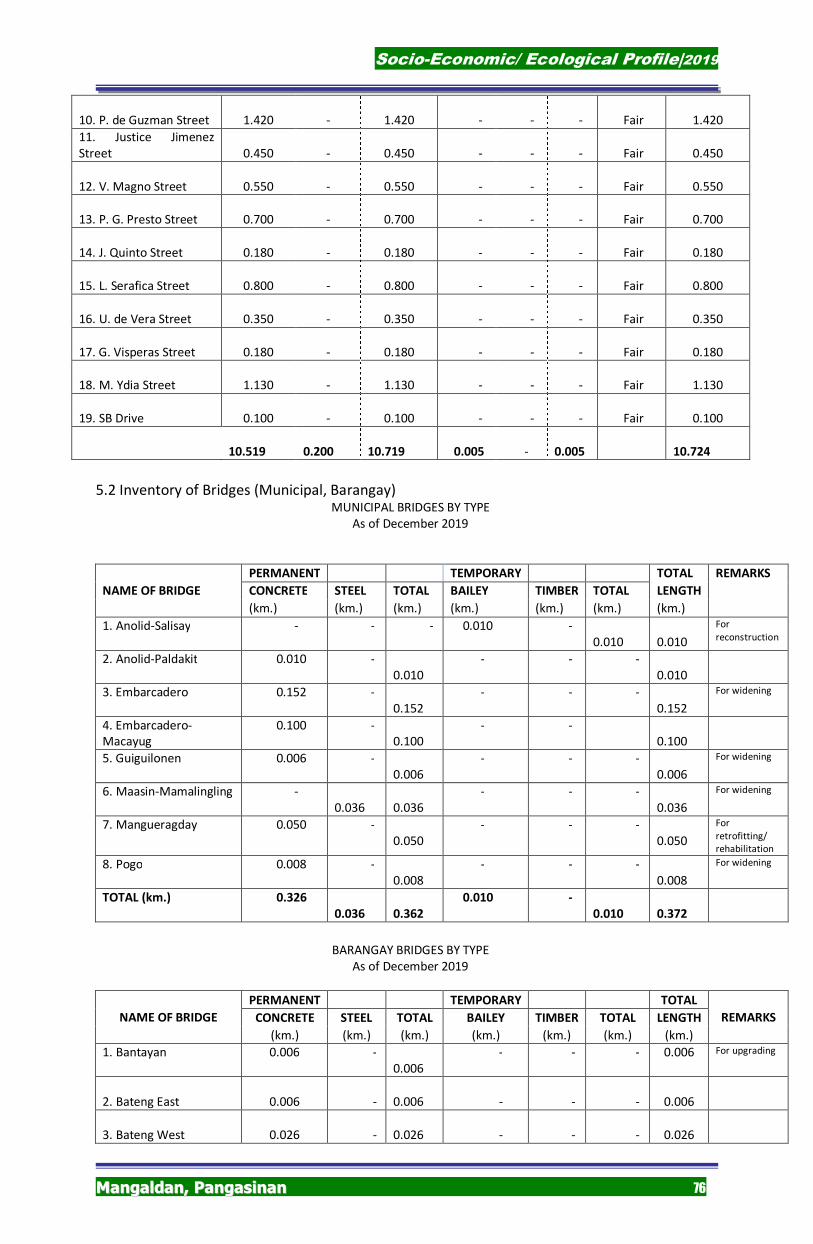
Socio-Economic/ Ecological Profile|2019
MMaannggaallddaann,, PPaannggaassiinnaann 76
10. P. de Guzman Street
1.420 -
1.420 - - - Fair
1.420
11. Justice Jimenez Street
0.450
-
0.450 - - - Fair
0.450
12. V. Magno Street
0.550 -
0.550 - - - Fair
0.550
13. P. G. Presto Street
0.700 -
0.700 - - - Fair
0.700
14. J. Quinto Street
0.180 -
0.180 - - - Fair
0.180
15. L. Serafica Street
0.800 -
0.800 - - - Fair
0.800
16. U. de Vera Street
0.350 -
0.350 - - - Fair
0.350
17. G. Visperas Street
0.180 -
0.180 - - - Fair
0.180
18. M. Ydia Street
1.130 -
1.130 - - - Fair
1.130
19. SB Drive
0.100 -
0.100 - - - Fair
0.100
10.519
0.200
10.719 0.005 -
0.005
10.724
5.2 Inventory of Bridges (Municipal, Barangay) MUNICIPAL BRIDGES BY TYPE
As of December 2019
PERMANENT TEMPORARY TOTAL REMARKS
NAME OF BRIDGE CONCRETE STEEL TOTAL BAILEY TIMBER TOTAL LENGTH
(km.) (km.) (km.) (km.) (km.) (km.) (km.)
1. Anolid-Salisay - - - 0.010 - 0.010
0.010
For
reconstruction
2. Anolid-Paldakit 0.010 - 0.010
- - - 0.010
3. Embarcadero 0.152 - 0.152
- - - 0.152
For widening
4. Embarcadero-Macayug
0.100 - 0.100
- - 0.100
5. Guiguilonen 0.006 - 0.006
- - - 0.006
For widening
6. Maasin-Mamalingling - 0.036
0.036
- - - 0.036
For widening
7. Mangueragday 0.050 - 0.050
- - - 0.050
For
retrofitting/ rehabilitation
8. Pogo 0.008 - 0.008
- - - 0.008
For widening
TOTAL (km.) 0.326
0.036
0.362
0.010 -
0.010
0.372
BARANGAY BRIDGES BY TYPE
As of December 2019
PERMANENT TEMPORARY TOTAL
REMARKS NAME OF BRIDGE CONCRETE STEEL TOTAL BAILEY TIMBER TOTAL LENGTH
(km.) (km.) (km.) (km.) (km.) (km.) (km.)
1. Bantayan 0.006 - 0.006
- - - 0.006 For upgrading
2. Bateng East 0.006 - 0.006 - - - 0.006
3. Bateng West 0.026 - 0.026 - - - 0.026
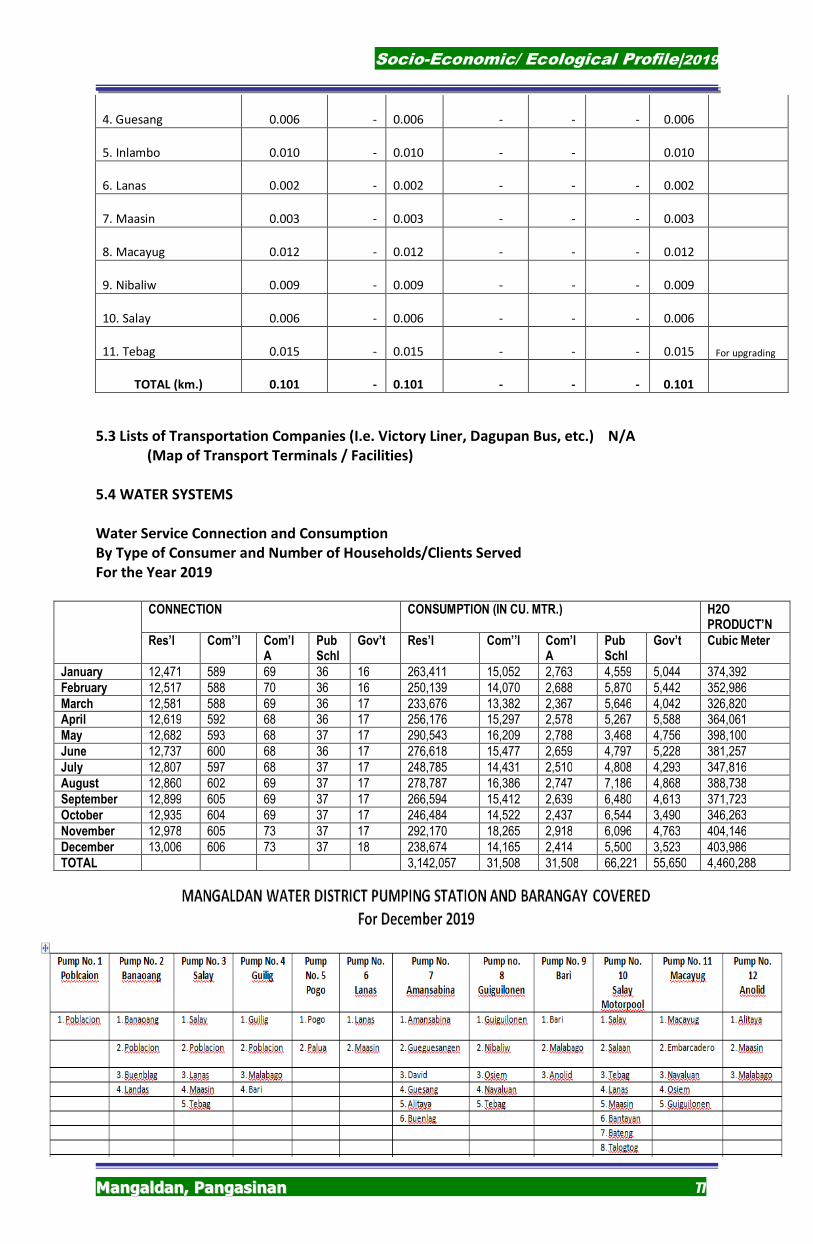
Socio-Economic/ Ecological Profile|2019
MMaannggaallddaann,, PPaannggaassiinnaann 77
4. Guesang 0.006 - 0.006 - - - 0.006
5. Inlambo 0.010 - 0.010 - - 0.010
6. Lanas 0.002 - 0.002 - - - 0.002
7. Maasin 0.003 - 0.003 - - - 0.003
8. Macayug 0.012 - 0.012 - - - 0.012
9. Nibaliw 0.009 - 0.009 - - - 0.009
10. Salay 0.006 - 0.006 - - - 0.006
11. Tebag 0.015 - 0.015 - - - 0.015 For upgrading
TOTAL (km.) 0.101 -
0.101 - - - 0.101
5.3 Lists of Transportation Companies (I.e. Victory Liner, Dagupan Bus, etc.) N/A
(Map of Transport Terminals / Facilities)
5.4 WATER SYSTEMS
Water Service Connection and Consumption
By Type of Consumer and Number of Households/Clients Served
For the Year 2019
CONNECTION CONSUMPTION (IN CU. MTR.) H2O
PRODUCT’N
Res’l Com’’l Com’l A
Pub Schl
Gov’t Res’l Com’’l Com’l A
Pub Schl
Gov’t Cubic Meter
January 12,471 589 69 36 16 263,411 15,052 2,763 4,559 5,044 374,392
February 12,517 588 70 36 16 250,139 14,070 2,688 5,870 5,442 352,986
March 12,581 588 69 36 17 233,676 13,382 2,367 5,646 4,042 326,820 April 12,619 592 68 36 17 256,176 15,297 2,578 5,267 5,588 364,061
May 12,682 593 68 37 17 290,543 16,209 2,788 3,468 4,756 398,100
June 12,737 600 68 36 17 276,618 15,477 2,659 4,797 5,228 381,257
July 12,807 597 68 37 17 248,785 14,431 2,510 4,808 4,293 347,816
August 12,860 602 69 37 17 278,787 16,386 2,747 7,186 4,868 388,738
September 12,899 605 69 37 17 266,594 15,412 2,639 6,480 4,613 371,723
October 12,935 604 69 37 17 246,484 14,522 2,437 6,544 3,490 346,263
November 12,978 605 73 37 17 292,170 18,265 2,918 6,096 4,763 404,146
December 13,006 606 73 37 18 238,674 14,165 2,414 5,500 3,523 403,986
TOTAL 3,142,057 31,508 31,508 66,221 55,650 4,460,288
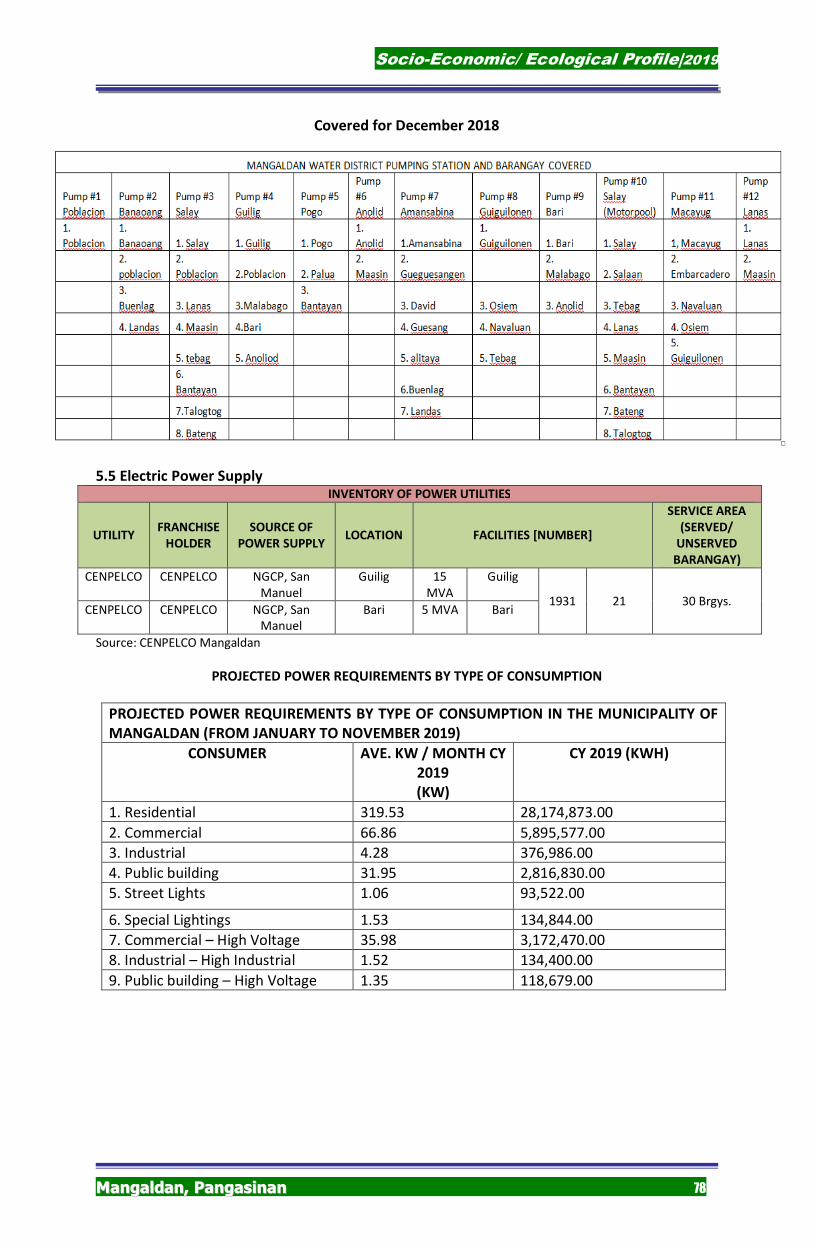
Socio-Economic/ Ecological Profile|2019
MMaannggaallddaann,, PPaannggaassiinnaann 78
Covered for December 2018
5.5 Electric Power Supply INVENTORY OF POWER UTILITIES
UTILITY FRANCHISE
HOLDER
SOURCE OF
POWER SUPPLY LOCATION FACILITIES [NUMBER]
SERVICE AREA
(SERVED/
UNSERVED
BARANGAY)
CENPELCO CENPELCO NGCP, San Manuel
Guilig 15 MVA
Guilig
1931 21 30 Brgys. CENPELCO CENPELCO NGCP, San
Manuel Bari 5 MVA Bari
Source: CENPELCO Mangaldan
PROJECTED POWER REQUIREMENTS BY TYPE OF CONSUMPTION
PROJECTED POWER REQUIREMENTS BY TYPE OF CONSUMPTION IN THE MUNICIPALITY OF
MANGALDAN (FROM JANUARY TO NOVEMBER 2019)
CONSUMER AVE. KW / MONTH CY
2019
(KW)
CY 2019 (KWH)
1. Residential 319.53 28,174,873.00
2. Commercial 66.86 5,895,577.00
3. Industrial 4.28 376,986.00
4. Public building 31.95 2,816,830.00
5. Street Lights 1.06 93,522.00
6. Special Lightings 1.53 134,844.00
7. Commercial – High Voltage 35.98 3,172,470.00
8. Industrial – High Industrial 1.52 134,400.00
9. Public building – High Voltage 1.35 118,679.00
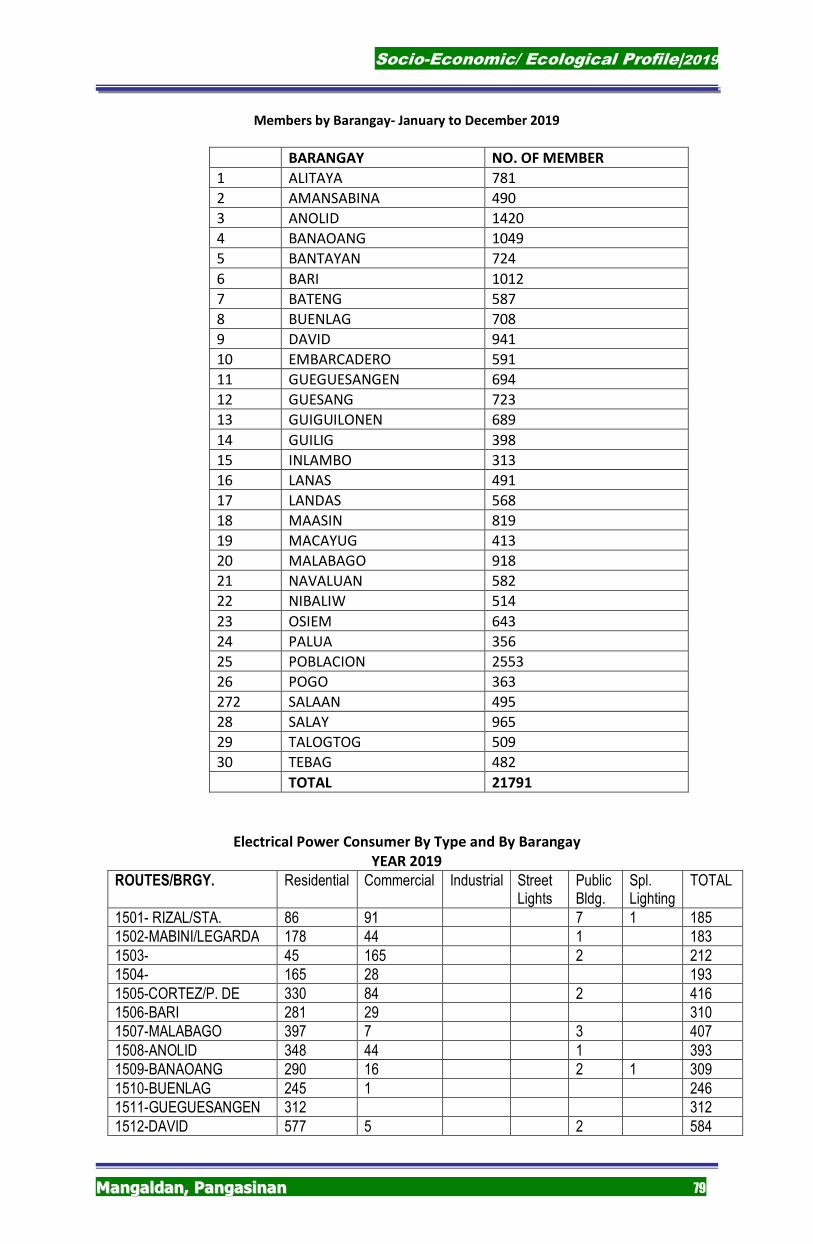
Socio-Economic/ Ecological Profile|2019
MMaannggaallddaann,, PPaannggaassiinnaann 79
Members by Barangay- January to December 2019
BARANGAY NO. OF MEMBER
1 ALITAYA 781
2 AMANSABINA 490
3 ANOLID 1420
4 BANAOANG 1049
5 BANTAYAN 724
6 BARI 1012
7 BATENG 587
8 BUENLAG 708
9 DAVID 941
10 EMBARCADERO 591
11 GUEGUESANGEN 694
12 GUESANG 723
13 GUIGUILONEN 689
14 GUILIG 398
15 INLAMBO 313
16 LANAS 491
17 LANDAS 568
18 MAASIN 819
19 MACAYUG 413
20 MALABAGO 918
21 NAVALUAN 582
22 NIBALIW 514
23 OSIEM 643
24 PALUA 356
25 POBLACION 2553
26 POGO 363
272 SALAAN 495
28 SALAY 965
29 TALOGTOG 509
30 TEBAG 482
TOTAL 21791
Electrical Power Consumer By Type and By Barangay
YEAR 2019
ROUTES/BRGY. Residential Commercial Industrial Street Lights
Public Bldg.
Spl. Lighting
TOTAL
1501- RIZAL/STA. 86 91 7 1 185
1502-MABINI/LEGARDA 178 44 1 183
1503- 45 165 2 212
1504- 165 28 193
1505-CORTEZ/P. DE 330 84 2 416
1506-BARI 281 29 310
1507-MALABAGO 397 7 3 407
1508-ANOLID 348 44 1 393
1509-BANAOANG 290 16 2 1 309
1510-BUENLAG 245 1 246
1511-GUEGUESANGEN 312 312
1512-DAVID 577 5 2 584
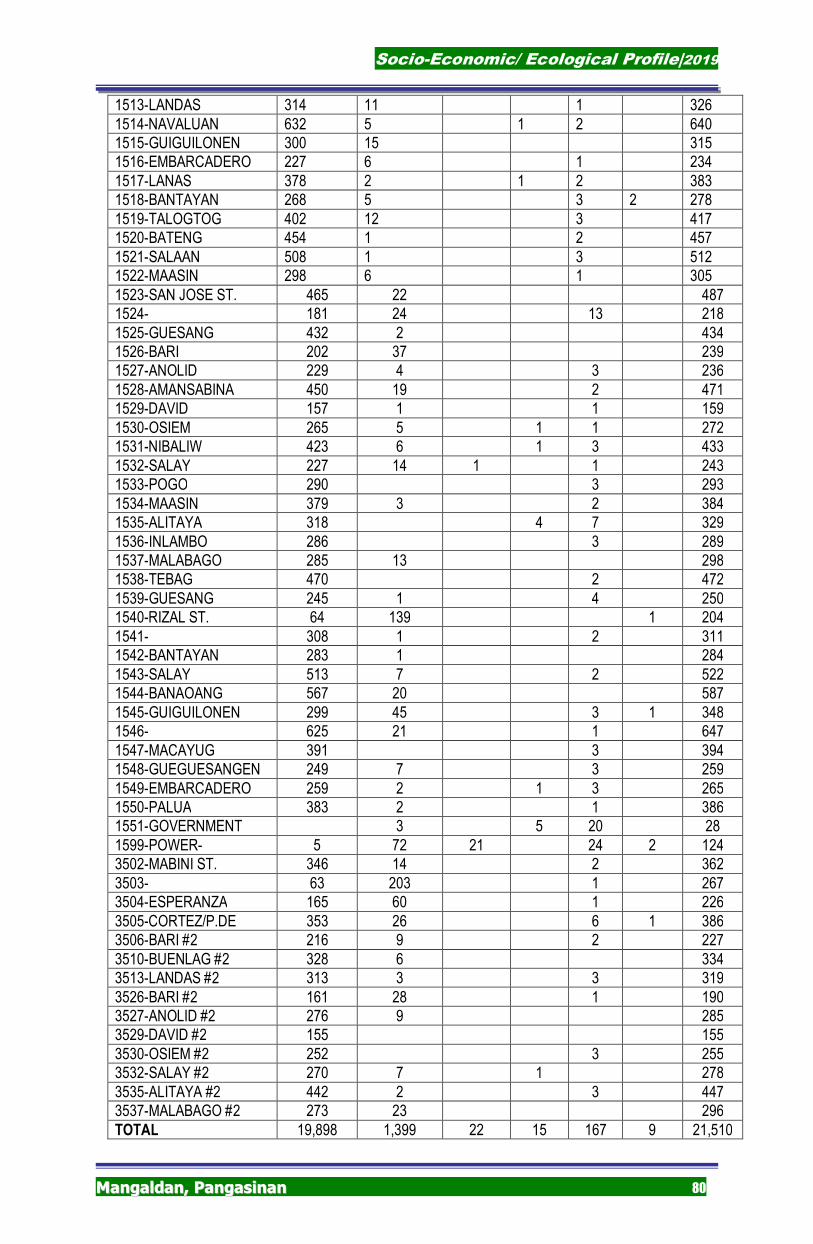
Socio-Economic/ Ecological Profile|2019
MMaannggaallddaann,, PPaannggaassiinnaann 80
1513-LANDAS 314 11 1 326
1514-NAVALUAN 632 5 1 2 640
1515-GUIGUILONEN 300 15 315
1516-EMBARCADERO 227 6 1 234
1517-LANAS 378 2 1 2 383
1518-BANTAYAN 268 5 3 2 278
1519-TALOGTOG 402 12 3 417
1520-BATENG 454 1 2 457
1521-SALAAN 508 1 3 512
1522-MAASIN 298 6 1 305
1523-SAN JOSE ST. 465 22 487
1524- 181 24 13 218
1525-GUESANG 432 2 434
1526-BARI 202 37 239
1527-ANOLID 229 4 3 236
1528-AMANSABINA 450 19 2 471
1529-DAVID 157 1 1 159
1530-OSIEM 265 5 1 1 272
1531-NIBALIW 423 6 1 3 433
1532-SALAY 227 14 1 1 243
1533-POGO 290 3 293
1534-MAASIN 379 3 2 384
1535-ALITAYA 318 4 7 329
1536-INLAMBO 286 3 289
1537-MALABAGO 285 13 298
1538-TEBAG 470 2 472
1539-GUESANG 245 1 4 250
1540-RIZAL ST. 64 139 1 204
1541- 308 1 2 311
1542-BANTAYAN 283 1 284
1543-SALAY 513 7 2 522
1544-BANAOANG 567 20 587
1545-GUIGUILONEN 299 45 3 1 348
1546- 625 21 1 647
1547-MACAYUG 391 3 394
1548-GUEGUESANGEN 249 7 3 259
1549-EMBARCADERO 259 2 1 3 265
1550-PALUA 383 2 1 386
1551-GOVERNMENT 3 5 20 28
1599-POWER- 5 72 21 24 2 124
3502-MABINI ST. 346 14 2 362
3503- 63 203 1 267
3504-ESPERANZA 165 60 1 226
3505-CORTEZ/P.DE 353 26 6 1 386
3506-BARI #2 216 9 2 227
3510-BUENLAG #2 328 6 334
3513-LANDAS #2 313 3 3 319
3526-BARI #2 161 28 1 190
3527-ANOLID #2 276 9 285
3529-DAVID #2 155 155
3530-OSIEM #2 252 3 255
3532-SALAY #2 270 7 1 278
3535-ALITAYA #2 442 2 3 447
3537-MALABAGO #2 273 23 296
TOTAL 19,898 1,399 22 15 167 9 21,510
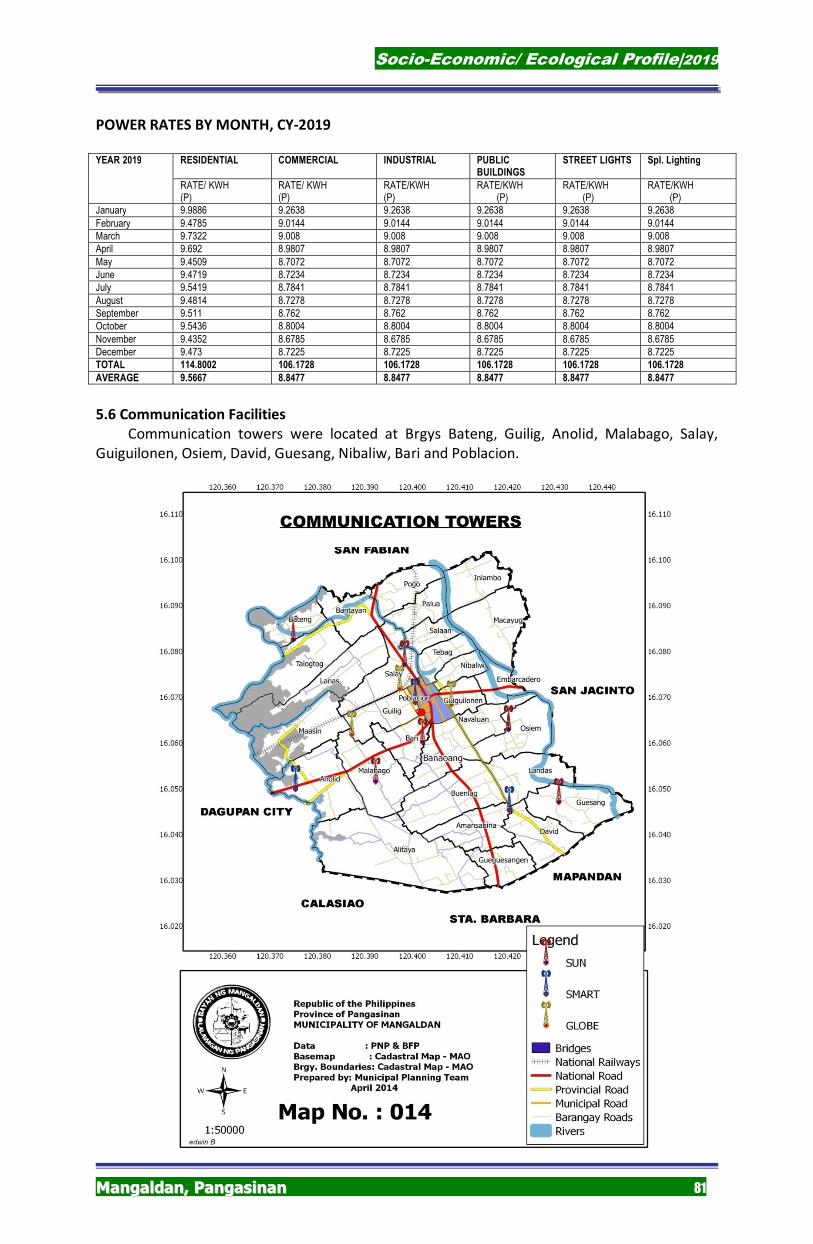
Socio-Economic/ Ecological Profile|2019
MMaannggaallddaann,, PPaannggaassiinnaann 81
POWER RATES BY MONTH, CY-2019
YEAR 2019 RESIDENTIAL COMMERCIAL INDUSTRIAL PUBLIC
BUILDINGS STREET LIGHTS Spl. Lighting
RATE/ KWH (P)
RATE/ KWH (P)
RATE/KWH (P)
RATE/KWH (P)
RATE/KWH (P)
RATE/KWH (P)
January 9.9886 9.2638 9.2638 9.2638 9.2638 9.2638
February 9.4785 9.0144 9.0144 9.0144 9.0144 9.0144
March 9.7322 9.008 9.008 9.008 9.008 9.008
April 9.692 8.9807 8.9807 8.9807 8.9807 8.9807
May 9.4509 8.7072 8.7072 8.7072 8.7072 8.7072
June 9.4719 8.7234 8.7234 8.7234 8.7234 8.7234
July 9.5419 8.7841 8.7841 8.7841 8.7841 8.7841
August 9.4814 8.7278 8.7278 8.7278 8.7278 8.7278
September 9.511 8.762 8.762 8.762 8.762 8.762
October 9.5436 8.8004 8.8004 8.8004 8.8004 8.8004
November 9.4352 8.6785 8.6785 8.6785 8.6785 8.6785
December 9.473 8.7225 8.7225 8.7225 8.7225 8.7225
TOTAL 114.8002 106.1728 106.1728 106.1728 106.1728 106.1728
AVERAGE 9.5667 8.8477 8.8477 8.8477 8.8477 8.8477
5.6 Communication Facilities
Communication towers were located at Brgys Bateng, Guilig, Anolid, Malabago, Salay,
Guiguilonen, Osiem, David, Guesang, Nibaliw, Bari and Poblacion.
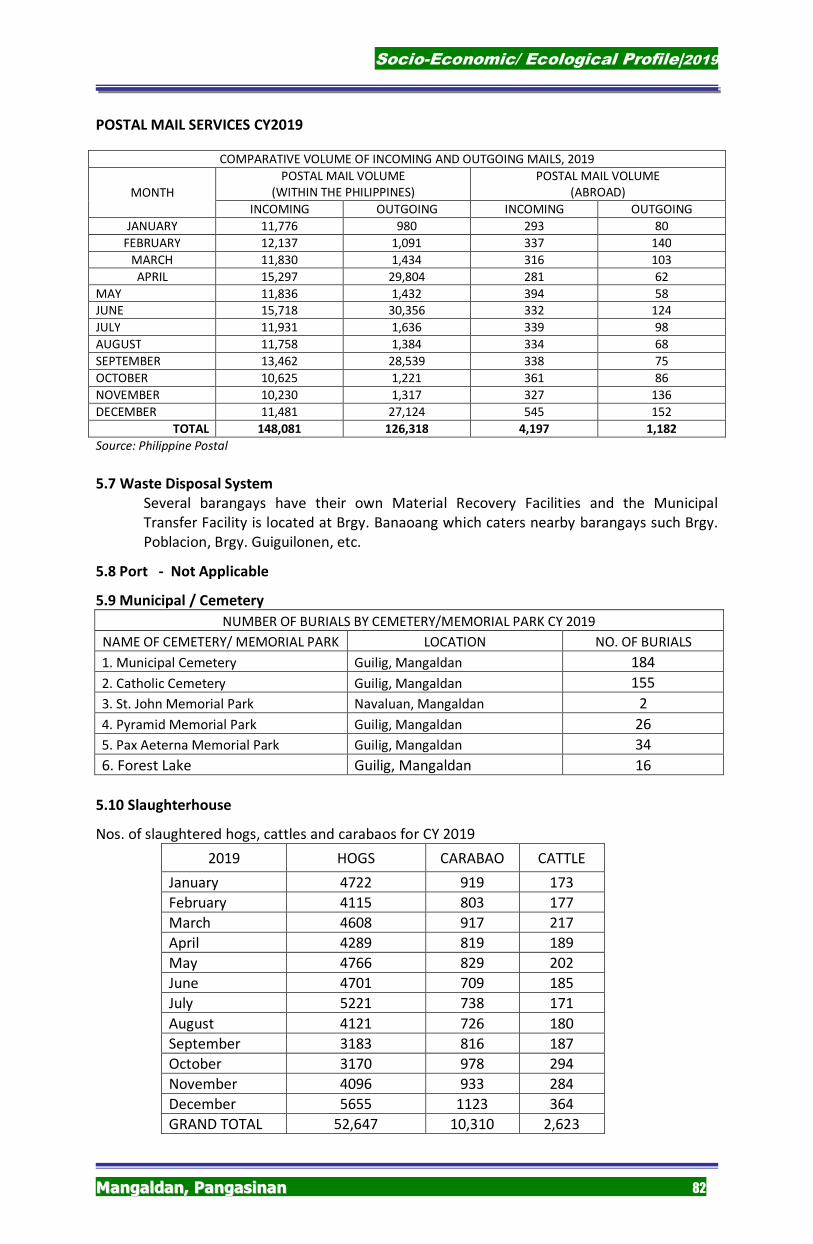
Socio-Economic/ Ecological Profile|2019
MMaannggaallddaann,, PPaannggaassiinnaann 82
POSTAL MAIL SERVICES CY2019
COMPARATIVE VOLUME OF INCOMING AND OUTGOING MAILS, 2019
MONTH
POSTAL MAIL VOLUME (WITHIN THE PHILIPPINES)
POSTAL MAIL VOLUME (ABROAD)
INCOMING OUTGOING INCOMING OUTGOING
JANUARY 11,776 980 293 80
FEBRUARY 12,137 1,091 337 140
MARCH 11,830 1,434 316 103
APRIL 15,297 29,804 281 62
MAY 11,836 1,432 394 58
JUNE 15,718 30,356 332 124
JULY 11,931 1,636 339 98
AUGUST 11,758 1,384 334 68
SEPTEMBER 13,462 28,539 338 75
OCTOBER 10,625 1,221 361 86
NOVEMBER 10,230 1,317 327 136
DECEMBER 11,481 27,124 545 152
TOTAL 148,081 126,318 4,197 1,182
Source: Philippine Postal
5.7 Waste Disposal System
Several barangays have their own Material Recovery Facilities and the Municipal
Transfer Facility is located at Brgy. Banaoang which caters nearby barangays such Brgy.
Poblacion, Brgy. Guiguilonen, etc.
5.8 Port - Not Applicable
5.9 Municipal / Cemetery
NUMBER OF BURIALS BY CEMETERY/MEMORIAL PARK CY 2019
NAME OF CEMETERY/ MEMORIAL PARK LOCATION NO. OF BURIALS
1. Municipal Cemetery Guilig, Mangaldan 184
2. Catholic Cemetery Guilig, Mangaldan 155
3. St. John Memorial Park Navaluan, Mangaldan 2
4. Pyramid Memorial Park Guilig, Mangaldan 26
5. Pax Aeterna Memorial Park Guilig, Mangaldan 34
6. Forest Lake Guilig, Mangaldan 16
5.10 Slaughterhouse
Nos. of slaughtered hogs, cattles and carabaos for CY 2019
2019 HOGS CARABAO CATTLE
January 4722 919 173
February 4115 803 177
March 4608 917 217
April 4289 819 189
May 4766 829 202
June 4701 709 185
July 5221 738 171
August 4121 726 180
September 3183 816 187
October 3170 978 294
November 4096 933 284
December 5655 1123 364
GRAND TOTAL 52,647 10,310 2,623
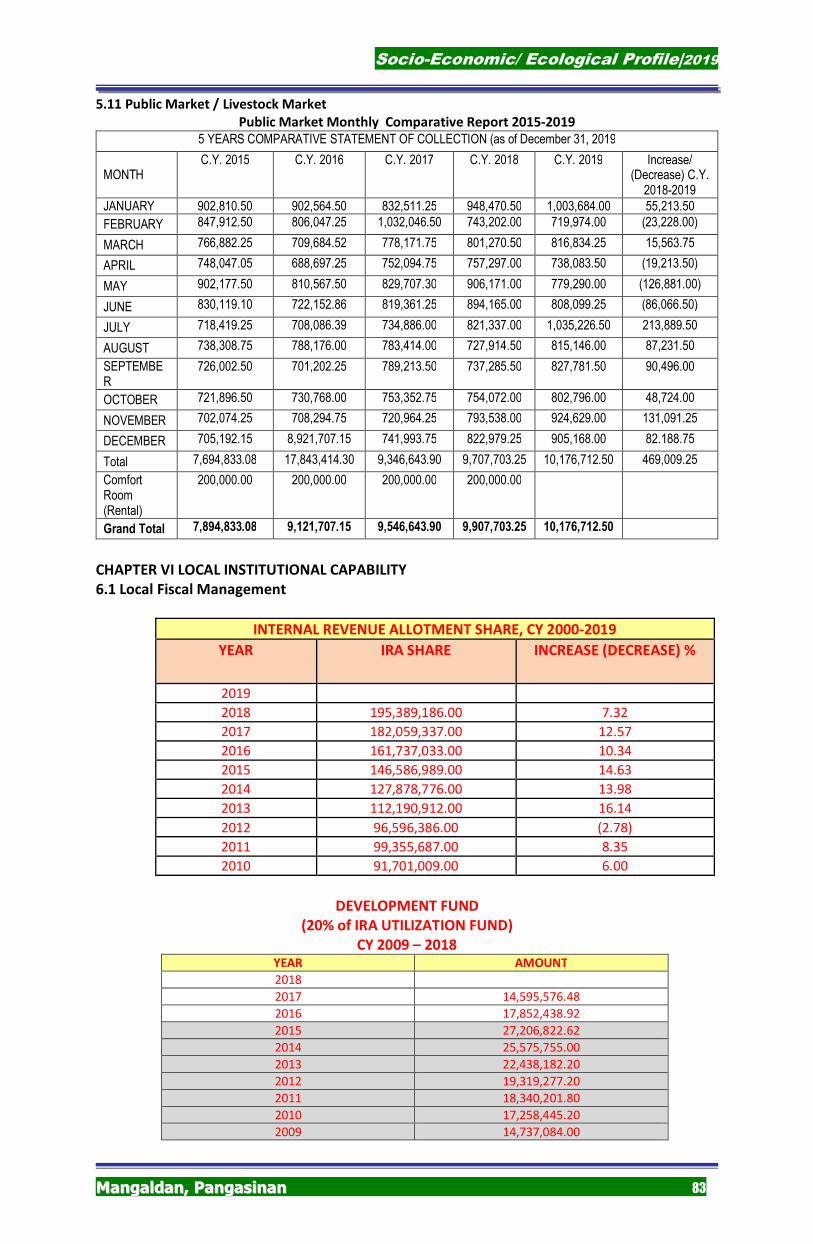
Socio-Economic/ Ecological Profile|2019
MMaannggaallddaann,, PPaannggaassiinnaann 83
5.11 Public Market / Livestock Market
Public Market Monthly Comparative Report 2015-2019
5 YEARS COMPARATIVE STATEMENT OF COLLECTION (as of December 31, 2019
MONTH C.Y. 2015 C.Y. 2016 C.Y. 2017 C.Y. 2018 C.Y. 2019 Increase/
(Decrease) C.Y. 2018-2019
JANUARY 902,810.50 902,564.50 832,511.25 948,470.50 1,003,684.00 55,213.50
FEBRUARY 847,912.50 806,047.25 1,032,046.50 743,202.00 719,974.00 (23,228.00)
MARCH 766,882.25 709,684.52 778,171.75 801,270.50 816,834.25 15,563.75
APRIL 748,047.05 688,697.25 752,094.75 757,297.00 738,083.50 (19,213.50)
MAY 902,177.50 810,567.50 829,707.30 906,171.00 779,290.00 (126,881.00)
JUNE 830,119.10 722,152.86 819,361.25 894,165.00 808,099.25 (86,066.50)
JULY 718,419.25 708,086.39 734,886.00 821,337.00 1,035,226.50 213,889.50
AUGUST 738,308.75 788,176.00 783,414.00 727,914.50 815,146.00 87,231.50
SEPTEMBER
726,002.50 701,202.25 789,213.50 737,285.50 827,781.50 90,496.00
OCTOBER 721,896.50 730,768.00 753,352.75 754,072.00 802,796.00 48,724.00
NOVEMBER 702,074.25 708,294.75 720,964.25 793,538.00 924,629.00 131,091.25
DECEMBER 705,192.15 8,921,707.15 741,993.75 822,979.25 905,168.00 82.188.75
Total 7,694,833.08 17,843,414.30 9,346,643.90 9,707,703.25 10,176,712.50 469,009.25
Comfort Room (Rental)
200,000.00 200,000.00 200,000.00 200,000.00
Grand Total 7,894,833.08 9,121,707.15 9,546,643.90 9,907,703.25 10,176,712.50
CHAPTER VI LOCAL INSTITUTIONAL CAPABILITY
6.1 Local Fiscal Management
INTERNAL REVENUE ALLOTMENT SHARE, CY 2000-2019
YEAR IRA SHARE INCREASE (DECREASE) %
2019
2018 195,389,186.00 7.32
2017 182,059,337.00 12.57
2016 161,737,033.00 10.34
2015 146,586,989.00 14.63
2014 127,878,776.00 13.98
2013 112,190,912.00 16.14
2012 96,596,386.00 (2.78)
2011 99,355,687.00 8.35
2010 91,701,009.00 6.00
DEVELOPMENT FUND
(20% of IRA UTILIZATION FUND)
CY 2009 – 2018 YEAR AMOUNT
2018
2017 14,595,576.48
2016 17,852,438.92
2015 27,206,822.62
2014 25,575,755.00
2013 22,438,182.20
2012 19,319,277.20
2011 18,340,201.80
2010 17,258,445.20
2009 14,737,084.00

Socio-Economic/ Ecological Profile|2019
MMaannggaallddaann,, PPaannggaassiinnaann 84
ANNUAL COMPARATIVE REPORT ON REALTY PROPERTY TAX COLLECTION, 2018-2019
COMPARATIVE REPORT OF TOTAL COLLECTIONS FOR BUILDING PERMIT & ANCILLARY PERMITS, ACCESSORY
PERMITS & OTHER ENGINEERING PERMIT FEES (P.D. 1096)
CY - 2018
CY – 2019 (As of December 31, 2019)
MONTH Building Permits
and Ancillary Accessory
Permits T O T A L Building Permits
and Ancillary Accessory
Permits T O T A L
Permits Fees (P.D. 1096)
Fees (P.D. 1096)
Permits Fees (P.D. 1096)
Fees (P.D. 1096)
January 141,037.83 124,295.00 265,332.83 241,308.49 308,448.55 549,757.04
February 237,305.01 14,883.20 252,188.21 301,147.25 58,149.26 359,296.51
March 192,567.29 3,362.00 195,929.29 344,065.78 63,752.25 407,818.03
April 312,386.17 1,381.00 313,767.17 173,105.50 1,978.00 175,083.50
May 285,184.29 0.00 285,184.29 273,516.75 2,313.75 275,830.50
June 262,720.17 0.00 262,720.17 309,008.25 0.00 309,008.25
July 234,809.69 0.00 234,809.69 342,702.76 0.00 342,702.76
August 198,692.86 0.00 198,692.86 212,318.51 1,039.70 213,358.21
September 172,133.39 0.00 172,133.36 284,625.90 0.00 284,625.90
October 368,260.31 0.00 368,260.31 269,902.80 0.00 269,902.80
November 167,992.51 0.00 167,992.51 393,068.94 0.00 393,068.94
December 125,536.89 0.00 125,536.89 92,581.49 0.00 92,581.49
Sub-Total 2,698,626.38 143,921.20 2,842,547.58 3,237,352.42 435,681.51 3,673,033.93
GRAND TOTAL 2,842,547.58
GRAND TOTAL 3,673,033.93
6.2 Local Government Structure
� LGU’s Organizational Structure
MONTHS 2018 2019 DIFFERENCE
January 1,261,706.52 1,025,706.52 (235,749.48)
February 684,998.05 898,293.15 216,295.10
March 1,531,586,38 1,922,074.20 390,487.82
April 308,354.06 188,067.22 (120,286.84)
May 146,232.08 227,018.64 80,786.56
June 110,126.90 155,947.38 45,820.48
July 108,222.25 225,736.14 117,513.89
August 140,133,36 210,458.66 70,325.30
September 142,787.04 344,188.98 201,401.94
October 160,676.16 113,502.64 (47,173.52)
November 131,836.40 237,860.76 106,024.36
December 400,299.34 666,682.42 266,383.08
TOTAL 5,123,958.54 6,215,787.23 1,091,828.69
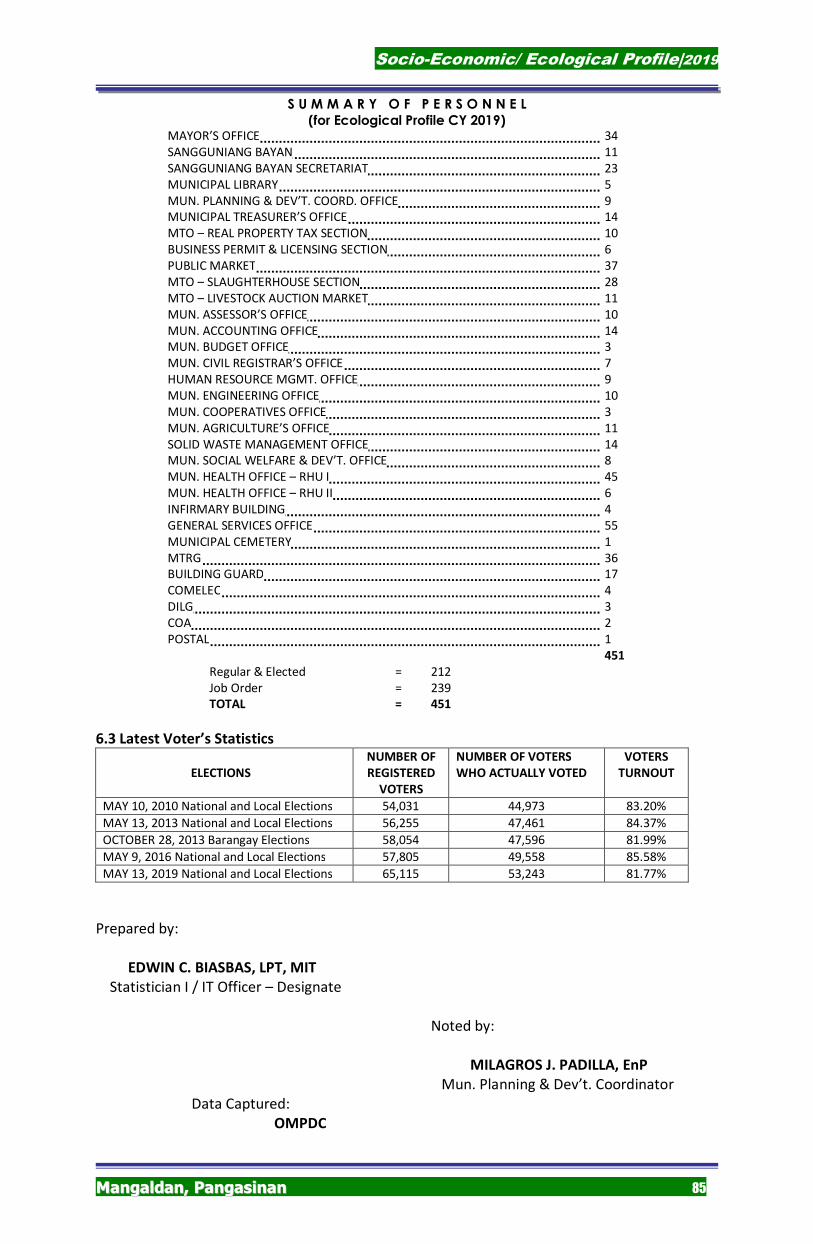
Socio-Economic/ Ecological Profile|2019
MMaannggaallddaann,, PPaannggaassiinnaann 85
S U M M A R Y O F P E R S O N N E L
(for Ecological Profile CY 2019) MAYOR’S OFFICE 34 SANGGUNIANG BAYAN 11 SANGGUNIANG BAYAN SECRETARIAT 23 MUNICIPAL LIBRARY 5 MUN. PLANNING & DEV’T. COORD. OFFICE 9 MUNICIPAL TREASURER’S OFFICE 14 MTO – REAL PROPERTY TAX SECTION 10 BUSINESS PERMIT & LICENSING SECTION 6 PUBLIC MARKET 37 MTO – SLAUGHTERHOUSE SECTION 28 MTO – LIVESTOCK AUCTION MARKET 11 MUN. ASSESSOR’S OFFICE 10 MUN. ACCOUNTING OFFICE 14 MUN. BUDGET OFFICE 3 MUN. CIVIL REGISTRAR’S OFFICE 7 HUMAN RESOURCE MGMT. OFFICE 9 MUN. ENGINEERING OFFICE 10 MUN. COOPERATIVES OFFICE 3 MUN. AGRICULTURE’S OFFICE 11 SOLID WASTE MANAGEMENT OFFICE 14 MUN. SOCIAL WELFARE & DEV’T. OFFICE 8 MUN. HEALTH OFFICE – RHU I 45 MUN. HEALTH OFFICE – RHU II 6 INFIRMARY BUILDING 4 GENERAL SERVICES OFFICE 55 MUNICIPAL CEMETERY 1 MTRG 36 BUILDING GUARD 17 COMELEC 4 DILG 3 COA 2 POSTAL 1 451
Regular & Elected = 212 Job Order = 239 TOTAL = 451
6.3 Latest Voter’s Statistics
ELECTIONS
NUMBER OF
REGISTERED
VOTERS
NUMBER OF VOTERS
WHO ACTUALLY VOTED
VOTERS
TURNOUT
MAY 10, 2010 National and Local Elections 54,031 44,973 83.20%
MAY 13, 2013 National and Local Elections 56,255 47,461 84.37%
OCTOBER 28, 2013 Barangay Elections 58,054 47,596 81.99%
MAY 9, 2016 National and Local Elections 57,805 49,558 85.58%
MAY 13, 2019 National and Local Elections 65,115 53,243 81.77%
Prepared by:
EDWIN C. BIASBAS, LPT, MIT
Statistician I / IT Officer – Designate
Noted by:
MILAGROS J. PADILLA, EnP
Mun. Planning & Dev’t. Coordinator
Data Captured:
OMPDC
Socio-Economic/ Ecological Profile|2019
MMaannggaallddaann,, PPaannggaassiinnaann 86