Socio-economic Survey Report Of Papua_Trawl fishery... · baseline household and biodata...
54
Gulf Of Papua Prawn Fishery- REBYC II CTI Project. Prepared by R. Unasi for National Fisheries Authority. P.O.Box 1313, c/Flat 5 Amukele Estates, June Valley, Nations Capital District Ph:+675 71122815, email: [email protected] Socio-economic Survey Report
Transcript of Socio-economic Survey Report Of Papua_Trawl fishery... · baseline household and biodata...

Gulf Of Papua Prawn Fishery- REBYC II CTI Project.
Prepared by R. Unasi for National Fisheries Authority.
P.O.Box 1313, c/Flat 5 Amukele Estates, June Valley, Nations Capital District Ph:+675 71122815, email: [email protected]
Socio-economic Survey Report
1 | P a g e i _ G o P R e p o r t _ 2 0 1 6
Table of Contents List of tables and figures…………………………………………………………….…………..2 Acknowledgement………………………………………………………………………………..3 Acronyms………………………………………………………………………………………....3 1.0 Abstract…………………………………………………………………………………..5 2.0 Introduction………………………………………………………………………….......7
o Gulf of Papua Prawn Fishery overview……………………………………………………………………………….7
o Types of trawl vessels and gear. ................................................................................................. 8
o National Prawn Fishery Economic Overview ........................................................................... 8
o Management-Monitoring, Control and Surveillance .............................................................. 12
3.0 Study Site andstakeholders………….……………………………………………..………13
o Crew on board prawn trawlers................................................................................................... 16
o Government and technical officers ........................................................................................... 16
4.0 Methodology………………..…………..………………………………………………….....................................................16
o Study Design ................................................................................................................................ 16
o Study Instruments/Questionnaires……………………………………………………….………………………………..…17
o Sample Size Selection................................................................................................................. 18
o Data Collection-Approach………………………………..………………………………………………………………………………………………..19
Enumerators……………………………………………………………………………………………………………………………..20
5.0 Results and Discussion……...……………………………………………...……………….Error! Bookmark not defined.
o Results-Stakeholder analyses…………………………………………………………………………………………………….21
o Persons per household ................................................................................................................ 23
o Age class of respondents………………………………………………………………………..…………………………………24
o Sex ratio ......................................................................................................................................... 24
o Education level of community respondents……………………………………………………………………..……….25
o Access to education facility……………………………………………………………………………………………………….26
o Christian church affiliation of respondents……………………………………………………………………………….27
o Income sources of GoP community respondents………………………………………………………………………27
o Bycatch/Discards use and value………………………………………………………………………………………………..28

2 | P a g e i _ G o P R e p o r t _ 2 0 1 6
o Income from bycatch sales/utilisation……….……………………………………………………………………………..29
o Species composition of bycatch/discards…………………..…………………………………..…31
o Stakeholder views of enforcement, monitoring and surveillance policy…………………...…….32
o Role of women………………………………………………………………………………………….………………………….33
6.0 Conclusion and Recommendation…….……………………………………………..34 o Recommendations……...………………………………………………………………35
7.0 Limitations of the study……………………………..………………………………..36 Appendices
1. Study Terms of Reference 2. Questionnaires and community interview guide.
List of Tables Table 1. Type of vessels operating in the Gulf Of Papau. Table 2: Prawn Export Volume (mt) and Value (USD & PGK) by years 1990 – 2011 Table.3. Community/Village visited during survey period and basic social indicators. Table 4. Summary of question type on questionnaire and target group. Table 5. National Census data for the LLG's visited in this survey. Table 6. Table showing actual allocation of questionnaires against completed sets. Table 7. Table showing community entry method and data collection approach. Table 8.Illustrates additional information on the three stakeholder group consulted. Table 9. Persons per household Table10. Age group and frequency of respondents. Table 11. Respondents Education Level Table 12. Frequency of respondents Christian church affiliation. Table 13. Summary of type of questions and responses category of micro-economic activity Table 14. Weekly income from bycatch sales and its frequency of earnings per category. Table 15. Table of bycatch/discard fish species distribution by percentage.
List of Figures Figure 1: Prawn export value between 1990 and 2011. Figure 2: Annual catch and effort with catch rate (CPUE) for ALL species. Figure 3: Peak season for all prawn species. Figure 4: Gulf of Papua Prawn Fishery Study Site.

3 | P a g e i _ G o P R e p o r t _ 2 0 1 6
Figure 5: Distribution chain of bycactch
Acknowledgement
I am greatly indebted to Food and Agriculture Organization of the United Nations (FAO) and the Papua New Guinea National Fisheries Authority (NFA), specifically the Prawns and Lobster Management section for giving me the opportunity to work in this Project. Officers of National Fisheries Authority in Port Moresby have provided invaluable insight and guidance in executing this Project along with logistical support from FAO PNG country office.
I am additionally indebted to numerous people who contributed to conducting the survey and provided valuable information and contribution that enabled me to compile this Report. Firstly I want to acknowledge the contributions from the team members who were involved in phase 1 and 2 of the survey (Gulf Province fishery staff), Mr. Biatus Bito and Mr. Mezin Eseme for data collection, data entry and literature reviews critique. Finally, a big thank you to the REBYC- II CTI project management team from SEAFDEC, FAO and NFA for your patience and understanding.

4 | P a g e i _ G o P R e p o r t _ 2 0 1 6
Acronyms ALC automatic location communicator BRD bycatch reduction device CPUE catch per unit effort CSIRO Commonwealth Scientific and Industrial Research Organization CTI Coral Triangle Initiative DoW Department of Works EEZ exclusive economic zone FAO Food and Agriculture Organization of the United Nations FIA Fishing Industry Association (FIA) FPIC free, prior and informed consent GEF Global Environment Facility GoP Gulf of Papua GOPPF Gulf of Papua Prawn Fishery GoPNG Government of Papua New Guinea GPFDP Gulf Province Fisheries Development Plan LLG local level government MEY maximum economic yield MSY maximum sustainable yield NFA National Fisheries Authority NFB National Fisheries Board PNG Papua New Guinea REBYC Bycatch Reduction Technologies and Change of Management SME small and medium enterprise TED turtle excluder device ToR terms of reference UN United Nations VMS Vessel Monitoring System
5 | P a g e i _ G o P R e p o r t _ 2 0 1 6
Abstract Gulf of Papua Prawn Fisheries (GoPPF) has come a long way since its development in the early years preceding Papua New Guinea’s independence from Australia. It started in 1969 and became PNG’s largest export fisheries apart from tuna. Prawn alone contributes significantly to the economy annually, earning between K2.5 million to K28 million or US$ 1.5 to US$ 11.5 million per annum. In fact, PNG’s prawn industry is very small compared to other countries in Asia. This is due to management regimes that limit all trawlers operating each season at 15 for the Gulf of Papua region (GoP). Over the course of the years, there is concern for ecological well-being of the GoP marine ecosystem including other similar ecosystems within the Asia-Pacific region. This ecosystem is pristine with kilometers of estuary, mangroves with nipa palm and associated wetland forest. The pristine ecosystem provides perfect spawning environment for shrimp and brackish water fish species such as barramundi, black bass and mud crabs amongst others. Given this background GoPPF management plan (first drafted in 1998) determines sustainable use of the shrimp resource within the region. However, over time certain management measures have not taken into consideration current technological changes in fishing methods, gear and other thematic threats that compromise the marine ecosystem. The Strategies for trawl fisheries bycatch management project (REBYC-II CTI) has provided the avenue to re-look at the way GoPPF has been operating in consultation with relevant government, local authority and community interest groups. Within the facets of this program, fundamental areas of assessment within the marine ecosystem of GoP needed extensive social, economic and cultural study. The outcomes of the enquiry will guide specific policy changes, if need be. A survey team was mobilized in October 2015 and again in November-December 2015 to carry out a survey into coastal communities of the GoP, specifically enquiring with local stakeholders on social and economic profiles of the GoPPF industry. Findings of the survey contained herein determined aspects of the community’s social and economic outlook targeting:
income level from bycatch utilization amongst other income sources; views on prawn trawling and its associated activities as a whole; involvement of women in the fishery sector within the GoP; baseline household and biodata information; involvement with government and other state players; opinion on level of assistance forthcoming from relevant authorities including
NFA (National Fisheries Authority) and provincial officers amongst others. Twenty-one communities from three Local Level Government (LLG) areas of Kerema district were covered in this survey. A total of 300 community consultation guide (interview schedule) with another 50 questionnaires each for trawler crew and local government staff were used to
6 | P a g e i _ G o P R e p o r t _ 2 0 1 6
collect information contained in this report. A turnover of 281 response (94%) or feedback was completed by 14 enumerators over the duration of this study. Prawn trawler crew returned 18 completed questionnaires while 24 government and fishery officers filled questionnaires targeting technical officers’ views. Given the results presented in this report, it can be summarized that benefits from GoPPF does not trickle down to the coastal communities despite the communities owning much of the resource. Furthermore, the ability of government agency and local initiatives to assist locals to tap into the resource is significantly lacking. Seventy-two percent (72%) of respondents recognize the fact that they are observers in the prawn industry while 35% of total respondents were women folks who are either directly involved in bycatch utilization and/or artisanal fishing within the waters of GoP. Additionally, impediments in education, infrastructure and social services are noted as findings of this enquiry. Generally, significant percentage of marine biota is recorded as bycatch/discards (80%-95%) amongst the target prawn species. The bycatch constitutes a good portion of coastal populace protein source and income source while a massive fraction of it is discarded as waste into the sea.

7 | P a g e i _ G o P R e p o r t _ 2 0 1 6
1.0 Introduction REBYC-II CTI (“Strategies for trawl fisheries bycatch management”) is an intervention designed to minimize impacts of fishing on marine ecosystems. The general project initiative is designed to contribute towards more sustainable use of fisheries resources and healthier marine ecosystems in the Coral Triangle and Southeast Asia waters by reducing bycatch, discards and fishing impact by trawl fisheries.1 This project is modeled on the concept of ecosystem-based management of marine resource utilization amongst coastal communities to maximize economic gain and help improve livelihoods at the same time minimize impacts on marine ecosystem from over-exploitation. Papua New Guinea’s (PNG) component of the four-year REBYC-II CTI project started in 2013 and was still ongoing at the time of the survey. PNG’s component of this project is implemented by the lead agency, National Fisheries Authority (NFA) with technical and operational support from the Food and Agriculture organization of the United Nations (FAO). Given the delays in fully implementing this project within the country, NFA, FAO and the REBYC-II CTI team had gone forward with recommendations from mid-term reviews in January 2015 to get important aspects of the project started. These aspects include a comprehensive socio-economic study of the Gulf of Papua Prawn Fishery and its associated impacts on coastal communities that rely on bycatch as a source of protein and income. As such this study aims to determine;
I. Level of dependence on bycatch by local community II. Synergy between different stakeholders within the GoP prawn industry;
III. Weaknesses and strengths of the current management regime within the GoPPF.
Gulf of Papua Prawn Fishery overview The Gulf of Papua Prawn Fishery (GoPPF) started almost 45 years ago in 1969 when interest in the shrimp industry escalated. In the late 1960s joint-venture projects were formed and was operated by various operators (Gwyther, 1980 cited in Matsuoka, 1995). According to Matsuoka (1995) only three companies were involved initially. Between 1988 and 1994, the GoPPF was operating under an interim management plan, which was set up in 1988. The plan was based on the result of a number of projects and investigations, on catch and effort data since 1977, and on the operations of the three main companies (Evans et al. 1995). On average, the individual vessels of the core companies were catching about 80 tonnes per vessel per year. Thus, an allowable catch of 80 tonnes per vessel was set, and as a result, the number of vessels was set at 15, based on the estimated yield of 1200 tonnes (Evans et al. 1995). 1 Defined in REBYC-II CTI Project Document (FAO, 2009)

8 | P a g e i _ G o P R e p o r t _ 2 0 1 6
By 1995, about 14 of the 15 GT-type trawlers were licensed for operation year round and they produced on board-frozen prawns for export. Currently, the fishery is limited to 15 licenses with no foreign registered fleet involvement, except on joint venture arrangements. As a result industrial fishing is subsequently increasing in the country and is either operated by PNG-based foreign firms or under joint venture partnership (Matsuoka, 1995).
Types of trawl vessels and gear There are three types of vessels: single rig, twin rigged and quad rigged. All vessels operating within the GoP have a length between 21 m and 30 m and all have onboard licensed processing facilities and storage or freezers. Most of the vessels are twin-rigged with 12 fathoms (24 m) (footrope), except three vessels which are quad-rigged. They also have two main nets, each with a small try net (Evans et al. 1995; Liviko 2012). The nets used cover a swept area width of 60 meters. This can be achieved by using two large main nets or four smaller size nets. In practice, it has been shown that quad-rigged nets are more efficient over heavy silted bottom (Liviko 2012). Furthermore, during trawling, the main nets are set for three to four hours while the try net is set from mid-ship, somewhere before the main nets and are checked every 15 minutes to inspect what has been caught in the main net (Evans et al. 1995). Whenever a good school is caught, the vessels are able to make a U-turn, and go over the same ground several times, before the main net is winched up. However, a couple of vessels introduced recently are a great concern to the fishery industry in GoP as they are stern trawlers and these vessels have only one main net that causes more damage to the marine biota. Table 1 shows the particulars of each vessel type operating in the region with its specifications.
Table 1. Type of vessels operating in the Gulf of Papua.
Type of Vessel No. of Vessels Ave-Length (m) Ave-Gross tonnage Registered
Main Aus. Eng (HP)
Quad Rigged 10 vessels 24.45 - 29.3 145.27 - 211.02 420 HP-440 HP
Twin Rigged
2 Vessels 24.45 145.27 420 HP
Single Rig
3 Vessels 26.77 177.06 425.00 HP
National prawn fishery economic overview The fisheries industry is one of the primary sectors expected to develop significantly in most island countries in the South Pacific region including PNG. The industry has been active and is generating much needed revenue for the country. Overall, it has contributed to the national coffers approximately USD 100 million (PGK300 to K400 million) per year with significant contribution coming from the tuna fisheries (NFA, 2016_ Website).

9 | P a g e i _ G o P R e p o r t _ 2 0 1 6
Prawn fisheries have been a notable contributor to PNG’s marine fishery exports as much as it is to other maritime countries of the Pacific. In Australia between 2010 and 2011, the industry recorded a gross value of production (GVP) of USD 27 million (K60.5 million), with a total catch of 1 979 tonnes of prawns (Knight and Tsolos 2012; cited in GoSA 2007). In PNG the industry is minor but contributes a fair share to the national coffers between USD 1.13 million to under USD 4.0 million annually (NFA, 2012). Figure 1 shows prawn export value between 1990 and 2011for all species within the country. Over the years the export of prawns has increased significantly by 50% from 993,000 kg in 1979 to 1,960,000 kg in 1987 thus earning between K3.8 to K8.8 million (Matsuoka, 1995). Between 1990 and 2003, the revenue generated was between K2.5 million and K28 million or USD 0.8 million and USD 10 million (NFA, 2012). The peak revenue period was experienced between 1998 and 2003 where earnings from prawn fishery alone generated between K18 million and K28 million respectively. Most other years produced variable results ranging from K2 million and K13 million with the lowest amount from export was achieved in 2009 where K2 million was generated.
Figure 1: PNG’s Prawn export value between 1990 and 2011 (Source: NFA 2012) The variations in the revenue is influenced by key factors such as the weather, period of fishing, world price or the number of vessels used. A study by Evans et al. (1995) confirmed that bad weather affected catching effort. Also ageing vessels and high cost of fuel and maintenance deter catching effort (Liviko 2012). Between 2000 and 2008, prawn trawling fluctuated between 7 to 12 months (NFA 2012). During that period a low of 5 vessels to as high as 15 vessels per fishing period took to the waters in the GoP between April and November. Consequently, this affects the annual catch, which ranged between 119,638 kg and 1,046,683 kg. Figure 2 shows the annual catch and effort with catch rate (CPUE) for all species. This implies that the biomass of the fishery at maximum economic yield (MEY) and maximum sustainable yield (MSY) is about 800 tonnes and 650 tonnes respectively (NFA 2012) in GoP.

10 | P a g e i _ G o P R e p o r t _ 2 0 1 6
Figure 2: Annual catch and effort with catch rate (CPUE) for ALL species within the GoP (Source: NFA 2012) Despite the important economic value of prawn fisheries derived in the Gulf province, nothing significant is retained by the province in terms of economic benefits and infrastructure, such as landing sites and processing plants. This is partly attributed to the fact that there is no jetty or wharf in Kerema including storage facilities that trawlers can offload, store and even process their harvest (NFA 1995; Liviko 2012). Gulf provincial government is mandated to receive or keep 5% of the total export value at the end of every season per the 1998 GoP prawn fishery policy. For the province to directly access this funding after tax and sales from national government is always inconsistent. Funds are calculated and allocated after exports as shown in Table 2 but remitting it into the provincial government treasury to allow provision of basic services to coastal communities is inconsistent (Philemon, pers comm).

11 | P a g e i _ G o P R e p o r t _ 2 0 1 6
Table 2. Five percent (%) export value intended for Gulf province, 1996-2008
Prawn fishing seasonality The seasonality of different prawn species varies during the year. However, there is a general trend where the season normally peaks in May then declines between June and December before surging back between March and April (Figure 3). Indian Banana, Endeavour Demon and Banana prawns’ season peaks in May. Coral Brown prawn peaks in January; Blue Endeavour, Shimaebi, Akaebi, Green or Groved Tiger in February; White Tiger and Japanese Tiger peaks in April; Greysback (Red Endeavour), Red Spot King and Leader prawn in June; Green Endeavour and King prawns in July; and Brown Tiger prawn peaks in August (Liviko 2012).
Figure 3: Peak season for all prawn species (Source: Liviko 2012)

12 | P a g e i _ G o P R e p o r t _ 2 0 1 6
Moreover, according to Liviko (2012), the main season for fishing for all prawns is from April to August with an average catch of 294,321 kg (249.3 tonnes) per month. The catch begins at 156 tonnes in April and peaks at 159 tonnes in May and gradually declining to about 60 tonnes in March (average catch per hour) As stated above, interaction with local communities from this survey proved that fishing in GoP occurs between April and November with banning taking place between December and March. However, the main season for catching banana prawn in the GOP is from February to August, which normally coincides with the period of highest rainfall (Livoko 2012). Liviko states that during this period, the average catch is about 96 metric tonnes per month but 100 tonnes per month or more can be reached between April and July. Generally the September to January catches usually averages about 100 tonnes per month or lower. Thus the overall total catch is about 1,200 tonnes/ per year with 50 to 60 percent being the targeted banana prawns (Fenneropenaeus merguiensis). Majority of the prawns caught are M. merguiensis, while M. eboracensis comprised about 20 percent and fetch high prices. Tiger prawns make up about 10 to 15 percent of the catch yet still attracts high prices. The remainder of the catch is made up of coral prawns. All catches are processed on board larger vessels and stored into frozen packs for export, while the catches on smaller vessels are either processed on board or chilled and packed later onshore in Port Moresby (NFA 1995).
Management – monitoring, control and surveillance The objectives set by the government for the management of the GoPPF as stated in the Gulf of Papua Prawn Management Plan 1998 (NFA 2002) is:
• To manage the prawn fishery on a sustainable basis; • To maximise the value of the resource through prevention of growth over-fishing; • To manage the fishery on a precautionary approach; and • To increase PNG participation in the fishery industry.
The general strategy for attaining the above objectives is primarily to control input by the industry in terms of number and type of fishing trawlers and secondarily gear restrictions. To control output, such as a total allowable catch, would be inappropriate for a resource that has large abundance or are independent of fishing pressure. Hence, the specific measures presently used in management of the fishery include (NFA 2002):
• Seasonal closure – December to March; • Limited entry – only 15 vessels shall be licensed to operate in the management area; • Restricted entry - only Papua New Guinea companies; • Gear restriction – vessel size (30 meters), rope and nets size restrictions; and • Requirement that all licensed vessels have automatic location communicator (ALC) on
board.

13 | P a g e i _ G o P R e p o r t _ 2 0 1 6
With respect to enforcement, the NFA Managing Director may appoint any employee of the Authority or anybody he considers appropriate to be Fishery Officers for the purpose of enforcing the Fisheries Management Act. Members of the Police Force and Defense Force are also Fishery Officers for the purposes of fisheries enforcement. Nonetheless, lack or poor communication, coordination, resources, technologies and infrastructures in both NFA and provincial fisheries office is a major obstacle in achieving the objectives. The obstacles mentioned above were obvious during the month-long survey. Nonetheless, surveillance program of the National Fisheries Authority has three main components:
(1) the use of NFA fishery observers on selected vessels; (2) cooperation with the PNG Defense Force in the physical surveillance/enforcement on the
fishing grounds, and; (3) implementation of the electronic vessel monitoring system.
Generally, representatives from the Fishing Industry Association (FIA), government agencies including NFA and other the stakeholders are represented on the National Fisheries Board (NFB) which approves the plan and governs the agency (NFA) that implements the plan. Overall information for management decisions dealing with GoPPF is acquired through various means including record and submitted logbook forms containing position, effort, and catch information (NFA 2002). This routinely-collected data is entered into a database, analyzed and processed by NFA’s Research and Management Branch, and compared to set targets in the management plan. However, the surveillance work has a long way to go to be effective given funding deficiencies and other associated reasons.
2.0 Study site and stakeholders Figure 4 shows the GoP extending from the west of Port Moresby in Central Province to the mouth of Western Province. In terms of Prawn Fishery, GoPPF runs parallel along the coast from the mouth of Fly River in Western Province to the coast of Iokea in the east in Gulf province, and extending seaward to the 40 m depth contour (Liviko 2012). GoP also contains one of the largest mangrove habitats in the world thus making it an important fisheries habitat. The coastal areas comprised of mosaic of habitats with mangroves forming an extensive belt, some 12 kilometre (km) thick intermingling with brackish swamp forest fringing the coast (Pernetta and Hill, 1981). Moreover, the coastline has long narrow sand beaches stretching kilometres but interrupted by river tributaries and brackish mangrove swamps. The marine substrate varies from fine mud and silts to sandy beaches or rocky shores, thus the diversity of resources available within the region as a whole is highly localised (Pernetta and Hill, 1981). Hence, it constitutes one of Papua New Guinea’s important fisheries economic regions because of the extensive prawn harvest from this region.
14 | P a g e i _ G o P R e p o r t _ 2 0 1 6
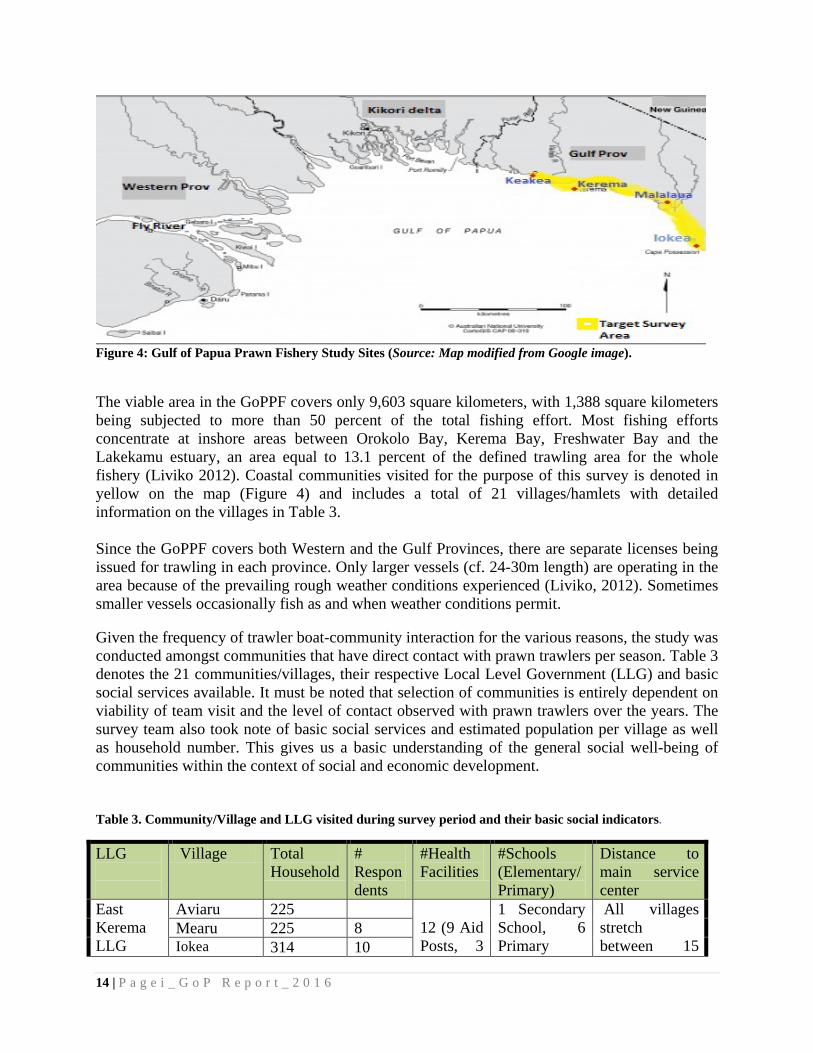
Figure 4: Gulf of Papua Prawn Fishery Study Sites (Source: Map modified from Google image). The viable area in the GoPPF covers only 9,603 square kilometers, with 1,388 square kilometers being subjected to more than 50 percent of the total fishing effort. Most fishing efforts concentrate at inshore areas between Orokolo Bay, Kerema Bay, Freshwater Bay and the Lakekamu estuary, an area equal to 13.1 percent of the defined trawling area for the whole fishery (Liviko 2012). Coastal communities visited for the purpose of this survey is denoted in yellow on the map (Figure 4) and includes a total of 21 villages/hamlets with detailed information on the villages in Table 3. Since the GoPPF covers both Western and the Gulf Provinces, there are separate licenses being issued for trawling in each province. Only larger vessels (cf. 24-30m length) are operating in the area because of the prevailing rough weather conditions experienced (Liviko, 2012). Sometimes smaller vessels occasionally fish as and when weather conditions permit. Given the frequency of trawler boat-community interaction for the various reasons, the study was conducted amongst communities that have direct contact with prawn trawlers per season. Table 3 denotes the 21 communities/villages, their respective Local Level Government (LLG) and basic social services available. It must be noted that selection of communities is entirely dependent on viability of team visit and the level of contact observed with prawn trawlers over the years. The survey team also took note of basic social services and estimated population per village as well as household number. This gives us a basic understanding of the general social well-being of communities within the context of social and economic development. Table 3. Community/Village and LLG visited during survey period and their basic social indicators.
LLG
Village Total Household
# Respondents
#Health Facilities
#Schools (Elementary/Primary)
Distance to main service center
East Kerema LLG
Aviaru 225 12 (9 Aid Posts, 3
1 Secondary School, 6 Primary
All villages stretch between 15
Mearu 225 8 Iokea 314 10

15 | P a g e i _ G o P R e p o r t _ 2 0 1 6
Isapeape 5 Health Centers)
School, 34 Elementary school.
Km to 40 Km from Kerema town.
Karaeta 13 Uritai 336 16 Koaru 133 22 Lese 486 5 Lalapipi 6
Kerema Urban LLG
Karama 224 25 1 Provincial Hospital
2 High School/Secondary School. 4 Primary School. 39 Elementary Schools
Communities within range of Kerema town (1 Km to 5 Km) but access only by boat.
Kukipi 143 15 K-Town/Kbay
11
Siviri 31 Uamai 2*2 166 19 Silo 219 21
Central Kerema LLG
Herehere 13 13 (11 Aid Posts, 2 Health Centers)
43 Elementary Schhol. 5 Primary School. 1 Secondary High School.
Furthest villae between 20 Km and nearest at 8 Km from Kerema town.
Meii 242 13 Keakea 15 Uaripi 149 19 Lavare 1* Pomaru/Puara
2
(Source: Gulf Provincial Integrated Plan 2012-2015) Additionally different stakeholders involved in the prawn trawling industry, mainly the commercial fishing companies, LLG staff, government workers and administrative staff were also interviewed in addition to the local communities. The different stakeholders above formed the core groups that were crafted from the list of “targeted stakeholder groups” stipulated under the terms of reference (ToR) of the social and economic study of this project. Overall, two sets of questionnaires and a guided interview set were developed targeting coastal village community (including bycatch users, retailers and sellers), trawler crew, government officers and company officials. Hence, questionnaires were designed targeting the following core group:
i) Fishermen/Women; ii) Transporters; iii) B y c a t c h a n d D i s c a r d U s e r s / Sellers/Retailers; iv) Household/street Sellers; v) Trawler employees/crew; vi) Target area (GOP) Community Leaders; vii) Employers(Department heads/officers and Company executives); viii) National and Local Fishery industry officers; and ix) General public
2 There are two Uamai villages located further apart, Uamai 1 is outside of survey area, same for Lavare village 2 which is located further inland.
16 | P a g e i _ G o P R e p o r t _ 2 0 1 6
Crew on board prawn trawlers Crew members on each fishing vessel are full-time workers including 1 captain (either a national or an expatriate), 1 chief officer (national), 1 chief engineer (expatriate), 1 assistant engineer (national), 1 bossen (national), 1 assistant bossen (national), 1 tallyman (national), 1 quality controller (national), and the remaining crews are processors (nationals). In addition, the number of crews employed per vessel by each company is around 14 to 18 crews, all males working on full-time basis (NFA, 2012). No females are employed to work on prawn trawlers however the employment in post-harvest activities are done by either men or women on full-time, part-time or seasonal employment. Apart from the Captains, chief officer, cooks and engineers, all crew members conduct post-harvest activities and work full-time as well. In this survey, 18 crew members (out of 50 targeted) were able to return completed questionnaire forms from a sample size of 4 boats from a total of 15 licensed trawlers. All of the 18 crew members were males due to the fact that no females work on boat trawlers in the country.
Government and technical officers Along with the crew members, about 24 government and technical officials were interviewed to gauge their views on the shrimp industry as well as bycatch/discard use policy. This group of respondents represented Gulf Provincial administration (including LLG staff), National Fisheries Authority officers, Department of Environment and Conservation (PNG), and technical officers from prawn exporting companies.
3.0 Methodology Twenty-one communities (defined as hamlets/village or cluster of houses) in three Local Level Governments (LLG) in coastal areas of Gulf Province were visited by the survey team between August 2015 and November 2015. The survey was primarily targeted at coastal communities within 1 km and 5 km from the coastline because of the fact that most inland communities have no direct access to fishing trawlers.
Study Design A proportional sampling effort was employed in this survey because communities have different population groups and engagement with trawlers depended on distance from the coastline. Given this approach, enumerators were able to fill more questionnaires in communities that are actively involved in bycatch utilization and fewer respondents were interviewed in less active (further inland) areas.

17 | P a g e i _ G o P R e p o r t _ 2 0 1 6
Study Instruments/Questionnaires The collection of socio-economic information was done using guided interviews for the 21 coastal communities and questionnaires for trawl boat crew and government officers. Survey questions were formulated in English for boat crew and technical officers while guided questions for community consultation was conveyed in Pidgin (national language) and local dialect where appropriate. Interpreters and local guides were used to translate interviews at village meetings in some instances. The questionnaires comprised two main areas of information needs. Firstly we collected information on individual’s bio-data and social standing in terms of education and household economy. Secondly, we targeted respondents’ views on prawn resource management, bycatch utilization, contact with trawlers and dependence on discard/bycatch resource. Each questionnaire was accompanied by introductory remarks on purpose of the exercise and respondents rights to certain privacy in terms of direct and indirect answers to culturally sensitive questions. Free, prior, and informed consent (FPIC) of respondents were sought either collectively or individually before the interviews commenced in each village. Table 4 gives a summary of types of questionnaire distributed, type of target group and the actual number of guided questions filled by enumerators for each category/target group. Table 4. Summary of question type, target group and number of questions for each thematic area.
Thematic Areas Topics covered Target respondents
Number of Questions
Bio-data/Social: Age, Marital Status, Education Level, Number of Children,
All 12
Economical Income level, bycatch utilization information, Number of trips to boat trawlers
Bycatch sellers/buyers,
8
Opinion on GoPPF Management rules, trawler crew behavior, bycatch distribution, Participation in Prawn industry
All 5
Other information Assistance from local authorities, Suggestions on Industry Management issues.
All 6

18 | P a g e i _ G o P R e p o r t _ 2 0 1 6
Sample Size Selection Table 5 provides population and household data for the three LLG areas of this survey comparing difference between the 2000 census and 2011 census (2011 Census is current data since the next census is scheduled for 2021). Data from the last census show 3,133 households from central Kerema LLG of which 92 individuals representing their household were interviewed giving coverage of about 3% of total households. For East Kerema there were 2,191 households and this survey interviewed 98 individuals representing their household giving coverage of 4% of the total. Kerema urban on the other hand recorded a coverage of 12 % of total household covered with the lowest household of 776 out of the three LLG area. A total of 21 communities were visited with an output of 281 completed questionnaire sets from the set target of 300 (96% coverage) (Table 6).
Overall we have covered 5 % of total households in the three LLG, which is a fair sample size considering the fact that total households in each LLG include those communities who are located away from the coast and have no direct link to marine resource use. Total trawl boat crew stands between 170 and 180 (across all 15 permitted vessels); hence, 18 interviewed crew represents a sample size of 10% while 24 government and technical officers filled out responses from the 50 questionnaire sets distributed.
Table 5. National Census data for the LLG's visited in this survey (Source: NSO, 2011)
SURVEY SITE POPULATION BY DISTRICTS AND LLGs– 2000 and 2011 CENSUS
2000 CENSUS 2011 CENSUS/ CURRENT DATA
% of Province Total
Average House
Hold size
(2011)
Households
Persons
Males
Females
House- holds
Persons
Males
Females
GULFPROVINCE 18,004 106,898 55,529 51,369 25,819 158,197 81,814 76,383 100.0 6.1
KEREMA District 11,616 65,498 34,031 31,467 18,009 107,231 56,002 51,229 67.8 6.0
1 Central Kerema Rural
2,254 12,864 6,706 6,158 3,133 16,609 8,803 7,806 10.5 5.3
2 East Kerema Rural 1,932 11,479 5,994 5,485 2,191 13,134 6,961 6,173 8.3 6.0
3 Kerema Urban 776 5,124 2,673 2,451 890 5,885 3,060 2,825 3.7 6.6
Although 21 communities within the target area are covered in the survey, most respondents tend to have similar views towards issues and questions raised. As expected, those communities closest to the coastline have direct contact to prawn trawlers with differing responses from those

19 | P a g e i _ G o P R e p o r t _ 2 0 1 6
further from the coast and less exposure to trawlers. The latter group posed a more conservative and radical view of limiting/restricting trawlers while those in direct contact with trawlers express need to have trawlers within waters for regular bycatch supply.
Table 6. Actual allocation of questionnaires against completed sets.
Target Group
Total Allocated Questionnaire
Actual Questionnaires completed/returned
% Turnover
Total Questionnaires
East Kerema LLG
100 98 98% 281
Central Kerema LLG
100 92 92%
Kerema Urban LLG
100 91 91%
Trawl Boat Crew
50 24 50% 24
Government officials
50 18 36% 18
323 (81%) Most populated LLG is Central Kerema with a total population of 16,609 persons (46% females) while Kerema urban has only 5 885 people with an average household of 6.6 persons per household. The 21 communities visited thus far represented 281 respondents which is equivalent to 0.26% of the entire district population. Moreover the figures represent a fair share of the coastal community covering some 5% of coastal community with disregard to the inland populace. Data Collection Approach Given the scope and magnitude of the target project area it was imperative that appropriate community and stakeholder consultative methodology is applied to determine qualitative and quantitative data collection. In order to obtain this rapidly, participatory methods of data collection such as RRA (Rapid Rural Appraisal) and PRA (Participatory Rural Appraisal) were employed through:
Stakeholder meeting, key informant interview Personal conversation, face-to-face meeting and community discussion On Site reconnaissance/ observation (photographic imaging) Trawler onboard inspection and crew interview Market survey (Kerema town and Malalaua town including roadsides)

20 | P a g e i _ G o P R e p o r t _ 2 0 1 6
In addition, prior to conducting the survey, a pre-test was conducted and changes were made to the questionnaires, where appropriate. These community entry methods employed for specific target respondent group is listed in Table 7.
Table 7. Community entry method and data collection approach
Enumerators The team of survey enumerators was selected from Gulf Provincial fisheries and East Kerema LLG Fisheries staff based out of Malalaua and Kerema Township. Several NFA staff and associates from Port Moresby assisted in the survey with logistics and community liaising. There was no specific criteria used to select the enumerators but the survey team leaders specifically opted for the fisheries officers within the province for the reasons that officers:
• have local knowledge; • come in regular contact with coastal communities in their everyday line of
duties; • are well versed with issue, needs and general context of GoPPF; • have sound educational level beyond college/university; and their • availability for the exercise.
Data collection Approach- (Community entry method)-Rapid Rural Appraisal and Participatory Rapid Appraisal. Method Target Respondents/Groups Observations/Comments
Public gathering Coastal Community/Villages Effective when few people are willing to participate
Organized women’s or youth group discussion.
Coastal Community/Villages Community gatherings occurred when elders got involved in organizing
Key Informant Interview
Community Leaders, LLG Workers, Government Officials, Boat Crew
Done on a one on one basis. Boat crew and Government officers were given questionnaires to be filled and returned in their own time.
Market Survey Main town Markets, road side Random guided questionnaire interview
Onsite inspection, observation (Photographic)
Villages, Trawler Boats, Urban Market
Physical observation on board trawlers and within villages.
Household survey Bycatch Sellers, Buyers and General public.
Coastal community visits also included household survey

21 | P a g e i _ G o P R e p o r t _ 2 0 1 6
Enumerators’ averaged in age group between 25-35, while all of them had educational level at college and above. The average number of years’ experience in the fishery sector is at 15 years, the most senior officer had clocked 23 years of service while the youngest officer had spent just two years at the time of survey. Three females were involved in the survey and 11 males in both phases of the survey (14 in total). The enumerators were given a day’s session with survey team leaders to understand each question and what was required from them as important intermediary between respondent and target information gap. Through a group meeting, each enumerator was given time to trial the questions with 5 trial questionnaire filled in the first day in Malalaua and Kerema town. The response were then analysed and issues faced discussed before the initial survey.
4.0 Results and Discussion
Stakeholder analysis Findings contained in this section and the analyses of data are predominantly taken from information extracted from the 281 respondents from 21 coastal communities/villages within the target area (GoP). From this sample size, 35% were female respondents and 65% were male. Almost 90% of the respondents were married while 7.5% were single and a further 2.5% were either divorced, separated or had lost a partner at the time of interview. Further to the local coastal community stakeholder survey, the results and discussion also take into consideration views obtained from trawler boat crew (n=18) who were all males and government and technical officers within the Gulf province and fisheries industry. The latter stakeholder group had three female officers who were able to fill out questionnaires for the survey compared to 21 males. Table 9 provides additional information on the three stakeholder groups consulted in this survey. Table 9. Additional information on the three stakeholder groups consulted. 1.Respondents from 21 Coastal Communities (n=281)
% of Total
Male 183 65% Female 98 35% Married 249 89.3 % Never Married 21 (7 youths under 16 yrs.) 7.5 % Divorced/Separated 2 0.7% Widow/Widower 7 2.5% 2. Respondents from Boat Trawlers (n=18) Males 18 100%

22 | P a g e i _ G o P R e p o r t _ 2 0 1 6
Female 0 Married 17 99.5% Single/Never Married 1 0.5% 3. Respondents from Government/Technical Officials (n=24) Male 21 88% Female 3 12% Married 19 79% Single/Never Married 4 17% Divorced/Separated 1 4%
-BOAT CREW (n=18), Age Range, Church Affiliation & years of work Experience Age Range (years)
Frequency/%
Church Denomination
Frequency/%
Years of Experience
Frequency/%
20-24 2 11% Catholic 2 11% 1-5 8 44% 25-29 4 22% United Church 9 50% 6-10 4 22% 30-34 4 22% Lutheran 1 6% 11-15 1 6% 35-39 2 11% Pentecostal 1 6% 16-20 2 11% 40-44 2 11% SDA 3 17% 21-25 1 6% 45 and above
4 22% Non-Christian/Other
2 11% 26 and above 2 11%
Technical and Government Officials (n=24): Age Distribution, Church affiliation & Years of work experience.
Age Range (years)
Frequency/% Church Denomination
Frequency/% Years of Experience
Frequency/%
20-24 3 13% Catholic 4 17% 1-5 9 38% 25-29 6 25% United Church 10 42% 6-10 4 17% 30-34 4 17% Lutheran 3 12% 11-15 5 21% 35-39 6 25% Pentecostal 2 08% 16-20 3 12% 40-44 3 12% SDA 5 21% 21-25 2 08% 45 and above
2 08% Non-Christian/Other
- 26 and above 1 04%

23 | P a g e i _ G o P R e p o r t _ 2 0 1 6
Persons per household
The average (mean) number of people living within a household in the 21 coastal communities was 7.2, +/- 2.2 SD (standard deviation). This value is calculated from the 281 respondents of which the most occurring persons per household had a frequency of 42 respondents with 6 persons living together (Table 10). The highest number of people living in a household is 18, a respondent from Siviri village near the fringes of Kerema town (Kerema Urban LLG). Head of this household is a retired public servant over the age of 55 who has his three married children living with their spouse and children. It was noted that this respondent had the highest number of children at 11, of which 8 are unmarried.
The minimum person per household is 1, observed from a frequency of 16 respondents across all the three LLG. Interestingly a total of 76 respondents (27%) indicated the number of people in their household ranging from 9 to 18 which is high for unemployed fisherfolks to maintain in terms of daily expense. Half of people living in the household are dependents (adult children) of respondents or their grandchildren. This trend is typical in Melanesian community whereby extended family members live together as a single family unit. Only two respondents did not indicate the number of people living in their household most probably due to oversight by the enumerator in requesting for the information.
Table 10. Number of persons per household in the three LLG’s.
Age classes of respondents
Age and sex are central variables in all demographic and socio-economic analysis. Our survey findings indicate a slightly different scenario simply because the intent of the survey was to collect information from specific groups instead of random sampling. The focus was on
No. of Persons per household
Frequency- (N=281) No. of Persons per household
Frequency (N=281)
Not indicated 2 11 15 1 2 12 13 2 11 13 4 3 20 14 none 4 21 15 3 5 39 16 2 6 42 17 3 7 31 18 1 8 28 9 21 10 14

24 | P a g e i _ G o P R e p o r t _ 2 0 1 6
community leaders, women folks and youths within coastal community who one way or the other may have been impacted by prawn fishery and bycatch utilization. As such, the survey questionnaire had a specific cutoff for respondents between 15 years and above. Age range of 25-34 years old had the highest turn out from interviews with 25% responses while 35-44 years old made up 24% of respondents (Table 11). The two age groups represent active and able bodied age class in most communities. Given the nature of this survey, community leaders are elderly people who make decisions on fishing rights and land ownership issue, hence a sizable response of 18% were beyond the age of 55 years. Only one female from Uritai village did not indicate her age group as she could not remember when she was born.
Sex ratio
According to the 2011 national census, sex ratio for PNG was108 males for every 100 females indicating that there were slightly more males than females. In terms of age distribution, 36% of people enumerated in PNG were below the age of 15 and 3% were above the age of 65 years (NSO, 2011). This denotes a growing fertile population that is going to grow exponentially into the future. In terms of sex ratio of respondents (N=281) within the target community, there were a total of 98 females and 183 males interviewed. Only one respondent from Kukipi village (East Kerema rural LLG) did not indicate the sex, an oversight by the enumerator. As such, the survey team gauged views from 65% males and 35 % females as a balance in opinion due to nature of interaction with trawlers and bycatch utilization being a shared responsibility. The task of going out to trawlers and acquiring bycatch as well as deciding family expenditure is male dominated; on the other hand, utilizing the acquired bycatch, cooking and re-selling is mostly done by women folks. In a typical Melanesian society, menfolks decide on land resource (including marine) use and determine level of participation. As such twice as much male responded to the consultative process. Women on the other hand had a fair share of participation (35%) simply because the survey team prioritized their approach to women knowing very well that they would have been overlooked by men if left to decide independently.
Table 11. Age group of respondents and frequency.
Age Group (years) Frequency (N=281) % of Total 15-24 31 11.2 25-34 70 25.0 35-44 67 23.5 45-54 63 22.4 55-64 48 17.1 Over 65 1 0.4 Not Indicated 1 0.4

25 | P a g e i _ G o P R e p o r t _ 2 0 1 6
Education level of coastal community respondents
Communities within the Gulf of Papua including the province as a whole are amongst the country’s least developed in terms of education and related infrastructure. Nevertheless, this survey targeted communities along the coast which stretch beyond major service centers such as Kerema and Malalaua towns; as such respondents are expected to be less educated compared to similar surveys targeting urban towns and cities.
About 4% of total respondents (N=281) have no formal education, while 22% (61 respondents) had some form of schooling but did not complete grade 6 (Table 12). A good number of people within the target site have completed grade 6 or 8 with primary school certificate (43%) and at the same time can do some general reading and writing. Twenty percent of respondents finished high school and had some exposure to formal employment before going back into the village to settle permanently. The rest of survey respondents either went to technical education institutes (Polytech) or further at college level.
Notably only 3 respondents had a college diploma while only one had a university degree. This is not surprising as most educated citizens of each community like any other village in the country live and work outside of their home village, thus this result is expected.
Table 12. Respondents Education Level
Education Level (Category 1-9) Frequency (N=281) % of Total
Cat 1. No formal education 11 3.9 Cat 2. Below grade 6 61 21.7 Cat 3. Above grade 6 to grade 8 119 42.3 Cat 4. High school certificate-year 10 57 20.3 Cat 5. Higher School Certificate-year 12 19 6.8 Cat 6. Technical/Vocational/Polytech 7 2.5 Cat 7. College Diploma 3 1.1 Cat 8. University graduate 1 0.4 Cat 9. others 1 0.4 Not indicated 2 0.7
Access to education facility
All villages within the survey site have access to basic elementary schools (lower primary) within walking distance. The biggest issue confronting communities of the coast of GoP is access to Upper Primary school (grade 4 to grade 8) and High Schools/Secondary School (grades 9-12). Upper primary schools are located further away from communities making transportation difficult for students let alone secondary schools. Seventy-two percent (72%) of respondents stated that facilities and availability of education infrastructure for their children to attain good
26 | P a g e i _ G o P R e p o r t _ 2 0 1 6
education level is a major driver of high dropout rates for school-age children. For instance, heavy rainfall, flooded estuaries, and rough seas deter kids from commuting to and from higher grade schools which are at most times located in other villages some kilometers away.
There is only one secondary school in East Kerema (Malalaua Secondary School) and two secondary schools in Central Kerema ( Kerema High School and Don Bosco Aramiri) that are meant to facilitate students graduating from more than 35 primary schools within the district. This is not encouraging at all and is considered a major reason for migration of students of Kerema District to Port Moresby. Several respondents also mentioned that teaching staff do not attend to the students fully during the course of the year as most teachers go off into Port Moresby for extended trips.
There are many impediments to education for GoP coastal community given the geographical location and resource limitations that contribute to social ills faced by students, which discourage them from progressing. These issues are not isolated though, as most communities in the country have similar impediments but Gulf province can improve as a whole given its proximity to the National Capital District (Port Moresby).
Christian church affiliation of community respondents
Faith-based organizations have contributed immensely to the development of PNG since the 1940s and continue to do so. Most health and education services are provided by church-run organizations. The social and economic wellbeing of most communities in PNG is supported by their affiliation with some Christian church denomination. In this exercise we decided to collect affiliations of respondents with each church group and the findings are consistent with 2011 national census on the same undertaken by NSO.
Most people within the survey villages attend United Church (42 %), followed by Seventh Day Adventist (8%) and Roman Catholics (7%) (Table 13). Interestingly, 27% (75) of respondents did not indicate their church affiliation. Several reasons can be deduced from this: firstly, enumerators failed to ask respondents; secondly respondents do not attend church anymore as such cannot give a response, and finally respondents attend to churches not listed in the questionnaire. Nevertheless, according to the 2011 National Census report, most people in Gulf province attend to United Church (NSO, 2011) which is consistent with the findings of this survey. Seventh Day Adventists, Jehovah Witness, Lutherans, Baptist, Pentecostals and the Salvation Army make up balance of the respondents’ church affiliation.
Table 13. Church affiliations of respondents.
Christian Church Denomination Frequency (N=281) % of Total United Church 117 41.6 Not Indicated 75 26.7

27 | P a g e i _ G o P R e p o r t _ 2 0 1 6
Seventh Day Adventist 26 9.3 Roman Catholic 22 7.8 Jehova Witness 16 5.7 Pentecostals 18 6.4 Salvation Army 7 2.5
Income sources within GoP coastal communities
Within the course of this survey the questionnaire designed was able to pick information on different source of income for the family unit and or the respondents’ household income. This question was basically meant to determine level of sustenance for the respondents’ family and their ability to pay for various services such as health, education, clothing and food.
The question required respondents to provide information on alternative income source within the informal sector small business(s) other than fishery. Respondents were given the opportunity to indicate the economic activity that they are always involved in daily to substantiate their income and meet daily needs in order of most common activity to the least. Table 14 provides a summary of responses to this question and comments on the last column help explain the type of micro-economic activity.
Table 14. Alternative source of income other than fishery respondents are actively involved.
Alternative Income Source % of respondents’
Comments
Betel Nut and Mustard Trade 26 Betel nut provides almost three quarters of the province’s rural populace income.
Vegetable Sales (gardening) 14 Most common only to communities farther away from the coast.
Baking and Roadside sales 12 Handcraft and Weaving (Mat, Basket)
9 Dominant along East Kerema coastline.
Trade store and Boat Fuel Sales 10 Bycatch collectors and fishers are targeted by fuel sellers along the coast.
Others - Poultry, artifacts, piggery, retail and transport
21 Also any other one off activity other than full time employment.
Subsistence livelihood 8 Live of what they produce, do engage in opportunistic income such as working in logging sites and village shops but not a major source of income throughout the year.

28 | P a g e i _ G o P R e p o r t _ 2 0 1 6
The responses denoted that fish and fishery related income is a major source of sustenance of the community regardless of alternate livelihoods sources. However fish from bycatch and discards are considered opportunistic sources of income due to the reason that not many people have the ability to go out to prawn trawlers for trade (access to trawler boats is limited to those who can go out to sea and meet trawlers). Nevertheless, bycatch accounts for most of the fish sold at markets in Kerema town and villages as observed by the survey team.
Bycatch/Discards use and value Most bycatch caught in the Gulf of Papua is usually discarded off the boats while some are fetched by locals on board trawlers and sold at the local village markets or in Kerema town. In other cases boat crew and fishing companies keep those bycatch that are high value finfish and process them into blocks of frozen packs and exported to overseas markets at various prices. Several respondents stated that at times, the bycatch are dumped into the water and washed ashore at their beachfronts. This mostly occur during the early hours of the morning, especially when the trawlers are fishing within 3-nautical mile zone of customary waters when locals are asleep. A community leader from Keakea village stated that the smell from the discarded fish is at times unbearable when washed to the shore, closer to villages. According to NFA (2012) the value of catch/bycatch including trash fish ranges from K3-5 per kg (USD 1 - USD 2) depending on the species. Most bycatch finfish of reasonable sizes are collected from the deck, placed on trays, frozen and then packed and brought to port and sold domestically at prices ranging from K3-5 per kilogram (NFA, 2012). Majority of coastal community respondents stated that they often purchase or exchange frozen or blocked fish trays with garden vegetables and fruits or purchase with cash ranging from K50 - K70 (USD 13 - USD 23). Some notable high value bycatch is exported overseas at US$ 3.00 per kilo according to respondents from the trawler boats. The utilization of bycatch, including trash fish, is done by locals who are able to go on-board the trawlers to obtain edible bycatch for consumption or sale at the local markets. Currently no bycatch is utilized for animal feed and pellets but the potential is there in the future with increasing aquaculture development activities taking place in the country. Importance of bycatch to locals in terms of food security is immense. The low-income earners in urban areas, especially Kerema town, utilize bycatch as food to supplement their protein and for cash. In Kerema town alone, individual women and men who sell bycatch fish can earn between K100-K400 per week (USD$ 25- USD$ 100) as demonstrated by survey findings (see table 15). This however is not the same in terms of market in local villages and door-to-door sales of bycatch in communities as the prices decrease between K50 and K20 per week.

29 | P a g e i _ G o P R e p o r t _ 2 0 1 6
Table 15. Weekly income of coastal community respondents from bycatch sales/utilization.
Income Range from Bycatch Sales per Week Frequency of respondents (N=281)
% of Total
Above 301 Kina (above USD 101) 1 0.4 201-300 Kina (USD 50-100) 22 7.8 101-200 Kina (USD 20-59) 21 7.5 51-100 Kina (USD 10-19)-100) 68 24.2 20-50 Kina (USD 5-9) 105 37.4 Consumption Only 64 22.8
Note: 1 PNG Kina= USD 0.33 (February 2016. This rate is used throughout the report. Majority of locals and provincial fisheries officers interviewed stated that most bycatch contain many species of no monetary value but high conservation value. Capture of juveniles and larger species (including turtles, sharks, rays, eels and snakes) is prominent with every haul comprising over 80% of catch. In fact, approximately 65-85 per cent of the trawl catch by weight is made up of bycatch (Evans et al. 1995; Liviko 2012). These juveniles of non-finfish bycatch are discarded into the sea while larger non-finfish and finfish are collected on-board by the community whenever trawler boats come within accessible range. Given the inability of most coastal communities to come out to sea and meet the trawl boats, most of this high value finfish is brought to Port Moresby and sold by boat crew members.

30 | P a g e i _ G o P R e p o r t _ 2 0 1 6
Figure 42.Value chain of distribution of bycatch.
Crew on board trawlers are given between 10 Kg to 50 Kg to take home depending on their position on deck. In other words, captains and engineers take larger share while deckhands and cookies take lower value per trip. This arrangement is recognised under the licensing rules and requirements enforced by NFA on fishing companies’ terms and conditions of employing local crew on its vessels. Figure 4 shows different distribution levels of bycatch from a typical haul or trip. Trawler companies have license for prawn and or lobster only but often take other high value bycatch for export, something that the GoPPF management plan can accommodate in its review process. This is confirmed by senior provincial officials as well as local fisheries officer, who have had to accept the fact that enforcement of such regulation is non-existent when resources are not adequate for intensive surveillance and enforcement.
Species composition of discards/bycatch
Table 16 denotes average percentage of marine biota that is retrieved on board as trash fish or bycatch. From this table we see that pony fish, sardines/herrings, anchovies and reef finfish are the most dominant species consisting of 7% to 20% of the 90% bycatch per haul.

31 | P a g e i _ G o P R e p o r t _ 2 0 1 6
Table 16. Bycatch species and percentage composition per haul.
Bycatch/Discards common
name.
Family % per haul
Bycatch/Discards common
name.
Family % per haul
Batfishes(Plataxspp)
Epphidae 2 Seasnake Hydrophiidae
2
Bullseyes, big eyes, glass eyes
Priacanthidae 2 Stingrays Batoidae 2
Crest fish, oar fish, deal fish, ribbon fish
Regalecidae 2 Jewfish Sciaenidae 3
Goat fish Mullidae 4 Anchovies(Thryssa)
Engraulididae
10
Groupers nei (Epinephelus spp)
Serranidae 1 Ponyfish Leiognathidae
15
Mackrels nei Scombridae 2 Hairtails Trichiuridae 2 Black pomfret such as Parastromateus niger
Carangidae 1 Grunters Theraponidae
3
Porcupine/pineapple fishes
Diodontidae 2 Catfish Arridae 3
Seaperches, snappers, sweetlips, redemperor
Lutjanidae 7 Tonguesoles Cynoglossidae
2
Sharks Carachidae 2 Pufferfish Tetraodontidae
1
Seasnake Hydrophiidae 2 Threadfinsalmon Polynemidae 2 Stingrays Batoidae 2 Lizardfish Synodontida
e 2
Jewfish Sciaenidae 3 Butterflybream Nemipteridae 2 Anchovies (Thryssa spp.)
Engraulididae 10
Trevallies Carangidae 2
Ponyfish Leiognathidae 15
Sardines/Herrings 20
Slipper lobsters or bugs (Thenus spp)
Scyllaridae 1 Squid
Architeuthidae
2
Tropical or saucer bugs (Amusium spp)
Pectinidae 1 Others (shells, crustaceans, seasnakes, rays, turtles etc
various 13
(Source: NFA, 2012)

32 | P a g e i _ G o P R e p o r t _ 2 0 1 6
Stakeholder views of enforcement, monitoring and surveillance policing Community consultative process proves that other species of commercial value such as tuna, lobster and various reef fish species are also caught besides the target prawn species. Several provincial fisheries officers from Gulf Province protested that most trawlers are given license to harvest prawns exclusively and no other species, as such there is a need for stringent monitoring by NFA and provincial fisheries monitoring officers as stipulated under the Fisheries Management Act 1998. Currently the provincial fisheries office lacks resources, funding, equipment and technology to perform their mandated roles and functions as stewards of the fishery resource within the province. Also noted is the obvious lack of communication and cohesive coordination of work between, national, provincial and district fisheries agencies for prudent monitoring and implementation of fishery management plans. Hence the provincial officers interviewed identified greater need for strengthened administrative power to implement management measures and discipline prawn trawlers that breach license specifications and management regulations habitually. Breaching of GoP prawn fishery management rules by trawlers is an occasional cause for concern amongst all stakeholders within the GoPPF area. Respondents also stated that there are signs of discarding of bycatch overboard by trawlers within or near village shores. Physical observation from survey teams on board a trawler confirmed the same. There are incidents where villagers experienced foul smell from discarded fishes and onshore landing of tonnes of discarded fish from trawlers during high tides. Most of these illegal activities occur at night and within the no-fishing area reserved for resource owners (within 3 miles off the beach). About 25 respondents indicated that they have witnessed trawler vessels within the 3 mile no take zone at some point in time. Fishing vessels have on board turtle excluder device (TED) and bycatch reduction device (BRD) gears but they are intentionally not used effectively. Given all these constraints and issues, this study has identified the need for a more prudent enforcement of management and surveillance efforts by all parties concerned with sustainable fishing in the GoP area. Gulf Provincial Fisheries Development initiatives
Administrative leaders and stakeholders of the fishing sector in Gulf province initiated a new direction to have community and the province at large benefit from its marine resource by hatching a localized management plan for fisheries. Stakeholders including NFA, Forum Fisheries Agency (FFA), Tourism Promotion Authority and Provincial officers developed through a weeklong workshop in consultation with community and resource owners a five year fisheries plan in 2015. The outcome of this plan culminated to what is now called “Gulf Provincial Fisheries Development Plan, 2016-2020”. This document can be accessed from NFA head office, or the fisheries section in Gulf Provincial Administration.
Basically the major objective and purpose of the plan according to the vision statement is to:
“Actively involve individuals and communities through co-operation and partnership to sustainably manage and develop fisheries for economic development and wealth creation to improve living standards and marine resource sustainability of Gulf people”

33 | P a g e i _ G o P R e p o r t _ 2 0 1 6
In summary, the plan is framed in the context of rich fisheries resources the province has (especially shrimp and reef fish), the strength and weaknesses of social, cultural and economic settings of the people and the opportunities, threats, challenges and issues emanating from hydrocarbon development projects within the province (GPFDP, 2015: 6).
Unfortunately, the plan lacks concrete steps to attain the objective in terms of resource and financial implementation. The prawn industry is controlled by vessels and businesses owned by foreign companies trading in partnership with individuals from other provinces and Gulf province has been missing out on direct involvement. The plan does recognize this missing link but does not provide steps to tap into the prawn industry either as a government or assist small to medium enterprises (SMEs) to have a fair stake in prawn trade.
The second missing link in the plan is its inability to recognize gender and the importance of women in the fishing industry at the domestic level. Women play a big role in fishing, selling, cleaning and utilizing bycatch; however the emphasis on assisting womenfolk is not stated clearly.
Generally on the positive side, the plan is a good initiative to have a roadmap to develop the fisheries sector from its current abysmal stage. Gulf of Papua Prawn Fisheries nets an estimated K18 million annually and as such communities of the coastal fishery area need to tap into this resource and have a fair stake in economic output annually.
Role of women Fishing is a major contributor to household livelihoods in PNG as it is in the GoP region apart from cash crop farming. While in some societies it is mainly men who fish, in others including the Gulf province both men and women participate. Men have larger average annual catch rates than women, because they are more likely to be engaged in fishing for income, to specialize in fishing, and to spend time away targeting more distant and promising habitats. Because women have more household responsibilities, they are more likely to fish for the family meal, and to stop when they have enough to feed their family, and share with relatives and neighbors. Both men and women sell catches, fresh from roadside coolers, smoked for markets, and in ‘takeaway’ forms as prepared meals. Women work in marketing fish at all levels, from roadside markets to the main town markets. Men also take part in selling but to a lesser extent compared to women. Findings of this survey is consistent with roles of men and women in almost all major maritime societies with the country. Information gathering process gave prominence toward views of womenfolk in the target communities by involving female enumerators as well as directing specific questions to womenfolk. Responses to guided questionnaire interview and focus group discussion shows 35% representation from women and girls while 65% of male folks participated toward overall outcome of the survey. One of the main reasons why males dominated the sessions was the fact that communities are led and organized by men folk than women. Given the nature of such interviews males are head of households and in most cases took up the task of responding to questionnaire more frequently. We also note that Gulf province like most communities in Melanesia are male dominated and women are only allowed free speech when specifically requested.

34 | P a g e i _ G o P R e p o r t _ 2 0 1 6
In this survey, the enumerators and survey team requested specifically to interview women who are actively involved in fishing; thus the turnout of 97 female respondents from a total of 281. It has been therefore noted that women:
• constitute an important aspect of labor in fishing traditionally (however in this aspect the process of accessing bycatch from prawn trawlers is mostly male oriented given the difficult task of travelling out to sea to meet trawlers);
• do most of fish food preparation and marketing at local markets; • combine roles of food garden tending and undertake fresh water and marine fishery for
household consumption. This includes collecting shells mud crabs, and other fringe marine biota.
• work without paid salary in fishing sector unlike other provinces whereby there are fish canning and processing plants that employ more women than men (such as Madang and Lae)
• do not have a big say in expenditure of family income from fishing as most of the income they generate from fishing is mutually decided by male partners. This however does not mean women are not spending what they earn from fish selling; the expenditure is often for family use rather than for self despite occasional misuse by menfolk.
5.0 Conclusion and Recommendations
Conclusion Communities of the GoP have long been in contact with prawn trawlers and have associated with the prawn fishery industry since 1969. The level of participation is something outside the scope of this study but findings from this survey indicate that there is much to be desired in terms of impact on livelihood of coastal communities either directly or indirectly from this resource. The annual export earnings ranging from K5 Million to K18 Million kina (USD 1.5 Million to USD 4.5 million) can be a catalyst to social and economic advancement of the coastal people. As observed in this study, there are a total of 25 819 households in Gulf Province of which 18 009 households are within Kerema District. Furthermore 107 231 people live in Kerema district which comprise 79% of the province’s total population. In this survey, 281 individuals from coastal communities were interviewed in addition to other stakeholder respondents. It therefore can be deduced that the 21 coastal communities covered in this survey have similar responses to questions posed but differing interest in fishery (bycatch utilization opinion) due to proximity of their village to the coast. Most respondents have an average of 6 children while the respondents’ income level is at less than K20-K50 per week from fishing (105 respondents; 38%). A good portion (44 respondents) earn between K200 and K300 weekly (about USD 30 to USD 90) from bycatch utilization thus

35 | P a g e i _ G o P R e p o r t _ 2 0 1 6
the potential is there for others to maximize. Only one respondent earns between K300 and K400 (USD 100) weekly however this respondent had the advantage of support from family unit who utilize their boats and invest in fuel to acquire bycatch from trawlers out in the open sea. Individuals in communities along the coast have education level below grades 10 completion and a sizable percentage of 43% of the respondents have reached only grade 8 (Upper Primary School) so far. This is attributed to distance from higher education institutions apart from the elementary schools that are located in every village. Thirty-five percent of women folks in this survey have shown much desire for further involvement in fishing opportunity but to date there are no programs and initiative to assist women. There is a total gender imbalance in business opportunity in that more women do household chores than those that involve in small to medium enterprise. Interviews with provincial administration staff and community have pointed to a conservative approach to the fishery but level of participation in resource utilization is still lacking. The GOPPF industry needs a holistic review at the national and provincial level to incorporate changes that might allow participation of coastal communities fully. Social and economic wellbeing potential is there, demonstrated by the level of income generated through bycatch utilization but the management approach of the prawn industry does not support local involvement as it is. Several areas of deficiency noted during the survey in terms of opportunity for women is similar to womenfolk in other coastal province. Most opportunity for women’s economic improvement is minimal or non-existent. Women in the GoP lack holistic support from fisheries officials both nationally and locally. This is due to the fact that most women are not accessing financial assistance from various government and donor grants to take part in small to medium enterprise (SME). Almost all of the women interviewed (100%) have no experience of accessing loan and donor funding for fishing related business. Opportunity is there for women to be trained in terms of aquaculture and business skills upgrade but there is so much to be desired in terms of initiatives from local development leaders to this effect. Recommendations:
Initial assessment of socio-economic situation of the GoP Prawn Fishery resource sites demonstrate that there is opportunity for community progress but current management regimes do not encourage such. The level of participation in bycatch utilization is determined by certain factors, some of which include: “distance of village to the coast”, “contact with prawn trawlers and crew by individuals”, ability of individuals to meet the cost of transport using motorized boats to meet trawlers at sea” and many other associated factors. These impediments disassociate most individuals from actively utilising bycatch for economic gain and consumption. It is almost a niche market for those who are able to acquire bycatch and discards from trawlers (an opportunistic business so to speak). Given this scenario the study was able to determine level of participation, income, social standing of each respondent and ability of respondents to partake in bycatch utilization.

36 | P a g e i _ G o P R e p o r t _ 2 0 1 6
Furthermore local officials were able to provide insights into how they perceived the prawn industry to operate given current management regimes. From this analysis the following recommendations are outlined to help further the understanding of the social and economic context of GoP communities and their involvement in prawn industry thus far:
a thorough review of GoPPF Management plan to accommodate participation of locals in fishery business through public-private partnership;
consolidated and a holistic program to be devised by the Gulf Provincial government and partner agency (such as NFA) to assist women in fisheries business such as SME assistance. This can be done through micro-financing initiatives in partnership with trawlers or processers.
devise a separate study or enquiry to list and determine environmental impacts to coastal marine ecosystem from logging, mineral exploration and other extractive industry operations upstream other than extensive fishing.
fisheries officer within the province to be empowered and obtain resources that will assist them to enforce management rules on trawlers traversing the 3 nautical mile no-take zone. Also the ban period seem to be ignored by certain operators; hence, officers to be resourced to strictly implement ban periods. This can be achieved through a partnership arrangement with local community leaders who can be equally resourced.
selected individuals from communities along the GoP coastline to be utilized as
fisheries observers during trawling season. Undertake in-depth/further study into household income strictly focused on marine
resource in comparison to other income sources of coastal communities of GoP to determine food security and sustainability of marine resources.
6.0 Limitations of the study There are several factors that affect the way this study has been carried out; however the factors are mostly associated with localized issues that do not have a one off solution. Firstly interview questionnaires distributed to trawler crew did not return favorably as expected (18 returned from 50 distributed). This is a common problem faced in such study where enumerator does not provide guided interview. Gulf of Papua is a vast area with almost 9000 km of coastline that the survey team cannot reach within the given timeframe. Large rivers, swamps and rough seas impede progress of the study in terms of coverage. Communities closest to the coastline are able to access trawlers for bycatch;

37 | P a g e i _ G o P R e p o r t _ 2 0 1 6
hence their view on management issue differ from those who live away from the coast. Comparing the two sets of views is not appropriate due to the fact that discards and bycatch do not have economic impact on communities away from the coast apart from it being a source of protein when bought at the market/roadside. Enumerators overlooked certain questions when they are rushing with time or when confronted with possibility of rain and threat from local drunks who occasionally approach the survey team. Finally a stakeholder workshop or round table consultation is needed to complete information gathering process as planned but this is yet to be done before the final report is produced. One of the major problems in the survey was that the actual number of respondents expected to be covered could not be achieved due to impossible access to some coastal communities given time and resources. Transportation challenges, rough weather including rough seas, logistic issues and communication problems had impeded the survey target communities in one way or another. Nevertheless a total of 281 questionnaires were filled out of the 300 targeted (95%) for GoP coastal community, 18 out of 50 vessel crew were interviewed (45%), and 22 government officials. Overall given the challenges a substantial portion of stakeholders within the Gulf province and its coastal communities were consulted in this exercise.

38 | P a g e i _ G o P R e p o r t _ 2 0 1 6
References
Department of Works (2003). Papua New Guinea Trans-Island Highway Construction Project Phase I-II: Malalaua Bridge Study. Department of Works, Port Moresby, PNG.
Evans C.R, Opnai J.L & Kare B.D (1995). Research and management of the industrial prawn fishery of the Gulf of Papua. South Pacific Commission SPC/FAA workshop on the management of South Pacific inshore fisheries. Noumea, New Caledonia. SPC/Inshore Fish. Mgmt./BP 28. 1 (65); pp-1-32. GoPNG (2009). Papua New Guinea Vision 2050. Department of Prime Minister, Waigani, Port
Moresby, NCD. GoSA (2014).Management plan for the south Australian commercial Spencer Gulf prawn fishery. The South Australian Fisheries Management Series 67. Australia. GPG (2015), Gulf Province Provincial Integrated Plan 2012-2015. Kerema, GP. GPG (2015). Gulf Provincial Fisheries Development Plan, 2016- 2020. Kerema, GP. Liviko I (2012). Gulf of Papua Status Report. REBYC-II CTI. FAO/GEF Regional Workshop on
Work Planning – Year 1 REBYC-II CTI 6-9 November 2012, Bangkok, Thailand. Matsuoka T (1995). Fisheries development policy and education in Papua New Guinea. South
Pacific Study, 15: 2; pp 75-96 National Fisheries Authority of Papua New Guinea Website http://www.fisheries.gov.pg/FisheriesIndustry/TunaFishery/tabid/104/Default.aspx National Statistics Office (2011), 2011 Census Final Report. NSO, Port Moresby. NFA (1995). National Report on by-catch management and reduction of discards. NFA, Port Moresby. NFA (2002). Information on fisheries management in Papua New Guinea. NFA Port Moresby. NFA (2007). Socio Economic Survey of Small-Scale Fisheries in Morobe Province, Port Moresby. NFA (2012). Information on fisheries management in Papua New Guinea. NFA Port Moresby
Pernetta J. C and Hill L (1981). A review of marine resource use in coastal Papua. de la Société des océanistes, pp. 175-191. doi :10.3406/jso.1981.3059.accessed via<http://www.persee.fr/doc/jso_0300-953x_1981_num_37_72_3059>

39 | P a g e i _ G o P R e p o r t _ 2 0 1 6
Appendices
Appendix A: Study Terms of Reference
Food and Agriculture organization of the United Nations
Terms of Reference for Consultant /PSA
Minimum number of years of relevant experience required: 1 year ; 5 years ; 12+years Name:
Job Title: Socio-Economic Consultant
Division/Department: FAO RAP
Programme/Project Number: GCP/RAS/269/GFF
Location: Port Moresby, Papua New Guinea.
Expected Start Date of Assignment: 30 September 2015 Duration: 70 days (30 September – 31 December 2015)
Reports to: Name:
Mr Ken Shimizu (Programme Officer) Ms. Susana Siar, FAO, Rome Mr. Rick Gregory (REBYC-II CTI)
Title:
Program officer PNG Socio-economic Advisor REBYC-II CTI Regional Coordinator
G l D i i f k( ) d bj i b hi d The four-year REBYC-II CTI project started in 2011. The project objective is to contribute to the sustainable use of fisheries resources and healthier marine ecosystems in the Coral Triangle and Southeast Asia waters by reducing bycatch, discards and fishing impact of trawl fisheries. The Project is focusing on multispecies bottom trawling, where bycatch issues are amongst the most serious, with significant effects on ecosystems and livelihoods The project is implemented in Indonesia, Papua New Guinea, Philippines, Thailand and Viet Nam. Papua New Guinea has had many challenges in implementation of the Project. The concerns and challenges facing the Sector are related to the efficient economical operation of the trawl fishing fleet; moving towards Marine Stewardship Certification; Monitoring Control and Surveillance of the fishing fleet; the dependency of coastal communities on bycatch from the trawlers, and the implementation of fisheries regulations and laws. A project coordination mission was undertaken in January 2015 with the purpose of reviewing and resetting the project work plans, taking into account the remaining time period of the Project. The Gulf of Papua (GOP) Prawn Management Plan, first drafted in 1998, is in need of review and updating. However, key biological, sociological and economical information to do this are not yet available. The proposed CSIRO funded project is expected to provide useful biological information relating to trawl bycatch but not address social or economic needs. Although the CSIRO Project timing does not fit so well with REBYC, there is still considerable scope for synergy and cooperation. To compliment the work of NFA and CSIRO, it is proposed that the REBYC project support; a social/cultural study of fishing communities living in the GOP trawl fishing crescent will be carried out.

40 | P a g e i _ G o P R e p o r t _ 2 0 1 6
The objectives of the socio-economic study are to;
1. Design and implement a socio-economic study in the Gulf of Papua crescent to understand the stakeholders in the trawl fisheries supply chain, their dependence on trawl fisheries, and how management measures may have an impact on their livelihoods and food security.
2. Review the performance and current relevance of the GOP Prawn Management Plan from the perspective of the ecosystem approach to fisheries management and make recommendations on how the human well-being component can be integrated or strengthened into a new GOP plan.
Therefore, under the overall guidance of the FAO Programme Officer in PNG, direct managerial supervision by the Project Regional Coordinator (PRC) and technical supervision by FAO Technical Officer Ms. Susana Siar from FIRO/FAO, and together with/taking advice from the Papua New Guinea national project counterpart and related national departments/offices, the socio-economic consultant will undertake the following main tasks as follows: 1. Develop a detailed and harmonised work plan for implementation of the consultancy, to be agreed with the FAO
technical specialist and consultants and REBYC Regional project staff;
2. Collect all available information on GOP fishing communities. This would be done through a thorough review of relevant publications, journals, studies and grey literature;
3. Identify the data gaps and design a socio-economic study to address these data gaps, including:
a. Which stakeholder groups are dependent on trawl fisheries, their demographic characteristics and socio-economic status;
i. Fishers ii. Communities
iii. Resource owners/landowners iv. Fisher cooperatives/associations v. Village elders/community leaders
vi. Boat operators vii. Licensed trawl operators
viii. Bycatch resellers ix. Local level governments x. District fisheries officers
xi. Provincial fisheries officers xii. Other relevant stakeholders (please specify)
b. What is the relationship among the different stakeholder groups dependent on the trawl fisheries (including conflicts);
c. What is the dependence of different stakeholder groups on trawl fisheries livelihoods (from harvesting, processing and marketing), e.g. for income, food security, nutrition, and what other sources of livelihoods do they have;
d. What is the impact of management measures such as closed seasons on these stakeholder groups; e. What is the gender dimension of the dependence on trawl fisheries livelihoods – for food security,
nutrition, income – and what is the social importance of women; f. What other economic activities are dependent on trawl fisheries and what is their degree of
dependence; g. What factors would affect the demand on trawl fisheries products and what are the potential
impacts on sustainability? h. What are the characteristics of the trawl fisheries bycatch and what are the arrangements regarding
the bycatch; i. Arrangements regarding use of fishing grounds
ii. Perceptions regarding ownership of the bycatch iii. Who has access to the bycatch and how iv. How much bycatch (in kg) do they get per trip and what is the value v. How is the bycatch used and distributed
vi. Where is the bycatch marketed – including local and outside markets i. What is the dependence on bycatch of the different stakeholder groups – for income, food security,
nutrition; j. What are the characteristics of discards;
i. Species composition of discards ii. Amount and value

41 | P a g e i _ G o P R e p o r t _ 2 0 1 6
iii. Reasons for discarding iv. Potential use of discards
k. What are the catch sharing arrangements; l. How important is the low value catch for the crew; m. What is the relationship of trawl with other fisheries – which fishing gears coincide in time and
space with trawlers and the impact of trawling on those fisheries; n. What other activities and projects would have an impact on the trawl fisheries and how? o. What other concerns do stakeholders have regarding their fisheries? p. What is the economic performance of the trawler fleet?
4. Prepare guide questions, e.g. for key informants, focus group discussions and survey and translate these into the
local language;
5. Pre-test the survey questions, finalize these based on the results of the pre-test, and prepare sampling design for the survey;
6. Carry out the socio-economic study, analyze the data gathered, make recommendations based on the findings, and validate and present the findings and recommendations to the relevant stakeholder groups;
7. Prepare a draft report and powerpoint presentation in advance of the Regional Socio-economics Workshop planned for Da Nang, Vietnam 26-30th October 2015;
8. Upon completion of the study, organise a workshop for NFA and other interested parties to present and discuss
the main findings; 9. Prepare a comprehensive detailed report at the end of the assignment. With recommendations for follow up work
and alternative livelihoods (this option should be discussed with the communities once a clear picture of the extent and impact of by catch on the communities is understood. Case studies that highlight the relationships between trawler operators and fishing communities should be highlighted.
k f i di Expected Outputs: Draft report and powerpoint presentation on the findings of the study Completed Consultancy report
Required Completion 19 October 2015 15thDecember 2015
QUALIFICATIONS A higher degree in sociology, anthropology, social science or a related field. At least 5 years experience working in conducting socio economic and cultural studies in PNG preferably relating to fishing communities. Good organizational, managerial and writing skills required.
V2 09/10

42 | P a g e i _ G o P R e p o r t _ 2 0 1 6
Appendix B: Questionnaire 1. Coastal Community
Appendix B. VILLAGE INTERVIEW QUESTIONNAIRE
Individual information questionnaire form (This questionnaire can be used for individuals for market survey for, Fisher/Resource owner/Community elder/Association member). Name of Respondent and or/organization: _________________________________ID No._____ Name of Interviewer: ____________________Date of interview: _____, 2015 Time: ____:____ Interview site: (1) Malalaua............ ………Residential/Village Location……………. GPS Loc:………. (2) Kerema............................ Residential/Village Location…………… GPS Loc………. (3) Kikori/Ihu.............. Residential/Village Location…………… GPS Loc……… Socio-economic Characteristics 1. Age: 1- Less than 15 years (2)- 15-24 (3)- 25-34 (4)- 35-44 (5)- 45-54 (6)- 55 years old and over 2a. Marital Status: 1- Married,2- Never married 3- Divorced/separated 4- Widow 2b. Number of Children?___________ 2c. Head of household: 1- Respondent ,2- Spouse 3- Other (specify_________________) 3. Religion/Denomination____________________ 4. Educational Level (highest): 1-Did not attend school 2- Some primary school –below grade 6 3- Primary leaving certificate-grade 6/8 4- High School dropout (9/10) 5- Secondary school certificate (Grade10/12) 6- Technical School/Vocational/PETT 7- College/Diploma 8- University degree 9- Other (Specify)_________________ 5. What is the size of the Respondent’s household: __________people 6. Informal Sector Small Business Engagement Information: 6a What other informal sector small business(s) does the Respondent engage in at times other than Fishery (Circle all that apply)? 1- Work full time 2- Cattle keeping 3- Market/roadside stall 4- Vegetable 5- Tucker shop 6- Fruit 7- Recycling (can/iron etc) 8- Buai and Daka 9- Poultry keeping 10- Vegetable gardening 11- Piggery 12- Artifact making 13- Floriculture 14- Handicraft 15- Fish selling 16- Weaving 17- Tailoring 18- Baking 19 - Other ( ____________) Circle the most important above in terms of alternate income generation 6b. If involved in more than one activity, which provides the most income? _____________________________________________________ (List in order of income value) 7. Access to Bycatch/Discard Supply. 7a. Methods? (1). Trawlers, (2). Relatives on board trawlers, (3). Port Moresby/Kerema Town (explain)_____________________ (4). Purchase from Others (explain)_____________________________ (5). Self-funded (explain)_________________________________ (6). Other sources (Explain)___________________________________ 7b. How do you sell the bycatch? (1). Market (2). House front (3). Outside Office (4). Roadside (5). PMV/Bus stops (6). Inside office. (7). Other (specify)
I Mr/Mrs/Ms._____________________ a researcher tasked by the National Fisheries Authority (NFA), in association with the Food and Agriculture Organization (FAO), carrying out a study on the socio-economic impact of Prawn fishery in the Gulf of Papua wish to collect some information regarding prawn fishery. The information you give us will help in designing appropriate interventions to provide current scenario of impacts on the lives of people involved in prawn fishery both in the formal and informal sector. This survey outcome will also help to redesign approaches to better regulate the industry in the near future in terms of bycatch and discard management. All the information you give will be kept strictly confidential and used for the purpose of this survey only.

43 | P a g e i _ G o P R e p o r t _ 2 0 1 6
7c. How Much do you earn on average_____Daily? _____weekly?______Monthly?______ 7d. How much do you spend daily/weekly/monthly to buy the bycatch (fish supply) from your sources ________/= per day _________/=per week _________/= per month 7e. who determines use of income generated from your sales (s)? 1- Decision is made by myself 2- My spouse makes the decision 3- Both 1 & 2 4- Other (Specify _____________) 7f. what do you do with the income - ? ______________________________________________________________________________ 7g. Do you have contacts with Trawlers (a) within Gulf Province: Has Contact? 1- Yes 2- No Type of Contact 1- Trawler Crew 2- PMV driver/Crew 3- Boat Operators 4- Local fishermen 6- Others specify______________ Do you have contacts with Trawler crew (b) outside Gulf Province? Has Contact ? 1- Yes 2- No Type of Contact 7- Trawler Crew 2- PMV driver/Crew 3- Boat Operators 4- Local fishermen 6- Others specify______________ 7h.What are your major options and thoughts about the assistance from provincial/national fisheries offices-(tick all applicable and circle most important?)
1- Improve existing markets in Gulf 2- Continue the current control measures 3- Regulate foreign boats operating within local waters- 4-Improve extension services for fishers, 5- Others (Specify)________________________________________________________.
2- 7i. Do you have any specific thoughts with the way ban periods are implemented? _____________________________________________________________________________ 7j.How can these issues be resolved (trace answers to each of the options above)? _____________________________________________________________________ _____________________________________________________________________ End. Note: Use note pad provided for additional notes picked up from responses that are outside the questions asked.

44 | P a g e i _ G o P R e p o r t _ 2 0 1 6
Appendix B. TECHNICAL OFFICERS WITHIN FISHERY SECTOR Government Agencies /LLG Employers/Fisheries Officers. Biodata: Name of respondent: ____________________ 1. Age: 1- Less than 15 years (2)- 15-24 (3)- 25-34 (4)- 35-44 (5)- 45-54 (6)- 55 years old and over 2a. Marital Status: 1- Married,2- Never married 3- Divorced/separated 4- Widow 2b. Number of Children?___________ 3. Educational Level (highest): 1-Did not attend school 2- Some primary school –below grade 6 3- Primary leaving certificate-grade 6/8 4- High School dropout (9/10) 5- Secondary school certificate (Grade10/12) 6- Technical School/Vocational/PETT 7- College/Diploma 8- University degree 9- Other (Specify)_______________________________________ 4. Organisation/Association/Employer________________________________________ 4a. Position he/she holds in Organisation: ______________________ 4b.Number of years working in Organization/position. ______________________
4c..How often do you oversee extension service to fisher communities per month/year?............................................
4d.. Is there penalties for ban policy infringement...............................................................? Yes, □ No, □ don’t know □
4e. How does the Organization monitor trawlers handling of bycatch/discards ………………………………………………......................................................?
4f. Has any trawling boat been disciplined for infringing policy ? Yes, □ No, □ 4g.. If so how many since you started work>………..... 5. How can the NFA improve on regulating trawlers/fishers involved in the prawn industry? (Provide ideas below)______________________________________________________________________________________________________________________________________________________ 6. Does the organization provide adequate resources for monitoring and improving livelihood of people
involved in fishery?... Yes, □ no, □............if so how can NFA assist with improved services to fishers/co-ops?________________________________________________________________________________________________________________________________________________________ 7. Did you receive any formal in-house or external training to enhance your work? Yes/No……If so specify type and year of training____________________________________________________________________________________________________________________________________________________ 8. Is there ways locals can improve and involve in bigger scale prawn trawling and fishery?
I Mr/Mrs/Ms._____________________ a researcher tasked by the National Fisheries Authority (NFA), in association with the Food and Agriculture Organization (FAO), carrying out a study on the socio-economic impact of Prawn fishery in the Gulf of Papua wish to collect some information regarding prawn fishery. The information you give us will help in designing appropriate interventions to provide current scenario of impacts on the lives of people involved in prawn fishery both in the formal and informal sector. This survey outcome will also help to redesign approaches to better regulate the industry in the near future in terms of bycatch and discard management. All the information you give will be kept strictly confidential and used for the purpose of this survey only.

45 | P a g e i _ G o P R e p o r t _ 2 0 1 6
9.Are relevant support agencies of the government doing enough to assist local initiatives such as providing
access to credit facilities for fishers?.....Yes, □ No, □ If No…Suggest ways government agencies can assist in this regard…………………………..
10. Is your organization involved in assisting Women attain better skills and training on fishing and marketing. Yes, □ No, □
10a. If Yes Provide Details of programs________________________________________________________________________________________________________________________________________ 10b.If No Provide details of any future plans/programs in this regard___________________________________________________________________________________________________________________________________________

46 | P a g e i _ G o P R e p o r t _ 2 0 1 6
Appendix C: Trawl Boat Crew
TRAWL FISHERIES SOCIO-ECONOMIC INTERVIEW GUIDE
(For Owners/Operators, Boat Captains, Master fishermen and Crew) QUESTANNAIRE FORM 3
RESPONDENT’SPERSONAL INFORMATION: Full Name:_ ______________________________________________________________ Suburb/City: __________________________________________________________
Village:__________________________________________________________________
Age: _____________ Sex: ____________ Civil Status: ____________
Religion: _______________ Dialect/s Spoken: ________________________ No. of Years Engaged in Trawl Fishing:________
I. HOUSEHOLD INFORMATION: No. of Household Members: _____________
Household Member
Relation
Gender
Age
Types Of Livelihoods
Specify Months
Ave. Monthly Income
OTHER SOURCES OF MONTHLY INCOME INCLUDING REMITTANCES? HOW MUCH?
INCOME SOURCES AMOUNT (P)

47 | P a g e i _ G o P R e p o r t _ 2 0 1 6
II. EDUCATIONAL BACKGROUND: N Never Attended School Vocational Elementary Level College Level Elementary Graduate College Graduate High School Level Post Graduate High School Graduate III. ARE YOU A MEMBER OF THE FOLLOWING?
Community/Religious Organization: ___________________________________ Women Organization: _______________________________________________ Fisher folk Association: _______________________________________________ Fisher folk Cooperative: ______________________________________________ Others:____________________________________________________________ HAVE YOU AVAILED OF ANYCREDIT FACILITY? YES NO
IfYES, Please Specify_____________________________________________________
IV. HAVE YOU AVAILED OF ANY EXTENSION SERVICES FROM:
A. GOVERNMENT YESNO
If NO, Why None? _________________________________________________________
If YES, What Agency & Services? ____________________________________________
B. NON-GOVERNMENT ORG. YES NO
If YES, What Agency & Services? ____________________________________________
V. TYPES OF TRAWL GEAR/S USED?
Commercial Trawl No. of Fishing
Gears Municipal (Baby) Trawl No. of Fishing
Gears
Squid Trawl

48 | P a g e i _ G o P R e p o r t _ 2 0 1 6
Fish Trawl Fish Trawl Others, Specify
No. of Fishermen (Officers and Crew) onboard?: ____________________ VI. ENGINE BRAND AND HORSE POWER:
Engine Brand: ________________________Horse Power: ______________________
VII. NAME AND MEASUREMENT OF BOAT. Pls. indicate unit of measure.
NAME OF BOAT
LENGTH
BREADTH
DEPTH
VIII. WHAT IS YOUR PARTICIPATION IN TRAWLFISHERIES?(one or more answers)
Owner Masterfisherman Captain Crew Others, Specify _________________
IX. DISTRIBUTION OF HOUSEHOLD EXPENSES:
EXPENSES AMOUNT (P) Food Health Education Shelter Transportation Billings: Electricity Mobile Phone Load Water Cable
X. CATCH AND EFFORT DATA:

49 | P a g e i _ G o P R e p o r t _ 2 0 1 6
Ave. No. of Hauls/Day (24 hrs.)
Ave. No. of Fishing
Days per Trip
Ave. Catch per Trip
(kg)
Ave. Fish Discard per Trip
(kg)
Ave. Debris per
Trip
No. of Average Trips per
Month
No. of Fishing Months
per Year
WHAT ARE THE CATCH ARRANGEMENT/SHARING SYSTEM?
Net Income % Catch % Owner
Crew
XI. HOW MUCH FISH DO YOU GET FOR HOME CONSUMPTION PER TRIP?
______________ kg. XII. WHERE IS YOUR USUAL FISHING GROUND? FISHING GROUNDS
DOMINANT FISH CAUGHT
XIII. BASED ON THE AVERAGE CATCH PER TRIP, PLS. INDICATE THE FOLLOWING:
:
Type Species Price Range Total Weight (kg)
Fish Trawl
Reject

50 | P a g e i _ G o P R e p o r t _ 2 0 1 6
Shrimp Trawl
Reject
Squid Trawl
XIV. COST BENEFIT ANALYSIS: a. Fixed Investment:
ASSETS
YEAR ACQUIRED/YEAR
BUILT
PRICE (P)
ECONOMIC LIFE (YEAR) HOW LONG
CAN YOU USE YOUR ASSET?
Boat
Gear
Equipment Fish box Fish tubs Styron foam Mobile phone GPS Compass Navigational Maps/Charts Handheld Radio Life Saving Devices Life Buoy
TOTAL b. Operational and Marketing Costs per Trip:

51 | P a g e i _ G o P R e p o r t _ 2 0 1 6
ITEMS PRICE (KINA) /TRIP OR OPERATION
Fuel & Lubricantes
Crew Share
Laborers Wage (at port, market, etc.)
Manténganse Costa
Ice Cost
Transportation Cost
Food Provision Cost
Cooking Paraphernalia
TOTAL
c. Other Expenses:
ITEMS AMOUNT MARINA Registration Fees BFAR Commercial Fishing Vessel/Gear License Municipal Boat and Gear License Boat Maintenance Cost (yearly) Otero Incidental Expenses
TOTAL
XV. WHAT EVENT AND ACTIVITIES WOULD AFFECT YOUR TRAWL OPERATION? WHY?
Events/Activities Explanation Typhoon Southwest Monsoon Northeast Monsoon
Operations of Law Enforcement LocalMarket Price
Fuel Price Competition with Other Fishing Gears Fiestas and Other Social Events Seasonality
Red Teide Incidente
Strict Compliance of JTEDs

52 | P a g e i _ G o P R e p o r t _ 2 0 1 6
Health (Operator & Crew)
Politics
Mechanical Breakdown
Others
XVI. OTHER IMPORTANT QUESTIONS RELATIVE TO FISHERIES ACTIVITIES OF THE
RESPONDENTS.
1. What is your perception on the status/condition of your fishing ground? _________________________________________________________________________ _________________________________________________________________________
2. What are the problems and recommendations relevant to fishing activities?
PROBLEMS RECOMMENDATIONS
3. What fishery law or regulation do you know that affects your fishing?
_________________________________________________________________________ ________________________________________________________________________
4. What are the benefits and other household amenities gained from your trawl fishing? _________________________________________________________________________ ________________________________________________________________________ ________________________________________________________________________
5. Is your income from trawl fishing enough to sustain your daily family needs? Why? _________________________________________________________________________ ________________________________________________________________________
6. Would you like to shift or retain your fishing gear? If yes, what gear? If no, why not?
________________________________________________________________________ _________________________________________________________________________

53 | P a g e i _ G o P R e p o r t _ 2 0 1 6
7. What measures do you practice and equipment you have to ensure your safety at sea? _________________________________________________________________________ ________________________________________________________________________ _________________________________________________________________________
8. Are you willing to take the debris you collected into port for proper disposal? _________________________________________________________________________ ____________________________________________________________________ End of Interview:
Name of Interviewer: _________________________________ Date: _______________