Quilon Limestone (Kerala Basin/India) - an archive for Miocene Indo-Pacific seagrass beds

INTERNATIONAL UNION FOR CONSERVATION OF NATURE
Socio-economic survey on the importance of seagrass beds to coastal communities in Kampot Province, Cambodia
Building Resilience to Climate Change Impacts in Coastal Southeast Asia (BCR)
Agne Kaarlep

Ria
The designation of geographical entities in this
book, and the presentation of the material, do not
imply the expression of any opinion whatsoever
on the part of IUCN or the European Union
concerning the legal status of any country,
territory, or area, or of its authorities, or
concerning the delimitation of its frontiers or
boundaries. The views expressed in this
publication do not necessarily reflect those of
IUCN, the European Union or any other
participating organizations.
This publication has been made possible by
funding from the European Union.
Published by: IUCN Asia in Bangkok, Thailand
Copyright: © 2014 IUCN, International Union for
Conservation of Nature and Natural Resources
Reproduction of this publication for educational or
other non-commercial purposes is authorized
without prior written permission from the copyright
holder provided the source is fully acknowledged.
Reproduction of this publication for resale or other
commercial purposes is prohibited without prior
written permission of the copyright holder.
Citation: Kaarlep, A. (2014). Socio-
economic survey on the importance of
seagrass beds to coastal communities in
Kampot Province. Thailand: IUCN. 46 pp.
Cover photo: © IUCN/Agne Kaarlep
Edited by: Ria Sen
Layout by: Ria Sen/Nguyen Thuy Anh
Produced by: IUCN Southeast Asia Group
Available from: IUCN Asia Regional Office,
63 Soi Prompong, Sukhumvit 39, Wattana
10110 Bangkok, Thailand
Tel: +66 2 662 4029
www.iucn.org/building-coastal-resilience
Acknowledgements
Sincere gratitude goes out to the research team members Mr Vanny Lou from IUCN Cambodia,
Mr Seila Voen from the Fisheries Administration Cantonment, and Ms Soriya Minhchan from the
Department of Environment of Cambodia; whose contribution and dedication were integral for
the success of the entire research process.
The author would particularly like to thank Mr Sar Sorin, Head of the Kampot Fisheries
Administration Cantonment; Mr Suy Thea, Director of the Department of Environment; and H.E.
Mr Saut Yea, Deputy Governor of Kampot Province; whose support and expertise were so vital
for carrying out this study.
Most importantly, the research could have not been successful without the support and active
participation of village chiefs, community fishery chiefs, and inhabitants of the studied villages in
Kampot Province.
Foreword
Sea-grass meadows are incredibly important coastal ecosystems. They provide spawning and
nursery areas for many species, sequester large amounts of carbon and provide significant
support to local livelihoods. The coastline of Kampot Province in Cambodia hosts one of the
most important seagrass areas in Southeast Asia, but so far is relatively unknown and has not
been subject to any in-depth study. Its importance and value to local livelihoods, and its
significance in terms of climate change mitigation and adaptation are not properly understood,
and are consequently not sufficiently taken into account in development planning. Large scale
development projects with direct impacts on sea-grass such as port and harbor construction are
already underway and are rapidly destroying and degrading significant areas of this precious
resource before its real value to the people of Kampot Province and the rest of Cambodia are
fully understood.
Kampot is one of eight Provinces in three countries selected for pilot activities in the “Building
Resilience to Climate Change – Coastal Southeast Asia” Project (BCR) funded by the EU and
implemented by IUCN and partners.
This report is the second in a series of linked reports looking at the biological condition, socio-
economic importance and conservation management priorities for Kampot sea-grass, in the
broader context of overall coastal spatial planning of Kampot Province.
Table of contents
Executive summary ................................................................................................................11
I. Introduction ..................................................................................................................12
II. Objectives of the study ................................................................................................12
III. Methodology .................................................................................................................13
3.1 Study design and data collection .................................................................................13
3.1.1 Participatory Rural Appraisal ................................................................................13
3.1.2 Household survey ................................................................................................15
3.2 Data analysis ..............................................................................................................15
3.3 Limitations ..................................................................................................................15
IV. Study area .....................................................................................................................16
4.1 Kampot Province ........................................................................................................16
4.2 The seagrass ecosystem ............................................................................................17
4.3 Management of seagrass and fishery resources .........................................................18
4.4 Village profiles ............................................................................................................20
4.4.1 Chang Houn Village .............................................................................................21
4.4.2 Rolous Village ......................................................................................................22
4.4.3 Trapeang Sangke Village .....................................................................................22
4.4.4 Koh Kreusna Village ............................................................................................22
V. Results of the study .....................................................................................................23
5.1 Demographic indicators of the respondents ................................................................23
5.1.1 Age ......................................................................................................................23
5.1.2 Marital status .......................................................................................................23
5.1.3 Religious affiliation ...............................................................................................24
5.1.4 Education .............................................................................................................24
5.1.5 Family size ...........................................................................................................24
5.1.6 State of settlements and land ownership ..............................................................25
5.1.7 Livestock ownership .............................................................................................25
5.1.8 Monthly income and expenditure .........................................................................26
5.1.9 Loans ...................................................................................................................26
5.2 Occupational distribution .............................................................................................27
5.3 Dependence on seagrass ...........................................................................................28
1
5.3.1 Fishing practices ..................................................................................................28
5.3.2 Fishing grounds by importance ............................................................................31
5.3.3 Main income generating species ..........................................................................32
5.3.4 Perceptions of the value of seagrass ...................................................................34
5.4 State and changes in fishery resources ......................................................................35
5.5 Drivers of change and proposed solutions ..................................................................37
5.5.1 Development activities, loss and degradation of habitat .......................................37
5.5.2 Disputes over fishing areas ..................................................................................39
5.5.3 Use of illegal fishing devices ................................................................................39
5.5.4 Increase in fishermen ...........................................................................................39
5.5.5 Low capital and increasing costs ..........................................................................40
5.5.6 Climate change ....................................................................................................40
5.6 Future outlook .............................................................................................................40
VI. Findings ........................................................................................................................42
VII. Recommendations .......................................................................................................44
VIII. References ....................................................................................................................45
List of abbreviations
ACLEDA Association of Cambodian Local Economic Development Agencies
AmK Angkor Microfinance Kampuchea
BCR Building Coastal Resilience
CDC Council for Development of Cambodia
CwDCC Child and Women’s Development Center of Cambodia
CFi Community Fishery
DANIDA Danish International Development Agency
DFID UK Department for International Development
DoE Department of Environment
EIA Environmental Impact Assessment
FGD Focus Group Discussion
FACT Fisheries Action Coalition Team
FAO Food and Agriculture Organization of the United Nations
FiA Fisheries Administration Cantonment
IUCN International Union for Conservation of Nature
MAFF Ministry of Agriculture, Forestry and Fisheries
MIME Ministry of Industry, Mines and Energy
MLMUPC Ministry of Land Management, Urban Planning and Construction
MoE Ministry of Environment
MPWT Ministry of Public Works and Transport
MRD Ministry of Rural Development
MoT Ministry of Tourism
NTF Non-Timber Forest Product
PRA Participatory Rural Appraisal
RFLP Regional Fisheries and Livelihoods Programme
UNDP United Nations Development Programme
UNEP United Nations Environment Programme

List of figures and tables
Figure 1: Participatory Rural Appraisal with Rolous village community members ......................14
Figure 2: Map of Cambodia…………………………………………………………………………….16
Figure 3: Distribution of seagrass in coastal Cambodia .............................................................18
Figure 4: Location of villages, Community Fisheries and the port development area…………...21
Figure 5: Middlemen waiting to buy blue-swimming crabs in an unofficial landing site ..............37
Figure 6: Map indicating location of port development...............................................................38
Table 1: Focus Group Discussion respondents .........................................................................14
Table 2: Seagrass and mangrove areas in Cambodia ...............................................................17
Table 3: Community Fisheries in Kampot Province ...................................................................20
Table 4: Household survey respondents ...................................................................................23
Table 5: Age distribution ...........................................................................................................23
Table 6: Marital status ...............................................................................................................24
Table 7: Religious affiliation ......................................................................................................24
Table 8: Education ....................................................................................................................24
Table 9: Family size ..................................................................................................................25
Table 10: Land ownership .........................................................................................................25
Table 11: Livestock ownership ..................................................................................................26
Table 12: Average monthly income ...........................................................................................26
Table 13: Average monthly expenditure ....................................................................................26
Table 14: Reasons of expenditure.............................................................................................26
Table 15: Loans ........................................................................................................................27
Table 16: Reasons for borrowing money ...................................................................................27
Table 17: Seasonal Calendar ....................................................................................................28

1
Table 18: Types of fishing gears ...............................................................................................29
Table 19: Types of boats ...........................................................................................................30
Table 20: Hours per day spent fishing .......................................................................................30
Table 21: Importance of fishing grounds ...................................................................................31
Table 22: Main species caught by fishermen ............................................................................33
Table 24: Perceptions of indirect values of seagrass ................................................................34
Table 25: Total marine catch in Kampot Province .....................................................................35
Table 26: Perceptions of fish catch ...........................................................................................36
Table 27: Perceptions of size of fish ..........................................................................................36
Table 28: Condition of seagrass in the future ............................................................................42
Table 29: Perceptions of the sustainability of a career in fishing ...............................................42
11
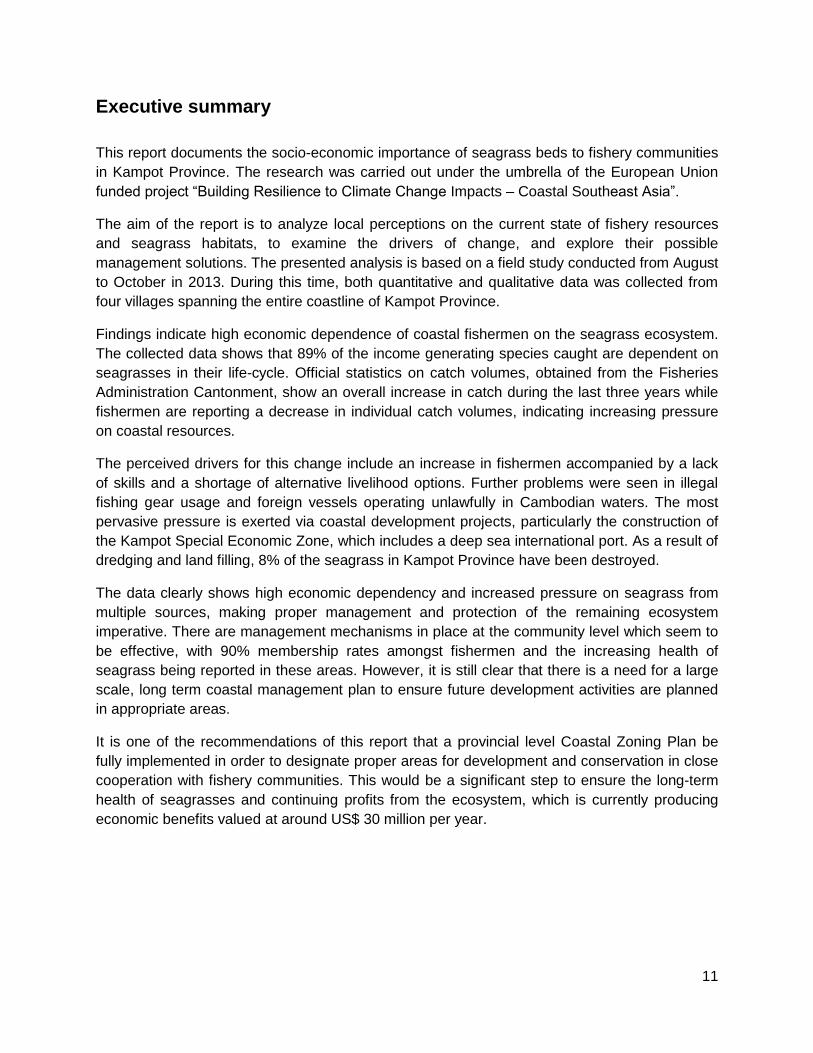
Executive summary
This report documents the socio-economic importance of seagrass beds to fishery communities
in Kampot Province. The research was carried out under the umbrella of the European Union
funded project “Building Resilience to Climate Change Impacts – Coastal Southeast Asia”.
The aim of the report is to analyze local perceptions on the current state of fishery resources
and seagrass habitats, to examine the drivers of change, and explore their possible
management solutions. The presented analysis is based on a field study conducted from August
to October in 2013. During this time, both quantitative and qualitative data was collected from
four villages spanning the entire coastline of Kampot Province.
Findings indicate high economic dependence of coastal fishermen on the seagrass ecosystem.
The collected data shows that 89% of the income generating species caught are dependent on
seagrasses in their life-cycle. Official statistics on catch volumes, obtained from the Fisheries
Administration Cantonment, show an overall increase in catch during the last three years while
fishermen are reporting a decrease in individual catch volumes, indicating increasing pressure
on coastal resources.
The perceived drivers for this change include an increase in fishermen accompanied by a lack
of skills and a shortage of alternative livelihood options. Further problems were seen in illegal
fishing gear usage and foreign vessels operating unlawfully in Cambodian waters. The most
pervasive pressure is exerted via coastal development projects, particularly the construction of
the Kampot Special Economic Zone, which includes a deep sea international port. As a result of
dredging and land filling, 8% of the seagrass in Kampot Province have been destroyed.
The data clearly shows high economic dependency and increased pressure on seagrass from
multiple sources, making proper management and protection of the remaining ecosystem
imperative. There are management mechanisms in place at the community level which seem to
be effective, with 90% membership rates amongst fishermen and the increasing health of
seagrass being reported in these areas. However, it is still clear that there is a need for a large
scale, long term coastal management plan to ensure future development activities are planned
in appropriate areas.
It is one of the recommendations of this report that a provincial level Coastal Zoning Plan be
fully implemented in order to designate proper areas for development and conservation in close
cooperation with fishery communities. This would be a significant step to ensure the long-term
health of seagrasses and continuing profits from the ecosystem, which is currently producing
economic benefits valued at around US$ 30 million per year.
12
I. Introduction
The “Building Coastal Resilience to Climate Change Impacts – Coastal Southeast Asia” project
is working in eight target provinces in three countries; namely Thailand, Viet Nam and
Cambodia. One of these target provinces is Kampot, located in the southwest of Cambodia, with
a coastline of 66.5 km and a known seagrass area of approximately 25,000 ha. Seagrass beds
are increasingly recognized as a highly productive and important ecosystem, contributing
significantly to economic and food security in coastal communities.
The coast of Kampot Province is comprised of two interrelated systems; with the ecological
system providing life-support functions for living organisms and also significantly producing
goods and services for socio-economic development. The increasing number of stakeholders
and conflicting demands on the coastal environment have brought about the need to closely
examine the relationships between ecological habitat and the socio-economic system that
governs it. This will ensure best management practices are adopted, thereby allowing both
systems to thrive.
A previous Vulnerability and Capacity Assessment of Kampot Province conducted by IUCN in
2011 found that the subsistence fisher communities are threatened by the degradation of
coastal habitats and increasing pressure from development projects. Deterioration of the coastal
ecosystem is the result of land development, agricultural run-off, lack of an effective waste
management system, the use of illegal and destructive fishing gear; all of which are contributing
to pollution and the decreased productive quality of the coastal habitat. Further pressure is
imposed on the coastal areas through land reclamation, sand dredging and mining; resulting in
habitat destruction and fish stock depletion.
Therefore, it is of increasing importance to understand the health of the ecosystem and the
extent of the dependence of coastal communities on the services provided by seagrasses. An
assessment of the socio-economic importance of seagrass was undertaken through this study,
to be able to adequately assess the impacts of current development plans on the future food
and economic security of the province’s coastal inhabitants.
II. Objectives of the study
This is the first assessment documenting the extent of dependence of coastal communities on
the seagrass ecosystem in Kampot Province. Given the very large seagrass area and the
pressure it is currently under, it is important to understand the patterns of usage and the socio-
economic benefits derived from this ecosystem.
Overall objective:
To assess the extent of dependence of coastal fishermen on the seagrass ecosystem.

13
Specific objectives:
1. To document the local perceptions on the current state and changes in the coastal
fishery resources and seagrass habitats;
2. To examine the drivers of change in seagrass coverage and livelihood strategies;
3. To explore possible management solutions from the perspectives of local communities
and relevant government officials.
III. Methodology
3.1 Study design and data collection
The study was conducted over a span of six weeks; between August and October in 2013. The
team comprised of four researchers, two IUCN staff members, an employee of the Kampot
Department of Environment, and an employee from the Fisheries Administration Cantonment of
Kampot Province. The team was composed with the aim to include local expertise in the study’s
design and data collection.
The research was carried out in a total of four villages spanning the entire coastline of 66.5 km
in Kampot Province. Target villages were selected to represent each of the three main seagrass
patches in the coastal area. Data collection was completed in two phases. Firstly, a set of
Participatory Rural Appraisal tools were implemented to explore the perceptions of local
villagers on their livelihoods and the ecosystem. Secondly, a household survey was conducted
to collect statistical data on coastal fishermen.
In addition to these methods, in-depth semi-structured interviews were conducted with the Head
of the Kampot Fisheries Administration Cantonment, the Director of the Department of
Environment, the Deputy Governor of Kampot Province, four village chiefs, three Community
Fishery Chiefs, and one former Community Fishery Chief.
The research team was provided training in the research approach and methodologies used for
this study. All data was recorded in Khmer and then translated by the Cambodian research
team members to English, after which the analysis was conducted.
3.1.1 Participatory Rural Appraisal
The first part of the study, spanning three weeks, implemented a set of Participatory Rural
Appraisal (PRA) tools in all the four target villages. PRA is a qualitative approach to
collaboratively explore the perceptions of local villagers about their livelihoods and the
surrounding ecosystem.
The particular methods were chosen in accordance with the study objectives. A total of six PRA
tools were applied: (1) resource mapping; (2) stakeholder analysis; (3) market flow analysis; (4)
seasonal calendar; (5) timeline; (6) problem matrix and solution analysis. The PRA tools were
14
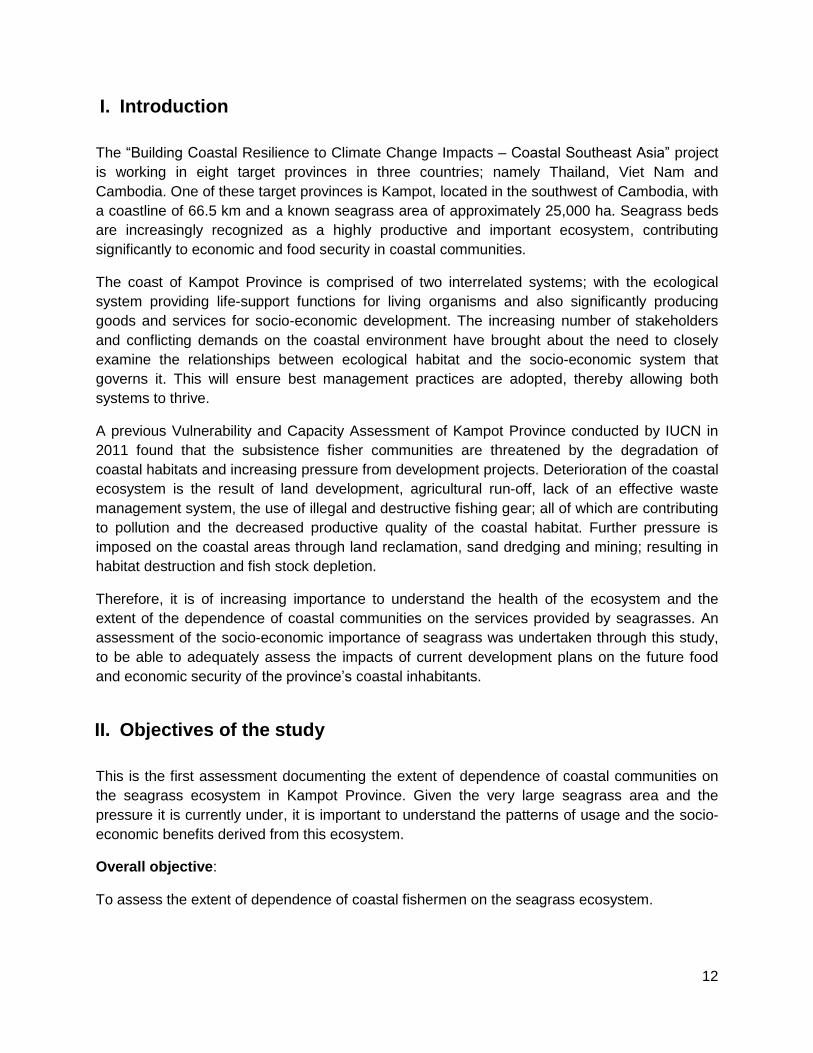
implemented through Focus Group Discussions (FGDs) over the span of two days in each of
the four villages.
Figure 1: Participatory Rural Appraisal with Rolous village community members
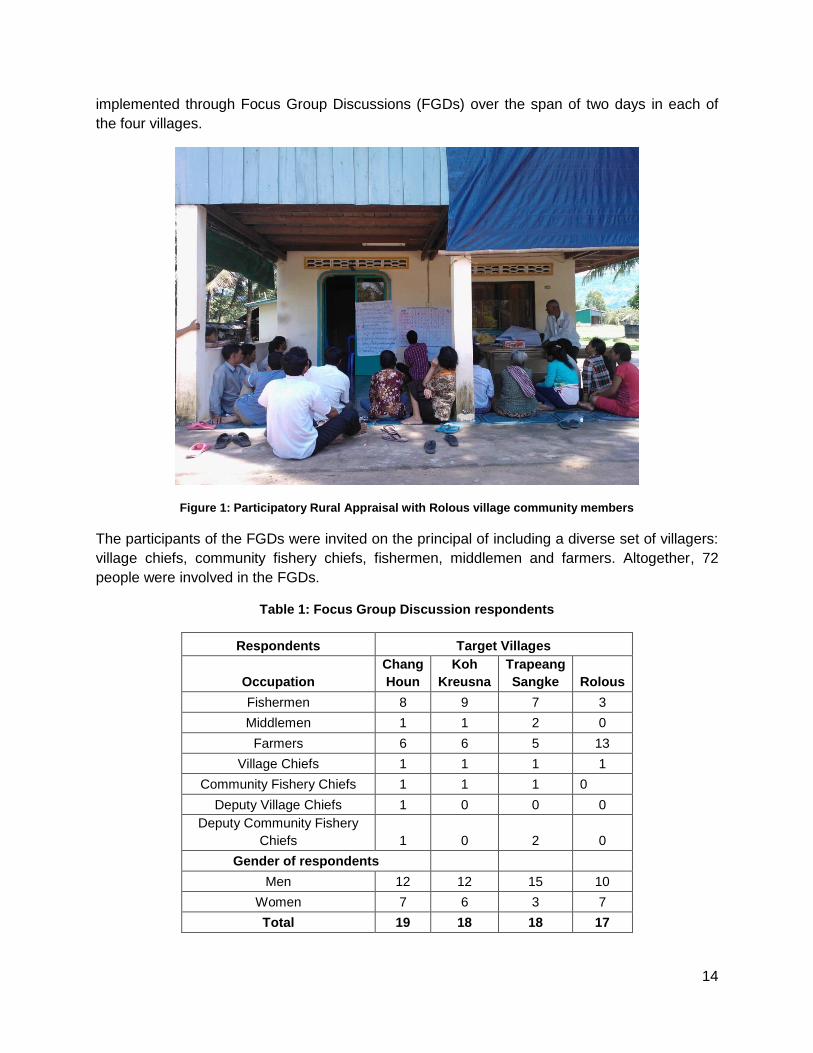
The participants of the FGDs were invited on the principal of including a diverse set of villagers:
village chiefs, community fishery chiefs, fishermen, middlemen and farmers. Altogether, 72
people were involved in the FGDs.
Table 1: Focus Group Discussion respondents
Respondents Target Villages
Occupation
Chang
Houn
Koh
Kreusna
Trapeang
Sangke Rolous
Fishermen 8 9 7 3
Middlemen 1 1 2 0
Farmers 6 6 5 13
Village Chiefs 1 1 1 1
Community Fishery Chiefs 1 1 1 0
Deputy Village Chiefs 1 0 0 0
Deputy Community Fishery
Chiefs 1 0 2 0
Gender of respondents
Men 12 12 15 10
Women 7 6 3 7
Total 19 18 18 17

15
3.1.2 Household survey
The second phase of the study, spanning another three weeks, involved a household survey in
all the four target villages. Due to the specific focus of the study, the sample size was calculated
from the number of known fishermen in all the villages. The statistics obtained from the Village
Chiefs showed that there are 1087 fishermen distributed as follows: 275 in Chang Houn, 77 in
Rolous, 305 in Trapeang Sangke, and 430 in Koh Kreusna. The sample size was then
calculated using the Taro Yamane formula: . This method gave the final sample size
of 91 when a confidence level of 90% was applied.
A structured questionnaire was used to interview respondents. A pre-test on the survey was
conducted and improvements were made before the final version was implemented.
Respondent households were selected at random in each village. A map was used to first
indicate all the households which had fishing as a primary occupation. Depending on the
number of households identified in each villages, every seventh to tenth household was chosen
to be interviewed.
3.2 Data analysis
The PRA data was analyzed using content analysis and the results were used to improve the
household questionnaire implemented in the second phase of the study. The data received from
the interviewers were checked every evening to ensure the accurate completion of all the
undertaken surveys and this also allowed for any misunderstandings or errors to be corrected
by the interviewers during the next day. All data from the household surveys was entered into
Microsoft Excel which was the primary tool of analysis.
3.3 Limitations
The study aimed to collect both quantitative and qualitative data to ensure a good depth of
understanding regarding the coastal situation of Kampot Province. A slight limitation emerged
from the different nature of the data collected. The statistics obtained from the household survey
can be used to characterize the situation of fishermen across all villages, as the fishermen from
all target areas were treated as belonging to the same sample population. Comparisons
between the villages are therefore based on qualitative data obtained from the PRA study.
Due to the limited time-frame of this study, a complete valuation of the seagrass beds was not
possible, as any such estimation would have resulted in a gross undervaluation of the economic
benefit of this ecosystem. Therefore, the dependence was measured as a percentage and not in
actual monetary terms.
Furthermore, it should be noted that the results may exhibit a seasonal bias as the study was
conducted between August and October in 2013. The degree and direction of the bias is difficult
to estimate, as in August and September strong winds and heavy rains are still prevalent. This
might have resulted in an underreporting of the overall catch. However, the peak fishing season

16
generally starts in October, which may have resulted in a positive bias for reporting fishing catch
volumes.
IV. Study area
4.1 Kampot Province
Cambodia’s coastline covers 435 km; covering two provinces Kampot and Koh Kong, and two
municipalities Kep and Sihanoukville.
Kampot Province in itself covers an area of 4,873 km². It has a population of 585,850 (Rizvi &
Singer, 2011). Between 1998 and 2008, the population in Kampot declined. However, the high
growth rate of 1.67% (The World Factbook, 2013) in the entire country is an indication of a
possible future increase in the population of the province. Furthermore, the 2008 government
census found that 3% of the inhabitants in Kampot Province were migrants from other
provinces, indicating a modest in-migration pattern for coastal areas (Rizvi & Singer, 2011).
Figure 2: Map of Cambodia
Source: Department of Fisheries (2005)
17
The coast of Kampot is comprised of three districts, nine communes and 31 villages. The
majority of the population lives in rural areas and is heavily dependent on the exploitation of
natural resources, with one of the main occupations being fishing. Most fish production in
Cambodia derives from freshwater fisheries, with marine fisheries accounting for only about
30% of the total. However, marine capture fisheries are highly valued, as their contribution to
the national economy is about 40% of the total production (UNEP, 2007a). In 2006, the revenue
from exports was an estimated US$ 63.5 million (The Learning Institute, 2010). However, this is
possibly a considerable underestimation of the actual economic contribution of the marine
fisheries sector, because the statistics do not include illegal sales to adjacent countries. Illegal
fishing in Cambodian waters undermines the potential additional contribution marine fisheries
could make to the economy of Cambodia.
Cambodia has been experiencing rapid economic growth in the last decade, with Kampot
Province being no exception. The province has been a target for various developmental
projects, with both direct and indirect impacts on coastal ecosystems and on the socio-
economic conditions of the general population. The main areas of interest for development in
the province are the marine product export sector and tourism. The Kampot International Port is
currently under construction, adjacent to which is the Kampot Special Economic Zone (SEZ).
The international port is meant to increase tourism and facilitate export and import, while the
Kampot SEZ will include the establishment of processing and manufacturing facilities (Council
for the Development of Cambodia, 2013). The expected completion of these projects has been
significantly delayed, and they remain in the early construction phase, with ongoing sand
dredging for land filling.
4.2 The seagrass ecosystem
Ecologically, seagrasses and mangroves play a critical role in the marine environment, as they
are nursery grounds for various commercially important fish species. Degradation of this
ecosystem will have significant effects on offshore fish production (Osborne, 2012). However,
the importance of seagrasses has only been recognized relatively recently and, as a result, they
have received much less national and international attention than mangroves.
In the case of Kampot Province, it is especially important to recognize the value of seagrasses
due to the sheer expanse of the ecosystem. Kampot Province has the largest seagrass area in
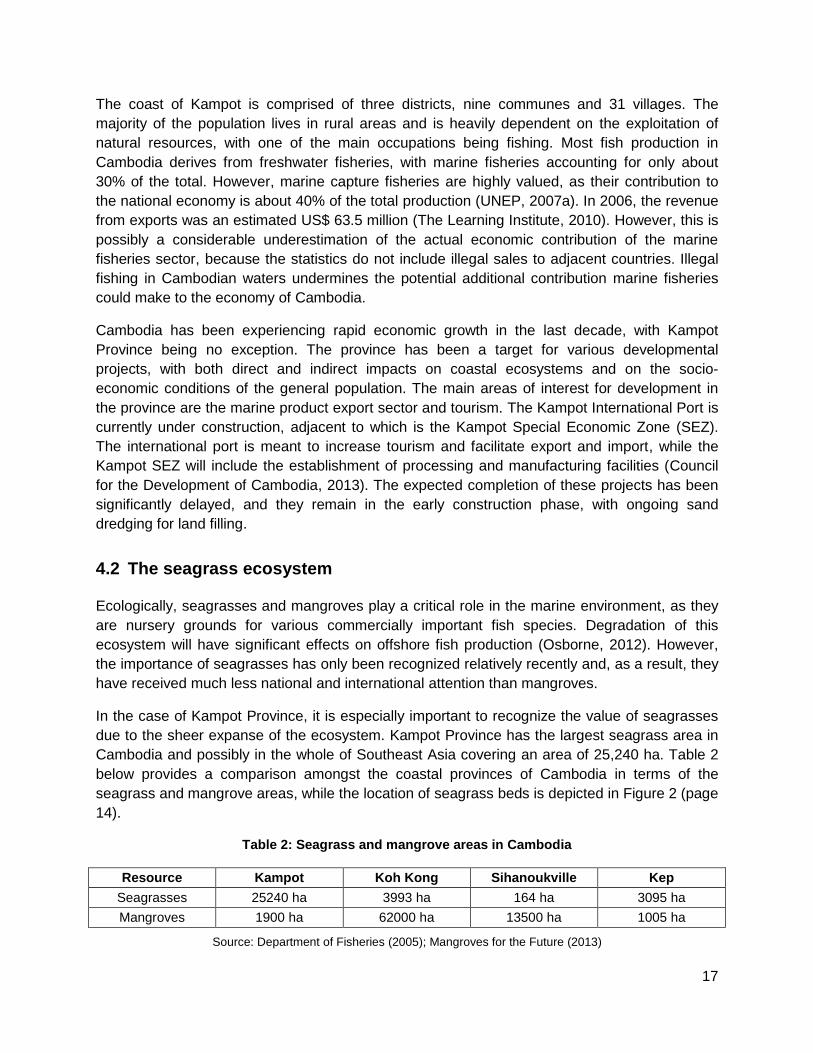
Cambodia and possibly in the whole of Southeast Asia covering an area of 25,240 ha. Table 2
below provides a comparison amongst the coastal provinces of Cambodia in terms of the
seagrass and mangrove areas, while the location of seagrass beds is depicted in Figure 2 (page
14).
Table 2: Seagrass and mangrove areas in Cambodia
Resource Kampot Koh Kong Sihanoukville Kep
Seagrasses 25240 ha 3993 ha 164 ha 3095 ha
Mangroves 1900 ha 62000 ha 13500 ha 1005 ha
Source: Department of Fisheries (2005); Mangroves for the Future (2013)

18
Figure 3: Distribution of seagrass in coastal Cambodia
Source: Department of Fisheries (2004)
The annual economic value of seagrasses in Cambodia has been estimated to be around US$
1,186 per hectare. However, this value is most likely a gross undervaluation of the actual benefit
provided by seagrasses, as it only takes into account captured fish, shrimp, crabs,
shellfish/molluscs and seaweed production. It does not account for the values of beach
protection, nursery functions, carbon sequestration, oxygen release and nutrient removal etc. It
is therefore highly probable that the actual monetary value of the area is double the current
estimation (UNEP, 2007b).
4.3 Management of seagrass and fishery resources
Numerous government bodies have an influence in the planning and management of the
coastal areas of Cambodia. These include the Ministry of Agriculture, Forestry and Fisheries
19
(MAFF), the Ministry of Environment, the Ministry of Land Management, Urban Planning and
Construction (MLMUPC), the Ministry of Industry, Mines and Energy (MIME), the Ministry of
Tourism (MoT), the Ministry of Public Works and Transport (MPWT), the Ministry of Rural
Development (MRD), and the Ministry of Women's Affairs and the Ministry of Planning (DoF,
2005).
The day-to-day management of seagrass beds and fisheries resources in Kampot Province is
under the jurisdiction of the Deputy Provincial Governor of the Department of Environment and
the Fisheries Administration Cantonment. The former is legally responsible for the ecosystem
itself, whereas the latter is responsible for the products it provides. Despite the legally
overlapping roles of these institutions, problems on ground-level are rare. However, the number
of stakeholders does complicate the efforts for mitigation against possible threats, such as
excess sediment and nutrients from development activities both in the coast and upstream
(Morgan, 2011). Conflicting interests arise in the same space with MIME, MRD, MoT and
MPWD being responsible for developing the coastal area; and DoE and FiA for management
and protection.
Relatively recently, another level of management was added to the administrative system of
coastal areas. In an effort to decentralize the administration of natural resources, the Royal
Government of Cambodia made a significant shift towards promoting community-based
management of fishing areas through the establishment of Community Fisheries (CFis) in 2000.
A CFi is defined as a group of Khmer citizens living in one or more villages who voluntarily
agree to cooperate for the purpose of participating in sustainable management and use of
fisheries resources in their local area (The Learning Institute, 2010).
Chapter 11 from Cambodia’s Fisheries Law outlines the relationship between the FiA and CFis.
According to this, all Cambodian citizens have the right to form CFis in their own areas on a
voluntary basis, and MAFF is entitled to allocate a part of the fishery domain to the CFi that lives
inside or nearby the fishery domain. The CFis need to be continuously managed by the fishing
communities in accordance with the management plan which is approved by relevant
authorities. The FiA will provide technical support at the request of local communities and
monitor the implementation of individual CFi management plans (Law on Fisheries, 2007).
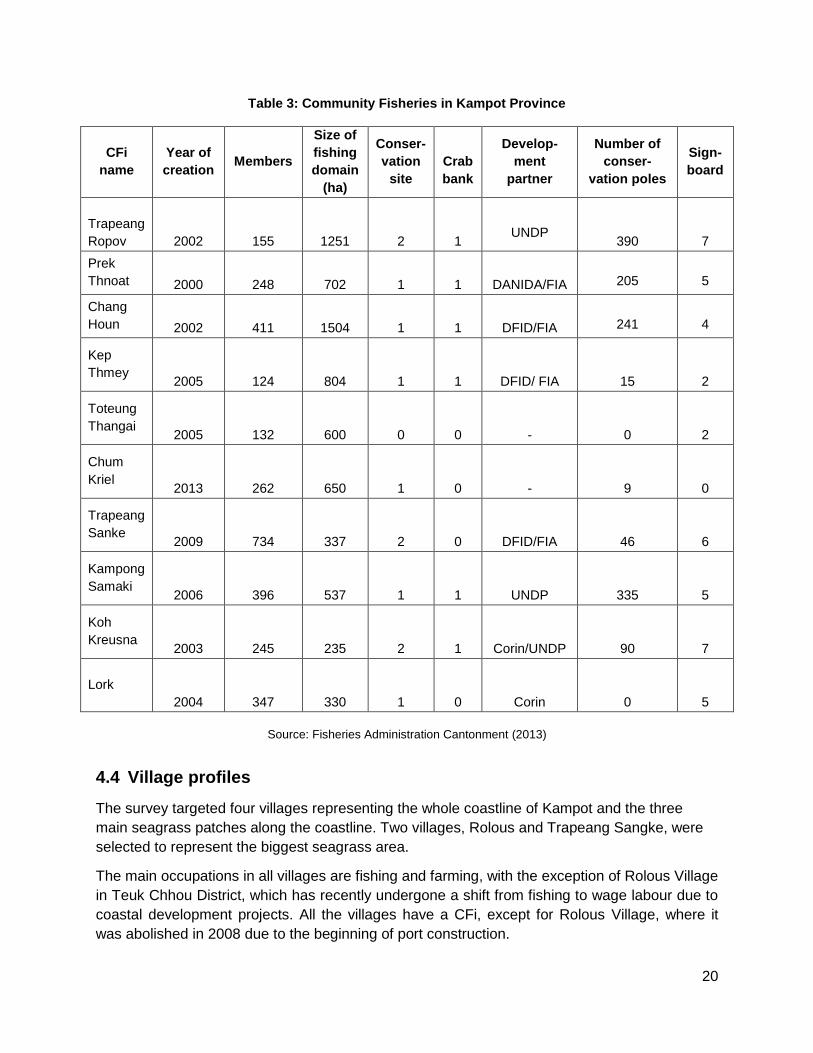
Table 3 (on the following page) shows all ten of the legally established CFis in Kampot Province
and the areas allocated to them, including a separate conservation area to ensure the
sustainability of resource usage.
20
Table 3: Community Fisheries in Kampot Province
CFi
name
Year of
creation Members
Size of
fishing
domain
(ha)
Conser-
vation
site
Crab
bank
Develop-
ment
partner
Number of
conser-
vation poles
Sign-
board
Trapeang
Ropov 2002 155 1251 2 1
UNDP
390
7
Prek
Thnoat 2000 248 702 1 1 DANIDA/FIA
205
5
Chang
Houn 2002 411 1504 1 1 DFID/FIA
241
4
Kep
Thmey 2005 124 804 1 1 DFID/ FIA
15
2
Toteung
Thangai 2005 132 600 0 0 -
0
2
Chum
Kriel 2013 262 650 1 0 -
9
0
Trapeang
Sanke 2009 734 337 2 0 DFID/FIA
46
6
Kampong
Samaki 2006 396 537 1 1
UNDP
335
5
Koh
Kreusna 2003 245 235 2 1 Corin/UNDP
90
7
Lork
2004 347 330 1 0 Corin
0
5
Source: Fisheries Administration Cantonment (2013)
4.4 Village profiles
The survey targeted four villages representing the whole coastline of Kampot and the three
main seagrass patches along the coastline. Two villages, Rolous and Trapeang Sangke, were
selected to represent the biggest seagrass area.
The main occupations in all villages are fishing and farming, with the exception of Rolous Village
in Teuk Chhou District, which has recently undergone a shift from fishing to wage labour due to
coastal development projects. All the villages have a CFi, except for Rolous Village, where it
was abolished in 2008 due to the beginning of port construction.

21
All villages have a similar internal structure; with main administrative positions being the Village
Chief, Community Fishery Chief, Commune Chief, the Commune Policeman, and middlemen.
Further importance was given to Patrolling Units in Chang Houn, Trapeang Sangke and Koh
Kreusna villages. Their role is to prevent and report illegal fishing activities to the relevant
institutions.
Figure 4: Location of villages, Community Fisheries and the port development area
Source: Ministry of Land Management, Urban Planning and Construction (2012)
4.4.1 Chang Houn Village
Chang Houn Village is located in the western part of Koh Kong Province in Prek Thnoat
commune, Teuk Chhou district. The village has a population of 1,826 people, comprising 362
families, out of which 65 are headed by women. The population is primarily Buddhist and the
village has a pagoda.
The infrastructure in the village is poor. While there is no health centre directly in the village, the
nearest one is located 8 km away. However, a pharmacy is in the village. There is an uneven
distribution of water from the existent water system. Households by the main road are able to
access tap water, while people in the middle of the village buy water or use wells with pumps.
Around 90% of the village homes are connected to the electric grid. However, the high per unit
price of electricity at 0.3 US$/kWh is significantly limiting its consumption.
The primary school is located inside the village area, while the secondary school is 4 km away
and the high school is at a distance of 7 km. According to the Village Chief, about 95% of the
22
children study until the end of secondary school, after which many leave due to monetary
constraints and the long travel time to the high school.
4.4.2 Rolous Village
Rolous village is located in Boeung Touk commune in Teuk Chhou district. The village has a
population of 1,694, comprising 355 families, with 105 headed by women. The population is
mainly Buddhist, with a small number of Muslim households. The village has a pagoda.
The nearest health centre is 5 km away. Water is mainly accessed using wells and people have
an adequate access to water resources. About 70% of the village is connected to the electric
grid; the rest lack the funds to pay for the one-time connection fee which is around US$ 93.
There is a primary and secondary school located inside the village. According to the Village
Chief, around 95% of the children proceed to high school, which is located outside the village.
4.4.3 Trapeang Sangke Village
Trapeang Sangke is located closest to Kampot town in Trapeang Sangkae commune, Teuk
Chhou district. The village has a population of 2,631 people, comprising 446 families, out of
which 67 are headed by women. The majority of the population is Muslim with a strong Buddhist
minority. There are two mosques and one pagoda in the village.
The village has a health centre and four pharmacies. The one-time connection fee to the water
system is relatively high, costing US$ 60, and many people resort to using ponds, wells and
rainwater instead. About 90% of the village is connected to the electric grid, but as with the
other villages, the connection fee and electricity price per kWh are high.
The village has a primary school, but for secondary and high schooling, the children need to
commute. According to the Village Chief, almost all children finish secondary school, after which
many stop due to monetary constraints.
4.4.4 Koh Kreusna Village
Koh Kreusna is located near the border of Viet Nam in Russey Srok Khang Lech commune,
Kampong Trach district. The village has a population of 1,240 people, comprising 233
households, with 55 of them headed by women. The majority of the population is Buddhist and
the village has one pagoda.
The village has a health centre and there is a private clinic nearby. Some of the wealthier
families are connected to the water system, but most people collect rainwater and use ponds
and wells for their water needs. Only around 50% of the village is connected to the electric grid
due to the high connection fees and the per unit price of electricity.
23
There is a primary and secondary school in the village, and most children go to both. There is a
high school 13 km away, but as in the other villages, many children are unable to attend it due
to financial constraints.
V. Results of the study
5.1 Demographic indicators of the respondents
According to the village data books from 2012, there are 1,396 households and a total of 7,391
people in all the villages, out of which 1,087 people are fishermen. The household survey that
was conducted targeted 91 households for data collection.
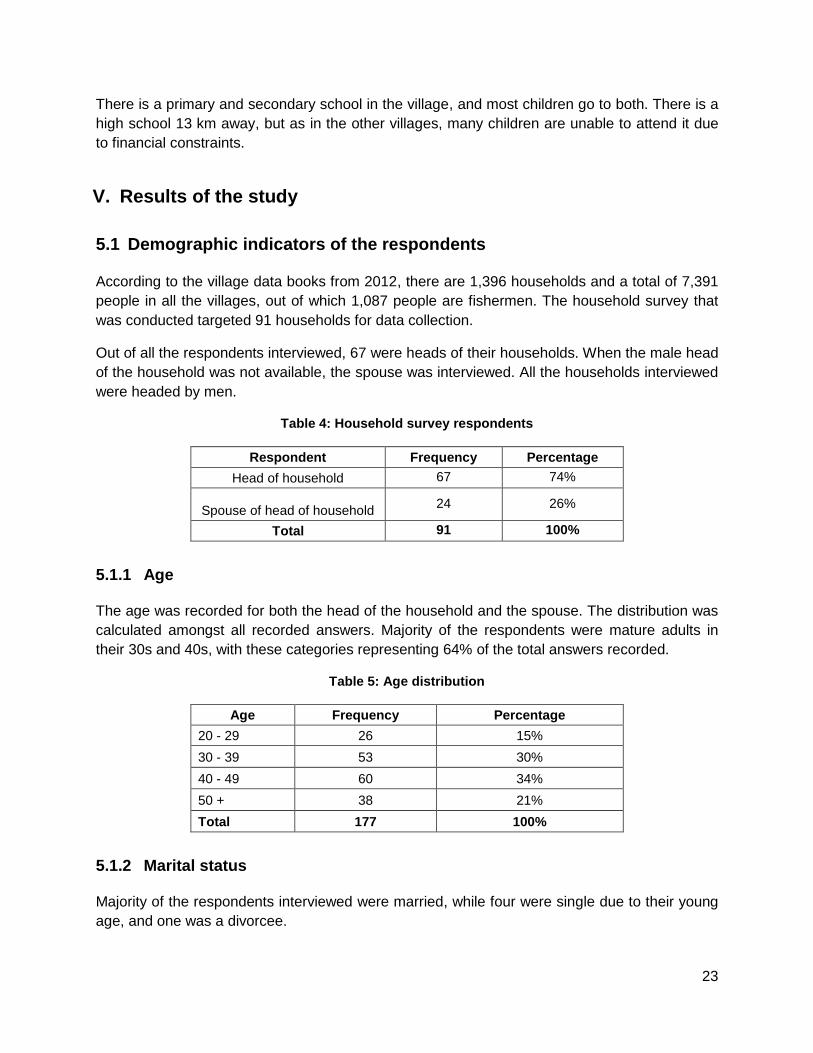
Out of all the respondents interviewed, 67 were heads of their households. When the male head
of the household was not available, the spouse was interviewed. All the households interviewed
were headed by men.
Table 4: Household survey respondents
Respondent Frequency Percentage
Head of household 67 74%
Spouse of head of household 24 26%
Total 91 100%
5.1.1 Age
The age was recorded for both the head of the household and the spouse. The distribution was
calculated amongst all recorded answers. Majority of the respondents were mature adults in
their 30s and 40s, with these categories representing 64% of the total answers recorded.
Table 5: Age distribution
Age Frequency Percentage
20 - 29 26 15%
30 - 39 53 30%
40 - 49 60 34%
50 + 38 21%
Total 177 100%
5.1.2 Marital status
Majority of the respondents interviewed were married, while four were single due to their young
age, and one was a divorcee.
24
Table 6: Marital status
Marital status Frequency Percentage
Married 86 95%
Single 4 4%
Divorced 1 1%
Total 91 100%
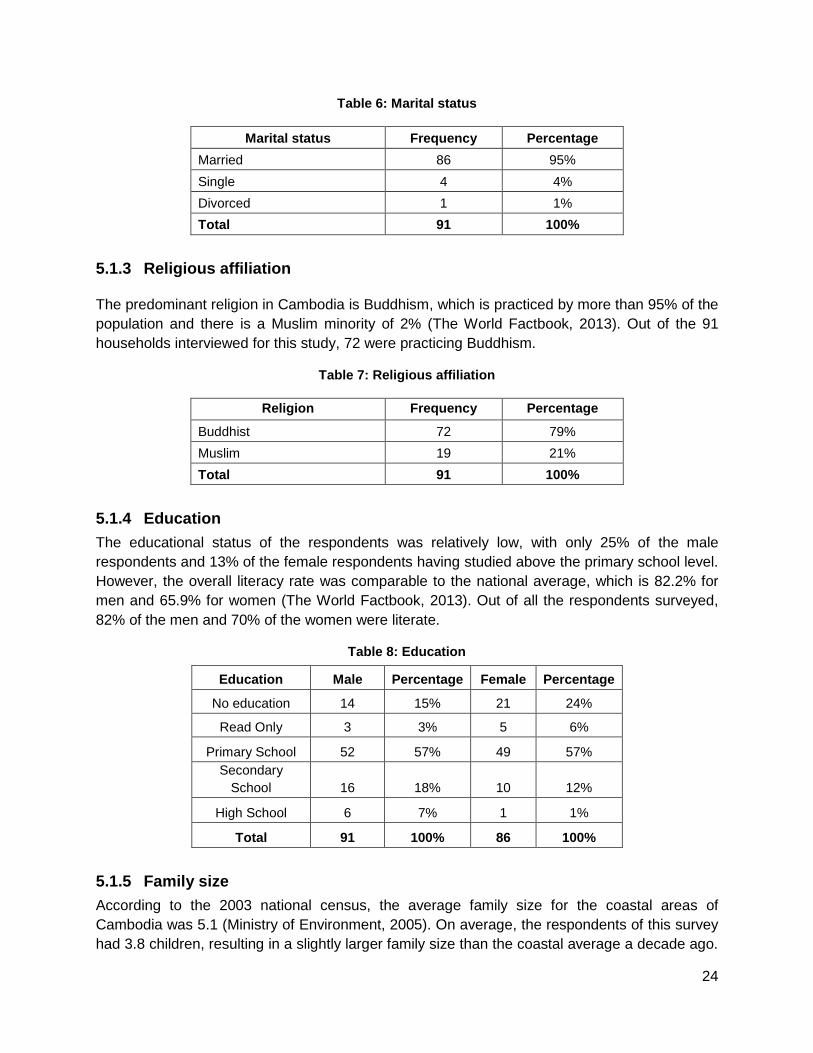
5.1.3 Religious affiliation
The predominant religion in Cambodia is Buddhism, which is practiced by more than 95% of the
population and there is a Muslim minority of 2% (The World Factbook, 2013). Out of the 91
households interviewed for this study, 72 were practicing Buddhism.
Table 7: Religious affiliation
Religion Frequency Percentage
Buddhist 72 79%
Muslim 19 21%
Total 91 100%
5.1.4 Education
The educational status of the respondents was relatively low, with only 25% of the male
respondents and 13% of the female respondents having studied above the primary school level.
However, the overall literacy rate was comparable to the national average, which is 82.2% for
men and 65.9% for women (The World Factbook, 2013). Out of all the respondents surveyed,
82% of the men and 70% of the women were literate.
Table 8: Education
Education Male Percentage Female Percentage
No education 14 15% 21 24%
Read Only 3 3% 5 6%
Primary School 52 57% 49 57%
Secondary
School 16 18% 10 12%
High School 6 7% 1 1%
Total 91 100% 86 100%
5.1.5 Family size
According to the 2003 national census, the average family size for the coastal areas of
Cambodia was 5.1 (Ministry of Environment, 2005). On average, the respondents of this survey
had 3.8 children, resulting in a slightly larger family size than the coastal average a decade ago.

25
The large family sizes of the respondents reflect their rural, and predominantly subsistence,
livelihood strategies.
Table 9: Family size
Amount of children Frequency Percentage
No children 5 5%
1 child 8 9%
2 children 11 12%
3 children 23 25%
4 children 13 14%
5 children 14 15%
6 children 7 8%
7 children 4 4%
8 children 3 3%
9 children 3 3%
Total 91 100%
5.1.6 State of settlements and land ownership
Around 92% of the respondents have a permanent house, indicative of a predominantly stable
lifestyle of the overall population. Furthermore, 89% of the households interviewed own land,
with 70% of them had a legally recognized land title. However, most of the land holdings are
relatively small and could be classified as residential land supporting only farming and livestock
for household consumption.
Table 10: Land ownership
Size of land Frequency Percentage
No land 10 11%
Residential land 70 77%
1 ha 6 7%
>1 ha 5 5%
Total 91 100%
5.1.7 Livestock ownership
Majority of the respondents also rear livestock, with 85% of the households raising at least a few
animals. Poultry-raising is most popular, and more than 90% of the respondents rear either
chickens or ducks.
The respondents who were not raising any animals explained that this was due to a lack of
space for them. Two respondents out of 14 mentioned the high expenditure on feed and lack of
skill, resulting in high mortality rates as constraints for raising animals.

26
Table 11: Livestock ownership
Type of
livestock Frequency Percentage
Average number of
heads
Poultry 71 92% 12
Cow/Buffalo 21 27% 3
Pig 23 30% 3
5.1.8 Monthly income and expenditure
Monthly income and expenditure in rural livelihoods exhibits a seasonal variation, which is why
high and low levels of both were recorded. It should also be noted that many respondents found
it difficult to report monthly incomes due to the variety of revenue sources and the income
fluctuation between different months of the year. Expenditure levels are also unstable—peaking
from November until April—due to the higher frequency of ceremonies, weddings and festivals.
Table 12: Average monthly income Table 13: Average monthly expenditure
Income High (US$) Low (US$)
Average 456 150
Max 3500 1500
Min 81 25
Median 300 100
Expenditure High (US$) Low (US$)
Average 290 130
Max 3000 1200
Min 63 19
Median 200 100
Table 14 indicates the main items respondents spent their incomes on. The highest expenditure
is incurred for household food consumption and education of children.
Table 14: Reasons of expenditure
Reason for expenditure Average (US$) Maximum (US$) Median (US$)
Health 15 125 9
Education 46 180 35
Food 83 225 75
Clothes 7 25 6
Ceremonies 23 83 17
Electric usage 5 12,5 5
5.1.9 Loans
It has been understood that the informal lending sector dominates the formal banking sector in
rural livelihoods (The Learning Institute, 2010). Furthermore, this has been used to indicate that
the middlemen buying goods from fishermen have a monopoly over the market as fishermen
depend on their credit (UNEP, 2007a). However, the results of the present study indicate that
the services of micro-credit institutions are readily available to villagers. In total, 52 of the
27
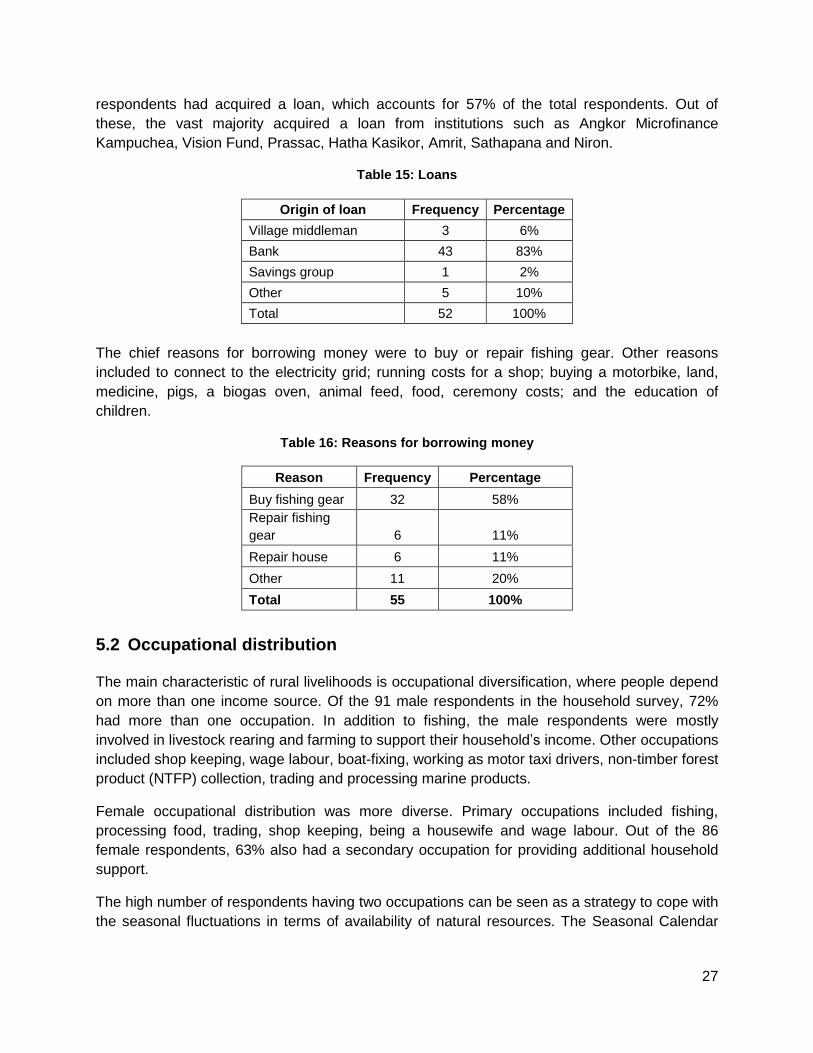
respondents had acquired a loan, which accounts for 57% of the total respondents. Out of
these, the vast majority acquired a loan from institutions such as Angkor Microfinance
Kampuchea, Vision Fund, Prassac, Hatha Kasikor, Amrit, Sathapana and Niron.
Table 15: Loans
The chief reasons for borrowing money were to buy or repair fishing gear. Other reasons
included to connect to the electricity grid; running costs for a shop; buying a motorbike, land,
medicine, pigs, a biogas oven, animal feed, food, ceremony costs; and the education of
children.
Table 16: Reasons for borrowing money
Reason Frequency Percentage
Buy fishing gear 32 58%
Repair fishing
gear 6 11%
Repair house 6 11%
Other 11 20%
Total 55 100%
5.2 Occupational distribution
The main characteristic of rural livelihoods is occupational diversification, where people depend
on more than one income source. Of the 91 male respondents in the household survey, 72%
had more than one occupation. In addition to fishing, the male respondents were mostly
involved in livestock rearing and farming to support their household’s income. Other occupations
included shop keeping, wage labour, boat-fixing, working as motor taxi drivers, non-timber forest
product (NTFP) collection, trading and processing marine products.
Female occupational distribution was more diverse. Primary occupations included fishing,
processing food, trading, shop keeping, being a housewife and wage labour. Out of the 86
female respondents, 63% also had a secondary occupation for providing additional household
support.
The high number of respondents having two occupations can be seen as a strategy to cope with
the seasonal fluctuations in terms of availability of natural resources. The Seasonal Calendar
Origin of loan Frequency Percentage
Village middleman 3 6%
Bank 43 83%
Savings group 1 2%
Other 5 10%
Total 52 100%
28
exercise done with the Focus Groups in all villages clearly shows fluctuations in the possible
income contributions to household wealth between the dry and rainy season.
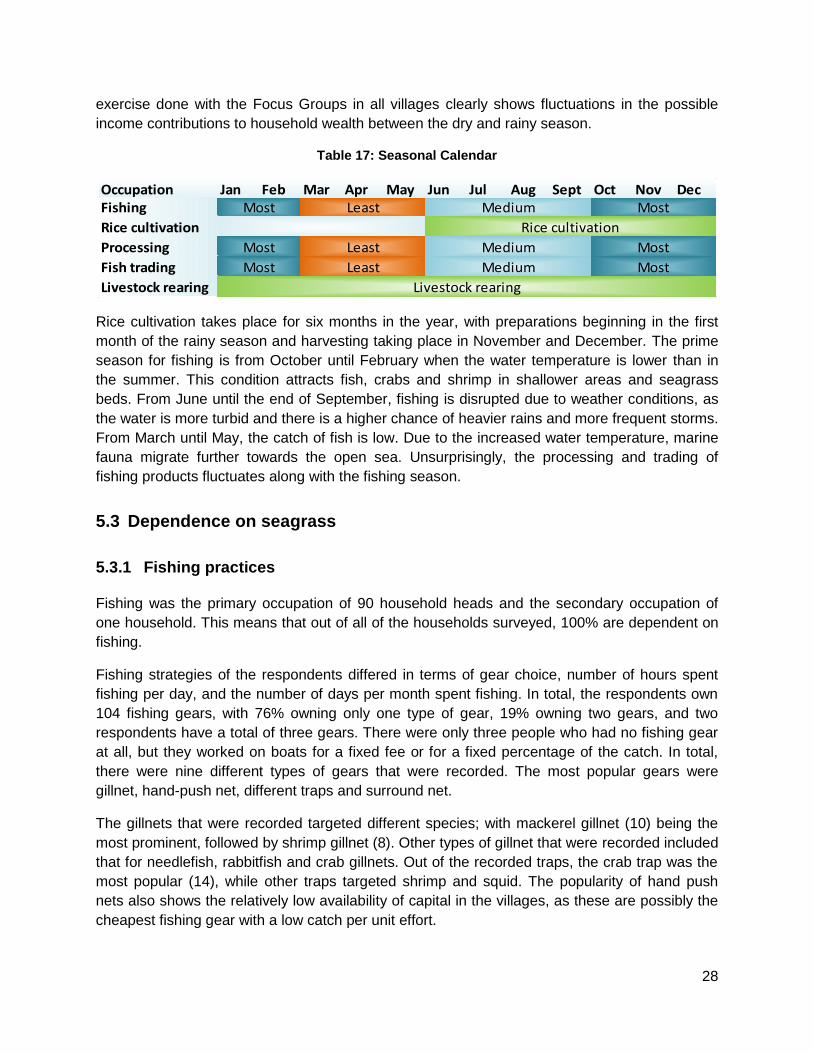
Table 17: Seasonal Calendar
Occupation Jan Feb Mar Apr May Jun Jul Aug Sept Oct Nov DecFishing
Rice cultivation
Processing
Fish trading
Livestock rearing
Most Least Medium Most
Livestock rearing
Most MostMediumLeast
Rice cultivation
Most Least Medium Most
Rice cultivation takes place for six months in the year, with preparations beginning in the first
month of the rainy season and harvesting taking place in November and December. The prime
season for fishing is from October until February when the water temperature is lower than in
the summer. This condition attracts fish, crabs and shrimp in shallower areas and seagrass
beds. From June until the end of September, fishing is disrupted due to weather conditions, as
the water is more turbid and there is a higher chance of heavier rains and more frequent storms.
From March until May, the catch of fish is low. Due to the increased water temperature, marine
fauna migrate further towards the open sea. Unsurprisingly, the processing and trading of
fishing products fluctuates along with the fishing season.
5.3 Dependence on seagrass
5.3.1 Fishing practices
Fishing was the primary occupation of 90 household heads and the secondary occupation of
one household. This means that out of all of the households surveyed, 100% are dependent on
fishing.
Fishing strategies of the respondents differed in terms of gear choice, number of hours spent
fishing per day, and the number of days per month spent fishing. In total, the respondents own
104 fishing gears, with 76% owning only one type of gear, 19% owning two gears, and two
respondents have a total of three gears. There were only three people who had no fishing gear
at all, but they worked on boats for a fixed fee or for a fixed percentage of the catch. In total,
there were nine different types of gears that were recorded. The most popular gears were
gillnet, hand-push net, different traps and surround net.
The gillnets that were recorded targeted different species; with mackerel gillnet (10) being the
most prominent, followed by shrimp gillnet (8). Other types of gillnet that were recorded included
that for needlefish, rabbitfish and crab gillnets. Out of the recorded traps, the crab trap was the
most popular (14), while other traps targeted shrimp and squid. The popularity of hand push
nets also shows the relatively low availability of capital in the villages, as these are possibly the
cheapest fishing gear with a low catch per unit effort.

29
Table 18: Types of fishing gears
The respondents were also asked why they had chosen to fish with the gear they were using.
The most common reason was the cost of the gear, which was mentioned 38 times. A close
second was the skill and experience with the gear, mentioned 36 times. Other important
characteristics were the ease with which to operate the gear and the amount of catch
achievable.
Sixty four respondents out of 91 had a boat, and three people had two trawlers giving a total
count of 67 boats. Long tail boats were the most popular, with the majority also having a motor,
allowing the fishermen to obtain their catch further from the shore.
Figure 5: A fisherman showing his hand-push net in Trapeang Sangke village
Gear Type Frequency Frequency
Gillnet 39 38%
Hand-push net 27 26%
Traps 17 16%
Surround net 10 10%
Octopus line 4 4%
Trawler net 4 4%
Hook 1 1%
Stationary bagnet 1 1%
Snorkel 1 1%
Total 104 100%
30
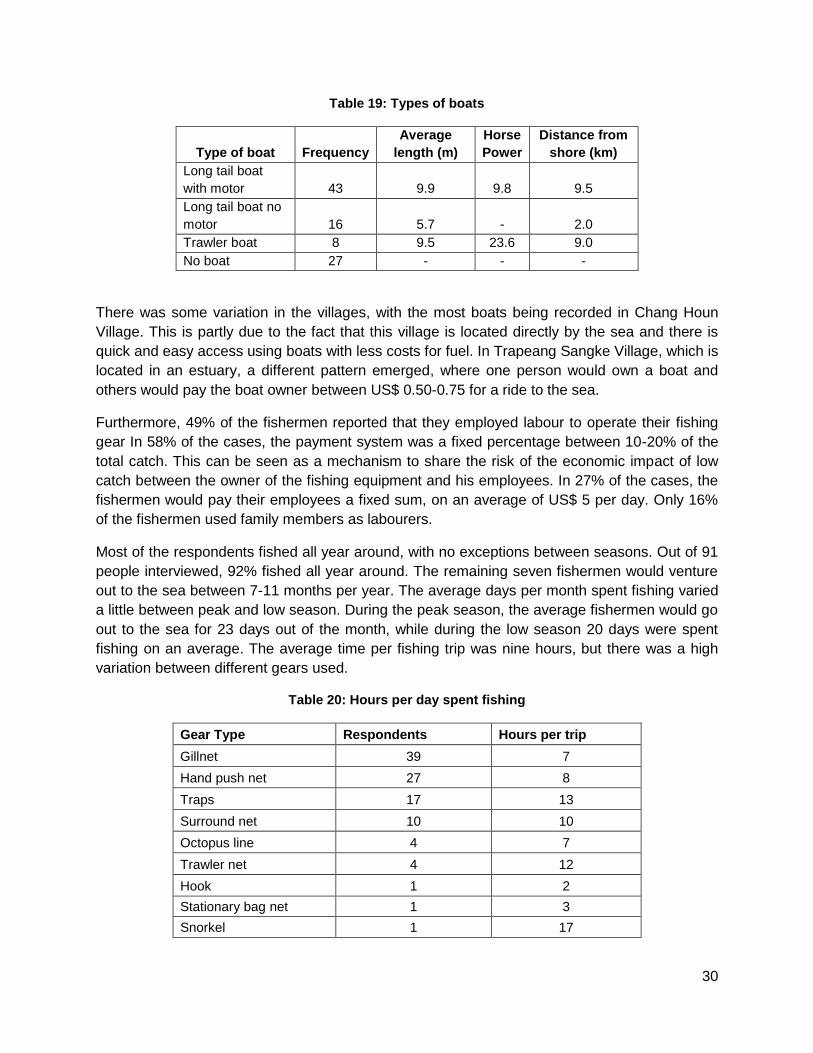
Table 19: Types of boats
Type of boat Frequency
Average
length (m)
Horse
Power
Distance from
shore (km)
Long tail boat
with motor 43 9.9 9.8 9.5
Long tail boat no
motor 16 5.7 - 2.0
Trawler boat 8 9.5 23.6 9.0
No boat 27 - - -
There was some variation in the villages, with the most boats being recorded in Chang Houn
Village. This is partly due to the fact that this village is located directly by the sea and there is
quick and easy access using boats with less costs for fuel. In Trapeang Sangke Village, which is
located in an estuary, a different pattern emerged, where one person would own a boat and
others would pay the boat owner between US$ 0.50-0.75 for a ride to the sea.
Furthermore, 49% of the fishermen reported that they employed labour to operate their fishing
gear In 58% of the cases, the payment system was a fixed percentage between 10-20% of the
total catch. This can be seen as a mechanism to share the risk of the economic impact of low
catch between the owner of the fishing equipment and his employees. In 27% of the cases, the
fishermen would pay their employees a fixed sum, on an average of US$ 5 per day. Only 16%
of the fishermen used family members as labourers.
Most of the respondents fished all year around, with no exceptions between seasons. Out of 91
people interviewed, 92% fished all year around. The remaining seven fishermen would venture
out to the sea between 7-11 months per year. The average days per month spent fishing varied
a little between peak and low season. During the peak season, the average fishermen would go
out to the sea for 23 days out of the month, while during the low season 20 days were spent
fishing on an average. The average time per fishing trip was nine hours, but there was a high
variation between different gears used.
Table 20: Hours per day spent fishing
Gear Type Respondents Hours per trip
Gillnet 39 7
Hand push net 27 8
Traps 17 13
Surround net 10 10
Octopus line 4 7
Trawler net 4 12
Hook 1 2
Stationary bag net 1 3
Snorkel 1 17
31
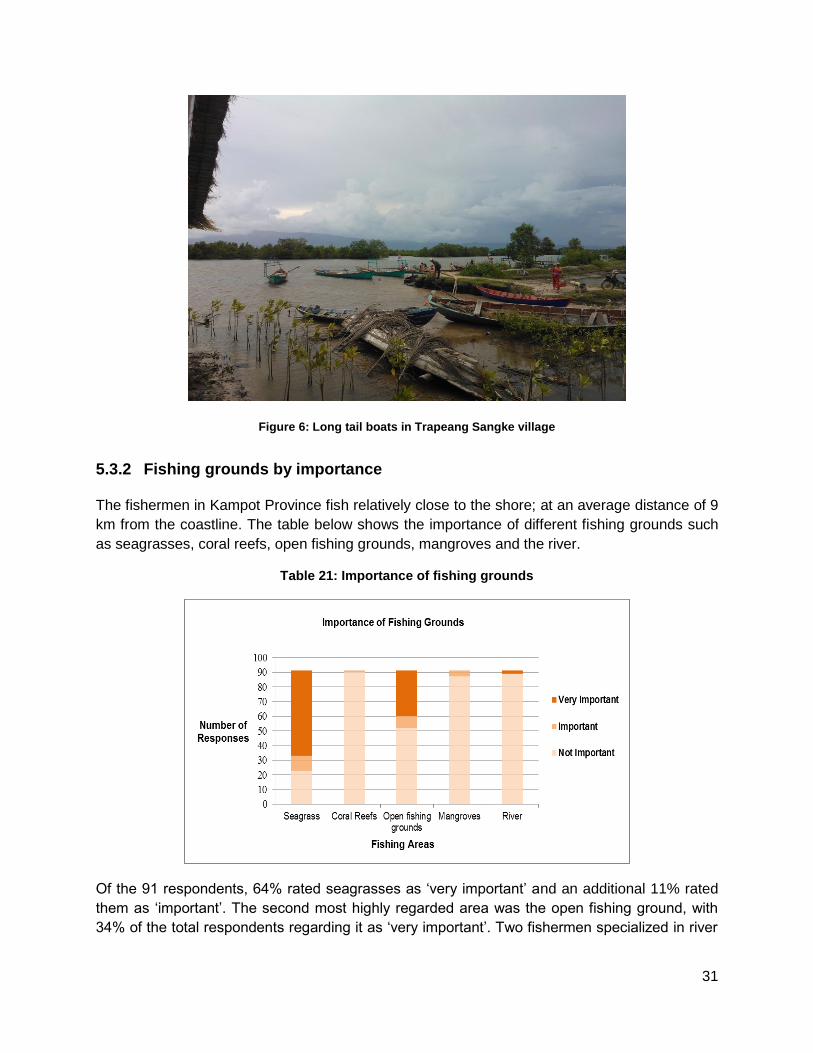
Figure 6: Long tail boats in Trapeang Sangke village
5.3.2 Fishing grounds by importance
The fishermen in Kampot Province fish relatively close to the shore; at an average distance of 9
km from the coastline. The table below shows the importance of different fishing grounds such
as seagrasses, coral reefs, open fishing grounds, mangroves and the river.
Table 21: Importance of fishing grounds
Of the 91 respondents, 64% rated seagrasses as ‘very important’ and an additional 11% rated
them as ‘important’. The second most highly regarded area was the open fishing ground, with
34% of the total respondents regarding it as ‘very important’. Two fishermen specialized in river
32
fishing. Coral reefs and mangroves were regarded as ‘not important’ by a large majority of the
respondents. The overall opinions reveal a high importance of seagrasses for local fishermen.
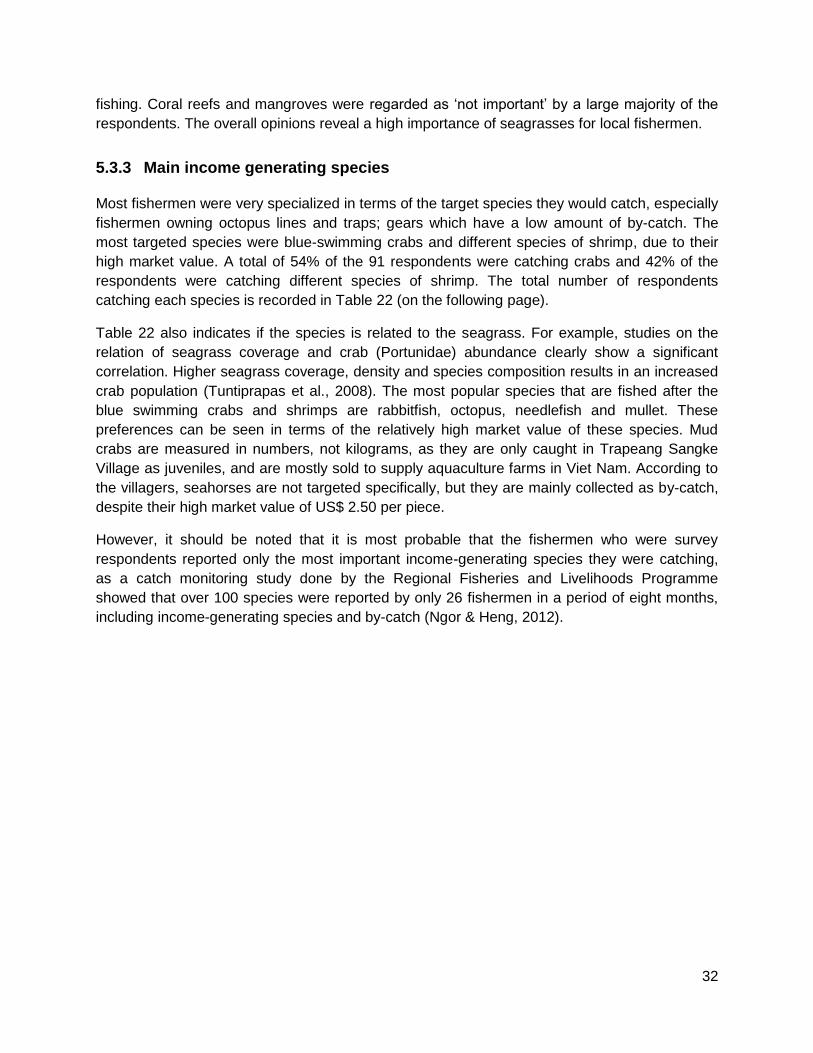
5.3.3 Main income generating species
Most fishermen were very specialized in terms of the target species they would catch, especially
fishermen owning octopus lines and traps; gears which have a low amount of by-catch. The
most targeted species were blue-swimming crabs and different species of shrimp, due to their
high market value. A total of 54% of the 91 respondents were catching crabs and 42% of the
respondents were catching different species of shrimp. The total number of respondents
catching each species is recorded in Table 22 (on the following page).
Table 22 also indicates if the species is related to the seagrass. For example, studies on the
relation of seagrass coverage and crab (Portunidae) abundance clearly show a significant
correlation. Higher seagrass coverage, density and species composition results in an increased
crab population (Tuntiprapas et al., 2008). The most popular species that are fished after the
blue swimming crabs and shrimps are rabbitfish, octopus, needlefish and mullet. These
preferences can be seen in terms of the relatively high market value of these species. Mud
crabs are measured in numbers, not kilograms, as they are only caught in Trapeang Sangke
Village as juveniles, and are mostly sold to supply aquaculture farms in Viet Nam. According to
the villagers, seahorses are not targeted specifically, but they are mainly collected as by-catch,
despite their high market value of US$ 2.50 per piece.
However, it should be noted that it is most probable that the fishermen who were survey
respondents reported only the most important income-generating species they were catching,
as a catch monitoring study done by the Regional Fisheries and Livelihoods Programme
showed that over 100 species were reported by only 26 fishermen in a period of eight months,
including income-generating species and by-catch (Ngor & Heng, 2012).
33
Table 22: Main species caught by fishermen
Family
Common
name
Frequ-
ency
Average
kg/
month
Price
/kg
(US$)
Income/
month
(US$)
Association
to sea-
grasses Reference
Penaeidae Shrimp 49 73 3.58 260.21 Yes Coles (1993)
Portunidae
Blue
Swimming
crab 38 155 3.41 527.30 Yes Fortes (1990)
Siganidae Rabbitfish 31 112 2.16 240.90 Yes Fortes (1990)
Cephalopda Octopus 30 93 3.00 278.57 Yes Fortes (1990)
Belonidae Needlefish 20 162 1.52 245.32 Yes Fortes (1990)
Mugilidae Mullet 15 35 1.99 70.41 Yes Fortes (1990)
Scombridae Mackerel 14 643 0.51 327.37 N/A N/A
Clupeidae
Chacunda
Gizzard
Shad 10 416 0.40 164.12 Yes Fortes (1990)
Leiognathidae Pony fish 7 192 0.23 43.91 Yes Fortes (1990)
Sphyranidae Barracuda 7 49 2.23 108.87 Yes Fortes (1990)
Lutjanidae Snapper 6 40 3.38 134.83 Yes Fortes (1990)
Portunidae Mud Crab 6
878
(heads) 0.07 60.36
Yes
Arshad et al.
(2006)
Polynemidae Threadfin 4 25 1.94 48.92
Yes
Gilman et al.
(2006)
Plotosidae
Striped
eel catfish 2 155 1.81 281.62 Yes Fortes (1990)
Ariidae
Sea
catfish 2 34 3.23 108.84
Yes
Arshad et al.
(2006)
N/A Oyster 1
9000
(heads) 0.09 787.50 N/A N/A
Hippocampinae Seahorse 1
50
(heads) 2.50 125.00 Yes Fortes (1990)
Engraulidae Anchovy 1 94 0.33 30.47 Yes Fortes (1990)
Sillaginidae Sillago 1 288 1.75 504.00 Yes Fortes (1990)
N/A Mixed fish 20 95 0.88 83.86 N/A N/A
N/A Trash fish 17 129 0.33 41.78 N/A N/A
Source: Compiled by author
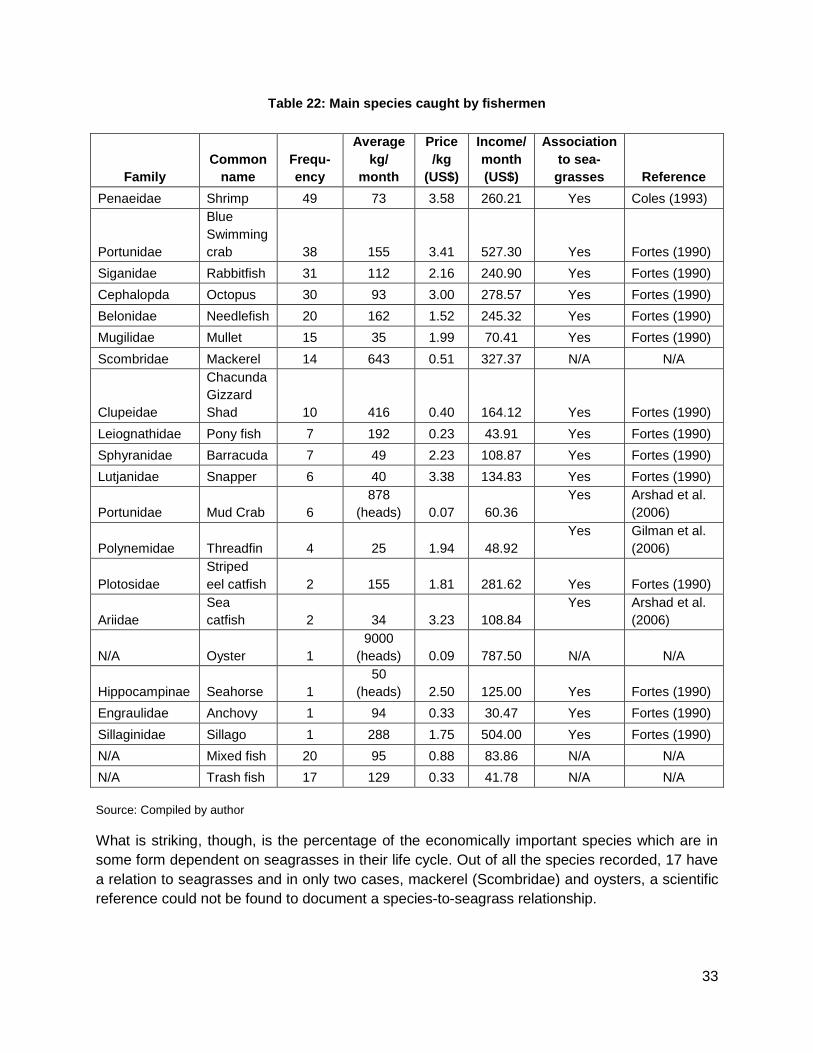
What is striking, though, is the percentage of the economically important species which are in
some form dependent on seagrasses in their life cycle. Out of all the species recorded, 17 have
a relation to seagrasses and in only two cases, mackerel (Scombridae) and oysters, a scientific
reference could not be found to document a species-to-seagrass relationship.
34
Table 23: Seagrass related species
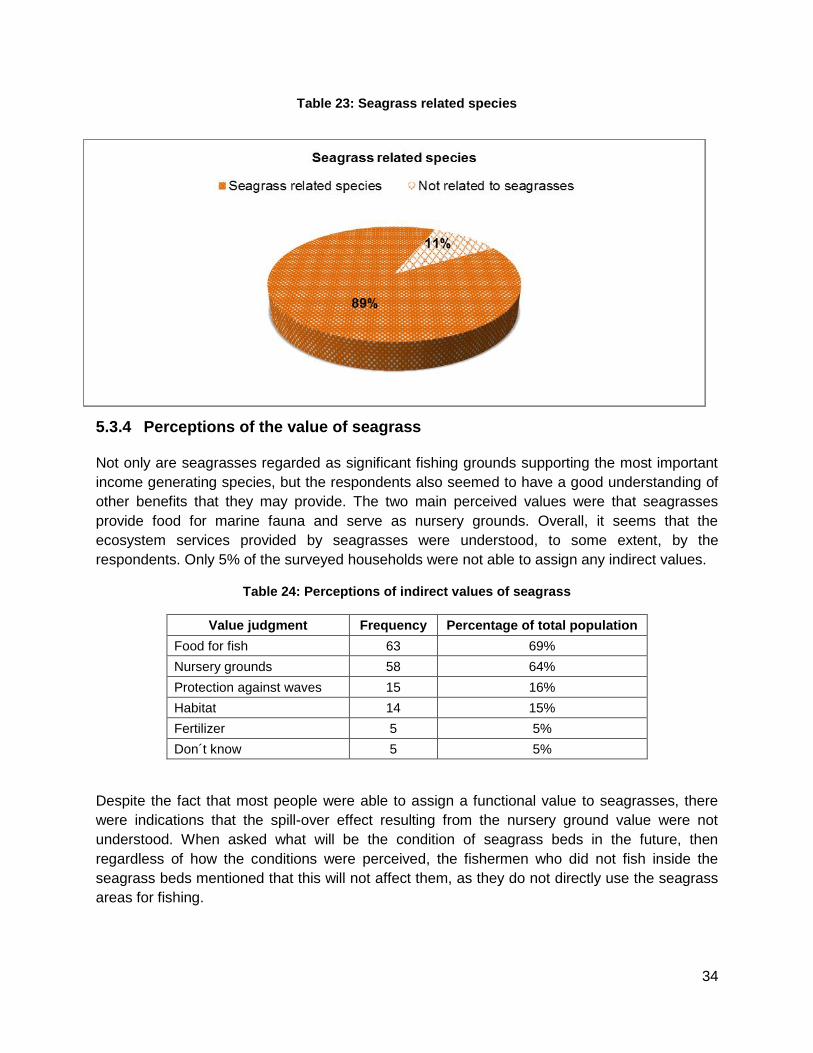
5.3.4 Perceptions of the value of seagrass
Not only are seagrasses regarded as significant fishing grounds supporting the most important
income generating species, but the respondents also seemed to have a good understanding of
other benefits that they may provide. The two main perceived values were that seagrasses
provide food for marine fauna and serve as nursery grounds. Overall, it seems that the
ecosystem services provided by seagrasses were understood, to some extent, by the
respondents. Only 5% of the surveyed households were not able to assign any indirect values.
Table 24: Perceptions of indirect values of seagrass
Value judgment Frequency Percentage of total population
Food for fish 63 69%
Nursery grounds 58 64%
Protection against waves 15 16%
Habitat 14 15%
Fertilizer 5 5%
Don´t know 5 5%
Despite the fact that most people were able to assign a functional value to seagrasses, there
were indications that the spill-over effect resulting from the nursery ground value were not
understood. When asked what will be the condition of seagrass beds in the future, then
regardless of how the conditions were perceived, the fishermen who did not fish inside the
seagrass beds mentioned that this will not affect them, as they do not directly use the seagrass
areas for fishing.

35
5.4 State and changes in fishery resources
Estimating the status of fish stocks in Kampot Province is not an easy endeavor. The last
estimates were made nearly 15 years ago in the late 1990s, and new studies are needed to give
more accurate information on the current status of fisheries resources. Kampot Province does
not have an official fish landing site, which makes consistent and accurate data collection all the
more difficult. Volumes from low catch gears such as hand-push nets are not included in the
calculations of the annual marine production of the province. In addition to this, catches sold
illegally to adjacent countries and catches harvested illegally by boats from neighbouring
countries are also not recorded, and there are no mechanisms in place to make these
estimations. Overall, it should be noted that the official statistical data should be treated
carefully, as the reported figures vary substantially and errors in recording are highly likely
(UNEP, 2007 a). However, the FiA quarterly data on fish landings can be indicative of overall
trends.
Table 25: Total marine catch in Kampot Province
The latest data obtained shows increasing pressure on the coastal resources. However, since
2009, the total catch has experienced an upward trend. Further exploration of the data also
shows an increase in grade 1 fish—high valued large fish species such as snapper and
grouper—which could be an indication of an increase in the overall fishing effort targeting these
species in the short-term, that will not be sustainable over the longer-term; or it could be due to
the increased availability of these species to Cambodian fishermen as a result of successful
conservation measures; and/or a reduction in illegal fishing pressure from neighbouring fleets.
However, the catch of trash-fish has also shown an upward trend, which may be suggestive of
increased fishing pressure, or it could be a response to market conditions in which trash-fish
has an increased value and is no longer discarded in the sea. It would take much more detailed
long-term research to fully understand these trends.
In contrast to the upward trend in official statistics, the results collected from the conducted
household survey show that majority of the respondents perceive that they are catching less fish

36
than 5-10 years ago. Despite the overall catch in the province increasing, individual fishermen
are apparently catching less.
Table 26: Perceptions of fish catch
There was considerable variation in estimating if the size of fish had changed in the past five
years. Around 49 of the total respondents indicated that the size of the fish was smaller,
whereas 34 respondents suggested that the size of fish had not changed, and only four said the
size of fish had become bigger.
Table 27: Perceptions of size of fish
An explanation for this variation may be that the respondents estimated the size of the produce
based on their particular target species. The data obtained from FiA regarding fishing gears
between 2009-2012 shows a significant jump in the numbers of crab and shrimp gillnets and
traps. This could be seen as a response to market conditions, where shrimp and crab are highly
in demand and are also highly valued. Furthermore, analysis of the FGDs show that the fish
stocks have been perceived as being relatively abundant over the past 18 years. However, the
crab population is perceived to be under considerable pressure, leading to decreasing stocks
and an increasing catch of smaller sized crabs.
Amount of catch Frequency Percentage
Less 75 82%
Same 6 7%
More 9 10%
Don’t know 1 1%
Total 91 100%
Size of fish Frequency Percentage
Smaller 49 54%
Same 34 37%
Bigger 4 4%
Don´t know 4 4%
Total 91 100%

37
Figure 5: Middlemen waiting to buy blue-swimming crabs in an unofficial landing site
5.5 Drivers of change and proposed solutions
There are noticeable trends in both fisheries resources and the coastal habitats. The annual
catch data from FiA (2003-2012) shows increasing fishing efforts, while the fishermen
themselves reported catching less and less fish per person. The size of the commercially most
demanded species is also seen to be declining. All of this is an indication that unsustainable
fishing practices have been dominant. Furthermore, Kampot Province is increasingly targeted
by large scale development projects, which are putting the health of coastal ecosystems at
considerable risk. The Problem Matrix and Solution exercise in all the villages revealed the main
issues of concern and the best potential solutions seen from the perspective of the villagers.
From the data analysis, six main themes emerged which are discussed in detail below.
5.5.1 Development activities, loss and degradation of habitat
The main concern in three out of the four villages is coastal development. Sand mining and
landfilling of seagrass beds is seen as the predominant driver of degradation of coastal habitats.
Sand mining for export purposes is still clearly visible, despite the complete ban on it which was
enforced in 2009 (MFF, 2013). The International Port Development and the Kampot Special
Economic Zone will be developed on reclaimed land

38
Figure 6: Map indicating location of port development
Source: Fisheries Administration Cantonment (2010)
Figure 4 clearly shows that the international port is planned directly on the most extensive
seagrass patch; covering an area of a little over 23,000 ha. According to the EIA published in
2010, 1,449 ha of seagrasses will be lost due to land-filling and 587 ha will be lost due to
dredging the navigational waterways. A total of 2,036 ha of seagrasses will be lost due to this
project. In addition, other areas of natural seagrass near the project site will be impacted
indirectly due to deterioration in water quality. The reasons for this project to be planned and
built directly on one of the most productive ecosystems in the world are unclear.
Another problematic issue is the encroachment into mangrove areas due to the expansion of
salt farms. Production of salt in Cambodian coastal areas covers 4,000 ha, with 85% of this
lying in Kampot Province (Khim, 2010). This is also inducing another problem of salt intrusion
into agricultural lands, thereby decreasing the productivity of that scarce resource in the coastal
areas.
The main solution proposed for these issues was a call for coastal zoning, with the
establishment of more legally recognized conservation areas, while at the same time
empowering local communities to manage and protect them. Furthermore, it was suggested that
local authorities should keep a close eye on development projects to ensure proper mitigation of
their negative effects on natural resources.
39
5.5.2 Disputes over fishing areas
Disputes mainly occur due to incompatibility of different types of fishing devices used in the
same locations. However, in the case of Chang Houn Village, these have escalated to an
international level. Cambodia’s Exclusive Economic Zone legally overlaps with those of its
neighbours Viet Nam and Thailand (Seng et al., 2005). Further complicating this issue is the
notoriously disputed island of Phú Quốc (Koh Trol) belonging to Viet Nam, which is merely 10
km away from the coast of Cambodia.
The overall solution proposed was a clear demarcation of fishing areas based on gears used
and the clarification of fishing domains between Cambodia and Viet Nam.
5.5.3 Use of illegal fishing devices
The use of illegal fishing devices was also a major issue which was brought up in all the villages
during the study. In addition to the results of the FGDs, 49% of household respondents also
found that illegal fishing was contributing to lower fish catch. The use of pair trawlers, small
mesh-sized nets, and motorized push nets in shallow waters are regarded as problematic
issues leading to the degradation of habitat and small-aquatic resource collection. The
persistence of illegal activities is seen to be the result of a lack of knowledge regarding the
effects of such practices.
Further complicating the issue are the offences of foreign boats operating illegally in Cambodian
waters. Contributing to this problem is the fact that the laws in Viet Nam and Cambodia
regarding legal vessels are different. For example, pair trawling is completely prohibited in
Cambodia and is punishable as an offence with a prison sentence. The same vessels are legal
in Viet Nam if used in the deep sea, and are considered illegal offences that are punishable with
a fine. In Kampot, illegal offences by Vietnamese operators are most common due to the
proximity to the border between the two countries and Phú Quốc Island. However, there is
collaboration amongst the FiA in Cambodia and the FiA in Viet Nam to ensure mutual learning
and cooperation in order to crack down on any such illegal activities.
The solutions for the use of illegal fishing devices were suggested as increased patrolling
efforts, strengthening the capacity of existing teams, and increasing cooperation and
collaboration with local authorities in suppressing these illegal activities. Furthermore, it was
suggested that outreach and education programmes would be beneficial to disseminate
knowledge on the impacts of illegal fishing gears and the collection of juvenile marine
resources.
5.5.4 Increase in fishermen
Another issue that emerged from the FGDs is the large number of fishermen, which is regarded
as problematic due to the increase in the overall fishing pressure, leading to lower catch of fish
by individuals. Furthermore, 58% of respondents in the household survey found that an increase
in fishermen was a reason for lower fish catch. Alternative livelihood options in rural areas are
40
seen to be scarce, as there is lack of land for agriculture. Fishing provides a fast daily income
and is often more lucrative than wage labour.
Alternative livelihood development was seen to be the main solution for reducing the pressure of
the growing number of fishermen. Suggestions made were to train communities in marine
product processing techniques, marine aquaculture, integrated farming systems, and eco-
tourism.
5.5.5 Low capital and increasing costs
Despite the fact that half of the respondents have loans, access to adequate capital to invest in
fishing equipment is still seen as an issue. Another perceived problem is the middlemen-based
selling structure, which results in lower prices for marine products. In addition, gasoline prices
have increased, resulting in higher cost inputs without the return of higher outputs.
The solutions put forth were to establish a savings group in the village to increase capital
availability at low interest rates. The establishment of a cooperative was also supported as a
possible way to increase the price of marine catch.
5.5.6 Climate change
The increase in storms and natural disasters is also seen as a significant problem. Severe
weather conditions affect income levels, as there are fewer days during which fishermen can go
out to sea. The rise in sea temperature could also have a severe impact, as with higher
temperatures marine resources migrate seawards, which in turn affects the large group of
fishermen using gears suitable only for fishing near the coast.
The solutions proposed by respondents during the FGDs to offset the increase in the destructive
capacity of storms were seen in replanting and conserving the existing forests, especially
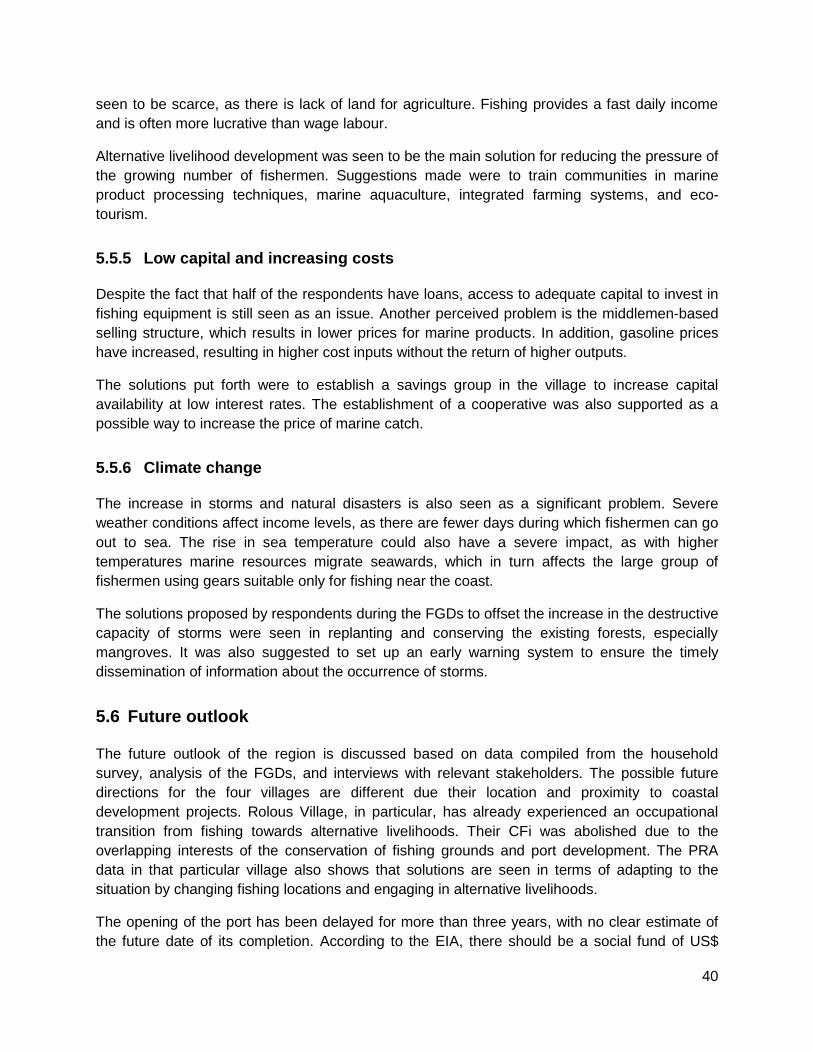
mangroves. It was also suggested to set up an early warning system to ensure the timely
dissemination of information about the occurrence of storms.
5.6 Future outlook
The future outlook of the region is discussed based on data compiled from the household
survey, analysis of the FGDs, and interviews with relevant stakeholders. The possible future
directions for the four villages are different due their location and proximity to coastal
development projects. Rolous Village, in particular, has already experienced an occupational
transition from fishing towards alternative livelihoods. Their CFi was abolished due to the
overlapping interests of the conservation of fishing grounds and port development. The PRA
data in that particular village also shows that solutions are seen in terms of adapting to the
situation by changing fishing locations and engaging in alternative livelihoods.
The opening of the port has been delayed for more than three years, with no clear estimate of
the future date of its completion. According to the EIA, there should be a social fund of US$
41
250,000 per year over 10 years that should be allocated for vocational training of community
members. However, none of this money has as yet been received by affected communities. As
the FiA Chief pointed out, the communities have unfortunately lost their fishing grounds, while
no new jobs have been currently created due to the delay in port construction.
Overall, the interviewed government officials agreed that the benefits from port development are
higher than the losses. They believe that the jobs created and the monetary contribution to
Kampot Province will result in a general positive effect. What exactly will happen to the
economy of Kampot is unclear, but it is most probable that port development will bring in
benefits to the trade and processing industry of marine products. Currently, processing is only
done on a small scale, with the only commercial scale company for frozen shrimp operating in
Sihanoukville (UNEP, 2007a). It can be expected that national and foreign investment will flow
in to establish manufacturing due to the increased possibility for export. Furthermore, it is most
probable that an official landing site will be created, which will benefit local trading.
These developments, however, do not come without costs as the pollution from the port may be
hazardous to the marine habitat and fauna. The discharge of ballast and the use of anti-fouling
paints for ships which cause reproductive disorders in marine organisms can disrupt the local
ecological balance (UNEP, 2007a). That said, according to the EIA, in addition to the social
funds, an extra US$ 250,000 per year over 10 years will be allocated toward ecosystem
rehabilitation; including mangrove and seagrass replanting. Currently, none of this money has
been received and it is unclear when the payments will start. Furthermore, it is questionable if
the estimated economic loss of US$ 2-4 million/year due to the loss of 2036 hectares of
seagrass can be offset by this amount. Seagrass recovery and replanting techniques are still in
a developmental stage and can be very expensive (Ganassin & Gibbs, 2008).
Despite the increasing pressure on coastal resources, the PRA data shows another trend
emerging in Chang Houn, Trapeang Sangke and Koh Kreusna villages. Due to the
establishment of CFis and conservation areas, an increase in the health of seagrasses has
been reported over the past three years. The CFis in general seem to have a considerable
influence in the villages, as 90% of the household survey respondents in these three villages
were members of a community fishery. The benefit of the CFis are seen by these respondents
in the protection of fishing grounds (52%); establishment of conservation areas (23%);
education and awareness-raising (12%); and reporting illegal activities (11%). Hence, to a large
extent, CFis seem to be working as the critical response system to the main issues seen to be
threatening the habitat and sustainability of fishing. Other studies have also indicated that the
expectations from CFis are high in Kampot Province, as they are seen as legal management
mechanisms empowering local communities and helping to facilitate external support from
government programmes and development organizations (The Learning Institute, 2010).
The interviews conducted with CFi chiefs also indicated that since the establishment of new
management practices, the seagrass and mangrove areas are protected; awareness of the
need for conservation of resources amongst fishermen is higher; and collaboration with
governmental institutions such as the FiA is stronger.

42
This relatively recent change in management practices of coastal resources can also be seen in
the variations of perceived future conditions of the seagrass habitat amongst individual
respondents.
Table 28: Condition of seagrass in the future
Condition of seagrass in the future All villages Percentage
Better 34 37%
Same 6 7%
Worse 41 45%
Don’t know 10 11%
Total 91 100%
Although the majority of fishermen (45%) see the condition of the ecosystem as being in a state
of deterioration, many (37%) respondents expect the condition of the seagrass beds to improve
in the future. These respondents see their incomes rising in the following years due to the
increase in marine catch.
Table 29: Perceptions of the sustainability of a career in fishing
Fishing in the future Frequency Percentage
Yes 63 69%
No 9 10%
Undecided 19 21%
Total 91 100%
A large majority of the households interviewed also see themselves as continuing with a career
in fishing. The main reason given for this choice was that this was the only skill that they have,
and the only occupation with that they can sustain themselves with. Around 21% of the
respondents were undecided about whether they will continue fishing in the future. This group
explained that they will remain fishermen, provided they can generate sufficient income and the
marine catch does not decline.
VI. Findings
The main objective of this study was to assess the extent of dependence of coastal fishermen
on the seagrass ecosystem. It is clearly visible from the data that dependency is high:
Around 89% of the income generating species caught by fishermen are in some way
dependent on the seagrass ecosystem.
Fishing is providing economic and food security to a large segment of the population in
Kampot Province. No formal statistics are as yet available, but it can be estimated that
the number of people dependent on marine fishing is high. There are 3,054 members in
the currently registered CFis in Kampot Province. The actual number of fishermen may
43
be twice as high, because not all fishery villages have a CFi and not all fishermen are
members.
A conclusion of these two key findings is that any changes in the health, composition and
coverage of the seagrass beds will result in a decline of marine fauna, which will severely affect
the economic and food security in Koh Kong Province.
Another topic explored was the state of inshore fishery resources. It can be concluded that
currently there is still a large and productive seagrass area in Kampot Province, but that it is
exhibiting signs of increasing pressure.
Statistics from FiA between 2003 and 2012 show an increasing trend in overall volumes
of marine catch in Kampot Province.
Around 82% of the household survey respondents perceive that they are catching less
marine products than 5-10 years ago.
Qualitative data from the FDGs shows that the most important income-generating
aquatic species group, crab, has been declining in both size and numbers.
Increasing volumes of overall catch, but decreasing volumes and size of the higher value
marine products, are indicative of the escalating pressure on coastal ecosystems.
The exploration of the drivers of change in seagrass health and fishery resources revealed that
there are numerous demands from multiple stakeholders on the coastal area of Kampot
Province. Pressure is exerted on coastal resources via:
Population growth and increase in fishermen;
Lack of skills and shortage of alternative livelihood options;
Illegal gear usage and foreign vessels operating illegally in Cambodian waters;
Coastal development projects;
Climate change.
It is expected that as a result of these pressures, the coastal area of Kampot Province will
experience considerable changes in the patterns of resource usage. The Council for
Development of Cambodia (CDC) sees two industries with a high potential for growth in Kampot
Province - tourism and marine products. The role of the Kampot SEZ is to act as a hub for
manufacturing, while the international port is intended to invigorate tourism and increase the
export of marine products (CDC, 2013).
Effects of these development projects will be manifold. While creating new jobs and industries,
these projects will also threaten the health of the ecosystem and the economic security of
subsistence fishermen. These consequences are already being felt by communities adjacent to
the coastal development, as they have reported a decline in marine produce and income
resulting in many being forced to change their occupations. These findings highlight the
importance of mitigating negative effects of such development activities to ensure that both the
integrity of the ecosystem remains intact and that the affected communities are given adequate
training to be able to transition to alternative livelihoods.
44
Possible effects of climate change on the seagrasses are highly unclear (Morgan, 2011).
Increase in the frequency and severity of storms is already noticed by fishermen, but how the
ecosystem will respond to higher water temperatures and CO2 levels is under researched by the
scientific community.
The last objective of the present study was to explore the management of coastal resources.
Decentralization of natural resource management in Cambodia has proven to be successful in
Kampot Province:
Qualitative data from the FDGs shows an increase in the health and distribution of
seagrass in villages with a CFi.
CFis have a considerable influence in the villages and 90% of the respondents were CFi
members.
CFis are reported to be integral in protecting fishing grounds, establishing conservation
areas, providing education and awareness, and reporting illegal activities.
The results of the present study show that Community Fisheries are highly regarded by their
members and are reported to be effective in sustainably managing their fishery areas through
knowledge dissemination and law enforcement.
Overall, it is evident that there are significant pressures on coastal resources of Kampot
Province. However, if supported and strengthened, there are also management mechanisms
which could be effective in combating some of these negative effects. Most importantly, what
needs to be central to all future coastal development plans and activities is the recognition that
the seagrass ecosystem is providing food and economic security to thousands of households,
while also acting as a significant revenue stream for the province.
VII. Recommendations
The completion of the Coastal Zoning Plan for Kampot Province designating appropriate
areas for development, fishing and conservation in close cooperation with existing CFis.
This is currently in the initial phases of planning, and will be supported until the end of
the BCR project in 2014.
An increase in conservation areas, in close cooperation with the existing CFis, by
strengthening their knowledge and capacity for coastal resource management.
Scientific analysis comparing the productivity of the area with a CFi and an area without
a CFi to assess the ecological benefits of community management.
Scientific assessment of the value of seagrasses, including an estimation of both
ecosystem goods (e.g., marine fauna) and services (e.g., carbon sequestration) to be
able to measure the true benefit of seagrasses to Kampot Province, as a means of
securing long-term financing for improved seagrass management. As Cambodia is now
a full member of MFF, some grants could possibly be allocated to support these
activities.
45
VIII. References
Arshad, A. et al. (2006). Fish communities from seagrass bed of Merchang Lagoon,
Terengganu, Peninsular Malaysia. Coastal marine science. Vol. 30 (1): 268-275.
Council for the Development of Cambodia (2013). Provincial Government Policies for
Investment Promotion. Provincial Brief Introduction. Available at:
http://www.cambodiainvestment.gov.kh/kampot-province.html
World Factbook. (2013). Cambodia. Washington, DC: Central Intelligence Agency. Available
at: https://www.cia.gov/library/publications/the-world-factbook/index.html
Coles, G. R. et al. (1993). Distribution of Seagrasses, and their Fish and Penaeid Prawn
Communities, in Cairns Harbour, a Tropical Estuary, Northern Queensland, Australia.
Australian Journal of Marine and Freshwater Research1993 (44):193-210.
Department of Fisheries (2004). Map of Seagrass Distribution. Phnom Penh: Department of
Fisheries.
Department of Fisheries. (2005). National Report on Seagrasses of Cambodia. Phnom
Penh: Department of Fisheries.
Fisheries Administration Cantonment. (2013). Community Fisheries in Kampot Province.
Kampot: Fisheries Administration Cantonment.
Fortes, M.D. (1990). Seagrasses: A Resource Unknown in the ASEAN Region. Philippines:
International Center for Living Aquatic Resources Management.
Ganassin, C. and Gibbs, P.J. (2008). A review of seagrass planting as a means of habitat compensation following loss of seagrass meadow. New South Wales Department of Primary Industries. Fisheries Final Report Series No. 96. ISSN 1449-9967.
Gilman et al. (2006). Pacific Island Mangroves in a Changing Climate and Rising Sea.
United Nations Environment Programme Regional Seas Reports and Studies. Nairobi:
Kenya.
Khim, K. (2010). Review on the current status of fisheries/aquaculture and policies of
Cambodia relevant to RFLP. Regional Fisheries Livelihoods Programme for South and
Southeast Asia (GCP/RAS/237/SPA). Policy Paper CMB#1. 34 pp.
Law on Fisheries (2007). Law on Fisheries. Unofficial translation.
Mangroves for the Future. (2013). Cambodia. National Strategy and Action Plan 2014-2016.
Mangroves for the future. Phnom Penh: Mangroves for the Future.
Ministry of Land Management, Urban Planning and Construction. (2012). Kampot Hot Spot
Map. Phnom Penh: Ministry of Land Management, Urban Planning and Construction.
46
Ministry of Environment (2005). State of the Coastal Environment and Socio-Economy in
Cambodia. Phnom Penh: Ministry of Environment.
Morgan, C.L. (2011). Limits to Adaptation: A review of Limitations Relevant to the Project
“Building Resilience to Climate Change - Coastal Southeast Asia.” Gland, Switzerland:
IUCN.
Ngor, P.B. and Heng, K. (2012). Systems and Procedures for participatory monitoring of
management measures developed, introduced and implemented - Catch Monitoring. For the
Regional Fisheries Livelihoods Programme for the South and Southeast Asia Cambodia
Component. Kampot: Cambodia.
Osborne P.L. (Ed.) (2012) Tropical Ecosystems and Ecological Concepts. United Kingdom:
Cambridge University Press.
Rizvi, A.R. and Singer, U. (2011). Cambodia Coastal Situation Analysis. Gland, Switzerland:
IUCN. 58 pp.
Seng, K., Song, S.L., Navy, H. and Leang, S. (2005). Conflicts Arising from Re-Allocation of
Fishing Lots: Perceptions from Community Fisheries in Cambodia. In Cambodia Country
Report (2005).
The Learning Institute (2010). Cambodia baseline survey final report. Regional Fisheries
Livelihoods Programme for South and Southeast Asia (GCP/RAS/237/SPA) Field Project
Document 2010/CMB/1.
Tuntiprapas, P. et al. (2008). The Effect of Seagrass Coverage On Swimming Crabs
(Portunidae) At Koh Tha Rai, Khanom – Mu Koh Talay Tai National Park, Nakorn Si,
Thammarat Province, Southern Thailand. Proceedings of the 6thIndonesia-Malaysia-
Thailand Growth Triangle University Network Conference, Penang, Malaysia, 28-30 August,
2008, 324-329.
United Nations Environment Programme (2007a). National Reports on the Fish Stocks and
Habitats of Regional, Global, and Transboundary Significance in the South China Sea.
UNEP/GEF/SCS Technical Publication No.15. Thailand: United Nations Environment
Programme
United Nations Environment Programme (2007b). Procedure for Determination of National
and Regional Economic Values for Ecotone Goods and Services, and Total Economic
Values of Coastal Habitats in the context of the UNEP/GEF Project Entitled: “Reversing
Environmental Degradation Trends in the South China Sea and Gulf of Thailand” South
China Sea Knowledge Document No.3. UNEP/GEF/SCS/Inf.3. Thailand: United Nations
Environment Programme.
INTERNATIONAL UNION FOR
CONSERVATION OF NATURE
IUCN Asia Regional Office
63 Soi Prompong
Sukhumvit 39
Wattana - 10110,
Bangkok, Thailand
Tel: +66 2 662 4029
www.iucn.org/building-coastal-resilience


![Kampot Pepper[1]](https://static.fdocuments.in/doc/165x107/577d29d41a28ab4e1ea7f97b/kampot-pepper1.jpg)