Socio-economic factors influencing the adoption of in ...
154
Socio-economic factors influencing the adoption of in-field rainwater harvesting technololgy for enhancing household food security by smallholder farmers in the Nkonkobe Municipality, Eastern Cape Province By Shange N.S.Q. (200909207) Submitted For the Fulfilment of a Masters Degree of Agricultural Economics in the Department of Agricultural Economics and Extension Faculty of Science and Agriculture University of Fort Hare, South Africa Supervisor: Prof. A. Mushunje January 2015
Transcript of Socio-economic factors influencing the adoption of in ...

Socio-economic factors influencing the adoption of in-field rainwater harvesting
technololgy for enhancing household food security by smallholder farmers in the
Nkonkobe Municipality, Eastern Cape Province
By
Shange N.S.Q.
(200909207)
Submitted
For the Fulfilment of a Masters Degree of Agricultural Economics
in the
Department of Agricultural Economics and Extension
Faculty of Science and Agriculture
University of Fort Hare, South Africa
Supervisor: Prof. A. Mushunje
January 2015

i
DECLARATION
I, the undersigned, hereby declare that the work contained in this research is my own work
and that this study is my original work which has not previously, in its entirety or in part been
submitted at any university for a degree. Information extracted from other sources is
acknowledged accordingly.
This dissertation is submitted in fulfillment of the requirements for the degree Master of
Science in Agriculture (Agricultural Economics) at the University of Fort Hare.
……………………………. …………………………..…….
Nomfundo Shange Date

ii
DEDICATION
I dedicate this work to my mother Mrs L.A. Mncwango and my son Xolisa Ndara

iii
ACKNOWLEDGEMENTS
I wish to express my sincere gratitude to everyone who contributed towards the success of this
research project. It would not have been possible without your input, time and support; I really
appreciate your help. I would like to thank GOD ALMIGHTY for opening up the way for me:
you had it all planned. Thank you Lord for the wisdom, guidance and the power to sail through,
you made the accomplishment of this task possible for me.
Prof. A. Mushunje, my supervisor, I would like to thank you for your mentorship, support,
motivation, patience, understanding, kindness and critical insight during this study.
To all the respondents, who gave of their time in completing an ample and detailed
questionnaire: I appreciate your contribution and am grateful for that. Your contribution made it
possible for me to compile this research, and it would have been impossible without your
willingness to cooperate.
Special mention also goes to my family, especially my mother and son. Mother, you listened to
me, believed and supported me through-out. Your belief in my ability to complete this research
project pushed me into putting in extra effort. My son, thank you for understating that I am not
always there for you.
Special thanks also go to Dr. Lovemore Musemwa, Dr. Melusi Sibanda, Dr. Misery Sikwela,
Dr. Sunday Hosu and Dr. Kenneth Nhundu for their assistance and patience towards me, and for
always giving me hope. May the Lord bless you all.
My fellow colleagues and friends: Ms Nkele Malahlela, Ms Bongiwe Nxumalo, Ms Tshifiwa
Labase and Mr Siphe Zantsi, I would like to thank all of you for the moral support that you have
provided me during the course of my research project.

iv
ABSTRACT
In-field rainwater harvesting (IRWH) technology has been used in arid and semi-arid parts of
the world and promising results have been achieved in terms of increasing yield. The main aim
of this study was to identify socio-economic factors determining the adoption of IRWH
technology for enhancing household food security by smallholder farmers. The specific
objectives were to assess the level of adoption of IRWH technology using descriptive statistics
(mean, frequency and percentages). To determine socio-economic factors influencing adoption
of IRWH technology, the binary logistic regression model was used. To determine whether
adopters of IRWH technology are more food secure than non-adopters, the Household Dietary
Diversity Score (HDDS) was used as a measure for household food security. For the same
objective, to determine socio-economic factors that influence household food security, the
binary logistic regression model was also used and adoption of IRWH technology became an
independent variable.
The study was conducted in Khayalethu, Guquka and Krwakrwa villages in Nkonkobe
Municipality in the Eastern Cape Province (EC). The unit of analysis was the individual
smallholder farmers practicing agriculture. The availability (accidental) and snowball
sampling techniques were used to select 34, 23, 63 respondents from Khayalethu, Guquka and
Krwakrwa villages respectively. Since they are non-random, these sampling methods are
problematic because of sampling errors. Overall, a sample size of 120 smallholder farmers was
targeted for the interviews. Primary and secondary data collected was coded and analysed
using statistical package for social sciences (SPSS) version 21. Results were presented using
graphs, pie charts and tables (including cross-tables).
The descriptive results showed that adoption status of IRWH technology was low in these areas,
with 79% not adopting the technology. Food insecurity was high amongst the non-adopters with
86%. On the basis of descriptive analysis it can be concluded that any change in each one of the
significant variables can significantly influence the probability of adopting IRWH technology
and household food security.
The results from the logistic regression model for the incidence of adoption revealed that 6 out
of 16 variables were significant, three at 1% (access to extension services, access to

v
information and farmers’ perception towards the IRWH technology); one at 5% (access to
market) and two at 10% (access to hired labour and farm income). For the incidence of
household food security, out of 17 variables, 6 were significant, three at 1% (adoption of the
IRWH technology, access to extension services and farmers’ perception towards the IRWH
technology); two at 5% (access to hired labour and household income) and one at 10%
(household size). The empirical findings of this study indicate that there are socio-economic
factors influencing adoption of IRWH technology and household food security amongst
smallholder farmers.
This study recommends that the government should provide extension officers and research
stations with the capacity, support and physical means to expose smallholder farmers to the
IRWH technology through demonstrations and trainings. The government can also introduce
agricultural finance institutions in rural areas to assist the rural smallholder farmers to
increase their access to credit. Further, it is recommended that smallholder farmers can expand
to the communal croplands in order to gain more land size and work as a co-operative or as an
association to ease labour constraints.
Keywords: smallholder farmers, adoption, in-field rainwater harvesting technology, increased
yield, household dietary diversity score, household food security, adopters, non-
adopters, binary logistic model

vi
TABLE OF CONTENTS
DECLARATION ......................................................................................................................i
DEDICATION ........................................................................................................................ ii
ACKNOWLEDGEMENTS ................................................................................................... iii
ABSTRACT ............................................................................................................................ iv
LIST OF ACRONMYS ......................................................................................................... xi
LIST OF TABLES. ............................................................................................................... xiv
LIST FIGURES ..................................................................................................................... xv
CHAPTER 1: INTRODUCTION ........................................................................................... 1
1.0 Introduction to the chapter ................................................................................................... 1
1.1 Background to the study....................................................................................................... 1
1.2 Problem statement................................................................................................................ 4
1.3 Objectives of the research .................................................................................................... 6
1.4 Research questions ............................................................................................................... 6
1.5 Delimitation ........................................................................................................................ 6
1.6 Outline of the study .............................................................................................................. 7
CHAPTER 2: LITERATURE REVIEW ................................................................................ 8
2.0 Introduction ......................................................................................................................... 8
2.1 Adoption of new agricultural technology ............................................................................. 8
2.2 Overview of a smallholder farmer in South Africa ............................................................. 11
2.3 Rainwater harvesting technologies employed by smallholder farmers ................................ 12
2.3.1 Types of rainwater harvesting technologies ................................................................. 13
2.3.1.1 Domestic rainwater harvesting technology ......................................................... 13
2.3.1.2 Ex-field rainwater harvesting technology ........................................................... 13
2.3.1.3 In-field rainwater harvesting technology ............................................................ 14

vii
2.4 Implementation of IRWH technology in the Nkonkobe Municipality.. ............................... 15
2.4.1 Participants of IRWH technology in the Nkonkobe Municipality ................................. 17
2.4.2 The impact of IRWH technology in the Nkonkobe Municipality .................................. 18
2.5 Requirements for the IRWH technology............................................................................. 19
2.6 Benefits associated with the adoption of IRWH technology ............................................... 20
2.6.1 Increased production yield .......................................................................................... 21
2.6.2 Generation of income .................................................................................................. 22
2.6.3 Improving food security .............................................................................................. 23
2.6.4 Improving nutritional status......................................................................................... 25
2.7 Factors influencing adoption of IRWH technology in enhancing household food security. . 26
2.8 Summary ........................................................................................................................... 37
CHAPTER 3: SELECTION AND DESCRIPTION OF THE STUDY AREAS ................. 39
3.0 Introduction ....................................................................................................................... 39
3.1 Selection of the study areas ................................................................................................ 39
3.2 Description of the study areas ............................................................................................ 39
3.2.1 Climate and rainfall ...................................................................................................... 41
3.2.2 Soils in the Khayalethu, Guquka and Krwakwra villages. ........................................... . 42
3.2.3 Governance. ............................................................................................................... . 42
3.2.4 Demographics .............................................................................................................. 43
3.2.5 Income levels. ............................................................................................................ . 47
3.2.6 Economic activities ...................................................................................................... 47
3.2.7 Infrastructural profile. ................................................................................................ . 49
3.3 Summary ........................................................................................................................... 51
CHAPTER 4: RESEARCH METHODOLOGY ................................................................. 52
4.0 Introduction ....................................................................................................................... 52

viii
4.1 Research design ................................................................................................................. 52
4.1.1 The orientation stage. ................................................................................................ . 52
4.1.2 The survey stage ......................................................................................................... 53
4.2 Unit of analysis .................................................................................................................. 53
4.3 Sampling frame.................................................................................................................. 54
4.4 Sampling procedure ........................................................................................................... 54
4.5 Sample size ........................................................................................................................ 54
4.6 Data collection method ...................................................................................................... 55
4.7 Methods of analysing factors influencing adoption of the agricultural technologies and
household food security used in related studies .................................................................. 57
4.7.1 Binary logistic regression model (Logit model) ........................................................... 57
4.7.2 Binary probit regression model (Probit model) ............................................................ 59
4.8 Food security measures used in related studies ................................................................... 60
4.8.1 Household Caloric Acquisition .................................................................................... 60
4.8.2 Coping Strategy Index ................................................................................................. 61
4.8.3 Dietary Diversity Score ............................................................................................... 61
4.9 Theoretical and conceptual frameworks ............................................................................. 63
4.10 Data analysis .................................................................................................................... 65
4.10.1 Binary logistic regression model ................................................................................ 66
4.10.1.1 Explanatory variables and priori expectations ...................................................... 69
4.11 Summary ......................................................................................................................... 74
CHAPTER 5: RESULTS OF THE DESCRIPTIVE ANALYSIS AND DISCUSSION ...... 76
5.0 Introduction ....................................................................................................................... 76
5.1 Adoption status in the study areas ...................................................................................... 76
5.2 Household food security status in the study areas ............................................................... 76

ix
5.3 Adoption status and household food security in the study areas .......................................... 77
5.4 Demographic and socio-economic characteristics in relation to the adoption of IRWH
technology and household food security status ................................................................... 78
5.4.1 Demographic characteristics of the household heads in the study areas......................... 78
5.4.1.1 Gender of the household heads ............................................................................... 78
5.4.1.2 Age distribution of the household heads ................................................................. 80
5.4.1.3 Educational level of the household heads ................................................................ 81
5.4.1.4 Household size ....................................................................................................... 83
5.4.2 Socio-economic characteristics influencing the adoption of IRWH technology and
household food security............................................................................................... 84
5.4.2.1 Access to hired labour ............................................................................................ 84
5.4.2.2 Household income distribution of the household heads ........................................... 85
5.4.2.3 Farm income distribution of the household heads ................................................... 88
5.4.2.4 Land security of tenure distribution of the household heads .................................... 89
5.4.2.5 Land size distribution of the household heads ......................................................... 90
5.4.2.6 Access to market .................................................................................................... 91
5.4.2.7 Access to credit ...................................................................................................... 92
5.4.2.8 Access to extension services and information ......................................................... 94
5.4.2.9 Livestock ownership............................................................................................... 95
5.4.2.10 Distance to other water sources............................................................................. 97
5.4.2.11 Farmers’ perception towards the IRWH technology .............................................. 98
5.5 Summary ......................................................................................................................... 100
CHAPTER 6: RESULTS OF THE EMPIRICAL ANALYSIS AND DISCUSSION........ 101
6.0 Introduction ..................................................................................................................... 101
6.1 Empirical results .............................................................................................................. 101
x
6.1.1 Factors influencing the adoption of IRWH technology ............................................... 102
6.1.1.1 Access to hired labour .......................................................................................... 104
6.1.1.2 Farm income ........................................................................................................ 104
6.1.1.3 Access to market .................................................................................................. 104
6.1.1.4 Access to extension services ................................................................................. 105
6.1.1.5 Access to information ........................................................................................... 106
6.1.1.6 Farmers’ perception towards the IRWH technology.............................................. 106
6.1.2 Factors influencing household food security ............................................................... 107
6.1.2.1 Adoption of the IRWH technology ....................................................................... 108
6.1.2.2 Household size ..................................................................................................... 109
6.1.2.3 Access to hired labour ......................................................................................... 109
6.1.2.4 Household income ................................................................................................ 110
6.1.2.5 Access to extension services ................................................................................. 110
6.1.2.6 Farmers’ perception towards the IRWH technology.............................................. 111
6.2 Summary ......................................................................................................................... 111
CHAPTER 7: DISCUSSION, CONCLUSION AND RECOMMENDATIONS ............... 113
7.0 Introduction ..................................................................................................................... 113
7.1 Discussion and conclusion ............................................................................................... 113
7.2 Recommendations ............................................................................................................ 114
7.3 Areas of further studies .................................................................................................... 116
LIST OF REFERENCES .................................................................................................... 117
APPENDIX 1: QUESTIONNAIRE .................................................................................... 129
APPENDIX 2: SUMMATION OF FOOD GROUPS CONSUMED BY MEMBERS OF
THE HOUSEHOLD ........................................................................................................... 136
APPENDIX 2: CALCULATION OF THE AVERAGE HDDS ........................................ 136

xi
LIST OF ACRONYMS
ARC: Agricultural Research Council
ARDRI: Agricultural and Rural Development Research Institute
CARE: Caregivers
CASP: Comprehensive Agricultural Support Programme
Cf: Cartref
CON: Normal conventional tillage
CSI: Coping Strategy Index
DWA: Department of Water Affairs
DRWH: Domestic rainwater harvesting
EC: Eastern Cape Province
FAO: Food and Agriculture Organisation
Ha: Hectares
IDDS: Individual Dietary Diversity Score
IDP: Integrated Development Plan
IRWH: In-field rainwater harvesting
ISCW: Institute for Soil, Climate and Water
IWRHbare: In-field rainwater harvesting with bare run-off area and bare basin area
IWRHGLDM: In-field rainwater harvesting with green leaf desmodium as a cover crop on the
run-off area
IWRHlucerne: In-field rainwater harvesting with lucerne as a cover crop on the run-off area

xii
IWRHmulch: In-field rainwater harvesting with organic mulch run-off area and bare basin area
IWRHvetiver: In-field rainwater harvesting with vetiver as a cover crop on the run-off area
Lo: Longlands
LRAD: Land Redistribution for Agriculture Development
NDA: National Department of Agriculture
NDP: National Development Plan
Oa: Oakleaf
ObBr: Organic mulch in the basin with bare run-off area
ObOr: Organic mulch in the basin with organic mulch on the run-off area
ObSr: Organic mulch in the basin with stones on the run-off area
OECD: Organisation For Economic and Development
PPBP: Provide Project Background Paper
RWH: Rainwater harvesting
RWP: Rainwater productivity
SbOr: Stones in the basin with organic mulch on the run-off area
SDFR: Spatial Development Framework Review
Se: Sepane
SPSS: Statistical Package for Social Sciences
STRIP: Strip cropping
Sw: Swartland
TLC: Traditional Local Council

xiii
TRC: Transition Rural Council
UFH: University of Fort Hare
Va: Valsrivier
Vf: Vilafontes
Wa: Wasbank
We: Westleigh
WFP: World Food Program
WRC: Water Research Commission
XRWH Ex-field rainwater harvesting

xiv
LIST OF TABLES
Table 3.1 Summarised climatic information 1979-2013 .................................................... 41
Table 3.2 Number of population, households in Khayalethu, Guquka and Krwakrwa
villages and distance from Alice town .............................................................. 44
Table 4.1 Number of sampled respondents for each study site .......................................... 55
Table 4.2 Summary of data collected, sources and data analysis ....................................... 56
Table 4.3 Variables that were used in the binary logistic regression model for the incidence
of adoption ...................................................................................................... 68
Table 4.4 Variables that were used in the binary logistic regression model for the incidence
of household food security status ...................................................................... 69
Table 5.1 Adoption status in the study areas ..................................................................... 76
Table 5.2 Household food security status in the study areas ............................................. 77
Table 5.3 Adoption and household food security status in the study areas ........................ 78
Table 5.4 Household size distribution ............................................................................... 83
Table 5.5 Access to hired labour distribution of the household heads ............................... 84
Table 5.6 Sources of income for the household heads ....................................................... 86
Table 5.7 Land tenure distribution of the household heads ............................................... 89
Table 5.8 Land size distribution of the household heads ................................................... 91
Table 5.9 Access to market .............................................................................................. 91
Table 5.10 Adoption, household food security status and access to credit ........................... 93
Table 5.11 Adoption, household food security status and access to extension services as well
as information ................................................................................................... 95
Table 5.12 Total walking distance to other water sources .................................................. 97
Table 5.13 Adoption, household food security status and farmers’ perception towards the
IRWH technology .............................................................................................. 99
Table 6.1 Binary logistic results for adoption or non-adoption of the IRWH technology . 103
Table 6.2 Binary logistic results for the incidence of household food security ................ 107
Table 6.3 Model summary .............................................................................................. 107

xv
LIST OF FIGURES
Figure 2.1 Adoption / Innovation cycle ............................................................................... 9
Figure 2.2 In-field rainwater harvesting technique ............................................................ 14
Figure 2.3 Number of households in five targeted villages where IRWH is used ................ 18
Figure 3.1 Map showing location of Khayalethu, Guquka and Krwakrwa villages in the
Nkonkobe Municipality .................................................................................... 40
Figure 3.2 Population distributions by race ....................................................................... 43
Figure 3.3 Age distribution in the Nkonkobe Municipality ................................................ 45
Figure 3.4 Sectors contributing to the Nkonkobe Municipality Gross Domestic Product ... 48
Figure 4.1 Conceptual framework ..................................................................................... 65
Figure 5.1 Gender distribution of the household heads ....................................................... 79
Figure 5.2 Adoption, household food security status and gender distribution ..................... 79
Figure 5.3 Age distribution of the household heads............................................................ 80
Figure 5.4 Adoption, household food security status and age distribution of the household
heads ................................................................................................................ 81
Figure 5.5 Educational level of the household heads .......................................................... 82
Figure 5.6 Adoption, household food security status and educational level ........................ 83
Figure 5.7 Adoption, household food security status and access to hired labour ................. 85
Figure 5.8 Distribution of income earned by farmers (households). ................................... 87
Figure 5.9 Adoption, household food security status and distribution of income earned by
farmers ............................................................................................................. 87
Figure 5.10 Farm income distribution of the household heads .............................................. 88
Figure 5.11 Adoption, household food security status and farm income distribution of the
household heads ............................................................................................... 89
Figure 5.12 Adoption, household food security status and land tenure distribution of the
household heads ............................................................................................... 90
Figure 5.13 Adoption, household food security status and access to market ......................... 92
Figure 5.14 Access to credit by the household heads ........................................................... 93
Figure 5.15 Access to extension services and information about IRWH technology ............. 94
Figure 5.16 Livestock ownership between adopters and non-adopters ................................ 96

xvi
Figure 5.17 Adoption, household food security status and livestock ownership ................... 97
Figure 5.18 Adoption, household food security status and distance to other water sources ... 98
Figure 5.19 Farmers’ perception towards the IRWH technology .......................................... 99
1
CHAPTER 1
INTRODUCTION
1.0 Introduction to the chapter
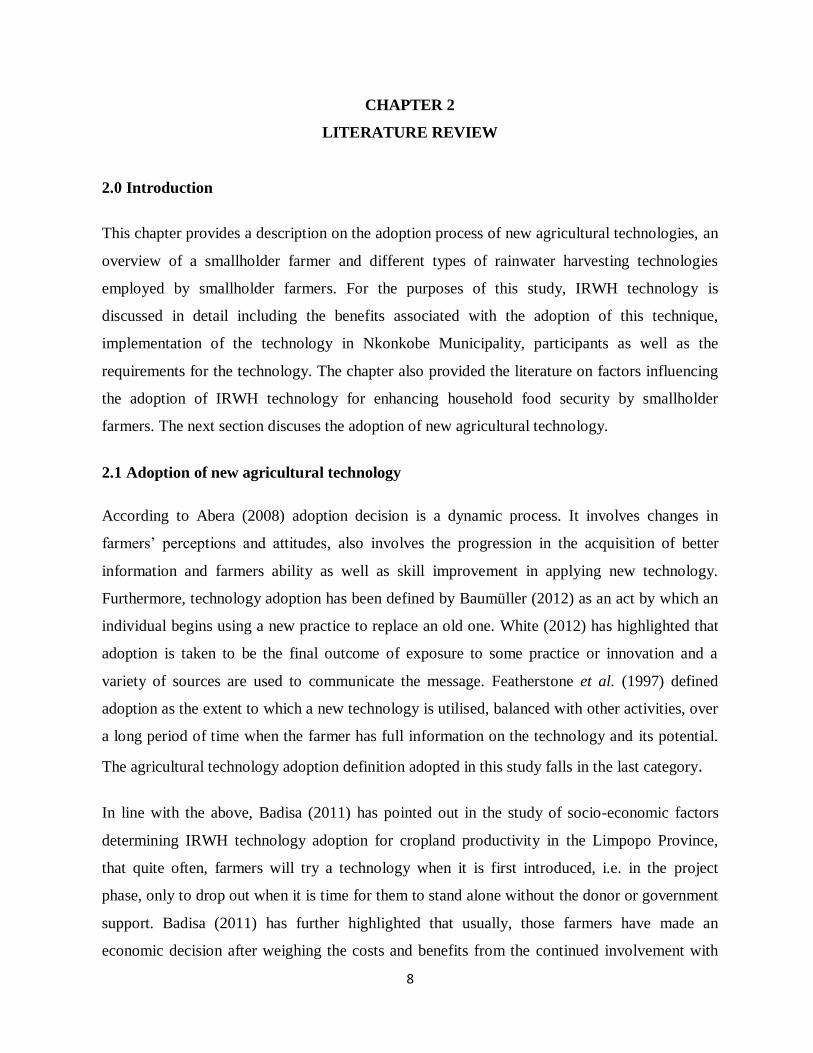
This research is a survey of the socio-economic factors influencing adoption of in-field
rainwater harvesting technology for enhancing household food security by smallholder farmers
in the Nkonkobe Municipality, Eastern Cape Province. This chapter provides a background to
the study, problem statement, the main objectives as well as the research questions. The
justification and delimitation of this study are also highlighted. The outline of this study is lastly
presented in this chapter.
1.1 Background to the study
The shortage of water for domestic and agricultural purposes has become a significant challenge
in the contemporary South African environment in which an ever increasing water demand now
far exceeds its natural availability (Badisa, 2011). It is in this regard that the South African
Department of Water Affairs (DWA) (2013) has classified the country as water-stressed for
domestic and agricultural purposes, with a low average annual rainfall of 500mm being
recorded. The DWA (2013) further pointed out that, only a narrow region along the south–
eastern coastline receives good rainfall, while the greater part of the interior and western part of
the country is arid or semi-arid. Badisa (2011) has observed that, 65% of the country receives
less than 500mm per year, which is usually regarded as the minimum for dry-land farming and
21% receives less than 200mm per year. This study will focus on water for agricultural
purposes.
The water shortage for agricultural purposes as suggested by the Food and Agriculture
Organisation (FAO) (2008) is increasingly recognised as a major constraint to improving the
lives of the rural poor. It has been highlighted by van Averbeke et al. (2011) that, water
shortage caused by irregular, unreliable rainfall and high evaporative demand limits rain-fed
agriculture production in South Africa. As a result, most of the smallholder farmers are found in
areas that are marginal and not suitable for crop production (Baiphethi et al., 2009). These areas
range from semi-arid to arid and receive very low rainfall (Hatibu et al., 2006). Similarly, Botha
(2005) noted that in South Africa 72% of smallholder farmers live in semi-arid to arid areas and

2
mainly rely on rain-fed smallholder agriculture.
As most of the poor rural households are practicing smallholder agriculture, some scholars
conclude that smallholder agriculture is not achieving its pivotal role of attaining food security
in developing countries like South Africa (Vengayi, 2009; Hosu et al., 2013). This means that in
rural areas, smallholder farmers’ efficiencies have always been hindered mostly by some factors
beyond their control such as agro-ecological factors (Hosu et al., 2013). In contrast, Obi et al.
(2011) have argued that smallholder agriculture is the main source of food for the rural
population as well as an income generating occupation because it is the main activity for many
rural parts of developing countries. This implies that smallholder agricultural productivity is
very crucial in alleviating poverty and hunger (Kirkland et al., 2011). Furthermore, it has been
stated that each 1% increase in agricultural productivity in South Africa reduces poverty by
0.6% (Chisasa and Makina, 2012). A census conducted in 2011, found that the highest
proportion of smallholder agriculture was recorded by the Eastern Cape Province (EC) at 35.4%
followed by the Limpopo Province (33%) and KwaZulu-Natal Province at 28.2% (Statistics
South Africa, 2013).
Van Averbeke et al. (2011) have reported that smallholder agricultural productivity in South
Africa is regarded as being very low even though it has to support most of the rural poor. As a
result, the majority of the rural population in South Africa is food insecure. The basic definition
of food security is that it refers to the ability of individuals to obtain sufficient food on a day-to-
day basis (Backeberg, 2009; Baiphethi et al., 2010; Monde et al., 2012). It was estimated by
Statistics South Africa (2013) that 19 million people in South Africa are rural survivalists with
traditional agrarian lifestyles. Of these at least 15 million individuals are food insecure. Food
security and livelihood studies carried out over the years suggest that the food insecurity rates
may be higher in the EC than elsewhere in the country (Provide Project Background Paper
(PPBP), 2005; Obi et al., 2011; National Development Plan (NDP), 2013). It showed that
70.7% of its 6.2 million inhabitants are poor and the unemployment rate is as high as 48.5%
(NDP, 2013).
Significant effort is being made to alleviate food insecurity in South Africa. It is therefore not
surprising to realise that one of the longstanding and key objectives of the South African
government is to ensure that all South Africans have enough to eat (National Department of

3
Agriculture (NDA), 2007). The South African government has continuously sought to
implement policy initiatives aimed at creating employment opportunities through food security
programmes (Hlanganise, 2010). Another notable effort being made by the South African
government is to reach a wider population of the country through social grants. The majority of
households in the EC rely on these grants for survival (Monde, 2003). Further, there have been
attempts to improve access to water for agricultural purposes, a resource that has been identified
as the most important to achieve food security at household level (Hlanganise, 2010).
To address the issue of water scarcity for agriculture, crop failures and food insecurity in South
Africa, water harvesting and water conservation techniques were developed in 2001 by the
Agricultural Research Council (ARC) (Botha et al., 2007; Hlanganise, 2010). Botha et al.
(2007) explained water harvesting as a term that describes a number of different practices that
have been used for centuries in dry areas to collect and utilise rainfall more efficiently. Methods
of water harvesting are categorised as ex-field (outside the farm boundary), in-field (within the
farm) and non-field (such as rooftops) (Monde and Aliber, 2007; Botha et al., 2007). This study
will focus more on in-field rainwater harvesting (IRWH) technology.
In IRWH technology the term ‘in-field’ refers to the transportation of water over a short
distance of 2m and delivering it to the 1m wide basin (Hatibu et al., 2006). Joseph and Botha
(2012) also explained IRWH as a technique that combines the advantages of no-till, basin
tillage and mulching. According to Monde and Aliber (2007) and Hlanganise (2010) in the EC,
IRWH project is a collaborative effort between the ARC Institute for Soil Climate and Water
and the University of Fort Hare (UFH). The project received funding from the Water Research
Commission (WRC). Rural communities of Khayalethu and Guquka villages were first trained
in 2004 on IRWH techniques followed by Krwakrwa village in 2008. This technique is mostly
practiced in backyard food gardens with an aim to improve production hence improved food
security (Backeberg, 2009).
IRWH technology is classified as a sustainable technology because it contributes to climate
change adaptation (Botha, 2005). It does this, by increasing plant available water and buffering
during dry spells. Therefore, better rainwater productivity leads to increased yields (ARC,
2001). Monde and Aliber (2007) also argued that this technique is a sustainable production
technique that increases agronomic productivity, decreases production risk, conserves the

4
natural resources and is economically viable and socially acceptable.
However, many water conservation projects have failed despite good techniques and design
(Badisa, 2011). For example, He et al. (2007) in China found that adoption of IRWH
technology was low because of technical, environmental, climatic, socio-economic and policy
factors. This study seeks to find out if socio-economic factors affect adoption of IRWH
technology in Nkonkobe Municipality particularly in Krwakrwa, Khayalethu and Guquka
villages. It has been emphasised by Bunclark and Lankford (2010) that the successful adoption
of IRWH technology has the potential to alleviate problems faced by resource-poor smallholder
farmers. Adoption was defined by the Orgainisation for Economic Co-operation and
Development (OECD) (2001) as the use or non-use of a new technology by a farmer at a given
period of time. Adoption of rainwater harvesting technologies require a bottom-up approach
rather than the usual top-down approach employed in most water resources development
projects. A bottom-up approach that regards beneficiaries as partners, utilises local experience
and empowers target beneficiaries has been promoted in the past few decades (Badisa, 2011).
1.2 Problem statement
There is a constant increase in the worlds’ population which translates to a high demand for
food and water for domestic and agricultural purposes (DWA, 2013). Further, there is
competition between humans and agriculture on the use of water resources (Unganai, 2005).
Climate change which causes rainfall not to be adequate to sustain crop production has resulted
in increased food insecurity in the smallholder farming sector in Africa, including the EC
(Aliber et al., 2009). NDP (2013) described the EC as a rural Province whose majority of the
population is characterised by food insecurities. According to Monde et al. (2012) about 80% of
the households in the Khayalethu, Guquka and Krwakrwa villages earned incomes that hardly
constitute the main rural livelihood activity to secure households food needs. Buying food from
the urban markets was an important food security strategy for these households.
In the EC like in many other African Provinces smallholder agriculture has a long tradition.
Dry-land agricultural activities are rain-fed based; therefore planting is predominantly done
during summer period (October to April) (Monde at al., 2012). Smallholder farmers primarily
depended on rainfall in order to use rivers and streams as a source of water to irrigate small

5
plots for cultivation of grain crops and vegetables for home consumption (Aliber et al., 2009).
However, farmers have difficulties in practicing farming due to the lack of irrigation water.
According to FAO (2008) water scarcity for agricultural purposes is increasing at a faster rate.
This scarcity is caused by low, unpredictable rainfall and high evaporative demand which limits
dry-land crop production (van Averbeke et al., 2011). Therefore, available rain water should be
used more efficiently and productively to help to improve dry-land crop production, especially
in rural areas where the majority of people depend on rain-fed agriculture for their livelihood
(Backeberg, 2009). Improving water sourcing for agriculture is one of the strategies that South
African government has employed in its efforts to alleviate food insecurity. This has resulted in
the development of IRWH technology.
Previous studies (ARC, 2001 and Baiphethi et al. (2010)) showed that IRWH technique is
suitable for application in semi-arid to arid areas of South Africa. It conserves water, reduces
soil erosion and rehabilitates degraded land. Consequently, IRWH technology contributes to
household food security and poverty alleviation. However, its level of adoption remains low
(Baiphethi et al., 2010). Tesfay (2008) also pointed out that regardless of the potential of IRWH
technology in improving agricultural productivity and general welfare of smallholder farmers,
its adoption is not sufficient. The results from assessing rainwater harvesting (RWH)
technologies case studies from Ethiopia, Kenya, Uganda and Tanzania by Ngigi (2003) do not
explain the reasons for a low adoption of the RWH technologies including IRWH among
smallholder farmers, considering all the advantages of practicing RWH technologies. Other
studies have been done on technical, environmental, policy and climatic factors that influence
the adoption of this technique in South Africa (Botha et al., 2007; Mwenge, 2011; Joseph and
Botha, 2012). Therefore, this raises the need to investigate the socio-economic factors that
influence the adoption of IRWH technique owing to its many advantages to smallholder
farmers.
This will contribute to the formulation of policies that enhance crop productivity through the
use of IRWH technology thereby enhancing household food security in the rural areas of the
EC. Any efforts to promote this technology by the government or any other players need to be
directed by the results of this study. This information could then be used as a basis for
formulating realistic situations of future expansion of the IRWH technology to other areas in the

6
EC. In addition, this study will also add to the available literature on IRWH technology.
1.3 Objectives of the research
The main objective of this study is to identify the socio-economic factors determining the
adoption of IRWH technology for enhancing household food security by smallholder farmers in
selected areas of the EC.
1.3.1 The specific objectives are to:
(i) Assess the level of adoption of IRWH technology by smallholder farmers in Krwakrwa,
Khayalethu and Guquka villages in the EC.
(ii) Determine socio-economic factors influencing the adoption of IRWH technology by
smallholder farmers in the study areas in the EC.
(iii) Determine whether adopters of IRWH technology are more food secure than non-
adopters in the study areas in the EC.
1.4 Research questions
(i) What is the level of adoption of IRWH technology by smallholder farmers in Krwakrwa,
Khayalethu and Guquka villages in the EC?
(ii) What are socio-economic factors that influence adoption of the IRWH technology by
smallholder farmers in the study areas in the EC?
(iii) Does adopters of IRWH technology more food secure than non-adopters in the study
areas in the EC?
1.5 Delimitation
This study only looked at social and economic factors that influence adoption of the IRWH
technology for enhancing household food security by smallholder farmers in the EC. It did not
cover the environmental, policy and technical factors affecting the adoption of IRWH
technology in the EC. Due to financial constraints this study only covered three villages in one
municipality in the EC. It only focused on smallholder farmers and not on commercial farmers.
This will place a limitation on the extent to which the findings of the study could be generalised.

7
1.6 Outline of the study
This study consists of seven chapters. Chapter 1 presented an introduction to the problem, the
background to the study and objectives of the study. Chapter 2 presents literature review. An
overview of a smallholder farmer is outlined and key terms that include adoption and water
harvesting techniques are explained in this chapter. IRWH technology is also explained in detail
in this chapter. Factors that influence adoption of this technique for enhancing household food
security by smallholder famers are also discussed. Chapter 3 explains why the study areas were
selected and further presents their description. Chapter 4 is the methodology. The overall plan
of how the research was carried out and data analysis techniques are explained in this chapter.
Descriptive results are presented in Chapter 5 while empirical results are presented in Chapter 6.
The conclusion and recommendations of the study as well as areas of further studies are set out
in Chapter 7.
8
CHAPTER 2
LITERATURE REVIEW
2.0 Introduction
This chapter provides a description on the adoption process of new agricultural technologies, an
overview of a smallholder farmer and different types of rainwater harvesting technologies
employed by smallholder farmers. For the purposes of this study, IRWH technology is
discussed in detail including the benefits associated with the adoption of this technique,
implementation of the technology in Nkonkobe Municipality, participants as well as the
requirements for the technology. The chapter also provided the literature on factors influencing
the adoption of IRWH technology for enhancing household food security by smallholder
farmers. The next section discuses the adoption of new agricultural technology.
2.1 Adoption of new agricultural technology
According to Abera (2008) adoption decision is a dynamic process. It involves changes in
farmers’ perceptions and attitudes, also involves the progression in the acquisition of better
information and farmers ability as well as skill improvement in applying new technology.
Furthermore, technology adoption has been defined by Baumüller (2012) as an act by which an
individual begins using a new practice to replace an old one. White (2012) has highlighted that
adoption is taken to be the final outcome of exposure to some practice or innovation and a
variety of sources are used to communicate the message. Featherstone et al. (1997) defined
adoption as the extent to which a new technology is utilised, balanced with other activities, over
a long period of time when the farmer has full information on the technology and its potential.
The agricultural technology adoption definition adopted in this study falls in the last category.
In line with the above, Badisa (2011) has pointed out in the study of socio-economic factors
determining IRWH technology adoption for cropland productivity in the Limpopo Province,
that quite often, farmers will try a technology when it is first introduced, i.e. in the project
phase, only to drop out when it is time for them to stand alone without the donor or government
support. Badisa (2011) has further highlighted that usually, those farmers have made an
economic decision after weighing the costs and benefits from the continued involvement with

9
the technology. This means, adoption of innovations in general is not a once-off decision rather,
it is a stepwise decision made after carefully weighing opportunity costs at each point (Abera,
2008; Yengoh et al., 2010). Understandably, smallholder farmers always sought to avoid
unnecessary risks and will, therefore, abandon a technology once their perceived benefits
diminish significantly or do not seem to offset the costs involved (Yengoh et al., 2010).
Adoption studies also identify and describe five categories of adopters in a social system. The
study by Murgor et al. (2013) where factors influencing farmers’ decision to adopt RWH
techniques in Kenya were reviewed, confirmed that categories of adopting RWH technologies
include innovators, early adopters, early majority, late majority and laggards as shown in Figure
2.1. Murgor et al. (2013) have further established that the rate of adoption of RWH technologies
follows a standard bell curve as shown in Figure 2.1. Similarly Sibanda (2009) showed that the
potential adoption of Open Pollinated Varieties of maize at Zanyokwe and Kieskamahoek in the
EC follows a standard bell curve.
Figure 2.1: Adoption/innovation cycle showing the distribution of different categories of
adopters of a new technology over time
Source: Murgor et al. (2013)
In describing the characteristics of these groups a study by Rogers (1995) revealed that, the
majority of the innovators are risk takers who have the resources and desire to try new things
even if they fail. Early adopters are selective about which technologies they start using. They
are considered as the “one to check in with” for new information and reduce others’ uncertainty
about new technology by adopting it (Baumüller, 2012). Early majority take their time before

10
adopting a new idea. They are willing to embrace new technology as long as they understand
how it fits in with their lives (Sunding and Zilberman, 2000). According to White (2012) late
majority adopt in relation to peer pressure, emerging norms or economic necessity. This means
that most of uncertainty around an idea must be resolved before they adopt. Laggards are
traditional and make decisions based on past experience (Sunding and Zilberman, 2000). They
are often economically unable to take risks on new ideas (Shikur and Beshah, 2012). In Uganda,
Mugerwa (2007) studied and divided smallholder farmers in three groups of banana growers,
where smallholder farmers who do not use RWH technologies as non-adopters, smallholder
farmers who have used RWH technologies for at most four years as late adopters and farmers
who have used RWH technologies for at least five years as early adopters. The study revealed
that early adopters knew more about RWH technologies in order to improve their banana
production as compared to late adopters and non-adopters. This has led to early adopters to have
higher production yield than late adopters and non-adopters. This study confirms that early
adopters are the ones who know more about the technologies and carefully adopt the
technologies that will give higher returns.
Furthermore, farmers will invest in and implement sustainable technologies and farm practices
if they expect the investment will be profitable, given the right education, information,
motivation and also if government policies set clear goals (Abera, 2008). This study by
Mugerwa (2007) also confirms that smallholder farmers adopted RWH technologies because
they had more information about the technologies in order to get more profit. However, higher
input prices and no markets for the benefits will negatively influence smallholder farmers’
decisions on investment and can lead to unsustainable farming practices (Yengoh et al., 2010).
Characteristics of a technology, such as simplicity, visibility of results, usefulness towards
meeting an existing need and low capital investment promote its adoption and should be
considered when transferring any technology (Baumüller, 2012).
For a new technology to be sustainable there is a need for greater follow-up in tracking the
adoption of technologies (OECD, 2001). This will help in the accountability of research efforts
and policies for technology dissemination and adoption (White, 2012). Thorough ex-post
assessments of results could help to ensure that corrections are made before too much is
invested in the wrong technology (Yengoh et al., 2010). Identifying possible future trends can

11
help the policy making process in moving towards sustainable agriculture.
Furthermore, the adoption of technologies for sustainable farming systems will be facilitated by
a wider participatory approach involving a wide range of stakeholders (Shikur and Beshah,
2012).These stakeholders should include farmers, the agri-food industry, consumer groups and
non-government organisations with an interest in sustainable farming. OECD (2001) also stated
that sustainable technologies are implemented at the farm level, thus a key requirement is to
engage smallholder farmers in the dialogue on technology adoption. A description of a
smallholder farmer in a South African context is given below.
2.2 Overview of a smallholder farmer in South Africa
Wenhold et al. (2007) explained that smallholder farmers in South Africa are often equated with
backward, non-productive, non-commercial and smallholder agriculture that is found in rural
areas. As put forward by Vengayi (2009) smallholder farmers are farm households with access
to means of livelihoods in land relying primarily on family labour for farm production to
produce for self-subsistence and often for market sale, this view is to be used in this study.
Kirsten and van Zyl (1998) concluded by defining a smallholder farmer as one whose scale of
operation is too small to attract the provision of the services he/she needs to be able to
significantly increase his/her productivity. The study by Herman et al. (2012) has confirmed
that the livelihoods of the majority smallholder farmers in Nkonkobe Municipality in the EC are
characterised by poverty, food insecurities, hunger, resource-poor, risk-sensitive, inadequate
market access, infrastructure and support services.
In the context of irrigation schemes, van Averbeke (2008) evaluated best management practices
for smallholder farming on selected irrigation schemes and surrounding areas through
participatory adaptive research in the Limpopo Province and reported that smallholder irrigation
schemes are irrigation projects on 5-10 hectares (ha). According to Wenhold et al. (2007)
smallholder farmers practice mixed farming, which involves the production of both crops and
animals on three types of land, namely residential, arable and commonage. In the study of
Wenhold et al. (2007) it was noted that in the EC residential land which is used for home
gardening is normally 0.4ha but where traditional tenure still applies; residential sites can be
several hectares in size. Arable allotments range in size between 1ha and 5ha and are used to

12
produce staple food crops. The commonage is used for the production of small and large
livestock, mainly cattle, goats and sheep and also for the collection of plant materials for
various uses including food in the form of fruit and edible herbs. For the purpose of this study
smallholder famers are households practicing crop production in plot size from 0.1 to 10 ha.
Kirsten and van Zyl (1998) observed that smallholder agriculture is ineffective in alleviating
food insecurities and causing agricultural development. This was supported by the study of
Vengayi (2009) in the EC where institutional constraints to smallholder agriculture were
reviewed and the results showed that most smallholder farmers lacked an entrepreneurial spirit,
are generally risk averse and do not regard farming as a business. On the other hand Jari (2009)
on the study of institutional and technical factors influencing agricultural marketing channel
choices amongst smallholder famers in the EC reported that food insecurities can be alleviated
through smallholder agriculture due to food price reduction and employment creation. This is
the case because small farms are labour intensive thus more people are employed as presented
by the results of Obi et al. (2011) in the EC. Also Pote (2008) in Nkonkobe Municipality in the
EC found that more smallholder farmers have access to land for own food production. This
resulted in more food being produced and sold thereby a fall in food prices hence improved
food security. It was further highlighted by Jari (2009) that these contributions of smallholder
agriculture have been recognised by the South African government and reflected in the
Agricultural Policy (Ministry of Agriculture and Land Affairs, 1998). Shikur and Beshah (2012)
pointed out that another way to improve smallholder agriculture is through RWH technologies.
These technologies are discussed in the following section.
2.3 Rainwater harvesting (RWH) technologies employed by smallholder farmers
According to Alem (2001) RWH in its broadest sense is defined as the collection of run-off for
its productive use where run-off may be harvested from roofs and ground surfaces. It could also
be described as an act of maximising utilisation of the available rainfall by making use of
different techniques (Badisa, 2011). It was explained by Botha et al. (2007) as a term that
describes a number of different practices that have been used for centuries in dry areas to collect
and utilise rainfall more efficiently.

13
2.3.1 Types of rainwater harvesting technologies
There are different classifications of RWH technologies. Murgor et al. (2013) has identified the
following water harvesting classes (for agriculture): in‐situ water conservation, flood irrigation
and storage for supplemental irrigation. FAO (1990) used the following RWH classes: rooftop
water harvesting, micro catchment, macro catchment and flood water harvesting. Prinz (2002)
gave the following types of water harvesting: fog‐ dew, rainwater, flood water and ground water
harvesting. Mwenge (2011) who investigated decision to support system for sustainable
rainwater harvesting in South Africa has categorised RWH technologies according to the
catchment area, into: domestic RWH (DRWH), ex-field RWH (XRWH) and in-field RWH
(IRWH). Mwenge (2011) further pointed out that IRWH technology is also known as in-situ,
within the field and micro catchment RWH while XRWH technology is also known as external
or macro catchment RWH. For this study the latter was adapted in categorising RWH
techniques used by smallholder farmers. Also this study focused more on the IRWH technology
but DRWH technology would be described first.
2.3.1.1 Domestic rainwater harvesting (DRWH) technology
Water is collected from rooftops, courtyards and similar compacted or treated surfaces
(Mwenge, 2011). Other RWH technology studies reviewed that roofs made of corrugated iron
sheet, asbestos sheet or tiles can be utilised for harvesting the rainwater (FAO, 1990) and
according to Botha et al. (2007) that water will be diverted to a storage tank. Monde and Aliber
(2007) highlighted that, it is done to obtain relatively clean drinking water as well as water for
domestic purposes or garden crop. The results of Backeberg (2009) in the study of increasing
food security through RWH technologies showed that in the EC, DRWH technology is
constructed in such a way that if the tank that harvests water from the roof is full, water will go
to the underground tank through the connected pipe. There are some similarities between
DRWH and XRWH technologies in-terms of their uses (Mwenge, 2011).
2.3.1.2 Ex-field rainwater harvesting (XRWH) technology
There is a noticeable distance between the catchment area (usually not cultivable) and the target
area (Mwenge, 2011). Alem (2001) revealed that ponds are used to harvest rainwater for both
humans and livestock, particularly in the arid and semi-arid rural areas. They are major sources

14
of water in the Rift Valley where ground water is deep and other sources of water are not
feasible (Botha et al., 2007). The implementation structure of XRWH is a little bit different
from that of IRWH technology.
2.3.1.3 In-field rainwater harvesting (IRWH) technology
Hatibu et al. (2006) explained IRWH technology as a technique that combines the advantages
of no-till, basin tillage and mulching. The basic structure of IRWH technology in South Africa
especially in Limpopo, Free State and EC Provinces include the case where rainfall run-off is
promoted on a 2m wide strip between alternate crop rows and stored in 1m basins as shown in
Figure 2.2 (Baiphethi et al., 2006). According to Monde et al. (2012) water collected in the
basins infiltrates deep into the soil beyond the surface evaporation zone. After the basins have
been constructed no-till is applied to the land as a whole. Due to the absence of cultivation a
crust soon develops on the run-off strip. This technique is called Amadanyana in IsiXhosa in the
EC. The practice is mostly used in homestead gardens while communal croplands are used at a
very low rate (Monde and Aliber, 2007).
Figure 2.2: In-field rainwater harvesting technique
Source: Botha et al. (2007)
IRWH experiments have been conducted at several locations in Zimbabwe and Mozambique.
All experiments included treatments with ‘Planting Basins’ (Mutekwa and Kusangaya 2006;
Joseph and Botha, 2012). Crops were planted in the basins, often with small amounts of organic
and/or inorganic fertilisers. The objectives were to reduce run-off, increase infiltration through

15
breaking the surface crust by creating a depression/pit/hole and to increase soil fertility through
reduction in erosion (Joseph and Botha, 2012).
In Glen, Botha et al. (2005) compared four different IRWH techniques and normal conventional
tillage (CON) in field experiments over three growing seasons on four ecotopes with maize,
sunflower, sorghum and wheat. The four IRWH treatments were: organic mulch in the basins
with a bare run-off area (ObBr); organic mulch in the basins with organic mulch on the run-off
area (ObOr); organic mulch in the basins with stones on the run-off area (ObSr); stones in the
basins with organic mulch on the run-off area (SbOr). According to Monde et al. (2012) the
other kinds of IRWH technology include: IRWH with a bare run-off area and bare basin area
(IRWHBare); IRWH with organic mulch both on the run-off area and basin area (IRWHMulch);
IRWH with lucerne as a cover crop on the run-off area (IRWHLucerne); IRWH with green leaf
desmodium as a cover crop on the run-off area (IRWHGLDM) and IRWH with vetiver as a cover
crop on the run-off area (IRWHVet). Monde et al. (2012) experimented with these kinds of
IRWH techniques in Alice in the EC where they were experimented against CON and strip
cropping (STRIP) over four growing seasons. The results are going to be discussed in the next
section.
This study focuses on IRWH technology where there is organic mulch both on the run-off area
and in the basin area (IRWHMulch) as the one of the treatment conducted in Nkonkobe
Municipality.
2.4 Implementation of IRWH technology in the Nkonkobe Municipality
According to Hlanganise (2010) in 2004, WRC funded IRWH project where University of Fort
Hare (Agricultural and Rural Development Research Institute (ARDRI) and ARC Institute for
Soil Climate and Water worked together in Khayalethu and Guquka villages in the Nkonkobe
Municipality, in the EC. The objective of the project was stated by Monde et al. (2012, p.2) as a
need to help: “Farmers in the study areas to create a sustainable livelihood through farming so
as to alleviate poverty and enhance food security in rural areas”.
The project was a five year programme that took place between 2004 and 2009. The IRWH
technique was formally introduced to the communities of Guquka and Khayaletu in November
2004 (Ngwenya, 2013). As put forward by Monde et al. (2012) during the first year, the

16
technique was demonstrated in two households in each village (total=4). The implementation of
the first IRWH plots began in mid-December 2004 in both villages. At the demonstration plots,
village members were taught how to construct the basins and plant maize. They then duplicated
the technique in their own homestead gardens. Only maize was planted at the demonstration
plots, but later planting methods for a variety of vegetable crops were also demonstrated.
During the first year of implementation, participants were provided with maize and vegetable
seeds, fertilisers, herbicides, pesticides, tools (spades, rakes, knapsack sprayers). Thereafter,
free inputs were gradually reduced by 25% per year in order to encourage farmers to be self
reliant (van der Horst, 2013). During the fourth growing season village members did not receive
any free inputs and they had to buy them. The research team also provided support and
assistance on all aspects related to crop production within the IRWH system (Monde et al.,
2012). At an information day held in January 2005, roof and road water harvesting were
introduced. Rainwater harvesting tanks funded by the Department of Agriculture were installed
at seven homesteads in each village (van der Horst, 2013).
In 2007 the technique was introduced to six schools. “The purpose of involving the schools in
the IRWH project was to introduce scholars to the benefits of the technology and the
conservation of the natural resources, as well as encourage them to develop a love for
agriculture, and its potential to address poverty and food insecurity, and improve their eating
habits” (Monde et al., 2012, p.138).
The extension officers in Alice received theoretical and practical training in the implementation
of the IRWH technique in the selected villages before they assisted the households (Hlanganise,
2010).
According to Monde et al. (2012) besides demonstrations at the two villages, the on-station
field experiments were conducted at the Research Farm at the University of Fort Hare over a
period of four seasons (2004/05-2007/08). An additional on-station field experiment, funded by
the ARC–Institute for Soil, Climate and Water (ISCW), was conducted at Phandulwazi
Agricultural school next to the village of Guquka during two seasons (2006/07 and 2007/08).
CON was compared with the STRIP and various IRWH treatments on three ecotopes, Fort
Hare/Oakleaf; Phandulwazi/Westleigh and Guquka/Cartref. The treatments were CON; STRIP;

17
IRWH with a bare run-off area and bare basin area (IRWHBare); IRWH with organic mulch both
on the run-off area and basin area (IRWHMulch); IRWH with lucerne as a cover crop on the run-
off area (IRWHLucerne); IRWH with green leaf desmodium as a cover crop on the run-off area
(IRWHGLDM) and IRWH with vetiver as a cover crop on the run-off area (IRWHVet) (Monde et
al., 2012).The indicators used to show crop response to the different treatments were grain
yield, dry matter production, transpiration, run-off and rainwater productivity (RWP). Detailed
measurements were conducted on the Fort Hare/Oakleaf and Phandulwazi/Westleigh ecotopes
while mainly grain and biomass yield were monitored on the Guquka/Cartref ecotope (Monde et
al., 2012).
The results indicated clearly that IRWHMulch and IRWHBare are far more efficient than CON and
STRIP at converting rainwater into grain yield. They gave an average of 20 to 37% higher grain
yield than CON and STRIP and their RWP values were on average between 20% and 33%
higher. The trend was IRWHMulch> IRWHBare>IRWHVet>IRWHLucerne>IRWHGLDM (Monde et
al., 2012; Ngwenya, 2013; van der Horst, 2013). These results motivated more households to
participate in the implementation of the IRWH technique in Nkonkobe Municipality.
2.4.1 Participants of IRWH technology in the Nkonkobe Municipality
The difference between the CON and IRWH techniques was clearly visible right from the
beginning of these demonstrations (Monde et al., 2012).Other village members in Gilton,
Mpundo and Sompondo were also encouraged by the remarkable improvement in crop yield
and started to implement the IRWH technique in their homestead gardens with the assistance
from other village members, technical assistants and extension officers (Hlanganise, 2010;
Monde et al., 2012). The implementation of IRWH technique in these three neighbouring
villages was initially funded by the Eastern Cape Department of Agriculture in 2004/05.The
ARC-ISCW funded the support during the period 2006-2008 (Hlanganise, 2010; Monde et al.,
2012). In 2008/2009, the implementation continued to Krwakrwa village. It was also ruled out
as a five year programme. The ARC-ISCW performed the demonstrations and the project was
funded by WRC during the period 2008-2012 (Botha et al., 2013).
The number of households that were practicing IRWH technology at the end of 2008 is
presented in Figure 2.3 below.

18
Figure 2.3: Number of households in five targeted villages where IRWH is used
Source: Monde et al. (2012)
Monde et al. (2012) pointed out that in Khayalethu, the use of the technique expanded to 23
households and 40 in Guquka (total of = 63) during the 2007/2008 summer growing season. By
the 2008/09 season the total number had increased further to more than 154 households
including households in three villages (refer to Figure 2.3). By 2012, 30 households in
Krwakrwa village used the technology (Botha et al., 2013).The impact of this technology to the
households is highlighted in the next section.
2.4.2 The impact of IRWH technology in the Nkonkobe Municipality
According to Hlanganise (2010) good yields were recorded during the summer growing
seasons, but during the winters only a few village members planted due to the cold and dry
weather conditions. Only a few rainfall events were recorded during the winter months and the
water collected in the storage tanks was used to give supplementary irrigation. After the farmers
harvested their winter crops, they immediately started to maintain the basins for the next
summer growing season. In most cases the farmers worked hard to keep the homestead gardens
weed-free in order to ensure good yields. During the very wet seasons farmers were kept from
weeding and maintaining their gardens in preparation for the next growing season.
Most of the farmers were able to keep accurate records of the produce they harvested,
2004 2005 2006 2007 2008
Year
0
20
40
60
80
100
120
140
160
Num
ber o
f par
ticip
ants
Khayaletu
Guquka
Sompondo
Gilton
Mpundu Total

19
household consumption and the amount of money they made from selling surplus produce, as
they were taught how to take records during harvesting. After discussions with the head of the
local market in Alice it was agreed that the IRWH farmers could sell their produce at the local
market, paying 5% of their earnings to the market management. A food processing unit was
built at the University of Fort Hare and IRWH members were invited to have their produce
processed there for value addition (Hlanganise, 2010; Monde et al., 2012). There are conditions
for this technology to have a greater positive impact to the households. Such conditions are
discussed in the next section.
2.5 Requirements for the IRWH technology
In the study of Amha (2006) in Ethiopia it was highlighted that IRWH technology can be
applicable in all agro-climatic zones. However, it is more suitable in arid and semi-arid areas.
These are areas of average annual rainfall of 200-800mm (rarely exceeding 800mm) where the
average temperature is above 18oc. The rainfall may come in one or two season. In such an
environment, rain-fed crop production is usually difficult without some form of IRWH practices
(Amha, 2006).
Soil depth is a very important attribute for IRWH technique since depth is needed for adequate
water holding capacity (WRC, 2007). According to Alem (2001) a soil survey is used as an aid
for decision-making and it is therefore used in land planning and management. The soils differ
and soil survey results facilitate the matching of the land use requirements with the soil resource
(WRC, 2007). Joseph and Botha (2012) revealed that the range of soil forms suitable for IRWH
technology includes soils generally considered to be of marginal potential for crop production in
semi-arid areas, e.g. vertic, margalitic and duplex soils (excluding Estcourt form).To ensure
minimal losses from deep drainage, soils with a low water-holding capacity in the root zone
should be avoided, like sandy soils with a coarse texture (Ahmed et al., 2013). The minimum
rooting depth should be at least 500mm (Joseph and Botha, 2012; Ahmed et al., 2013). It was
also pointed out by Monde et al. (2012) that in the EC the slope were also important for run-off
collection therefore this technique is suitable for gentle slopes of less than 5%.
Smallholder farmers must dedicate their time and labour to implementing the technology since
it is time and labour intensive. The study of Bunclark and Lankford (2010) found that an

20
important factor affecting the adoption of IRWH technology in Botswana was the reluctance of
farmers to dedicate their time and labour to implementing the systems.
The results of Joseph and Botha (2012) showed that one of the conditions for the success of
IRWH technique is the willingness by resource users (farmers) to accept it. Among other issues,
chances of acceptance of new technologies are much greater if new production techniques are
developed with adequate involvement of resource users (Baumüller, 2012). Furthermore, when
a context is created in which the level of skills of community members and the organisational
capacity of communities can be improved to allow their effective management of the techniques
(Joseph and Botha, 2012). It should be recognised that success in the promotion of IRWH
technique requires an understanding of priorities and concerns of smallholder farmers (Badisa,
2011).
Botha et al. (2007) also indicated that for the successful adoption and implementation of IRWH
technology, local institutions and organisations need to be in place. These institutions may not
give attention to natural resources. Some of these may not be functioning up to the required
standard for the sustainability of agricultural development, more specifically in the rural
context. These local institutions may include land access and land management, market access
and flow of marketing information, risks of possibility of failure (insurance), agricultural
extension services and training for capacity building, credit facilities for resource users,
associations, co-operatives and extensive participation and networking with other decision
makers and institutions (Botha et al., 2007). If these conditions are to be followed there is a
likelihood of receiving greater benefits from this technology.
2.6 Benefits associated with the adoption of IRWH technology
Some studies have not found significant benefits emanating from some of the IRWH practices.
Hatibu et al. (2006) investigated the effects of modified cropping system for maize, which aims
to reduce drought risk through IRWH technology. IRWHMulch technology resulted in more
benefits compared to cultivation without rainwater conservation techniques. The study,
however, only considered the effects of IRWH on maize and therefore, it is difficult to tell if it
will give similar results if applied to other crops.

21
Van der Horst (2013) who attempted to assess a socio-technical feasibility study for an
irrigation system in Guquka village in the EC maintained that there is more economic benefit in
retaining run-off upstream by implementing IRWH technology than to let it flow downstream,
then store it and use it for irrigation.
Botha et al. (2005) examined bio-physical requirements and socio-economic acceptance of
IRWH and conservation in the semi-arid central region of South Africa. It was concluded that
IRWH technique is socially acceptable because it increases income, promotes education,
improves social well-being, improves health status, reduces crime and increases crop diversity.
Baiphethi et al. (2009) evaluated rural women and IRWH technology and conservation;
anecdotal evidence from the Free State and EC Provinces. It was reported that benefits such as
an increase in production yield, generation of income, improving food security can be achieved
through IRWH technique. These are the benefits that this section focuses on.
2.6.1 Increased production yield
Pretty et al. (2003) examined the extent to which farmers have improved food production with
low cost, locally available and environmentally sound practices. In the study, 208 projects in 52
developing countries selected from Africa, Asia and Latin America were analysed. It was
reported that, for the projects with reliable data, over 90% increase in yields per ha were
detected owing to improvements in water productivity and improvements in soil conditions
which included IRWH technique.
Fox and Rockstrom (2000) investigated the effect of IRWH technology for supplementary
irrigation of cereal crops to overcome intra-seasonal dry-spells in the Sahel. The on-farm study
demonstrated that supplementary irrigation during dry-spells increased sorghum harvests by
14%. The study by Hatibu et al. (2006) in East Africa concluded that IRWH technology
increases yields on high drought risk soils by reducing run-off to zero and increasing infiltration
rate of rainfall. Woyessa et al. (2006) highlighted that this technology was developed to reduce
the risk of crop failures in order to increase agricultural production by using water efficiently.
It has been proven in Zimbabwe that farmers practicing IRWH technology enjoy increased
yields of 2 to 3 harvests in a planting season (Unganai, 2005). In turn, maize yield increased
22
from 0.55 t/ha to 1.1t/ha and that of sorghum increased from 0.56t/ha to 5 t/ha (Unganai, 2005).
Botha et al. (2005) evaluated the agronomic sustainability of the IRWH technique in South
Africa. It was concluded that IRWH technique contributed to higher crop yields than CON
because it stops run-off and minimises soil evaporation losses. Also a research that was
conducted by ARC and its partners at ThabaNchu in 2001 has shown that practice of IRWH
technique led to maize yields increasing by up to 50%, compared with conventional production
techniques. It was explained that yield advantages could be attributed to the total stoppage of
run-off and reduction of evaporation from the soil, supplying more water for transpiration
(ARC, 2001). The enhancement of in-field run-off towards the basin induces water availability
to the crops thereby increasing rainwater productivity significantly (Baiphethi et al., 2006).
Several studies have been carried out with an aim of determining the potential of IRWH
technology to improve land productivity (Bunclark and Lankford, 2010; Mwenge, 2011).
Reports based on smallholder farmers’ opinions show that application of water and soil
conservation in Ethiopia, Zimbabwe, Kwa-Zulu Natal and EC has rehabilitated degraded land
and increased cereal (i.e. sorghum and millet and maize) yields, thus improving household
wealth (Mwenge, 2011).
According to Hlanganise (2010) in the EC, the use of mulch in the basins significantly reduced
evaporation, contributing to the increase in yield by 30 to 50% on average, compared to
production under CON. It was also revealed by Monde and Aliber (2007) that in the EC, run-
off and soil loss from the cropland were reduced to zero when using IRWH technique thus,
production yield increased.
2.6.2 Generation of income
Mutekwa and Kusangaya (2006) investigated the contribution of IRWH technology to rural
livelihoods in Zimbabwe. The on-farm study confirmed that about 75.8% of the IRWH adopters
indicated that they depend on farming as the main source of income. For example, 89% of the
IRWH adopters indicated that they were now able to grow at least two crops on a rotational
basis in one calendar year, which is evidence that the smallholder farmers were intensively
utilising their land. Further, farm productivity increased to the extent that some smallholder
farmers were able to sell some of the main food crops they used to produce in quantities that

23
could not even meet family requirements in the past. The basic food crops like maize and
ground-nuts were produced in quantities that met not only household food requirements, but
produced a surplus that could be sold. The IRWH adopters can afford to sell an average of about
2 061 kg and keep an average about 891 kg for household consumption of the maize produced.
Furthermore, and related to the same matter, Moyo and Nyimo (2006) confirmed that
smallholder farmers in Zimbabwe were selling their surplus of agricultural produce to well-paid
markets in Zvishavane and other surrounding places. This led to their levels of income to
substantially increase.
A study by Botha et al. (2005) on IRWH technology for homestead backyard gardens in South
Africa demonstrated that profitability analysis using enterprise budgets revealed that a
significant increase in farm income is realised when farmers adopt the IRWH technology
compared to the income levels achieved under conventional crop cultivation. By adopting the
simplest form of IRWH technology without the use of mulches in the basins and run-off area,
farmers can increase their income by about R800.00 per ha in the case of maize production. An
analysis of on-station production data suggested that farm income could be increased further
with the use of organic or stone mulches.
Phahlane (2007) evaluated market constraints and opportunities for the sustainable adoption of
IRWH in ThabaNchu. The results showed that its application in home gardens could produce
significant surpluses above household consumption needs. As a result, such surpluses would be
commonly marketed in the villages (to other villagers) and through street vending in
ThabaNchu town. Through practice of the IRWH technique, home garden producers in the EC
produced enough to meet family financial needs such as school fees, medical bills and
household expenses (Backeberg, 2009). Hlanganise (2010) and Botha et al. (2013) also reported
that, the money received by farmers in Khayalethu, Guquka and Krwakrwa villages was used to
buy meat, pay school fees and even buy furniture.
2.6.3 Improving food security
Food security has been defined by a number of scholars throughout the years. Household food
security has been defined as “access by all people at all times to enough food for an active,
healthy and productive life” (World bank, 1986; FAO, 1990; Hoddinott, 1999; von Braun,

24
2007; Monde et al., 2012). FAO (2008) adds that “food security exists when all people, at all
times, have physical and economic access to sufficient, safe and nutritious food to meet their
dietary needs and food preferences for an active and healthy life”. FAO’s (2008) contribution to
the World Bank’s definition is that food security does not only include the ready availability of
enough food, but also nutritionally adequate and safe foods, and an assured ability to acquire
acceptable foods in socially acceptable ways. According to Monde (2003) in the past, the
assessment of household food security was based on food supply. As a result, a decrease in food
supply was regarded as the only cause of household food insecurity. More recent views state
that, food insecurity should not be seen as a problem of inadequate food supply only, but also as
a problem of inadequate purchasing power (Mensah et al., 2013). In the context of this study,
the definition of food security by FAO (2008) was adapted. IRWH technology is said to
improve household food security (Mutekwa and Kusangaya, 2006; Hlanganise, 2010; Botha et
al., 2013).
It was evidenced by Woyessa et al. (2006) that it would be a wise catchment management
decision to allow maize production using the IRWH technique to be developed in the Upper and
Middle Modder River Basin in South Africa. This was the case because among the communal
farmers, a family of five needs about 1ton of maize per annum to supply their staple food.
Therefore, the estimated maize production on the approximately 15 000ha of the IRWH suitable
land in the communal farming area within the Upper and Middle Modder River Basin would be
sufficient to supply the staple food for about 25 500 families or 127 000 people.
According to ARC (2001) this technique enhances the ability of the household to produce its
own food on backyard gardens, resulting in a stable food supply. Baiphethi and Jacobs (2009)
concluded on their study that IRWH technology increases household food security and reduces
reliance on cash to feed the household thus releasing cash for other household uses. Baiphethi et
al. (2010) also reported that, increased production under IRWH technology reduces households’
dependence on market sourced vegetables. This is because they produce more vegetables in
their home gardens.
Since IRWH technology has had considerable success in ThabaNchu, it contributed to the
increased agricultural productivity, hence food was available and accessible all year round

25
(Baiphethi et al., 2009). Agro-hydrological studies of IRWH technique in the same area,
suggest that it is an agronomic sustainable crop production tool that can be used to improve
rural livelihood by reducing the level of food insecurity (Botha et al., 2003; Botha et al., 2005).
Also the results from Hlanganise (2010) research project conducted in the EC showed that 96%
of project members felt that they were better off since the introduction of the IRWH technology
in 2004. This has enabled them to afford three to four meals a day which was not the case in the
past. Botha (2005) also argued that the practice of IRWH technology in some villages in the EC
has resulted in an increased level of household food security. This has been done by means of
maize and vegetable production in homestead backyard gardens.
2.6.4 Improving nutritional status
At a smallholder farm level, IRWH technique improves productivity growth hence, increases
rural income and food availability, which enables improvements in diet as concluded by the
study of Amha (2006) on impacting assessment of rainwater harvesting ponds in Ethiopia. A
study conducted by Baiphethi et al. (2006) revealed that, the intake of essential nutrients (iron,
energy, protein, vitamin A and C) by project members was much better compared to that of the
non-project members in the Free State Province. In addition, from the findings of Hlanganise
(2010) it was concluded that the IRWH technology has a potential to address nutritional
problems in the Eastern Cape’s rural areas. Hlanganise (2010) also reported that, project
members indicated that their quality of diet has improved since the introduction of the IRWH
project. This was so, because they managed to produce maize, beans, cabbage, carrot, tomatoes,
beetroot and spinach as well as new vegetables such as cauliflower, broccoli, turnips and green
pepper. Similarly, Monde (2003) on the study of household food security in rural areas of the
central EC highlighted that increased agricultural productivity through IRWH technology
improved nutrition. This could be done by generating more income to buy more nutritious food,
obtain healthcare and by increasing consumption from ones’ own production.
The above-mentioned benefits may be influenced by a number of factors which are explained in
the following section.

26
2.7 Factors influencing the adoption of IRWH technology in enhancing household food
security
Many IRWH technology adoption studies have been carried out in South Africa (Botha et al.,
2007; Monde and Aliber, 2007; Baiphethi et al., 2009; Badisa, 2011; Monde et al., 2012). They
concluded that the importance of factors affecting the IRWH technology differs across regions
due to differences in natural resources, cultural and political ideologies, socio-economic,
technical, policy and institutional factors.
Shikur and Beshah (2012) have pointed out that the factors that significantly influence the
adoption of RWH technologies positively were labour availability in man equivalent,
indigenous RWH experience of the household, farm size of the household head, total tropical
livestock unit owned, sex of the household head, off-farm income of the household head,
training in areas of RWH, perception of farmers towards security of land ownership and
extension service in areas of RWH. On the other hand, they observed that distance to market
from the residence negatively influenced adoption.
Ahmed et al. (2013) have found that the education level, experience of water shortage,
awareness of RWH techniques and the age of farmers had a positive bearing on the adoption of
RWH techniques whereas farm size and source of income had negative significance.
Tesfay (2008) pointed out that despite the potentials of the IRWH technology for improving
agricultural productivity and livelihoods, its adoption by the smallholder farmers is not
satisfactory. The results indicated that poor capital and human endowment, lack of access to
credit, involvement in off-farm activities, negative perception, gender issues, inaccessibility of
construction materials, lack of technical know-how, poor water extraction and application
methodologies are among the factors that negatively influenced the adoption of IRWH
technology. It was concluded by suggesting that, creating awareness, providing technical and
institutional support, promoting only technology with higher financial feasibility, timely supply
of construction material, empowering female headed households and design as well as
development of alternative policy instruments that are accountable to the farmers would help to
improve the adoption of the technology.

27
Ngigi (2003) evaluated six rainwater harvesting case studies selected from Ethiopia, Kenya,
Uganda and Tanzania. It was reported that despite success of RWH systems, their impacts
remain little owing to low levels of adoption. The report, however, does not provide reasons as
to why the rate of adoption of on-farm RWH technologies is low among smallholder farmers.
Babatunde et al. (2007) pointed out that in most rural communities in South Africa major
household decisions like whether or not to participate in community activities are made by the
household head often with the input of the spouse. Babatunde et al. (2007) further noted that
household head attributes such as age, gender and occupation are important factors in analysing
the adoption decisions of agricultural technologies. This research seeks to take the same
approach; it will analyse and investigate the demographics, economic as well as institutional
factors with a view to establishing how they impact on IRWH technology for the purpose of
enhancing household food security.
2.7.1 Age of the household head
Age is a factor that is often taken into account when determining adoption willingness of
agricultural technologies in many studies. Literature puts forward contrasting arguments on
how age impacts on the adoption of agricultural technologies. A study by Murgor et al. (2013)
on factors influencing farmers’ decision to adapt RWH techniques in Kenya has found that
young farmers are always ready to take risks and adopt expensive, but effective agricultural
technologies in order to enhance their food security status. On the other hand, older famers are
more traditionalist and not keen to take risks hence a likelihood of being food insecure. Monde
(2005) evaluated the sustainable techniques and practices for RWH technologies in Khayalethu
and Guquka villages in the EC concluded that age has a negative effect on the willingness to
adopt technology or innovations. However, Kai (2011) revealed that age is not a significant
factor in the adoption decision.
Since adoption of RWH technologies pay-offs occur over a long period of time, while costs
occur in the earlier phases, age of the farmer can have a deep effect on technology adoption.
Monde et al. (2012) revealed that the probability of adoption of the IRWH technology increased
with age among smallholder farmers in the EC. Similarly Ngwenya (2013) focusing on factors
affecting rural farming households’ willingness to participate in a proposed irrigation scheme in

28
Guquka in the EC established that 30% of the adopters were over 60 years of age. This can
reduce their interest in the IRWH technology because of the smallholder farmers’ advanced age
and the possibility of not living long enough to enjoy it. For example in the EC, Baiphethi et al.
(2009) found that elderly farmers often have different goals other than income maximisation, in
which case, they did not adopt an income enhancing technology which in this case is IRWH
technology.
2.7.2 Gender of the household head
There are several empirical studies that have been conducted on the effect of gender to RWH
technologies adoption. Hatibu et al. (2006) found no significant association between gender and
the adoption of RWH technologies for crop enterprises among rural farmers in East Africa.
Shikur and Beshah (2012) revealed that the adoption of IRWH technology among poor
households in Ethiopia is gender-neutral. Gebregziabher et al. (2013) have indicated that male
headed households have a comparative advantage in the adoption of rainwater management
technologies in the Blue Nile River Basin. The results of Joseph and Botha (2012) also
disclosed that male headed households are more likely to adopt IRWH technology compared to
female headed households. While this is in agreement with the findings of Botha (2005),
Kalineza et al. (2008) reported that female headed households are more likely to adopt
sustainable agricultural technologies in Tanzania. Although the impact of gender on technology
adoption is likely to be technology-specific and generalisation is not possible (Kalineza et al.,
2008). Also Monde et al. (2012) in Nkonkobe Municipality in the EC found that the majority
(60%) of smallholder farmers who adopted IRWH technology were women.
Baiphethi et al. (2009) in the EC established that male farmers tend to adopt IRWH technology
than female farmers. The main reason advanced was that IRWH technology is very time
consuming. The other argument is that, constraints to women adopting technology include
socially conditioned inequalities in the access, use and control of resources and credit. Also
women do not access technical training because they are busy with house chores (Baiphethi et
al., 2009). According to Gebregziabher et al. (2013) most of the agricultural work is typically
undertaken by men, while women are usually restricted to household and backyard activities.
This suggests that men are more likely to have better farming experience than women.

29
2.7.3 Education level of the household head
According to Murgor et al. (2013) education can change the behaviour of smallholder farmers
regarding their attitude and awareness towards a new agriculture technique. Thus, the more
educated the smallholder farmer, the higher the chances of adopting the IRWH technology
which increases the likelihood of being food secure (He et al., 2007). In that sense, one’s
educational level influences the adoption of IRWH technology in enhancing such individual’s
food security status positively.
As put forward by ARC (2001) education is associated with adoption because it is believed to
increase smallholder farmers’ ability to obtain and analyse information that helps him/her to
make appropriate decisions. Similarly, Moyo and Nyimo (2006) as well as Ngwenya (2013)
indicated positive relationship between education and adoption of RWH technologies. Mutekwa
and Kusangaya (2006) also indicated that education enhances the adoption of IRWH technology
positively. On the contrary, a study conducted by Monde and Aliber (2007) in the EC, revealed
that education had no significant effect on the adoption of IRWH technique. Households with
more educated members are likely to have better access to information and are more aware
about the merits and demerits of the technologies. They are also able to interpret new
information to make knowledge-based decisions in favour of the appropriate/suitable
technologies (Amha, 2006). On the other hand, households with more educated members may
be less likely to invest in labour intensive technologies and practices because they are more
likely to earn higher returns from their labour and capital investment through other activities
(ARC, 2001). For instance, van der Horst (2013) has found that more educated farmers did not
adopt any irrigation system in Guquka in the EC.
2.7.4 Household size
Household size can influence adoption of technologies negatively or positively because
household size is associated with availability of household labour supply (Kai, 2011). IRWH
technology is labour intensive. Therefore, family labour availability in elderly equivalent
positively influenced the adoption of IRWH technology and the likelihood of being food secure
as it relieved the labour constraint faced by most smallholder farmers in the Limpopo Province
(Badisa, 2011). Kalineza et al. (2008) reported that large households have the capacity to relax

30
the labour constraints required during technology adoption. According to Gebregziabher et al.
(2013) it is expected that a larger household size will affect positively the decision of adopting
RWH technologies. The experience in the EC (Monde, 2003; Monde and Aliber 2007;
Baiphethi et al., 2009; Monde et al., 2012) shows that family size in adult equivalent has a
positive and significant effect on the adoption of IRWH technology.
According to Backeberg (2009) construction and maintenance of the IRWH technology
normally requires lot of labour. The reasons for this are that, the structure needs to be
constructed on an annual basis (Alem, 2001). Also the catchment area has to be maintained to
free vegetation (Woyessa et al., 2006). In addition, Bunclark and Lankford (2010) noted that
the structure of IRWH technique needs to be repaired after heavy storms because it involves
earth ridges which are easily disturbed. Therefore, families with a few numbers of their
members working in farm are likely to be non-adopters of this technology and may not expand
to larger areas (Botha et al., 2007).
2.7.5 Farmers’ perception towards the IRWH technology
Farmer perception on the preferences for certain technology may influence his/her decision to
adopt that technology. According to Amha (2006) perception for certain technology based on
real experience or perceived characteristics influences the adoption of that technology. In the
study of Gebregziabher et al. (2013) farmers’ positive attitude towards RWH techniques had a
positive effect on the adoption of the techniques. A majority of the smallholder farmers who
adopted the technologies revealed that the IRWH technology is essential for altering their
livelihood. Those smallholder farmers who did not adopt the technology had a negative attitude
about the technology. The results imply that respondent responsiveness to IRWH technology
depends highly on the strength of this technology related attitude. Abera (2008) reported similar
findings on compost adoption in Ethiopia. The findings of some empirical studies show that
smallholder farmers with a generally positive attitude are eager to adopt IRWH technology
(Botha, 2005; Kalineza et al., 2008; Shikur and Beshah, 2012).
In a study conducted by Monde et al. (2012) farmers’ perceptions were described as a
continuous variable and referred to the superiority of the technology in terms of its advantage
and compatibility with smallholder farmers circumstances. According Monde et al. (2005) there

31
are perceived benefits associated with the adoption of a technology that can translate into more
resources being devoted to the technology. Farmer perception on increased production may
increase the probability of the adoption of new technologies. This will lead to a higher demand
of IRWH technology and a probability of being food secure (Kalineza et al., 2008).
2.7.6 Farm income
Income earned through participation in agricultural activities improves farmers' financial
capacity and increases the ability to adopt new technology (Baiphethi et al., 2010). IRWH
technique improves soil fertility through the use of mulching and reduces production risk
significantly (Backeberg, 2009). Therefore, higher yields will be obtained and sold as a result
farmers’ income is highly likely to increase. Most empirical studies have established that the
effect of farm income on households’ adoption of agricultural technologies decision is positive
and significant. For example, in Ethiopia Shikur and Beshah (2012) found a positive significant
relationship between farm income and adoption of the RWH technologies. A study by Ahmed et
al. (2013) in Kenya has established that the level of household farm income has a positive and
significant effect on the decision to adopt the RWH ponds. The finding suggested that farmers
with financial endowment had a higher probability of adopting the RWH ponds because the
financial resources enabled such farmers to meet the costs related to constructing the ponds.
According to Joseph and Botha (2012) both the rate and extent of the adoption of the IRWH
technology are positively related to changes in the income from the technology in the Limpopo
Province. This is the case because the existence of agricultural income sources could allow
farmers to better manage the costs of some technologies such as fertiliser costs, labour and
equipment. In KwaZulu-Natal, Baiyegunhi (2014) on the study of determinants of RWH
technologies adoption for home gardening in Msinga, hypothesised farmers with more farm
income to be innovators because they have more funds to acquire resources and invest in the
technology. The study further found that the source of income for majority of farmers was the
farm and about 53% of the farmers entirely depended on farming activities for survival and
generation of income and/or depended on farming activities to supplement their main sources of
income.
However Ngwenya (2013) highlighted that farm income may affect adoption positively or

32
negatively depending on its’ relative contribution to household income and/or farm profitability.
2.7.7 Household income
Total household incomes’ effect on innovation adoption has been analysed by multiple studies
as well (Amha, 2006; Bunclark and Lankford, 2010; Shikur and Beshah, 2012; Murgor et al.,
2013; Gebregziabher et al., 2013). Shikur and Beshah (2012) found that having household
income that is low had a negative effect on the IRWH technology adoption. While Amha (2006)
reported that, greater total household income had a positive effect on the adoption of IRWH
technology. The study by Gebregziabher et al. (2013) showed that rich farmers and middle
income households are more enthusiastic in adopting the RWH technologies than poor
households. This is due to the fact that the financial inheritance of the rich and middle income
households motivates them to take credit and invest in the RWH technologies. However, the
poor households preferred either not to adopt the RWH techniques or adopt the less expensive
category. Monde et al. (2012) found that household income had a positive effect on IRWH
technology. According to Bunclark and Lankford (2010) households’ access to alternative
sources of income are likely to influence the adoption of rainwater management technologies in
different ways. For example, those who have alternative sources of income are better in
adopting and investing in IRWH technology. On the other hand, participation on other income-
generating activities is likely to divert labour from on-farm activities and working on rainwater
management technologies.
Past studies also suggests that household with higher incomes would be more likely to adopt
IRWH technology and have a probability of being food secure than those with lower incomes,
since the former would even hire labour if they were constrained in that direction
(Gebregziabher et al., 2013).
2.7.8 Land tenure security
According to Baumüller (2012) a central factor affecting investment, production and
conservation decisions is the smallholder farmer’s level of control over his land. A smallholder
farmer with secure tenure is much more likely to think of long term production and
conservation activities than are sharecroppers or migrant labourers. For smallholder farmers to

33
be able to carry out long or medium term investment, they require security of tenure (Pote,
2008). Thus, smallholder farmers who are land secure are willing to learn and take the essential
measures which enhance production and productivity (White, 2012). In addition, they are likely
to adopt RWH technologies to enhance their food security status.
Land ownership is a factor that has been analysed by various studies (Pote, 2008; Woyessa et
al., 2006; Woyessa et al., 2007; Nhundu, 2010).The results have shown contradiction in its
effects on the rate of adoption. These contradictions are thought to be due to the nature of the
innovation being tied to the land, in the instance of switchgrass, it does not require land tied
investments, as is the case for IRWH technology (Unganai, 2005). A study by Pote (2008)
suggested that lack of tenure security discouraged smallholder farmers from making long-term,
ecologically beneficial investments on their land in the EC.
2.7.9 Land size
According to Murgor et al. (2013) farm size can have different effects on the probability of
adoption, depending on the characteristics of the technology and the institutional setting.
Smallholder farmers with large farm sizes are likely to be able to take the risk of adopting new
technology compared to smallholder farmers with small farm sizes (Woyessa et al., 2007). On
contrary, the study of Yengoh et al. (2010) in Ghana revealed that households with relatively
large landholdings were able to diversify their crops and income sources, they were less
susceptible to risks and shocks; as such, they were less interested in investing in rainwater
management technologies as a coping mechanism. Interestingly, it was also found by van der
Horst (2013) that smallholder farmers with small land size utilise the limited resources more
efficiently and adopt new technologies at a faster rate.
The impact of land size on adoption of the IRWH technology as shown in a case study by
Baiphethi et al. (2009) indicated that land size positively influences adoption, as smallholder
farmers with a large land size generate more income. This provides a better capital base and
enhances risk bearing ability and that smaller farms have little incentive to adopt new
technologies compared to larger farmers who benefit from economies of scale. Badisa (2011) in
the Limpopo Province found that the adoption of IRWH technology was higher on relatively
large farms. As a result, smallholder farmers with larger plots were able to sell more produce

34
and made more use of the technology. It was concluded that larger farms reduce transaction
costs, which increases the economic advantage and incentives of new technologies as well as
the possibility of being food secure.
2.7.10 Access to credit
Chisasa and Makina (2012) stated that, given the fact that a majority of smallholder farmers are
resource-poor and unable to access credit, there will be a limitation to smallholder farmers’
ability to adopt modern technologies because the costs of hiring labour, transportation of
agricultural products and construction material are too high. According to the study of
Gebregziabher et al. (2013) access to credit improved options to address liquidity constraints
associated with investments in rainwater management technologies. Other studies also found
that the lack of credit access limited the adoption of IRWH technology (Mutekwa and
Kusangaya 2006; Baiphethi and Jacobs, 2009). Further, the lack of sufficient accumulated
savings by smallholder farmers could prevent them from having the necessary capital for
investing in new technologies which may limit their food security status (Kai, 2011).
2.7.11 Access to infrastructure
Most scholars pointed out that access to infrastructure is an important factor on deciding
whether or not to adopt new agricultural technologies (Baiyegunhi, 2014). However rural
communities often lack access to storage facilities and markets because of poor roads. This
invariably leads to low rates of the adoption of IRWH technology and the likelihood of being
food insecure (Woyessa et al., 2007).
Gebregziabher et al. (2013) used the walking distance (in minutes) as a proxy of access to
markets. Therefore, the study hypothesised that the longer the walking distance to markets the
less likely it is that households will adopt a particular RWH technology. The empirical results
proved this hypothesis to be correct as it was found that improved access to markets have the
potential to increase farmers’ adoption of rainwater management technologies. Alem (2001)
reported that a commonly cited challenge for IRWH technology by smallholder farmers in
Ethiopia is the unavailability of markets to dispose their surplus produce. Baiphethi et al. (2006)
concluded that in the Free State Province informal markets were easily over supplied, mainly by

35
similar products being produced and marketed at the same time, thus leading to a fall in prices
and profits. Furthermore, it was also noted by WRC (2007) that in the EC the main challenge
identified by smallholder farmers was the poor market access for their produce after a good
harvest. WRC (2007) further stated that this was compounded by the fact that the community
market was too small to absorb all the surplus produce from IRWH farmers. Therefore,
Hlanganise (2010) suggested that there is need to identify the market before the choice of
produce for IRWH technique. As put forward by Murgor et al. (2013) distance to market as the
determinant for adoption of IRWH technology indicates that the adoption process does not
depend only on smallholder farmers’ willingness but also on an overall sustainable rural
development. Therefore there is a great need to emphasise the importance of infrastructure
particularly road networks and communication services.
According to Phahlane (2007) a lack of financial resources was also found to lead to an inability
to purchase fencing material to protect crops from being damaged by livestock. As a result, not
having a fence around croplands to prevent animals from entering the fields is an important
challenge for smallholder farmers (Botha et al., 2007). Moreover, lack of fence reduced the
adoption of IRWH technology by smallholder farmers in Limpopo Province, as the risk of crop
damage remained too great (Badisa, 2011). Smallholder farmers in the EC also encountered
crop theft as a result of lack of fencing (Hlanganise, 2010).
2.7.12 Access to extension services and information
According to Badisa (2011) access to information on IRWH technology is important for
smallholder farmers to adopt the technology. The more the information smallholder farmers get
the higher the probability of adopting the IRWH technology. This means that the smallholder
farmers’ education alone might not have a great influence on the smallholder farmers’ decision
in deciding whether or not to establish IRWH technology. Therefore smallholder farmers must
rely more on the extension officer for information on such technologies. Such contacts are
helpful in the early stages of technology experimentation. Access to information positively
influenced the adoption of IRWH technology in the study of Badisa (2011).
Contact with extension officers allows smallholder farmers to have a greater access to
information on technology, through increased opportunities to participate in demonstration tests

36
and thus increase smallholder farmers’ ability to get, process and use the IRWH technology
(Shikur and Beshah, 2012). Farmers who are knowledgeable in the IRWH technology are
expected to adopt the technique compared to those that are not knowledgeable (Monde et al.,
2012). For example in the EC, smallholder farmers cited poor access to information and
understanding of the IRWH technology as the problem which leads to a lesser likelihood of the
adoption of the technology which may translate to food insecurity (Botha et al., 2007). Botha et
al. (2007) further emphasised the need for smallholder farmers to be trained more on the
operation of the system as they had just recently started using the technique.
According to Backeberg (2009) farmers lack skills and knowledge on how to effectively utilise
the IRWH production technique. Monde and Aliber (2007) also stated that, some of the
smallholder farmers practicing IRWH technology in the EC’s rural areas lacked the agricultural
knowledge and expertise to maximise the benefits from the water that they collected. It has been
suggested by Hlanganise (2010) that some of the implementation plans/designs may be too
technical for users in the EC. Therefore, access to extension service and information influences
the adoption of IRWH technology in improving household food security status.
2.7.13 Distance to other water sources
The IRWH technology is thought to be particularly suited to the application of supplemental
irrigation in arid and semi-arid areas where yield losses are high due to moisture stress
(Bunclark and Lankford, 2010). This decreases production risk therefore, the further away the
other water sources for irrigation purposes the higher the adoption of IRWH technology and a
likelihood of being food secure (Woyessa et al., 2007).
2.7.14 Availability / reliability of rainfall
Moyo and Nyimo (2006) noted that the success of the IRWH technology is heavily dependent on
the reliable seasonal rainfall. Monde et al. (2012) revealed that the mean annual rainfall is
571.01mm in Guquka, Khayalethu and Krwakrwa villages in the EC making rain-fed crop
production possible. Although the mean annual rainfall is relatively high, the winter period is
generally dry, with June and July as the driest months. One can expect only 7% of the total
annual rainfall in these months, compared to roughly 70% in the months of October through

37
March. The unpredictable conditions of rainfall in these areas necessitate irrigation for
successful agricultural production. As a result, during the dry season IRWH technology cannot
be employed because of the lack of rainwater (ARC, 2001). On the other hand, if rainfall
intensity is high and falls with more force on the soils surface, there will be reduced soil
infiltration and more run-offs will be generated in fine textured soils (WRC, 2007). This will
lead to lower production yields for smallholder farmers. Furthermore, there will be water
logging problems during high rainfall periods which may cause irreversible damage to the
structures of IRWH technique (Alem, 2001).Therefore, availability and reliability of rainfall
influences the adoption of the IRWH technology in enhancing food security of smallholder
farmers.
2.7.15 Steep slopes
Another important requirement to be considered in the implementation of IRWH technology for
crop production is the slope of the area (Botha, 2005). This technique is not recommended for
areas where the slope gradient is greater than 5 %, due to uneven distribution of run-off and
large quantities of earthwork required (Baiphethi et al., 2010). Steeper slopes can allow rapid
run-off of rainfall which will increase soil erosion. This will limit the benefits that a smallholder
farmer can achieve from practicing the IRWH production technique. Gebregziabher et al.
(2013) reported that slope constrained smallholder farmers from adopting the IRWH technology
which in turn posed a threat on the probability of being food secure in the Nile River Basin in
Colombo. The steepness or flatness of a plot affects the use of the IRWH technology. The
deduction from the result of Gebregziabher et al. (2013) is that those users of the IRWH
technology with plain (flat) slope have more ease to use the IRWH technology than farmers
having steep land slope. This is in line with research the findings of Ngigi (2003) who
concluded that, the nature of the slope largely determines the suitability of the run-off
generation.
2.8 Summary
The decision to adopt a new agricultural technology involves an interrelated series of
demographic, economic, social and institutional factors, such as age of the household head,
gender of the household head, education level, household size, farm income, household income,

38
land size, land tenure security, access to infrastructure, access to credit, access to extension
services, access to information, distance to other water sources and farmers’ perception towards
the technology. Also, the decision involves characteristics of a technology, such as simplicity,
visibility of results and low capital investment. Therefore technology adoption in general is not
a once-off decision rather it is a stepwise decision made after carefully weighing opportunity
costs at each point. There are five categories of adopters in a social system: innovators, early
adopters, early majority, late majority and laggards.
In this study, smallholder farmers are defined as those farm households with an access to means
of livelihoods in land relying primarily on family labour for farm production to produce for self-
subsistence and often for market sale and that practice crop production in 0.1-10ha of land.
Their main objective is to improve their household food security status. Studies discussed that
smallholder farmers are linked to smallholder agriculture. Other studies argued that this
smallholder agriculture does not improve household food security while others argued that it
does.
Three types of RWH technologies reviewed in this study, includes DRWH, XRWH and IRWH.
This study focused more on IRWH technology. This technology was first introduced at
Khayalethu and Guquka villages in 2004 which took five years to be introduced and followed
by Krwakrwa village in 2008 also took five years. The practice is mostly used in homestead
gardens by smallholder farmers. IRWH technology can be explained as a technique that has the
potential to reduce total run-off to zero and thus make more water available to plants. Therefore,
a number of opportunities were reviewed from the various studies which proved that IRWH
technique contributes to household food security. There is an agreement in all studies that the
greatest opportunity availed by the IRWH technique is increased production yield, thus
increased food and/or income for the household and their nutritional status.

39
CHAPTER 3
SELECTION AND DESCRIPTION OF THE STUDY AREAS
3.0 Introduction
This chapter outlines why study areas were selected as well as giving a brief description of the
study areas. A description of the background information about Nkonkobe Municipality
includes issues regarding climate, soils, governance, demographics, income levels, economic
activities and infrastructural profile. As much as the description covers the entire geographical
area which constitutes the Nkonkobe Municipality, specific reference to the study areas is made
where necessary. The selection of the study area is discussed in the following section.
3.1 Selection of the study areas
The study was conducted in Khayalethu, Guquka and Krwakrwa villages in the EC. The EC
was purposively selected because it is one of the three Provinces that practice IRWH technique
in South Africa (Monde et al., 2012). Also Khayalethu, Guquka and Krwakrwa villages were
selected for the purposes of this study because IRWH technology was introduced in 2004 and
2008 therefore factors that affect the adoption of this technology in these study areas needed to
be investigated. These study areas are described below.
3.2 Description of the study areas
The villages are located close to a small town called Alice. They fall under the Nkonkobe
Municipality. According to the Nkonkobe Municipality Spatial Development Framework
Review (SDFR) (2010/11-2012/13) the municipality falls under the former Ciskei homeland
and is named after the Winterberg mountain range. The municipality comprises of 141 suburbs,
which are divided into 21 wards. Nkonkobe Municipality is mainly rural, incorporating the now
disestablished Alice Transitional Local Council (TLC), Fort Beaufort TLC, Middledrift TLC,
Hogsback Local Council (LC), Seymour TLC, Victoria East Transitional Rural Council (TRC),
Fort Beaufort TRC, Mpofu TRC and Middledrift TRC (Vengayi, 2009). Fort Beaufort is the
capital for Nkonkobe Municipality. It covers an area of 3 725 km2 and accounts for 16% of the
surface area of the Amathole District (Nkonkobe Municipality Integrated Development Plan
(IDP), 2013/14).

40
These villages are located within the Tyhume Valley. The valley, which is traversed by the
Tyhume River, is the home of the AmaKhuze Tribal Authority under Chief Mqalo. The villages
lie just below the escarpment of the Amatola Mountains with the upper Tyhume River flowing
past them. The Tyhume River acts as a border between Guquka and Khayalethu villages. Figure
3.1 shows the location of Khayalethu, Guquka and Krwakrwa villages in Nkonkobe
Municipality.
Figure 3.1 Map showing location of Khayalethu, Guquka and Krwakrwa villages in Nkonkobe
Municipality
Source: South African explorer (2013)

41
The study areas were further described in terms of climate and rainfall, soils, governance,
demographics, income levels, economic activities and infrastructural profile.
3.2.1 Climate and rainfall
Climate data was obtained from Honey Dale Farm Weather Station. Long-term climate data of
Khayalethu, Guquka and Krwakrwa villages indicate that the areas are semi-arid with an aridity
index of 0.35 (Monde et al., 2012). The mean annual precipitation for the study areas is
571.01mm. The study sites receive 69% of their annual rainfall between October and March.
Over this region, the average number of hail events per annum is about two, usually occurring
during late spring (November) (Monde et al., 2012). The maximum temperature is found in
February at 28.58ºC and the minimum falling to 5.05ºC in July. Frost can be expected from 13
May lasting until 15 October (Monde et al., 2012). Table 3.1 illustrates the average rainfall and
temperature values for the study sites per month.
Table 3.1: Summarised climatic information 1979 - 2013
Month Average Max
T °C
Average Min
T °C
Average
Rainfall(mm
Evaporation
A pan (mm)
Average
Mean T°C
January 28.23 16.24 67.27 189.85 22.24
February 28.58 16.59 66.90 157.72 22.58
March 27.17 14.92 63.57 137.30 21.05
April 25.09 11.61 48.37 106.01 18.38
May 23.20 8.25 20.66 95.75 15.73
June 20.59 5.37 21.40 87.43 12.99
July 20.89 5.05 18.36 101.89 12.97
August 21.78 6.85 31.58 117.27 14.31
September 23.30 8.83 34.23 130.71 16.05
October 24.18 11.30 60.36 147.13 17.73
November 25.46 13.17 80.90 156.32 19.32
December 27.18 14.93 73.52 189.07 21.05
Total __ __ 571.01 1577.65 __
Source: Survey data (2013)
These areas are semi-arid with an average rainfall of 571.01mm and an average temperature that
is above 18°C in some months. This makes them suitable for IRWH technology as discussed in

42
Section 2.5 and if households adopt this technology they will have a likelihood of being food
secure.
Soils that were found in the study areas were discussed below.
3.2.2 Soils in the Khayalethu, Guquka and Krwakwra villages
A soil survey conducted by Monde et al. (2012) established the following soils to be found in
the study areas: Cartref (Cf), Wasbank (Wa), Vilafontes (Vf), Oakleaf (Oa), Westleigh (We),
Sepane (Se), Swartland (Sw), Valsrivier (Va) and Longlands (Lo). CF and Wa soils dominate
and are not recommended for serious crop production due to their shallow to moderate depth.
These soil types Vf, Oa, We, Sw, Se and Va are recommended for crop production especially if
the IRWH technology and conservation techniques can be used (Monde et al., 2012). According
to Monde et al. (2012) this is possible because their rooting depth ranges from 300mm to
1200mm and the minimum recommended rooting depth for the implementation of IRWH
technology is 500mm as discussed in Section 2.5. This may promote the adoption of IRWH
technology and a likelihood of being food secure.
The governance that operates in the study areas is highlighted in the following section.
3.2.3 Governance
In these three villages, chiefs are still leading in terms of governance (NDP, 2013). Whenever
there is some activity including agricultural technologies like IRWH that will be implemented
in the villages, it is of interest to bring in a chief by informing and explaining the objectives of
that activity first. It is good because they will help in mobilising people for programmes related
to introducing new agricultural technologies. This is a plausible development as people still
listen and respect chiefs. This is the case because there is a general belief amongst traditionally
rooted rural communities in South Africa that chiefs always want the livelihood of their people
to be improved. This approach has the potential to assist in the adoption of IRWH technology
which in turn will improve household food security in these areas.
The following section gives an overview of the demographics of the municipality.

43
3.2.4 Demographics
Demographics like population, age distribution, gender distribution, education level and
unemployment will be discussed in this section.
3.2.4.1 Population
According to the Nkonkobe Municipality IDP (2013/14) the total population in Nkonkobe
Municipality is 127 215, which represents 8.7% of the total population of Amathole District
Municipality. Nkonkobe Municipality has 21 wards; and it is dominated by large population
which is poor. This may serve as the reason why households opt not to adopt IRWH technology
because of capital constraints and have a probability of being food insecure. The majority of the
population (72%) resides in both villages and farms and 28% are located in urban dwellings.
Urbanisation is mainly concentrated in Alice and Fort Beaufort.
The dominant races in Nkonkobe Municipality are Africans with 94.8% followed by the
Coloured community with 4%, Whites with 1% and lastly by Indians or Asian with 0.2%, as
illustrated in Figure 3.2 below (Nkonkobe Municipality IDP, 2013/14).
Figure 3.2: Population distributions by race
Source: Nkonkobe Municipality IDP (2013/14)
According to the NDP (2013) this municipality has an average population density of 35 persons
per km2. This suggests that the municipality is densely populated and those smallholder farmers
practicing crop production, practice on a small pieces of land (Monde et al. 2012).This may lead
Africans 94.8%
Coloured 4%
Whites 1%
Indian/Asian 0.2%

44
to the low adoption of IRWH technology and a chance of being food insecure because
households might produce for consumption (Murgor et al, 2013). The number of populations
and households in Khayalethu, Guquka and Krwakrwa villages as well as their distance from
Alice town is tabulated in Table 3.2 below.
Table 3.2: Number of population, households and distance from Alice town
Villages Khayalethu Guquka Krwakrwa
Population 1278 1140 2400
Households 233 220 400
Distance from Alice town (Km) 25 30 15
Source: Monde et al. (2012)
The distances from Alice town indicate that households have to use some means of transport to
get to the input and output markets. This could influence adoption the IRWH technology and
household food security status negatively because of higher transaction costs.
3.2.4.1.1 Population growth rate
The population of Nkonkobe has moved from -2.0% in 1997 to -0.5% in 2011 (Nkonkobe
Municipality SDFR, 2010/11–2012/13). Population growth slowed in 2001-2002 and the
growth rate show signs of population growth at a decreasing rate. This decline in total
population can be attributed to a drop in the birth rate coupled with an increase in the death rate,
at a younger age (Nkonkobe Municipality IDP, 2013/14). Another factor that may have resulted
in population decline is migration and this could result in a reduction in labour supply
(Nkonkobe Municipality IDP, 2013/14). As a result this will possibly negatively impact on any
attempts to adopt IRWH technology and a possibility of being food insecure because it is labour
intensive.
3.2.4.2 Age distribution
The dominant age group consists of people below the age of 19 years by 21% (refer to Figure
3.3). This shows that the youth is dominant in Nkonkobe Municipality, in comparison to older
people (Nkonkobe Municipality IDP, 2013/14). The Nkonkobe Municipality SDFR (2010/11–
2012/13) noted that, of the current population, 18% consists of the pre-school and school going
ages as shown in Figure 3.3 below.

45
Figure 3.3: Age distribution in the Nkonkobe Municipality
Source: Nkonkobe Municipality IDP (2013/14)
Given that youth is dominant in the Nkonkobe Municipality; this may suggest that the adoption
of IRWH technology may be low and the probability of being food insecure is high. This could
be because youth of that age is still attending school and have different perception about
agriculture such that their participation is low.
3.2.4.3 Gender distribution
According to the Nkonkobe Municipality IDP (2013/14) males constitute 48% and females
constitute 52% of the municipality population. The Nkonkobe Municipality SDFR (2010/11–
2012/13) noted that the reason for a lower number of males than females is that males tend to
migrate to the mining sector as well as other industries in search of better employment
opportunities. Therefore, this suggests that the adoption of IRWH technology maybe low with a
likelihood of households being food insecure in the study areas. This might be the case because
this technology requires lot of time and labour but women are usually constrained to household
activities as noted by Gebregziabher et al. (2013).
3.2.4.4 Educational level
The educational level of communities in Nkonkobe Municipality has improved since 2008 when
there was a low educational level with 19% of the population having no formal education. Only
8% had matriculation and 3% had matriculated with a post-matric qualification. In terms of
18 21
17
11 11 10 7
4 2 0
5
10
15
20
25
0-9 10-19 20-29 30-39 40-49 50-59 60-69 70-79 80 and above
Per
cen
tage
Age in years

46
literacy levels, people over 13 years of age had completed grade 7 (Nkonkobe Municipality
SDFR, 2010/11–2012/13).
According to the Nkonkobe Municipality IDP (2013/14) the literacy rate has increased to 61.0%
and which makes 39% of the Nkonkobe community illiterate. The high failure rates amongst
students due to peer pressure and other environmental factors have influenced the education
status of Nkonkobe Municipality. The high rate of literacy may be attributed to tertiary
institutions in and around the Nkonkobe Municipality. Nkonkobe Municipality has 258 schools
which have grown from 221 since 2008; this excludes tertiary institutions namely: University of
Fort Hare, colleges (MSC, Lovedale, Fort Cox as well as Healdtown). The University of Fort
Hare and Lovedale College are two institutions famous for being the cradle of South Africa’s
democracy.
In some areas within this municipality schools are located far from homes meaning that children
have to travel long distances before reaching school. This puts the children’s lives at risk.
Schools lack libraries in order for children to study during breaks should they want to. Proper
accommodation for school teachers is also a problem due to the nature of rural areas. Children
are migrating to better schools like former Model C schools due to the quality of the education
that is offered in rural schools (Nkonkobe Municipality IDP, 2013/14). There are problems that
have been identified that influence education, and these are: failure amongst students due to
poverty and unemployment, scarcity of teachers of essential subjects (e.g. science subjects),
migration of learners to urban schools, shortage of buildings (infrastructure), poor roads that
affect the transport of scholars as well as other issues (Nkonkobe Municipality IDP, 2013/14).
The improving of literacy levels in the Nkonkobe Municipality means that more people are
becoming educated which makes the understanding of information about agricultural
technologies better. This suggests higher chances of adopting IRWH technology and a
likelihood of being food secure.
3.2.4.5 Unemployment
Nkonkobe Municipality has the highest unemployment rate in comparison to other
municipalities that fall under the Amatole District. The unemployment rate has increased from

47
35% in 1996 to 57.8% in 2011 (Nkonkobe Municipality IDP, 2013/14). The Nkonkobe
Municipality SDFR (2010/11–2012/13) noted that this municipality is faced with high
unemployment as well as high poverty levels coupled by factors such as low income. This may
lead to the low adoption rates of IRWH technology and a possibility of being food insecure.
This might happen because households will not be able to buy inputs like fertilser, seeds or hire
labour (Bunclark and Lankford, 2010).
3.2.5 Income levels
According to the Nkonkobe Municipality IDP (2013/14) about 70% of the people in the
municipal area go to bed without an income at all. About 6531 people in Nkonkobe
Municipality earn an amount between R401 and R800 per month. The income levels are
extremely low and people without any income account for 74% of the population. A salary or
wage less than R800 per month is of serious concern as it means that the disposable income is
low and so is the consumers’ spending power. This might contribute to a lesser likelihood of the
adoption of agricultural technologies including IRWH and a possibility of being food insecure.
This may limit smallholder farmers in buying inputs like fertiliser, seeds or hire labour therefore
they could not invest in IRWH technology (Bunclark and Lankford, 2010).
The economic activities practiced in Nkonkobe Municipality were highlighted below.
3.2.6 Economic activities
In this section non-farm and agricultural activities are discussed.
3.2.6.1 Non- farm activities
Figure 3.4 shows the different contributions made by the various sectors to the Nkonkobe
Municipality. There are ten different contributors to the Gross Domestic Product of Nkonkobe
Municipality (Nkonkobe Municipality IDP, 2013/14). Community services like cleaning of
towns, collection of refuse and other contribute more than the other sectors, meaning that the
Nkonkobe Municipality is not dependent on government services since these services are
characterised by not bringing any growth to the municipality’s profit (Nkonkobe Municipality
SDFR, 2010/11 –2012/13). There should be a focus on other sectors such as agriculture which
will be discussed in the next section and manufacturing sectors which could be encouraged

48
since they have a potential of bringing growth to the economy as well as creating a great deal of
jobs (Nkonkobe Municipality IDP, 2013/14).
Figure 3.4: Sectors contributing to the Nkonkobe Municipality Gross Domestic Product
Source: Nkonkobe Municipality IDP (2013/14)
Since there is not much growth in the municipality’s profit this may mean less formal jobs are
created which contributes to low incomes (Nkonkobe Municipality IDP, 2013/14). This could
imply that the adoption rates of IRWH technology may be low and a possibility of being food
insecure amongst the households because they lack collateral in order to access credit to buy
inputs (Badisa, 2011).
3.2.6.2 Agriculture
Nkonkobe Municipality is a place which has diverse climatic conditions that allow various
agricultural enterprises to be practiced. The main enterprises within the region are citrus,
livestock (cattle, sheep and wool production) and irrigation schemes (Nkonkobe Municipality
IDP, 2013/14). There are agricultural projects such as Siyazondla, Comprehensive Agricultural
Support Programme (CASP), Citrus production and the King Sandile Development Trust
project (KSDT) that have had a significant positive impact on the development of areas of the
Nkonkobe Municipality. These projects benefit a large number of communities in various wards
of the Municipality who were poverty stricken and have a great deal of unemployment
(Nkonkobe Municipality IDP, 2013/14). Siyazondla is a project that allows households to have
access to and consume fresh vegetables from their home gardens and to sell the surplus produce
to the surrounding communities at low costs. In the 21 wards that Nkonkobe Municipality has,
Community services 60%
Taxes 10%
Agriculture 3%
Mining 0%
Manufacturing 9%
Electricity 1%
Construction 1%
Trade 9%
Transport 2%
Finance 5%

49
only 16 Municipal wards are beneficiaries with 15 households per ward receiving the funding.
There is a CASP project that is under land reform. This project has beneficiaries which causes
the CASP project to have an economic impact to the Nkonkobe Municipality (Nkonkobe
Municipality IDP, 2013/14).
In the Nkonkobe Municipality, there is a cattle production scheme with five Land Redistribution
for Agriculture Development (LRAD) projects. There are a number of communal projects and a
number of commonages. These commonages are farms which the beneficiaries get from the
LRAD (The Department of Land Affairs) whereby they receive 12 Nguni bulls for livestock
improvement. The Katberg river basin is noted for its agricultural potential, with favourable
soils and an adequate water supply. It can be suitable for irrigation crop production and the
production of high quality citrus. Citrus is a major contributor to economic development in the
Nkonkobe Municipality which employs seasonal as well as permanent workers. Paprika, olives
and essential oils are some of the crops that have been identified to be grown in some parts of
this municipal area (Nkonkobe Municipality IDP, 2013/14).
As agricultural activities like the planting of vegetables are practiced in the municipality, the
adoption of IRWH technology is likely to be promoted. It may be promoted because this
technology enables crop cultivation during dry seasons, which allows households to have more
diverse food all year round. As a result their household food security maybe enhanced.
The description of the infrastructural profile found in Nkonkobe Municipality is given below.
3.2.7 Infrastructural profile
Five types of economic infrastructure are considered below (water, roads, fencing, storage and
telecommunications).
3.2.7.1 Water
Water supply is inadequate in most Nkonkobe Municipality areas; especially rural areas lack
water more than the urban areas (Nkonkobe Municipality IDP, 2013/14). NDP (2013) reviewed
that about 26.27% of people in the Nkonkobe Municipality rely on natural sources and 45.87%
rely on public tap water. There is an uneven development and insufficient dams in the region.

50
This has implications on health and leads to hygiene problems (Nkonkobe Municipality SDFR,
2010/11–2012/13).
The insufficiency of water supply in rural areas of the Nkonkobe Municipality may mean less
water for irrigation using sprinkler or drip irrigation and possibly lead to the adoption of IRWH
technology and improvements in household food security because households can use the
IRWH technique to irrigate their crops.
3.2.7.2 Roads
The Nkonkobe Municipality SDFR (2010/11–2012/13) indicated that the Nkonkobe
Municipality has 19282km of paved roads and 1424.63km unpaved roads. The main tarred
roads run in a north-south direction through Seymour and Fort Beaufort and an east-west
direction through Fort Beaufort, Alice and Middledrift. These routes are of strategic importance
because they link places of economic activities. However the existing road network expansion,
especially in the rural parts, is in a poor condition. There is 88% of backlog in the Nkonkobe
Municipality in terms of roads. Therefore, there is significant reliance on the Department of
Roads and Transport for funding in order to address the backlog issue (NDP, 2013).
Given that the road network in rural part of the Nkonkobe Municipality is in a poor condition,
this may imply less accessibility to the input and output markets, hence, a low adoption of
IRWH technology and a likelihood of being food insecure (Murgor et al., 2013).
3.2.7.3 Fencing
In Khayalethu, Guquka and Krwakrwa villages, fencing is a problem as stated by Monde et al.
(2012). As a result, the adoption of IRWH technology might be limited because of the theft
problem and livestock damaging the crops which may lead to food insecurity (Phahlane, 2007).
3.2.7.4 Storage
According to Monde et al. (2012) the only form of storage facility some of the households own
in Khayalethu, Guquka and Krwakrwa villages is an old rainwater tank. They only store dry
maize as a result they produce other perishable vegetables for consumption. This could put a

51
restriction on the adoption of the IRWH technology and household food security (Murgor et al.,
2013).
3.2.7.5 Telecommunications
Both urban and rural settlements have a wide access to cell phones but there is inadequacy on
the part of the municipality with regards to cell phone networks in some rural areas (Nkonkobe
Municipality SDFR, 2010/11–2012/13). The wider access to cell phones will enable farmers to
contact extension officers, other stakeholders or each other more frequently. This might enable
an easy information access about IRWH technology and markets (Botha et al., 2007). This may
promote the adoption of the technology and a possibility of being food secure.
3.3 Summary
This chapter has given the reasons for choosing the study areas and also offered a brief
description of the study areas. It has outlined and explained the physical aspects such as agro-
ecological characteristics (climate and soils) as well as governance, demographics, income
levels and infrastructural profile. Non-farm activities and agricultural production or economy of
the study areas reflected the dominant types of enterprise offered. This is helpful in
understanding the characteristics of the study areas that are important in the interpretations of
the research outcomes from this study.

52
CHAPTER 4
RESEARCH METHODOLOGY
4.0 Introduction
This chapter presents the research methodologies employed in this study, where it summarises
research methods applied in the identification of factors determining the adoption of IRWH
technology for enhancing household food security. It describes the research design as well as
the sampling method employed. It also explains how data was collected and analysed. The
theoretical and conceptual framework of this study is also outlined. Research design used in this
study is described below.
4.1 Research Design
This study employed a cross-sectional design. Data was collected at a single point in time on
several variables such as demographics and household socio-economic factors influencing the
adoption of IRWH technology in relation to household food security. Only a subset to represent
the population therefore was selected. Both qualitative and quantitative data was gathered on
demographics and household socio-economic issues. A qualitative analysis examination (non-
numerical) was performed, for the purposes of discovering underlying meanings and
relationships (Bless et al., 2011).Quantitative analysis (numerical representation) was
performed for the purposes of describing and explaining the phenomena that are reflected by the
data (Babbie and Mouton, 2006).
Information regarding socio-economic factors influencing the adoption of the IRWH technology
for enhancing household food security was acquired using a semi-structured questionnaire. In
addition to the questionnaire, another source of information was ARC in which the information
was gathered using secondary data. The study was carried out in two phases: orientation and a
survey in the 2013 farming season.
4.1.1 The orientation stage
The orientation stage involved a visit to the study areas in August 2013. The main aim of this
stage was to be introduced to the community leadership and familiarise with the study areas.

53
The objectives of the study were outlined to the community leadership with the help of an
agricultural extension official. The date for the second visit was set during the first visit so that
the researcher could be introduced to the community at large and to outline the objectives of the
study to them.
4.1.2 The survey stage
The second stage was the actual survey being conducted where data was collected in September
2013 and ethical issues were taken into consideration when collecting data. Permission to enter
to the community was obtained from the chief and the ward officer. They were informed about
the research. Recruited participants were told about the research objectives. Permission was
obtained from the households to participate in the survey.
The households were assured that the information obtained would be treated as confidential,
that the results would be used for research purposes and may be used to develop policy
guidance that may be used in IRWH technology. The study also took into consideration the
culture and the norms of the households because the questionnaire was structured in a way that
does not offend the households and no households were forced to participate in answering the
questionnaire. There were no unnecessary personal questions asked.
A semi-structured questionnaire was used to interview respondents as a data collection
instrument for the study. In order to be able to carry out interviews the unit of analysis was
identified which is discussed below.
4.2 Unit of analysis
The unit of analysis is the major entity that is analysed in a study (Bless et al., 2011). It could be
any of the following: individuals, groups, artifacts (books, photos, newspapers), geographical
units (town, census tract, state) and social interactions. In this study, individual smallholder
farmers practicing agriculture in the study areas were the units of analysis and hence provided
primary data. The respondents were selected from Khayalethu, Guquka and Krwakrwa villages
in which a sampling frame was developed.
54
4.3 Sampling frame
Bless et al. (2011) define a sampling frame as a list of all units from which a sample is to be
drawn. Not all smallholder farmers in the study areas were selected for the study; but a sample
was drawn. For the sample to best represent the total population, a complete frame was
employed by selecting smallholder farmers practicing agriculture based on their willingness to
participate. A procedure that was used to select respondents will be discussed in the next
section.
4.4 Sampling procedure
Possible sampling methods are classified into probability and non-probability. The non-
probability sampling methods refer to cases where the probability of including each element of
the population in a sample is unknown while the probability sampling methods refer to cases
where the probability of including each element of the population in a sample is known (Bless
et al, 2011). For this research the availability (accidental) sampling which is a non-probability
sampling procedure was employed to select respondents. This was done, because of the limited
time, the study focused on respondents who were willing to be interviewed. The advantage for
using the accidental sampling method was that only those farmers who were conveniently
available were interviewed so as to obtain a large number of completed questionnaires quickly
and economically as argued by Leedy and Ormrod (2004). Since it is non-random, this sampling
method is problematic because of sampling errors.
In each village, smallholder farmers were gathered in the hall to be interviewed. In addition to
the accidental sampling method, snowball sampling method was used in cases whereby the
available smallholder farmer was referred to by other farmers in the hall. Snowball sampling
according to Bless et al. (2011) is appropriate for a situation where members of a special
population may be difficult to locate. Thus a sample size was raised.
4.5 Sample size
When sampling, it is important to deal with an adequate sample size in order to collect accurate
information about a group (Bless et al., 2011). A large sample is more representative but very
costly; while a small sample is less accurate but more convenient (Babbie and Mouton, 2006).

55
The study consisted of three villages in Nkonkobe Municipality where individual smallholder
farmers practice agriculture. The secondary data from the Department of Agriculture for
smallholder farmers practicing agriculture was used for sampling and a sample from each
village was selected as shown in Table 4.1. Khayalethu village had about 71 active smallholder
farmers; out of these farmers 34 were interviewed. Guquka village had 67 and 23 were
interviewed. Krwakrwa village had 100 and 63 were interviewed. Therefore, the sample size
(actual number of respondents) consisted of 120 smallholder farmers practicing agriculture.
Table 4.1: Number of sampled respondents for each study site
Study sites Population Number of actual respondents
Khayalethu village 71 34
Guquka village 67 23
Krwakrwa village 100 63
Total 238 120
Source: Survey data (2013)
After a sample size was gathered data was collected from the respondents using a method
described below.
4.6 Data collection method
Data was collected from the individuals or respondents who were sampled by using interviewer-
administered semi-structured questionnaires. A questionnaire contained written questions that
smallholder farmers responded to directly with the aid of an interviewer. This method of data
collection is much quicker than formal interviews and it is time saving. The interviewer read
questions to respondents and recorded their answers on the questionnaire. The other advantage
of this data collection method is that an interviewer was in a position to probe for more
information and reduces the instances of misinterpretation or misunderstandings of words or
questions by respondents as noted by Bless et al. (2011). The questionnaire comprised of closed
and open ended questions. Most of the questions were structured as closed ended to extract as
much information as possible from the respondents without taking too much of their time. From
the data collected from the interviews, it was deduced that there were smallholder farmers who
were practicing IRWH technology and some who were not. The following Table 4.2 is going to
present the summary of the data collected, data source and how it was analysed against each

56
objective. Data analysis employed in this study will be further discussed later in Section 4.10.
Table 4.2: Summary of data collected, sources and data analysis
Objectives Data collected Data source Data analysis
To assess the level
of adoption of
IRWH technology
by smallholder
farmers in
Krwakrwa,
Khayalethu and
Guquka villages in
the EC
- Number of households
participated during the
introduction phase
- Number of households
currently practicing IRWH
technology
-Secondary data from
ARC
-Primary data from
smallholder farmers in
the study areas
-Descriptive
analysis
(mean,
frequency and
percentages)
To determine socio-
economic factors
influencing the
adoption of IRWH
technology by
smallholder farmers
in the study areas in
the EC.
- Demographic information
- Farm income
- Household income
- Land size
- Access to hired labour
- Access to credit
- Access to extension
services
- Access to market
- Access to information
- Livestock ownership
- Distance to other water
sources
-Farmers’ perception
towards the IRWH
technology
-Primary data from the
smallholder farmers in
the study areas
- Secondary data from
journals, books, internet
sources and government
documents
-Binary
logistic
regression
model
To determine
whether adopters of
IRWH technology
- Food security status in the
study areas
-The same factors that
-Primary data from the
smallholder farmers in
the study areas
-HDDS as a
measure of
food security

57
are more food
secure than non-
adopters in the
study areas in the
EC
affect the adoption of
IRWH technology were
studied in relation to the
household food security
status in the study areas
-Secondary data from
journals, books, internet
and government
documents
status
-Binary
logistic
regression
model
Source: Survey data (2013)
A brief literature review of the data analysis methods employed in similar studies is given in the
next section.
4.7 Methods of analysing factors influencing adoption of the agricultural technologies and
household food security used in related studies
The models explained in this section are used to determine factors that influence adoption of the
agricultural technologies and household food security. This is due to variables that were used
(dependent and independent variables). There are many models but binary logistic and binary
probit regression models will be discussed.
4.7.1 Binary logistic regression model (Logit model)
Binary logistic regression model is a popular statistical technique in which the probability of a
dichotomous outcome (such as adoption or non-adoption) is related to a set of explanatory
variables and will be explained more in Section 4.10.1.1. It has been widely applied in adoption
studies (He et al., 2007). For example, Badisa (2011) used it when analysing the socio-
economic factors determining IRWH technology adoption for cropland productivity in the
Lambani village at Limpopo Province.
The main objective was to investigate the extent and nature of the adoption of IRWH
technology by households. The simple random technique was used to select the sample size of
70 households out of a total of 1398 households in the area. The population was stratified into
two groups; those households who have adopted the IRWH technology and those who have not.
The first stratum i.e. the adopter group had 405 households, from which 35 households were
randomly selected, whilst the non-adopter stratum had 993 households, from which 35
households were selected. The list of households engaged in the IRWH technology was

58
obtained with the assistance of the local extension officer. The heads of the selected households
were interviewed using a structured and semi-structured questionnaire. The questionnaires
included both open-ended and closed questions.
The statistical package for social sciences (SPSS) for Windows was used to analyse data.
Descriptive statistics (means, frequencies and standard deviations) were calculated. The results
were presented using percentage, frequency, tabulation and graphs. The results indicated that
five out of ten variables were significant in explaining farmers’ adoption decision. Land size,
access to financial service, access to information and contact with extension officers were some
of the variables that had a positive significance on the adoption of IRWH technology, while
hired labour had a significantly negative correlation with adoption. Variables such as household
size, level of education, age of the household, level of income and the main water source did not
influence adoption of the technology.
Shikur and Beshah (2012) also used the binary logistic regression model when identifying
socio-economic, physical, psychological and institutional constraints and opportunities that
could determine the adoption of RWH technologies. The systematic sampling procedure was
used in this study to select the respondents. At the first stage, out of eight districts one district
was selected purposively due its better adoption rate of RWH technologies with respect to other
districts. In the second stage, out of the total of 25 sub-districts four sub-districts were selected
purposively as RWH promotion started earlier than other sub-districts, and the number of RWH
technologies users was relatively higher in these sub-districts. At the third stage, to determine
the sample households to be selected from each sample sub-district, the sampling frame of each
stratum, that is, adopters and non-adopters, was developed. Structured interview schedule was
used to generate primary data from 180 farmers.
Data was analysed using SPSS version 16 and presented quantitatively using different statistical
methods such as percentage, frequency, tabulation, chi-square test (for dummy/discrete
variables) and (t-test for continuous variables). The description was made using mean,
minimum as well as maximum values, percentage and standard deviations. Out of 12
explanatory variables used, 10 variables were found to be significant in affecting the adoption
of RWH technologies. These were labour availability in man equivalent, indigenous water

59
harvesting experience of the household, farm size of the household head, total tropical livestock
unit owned, sex of the household head, off-farm income of the household head, training in areas
of RWH, perception of farmers towards security of land ownership and extension service in
areas of RWH while distance to market from residence negatively influenced adoption of RWH
technologies.
4.7.2 Binary probit regression model (Probit model)
Murgor et al. (2013) have argued that the probit model yields the same results as the logit model
whereas Kuwornu et al. (2013) are of the view that the logit model has better interpretation than
the probit model. The dependent variable has also two possible outcomes, 1 or 0. The model is
as follows:
Pr (Yi = 1) = F (Xi β)
Where, Yi = Food security status (1 or 0). In the case of adoption Yi = adoption of IRWH / non-
adoption IRWH (1 or 0).
Xi = Independent variables
β = Estimated parameters
The probit model has been used in the study conducted by Sithole et al. (2014) to identify
factors influencing farmers’ participation in smallholder irrigation schemes: The case of
Ntfonjeni Rural Development Area in Swaziland. A multiple stage sampling procedure was
used to select 96 households in Ntfonjeni Rural Development Area. Households residing close
to the irrigation schemes were sampled comprising of 48 households who are participants and
48 non-participating households. A semi-structured questionnaire was used to collect data from
selected participants and non-participants on a one to one interview.
SPSS version 21 was used to analyse data. Descriptive statistics (means and standard
deviations) were calculated. The results were presented using tabulation. The estimation result
of the probit model indicated that age, occupation of household head, farm size and access to
credit were positively significant while distance to the scheme and membership in other groups
negatively influenced households’ decision to participate in smallholder irrigation schemes.

60
Marital status, gender, education level, household size, extension, market access, non-farm
income and livestock ownership were found not to be significant.
From these previous studies discussed above, this study is going to adapt binary logistic
regression model and the reasons will be discussed in Section 4.10.1.
Now that methods of analysing factors influencing the adoption of the agricultural technologies
and household food security used in related studies have been discussed, the following section
outlines food security measures used in related studies.
4.8 Food security measures used in related studies
According to Smith and Ali (2007) food security is the ability of households to access
sufficient, safe and culturally suitable food to meet dietary needs in order to lead a healthy and
productive life. To assess if the household is food secure or not, different measurements are
used. Bickel et al. (2000) stated that, the full range of food insecurity and hunger cannot be
captured by any single indicator. Instead, a household level of food insecurity or hunger can be
determined by obtaining information on a variety of specific conditions, experiences and
behaviors that serve as indicators of the varying degrees of severity of the condition. Food
security measurements that are discussed in this section are household caloric acquisition,
coping strategy and dietary diversity score.
4.8.1 Household Caloric Acquisition (HCA)
Household Caloric Acquisition is the number of calories, or nutrients, available for consumption
by household members over a defined period of time (Hoddinott, 1999). The principal person
responsible for preparing meals is asked how much food she/he prepared over a period of time
(Smith and Ali, 2007). After accounting for processing, this is turned into a measure of the
calories available for consumption by the household. The recall period is 7 or14 days.
According to FAO (2007) to convert data into calories, all quantities must be converted into a
common unit such as a kilogram and after that, they are converted into edible portions by
adjusting for processing; and lastly, convert these quantities into kilograms using the standard
caloric conversions. This measure produces a crude estimate of the number of calories available

61
for consumption in the household. However, this method generates a large quantity of
numerical data that needs to be carefully checked both in the field and during data entry. It does
not capture accurately any food eaten outside of the household (Hoddinott, 1999; Hlanganise,
2010).
4.8.2 Coping strategy index (CSI)
The coping strategy index is based on how households adapt when they cannot access enough
food (Maxwell and Caldwell, 2008). Maxwell and Caldwell (2008) further highlighted that, the
person who prepares and serves meals within the household is asked a series of questions
regarding how households are responding to food shortages. According to Gillespie (2006) CSI
was developed by the caregivers (CARE) and field tested by both CARE and the World Food
Program (WFP). Eight African countries have used CSI to monitor household food security in
emergencies and to assess the impact of various food aid interventions.
Collected data is weighted according to the frequency and perceived severity of behavior.
Weighted scores are combined into an index that reflects current and perceived future food
security status (Kirkland et al., 2011). Comparison of scores and averages provides a summary
of overall household food security. Thus, the higher the sum, the more food insecure is the
household (Gillespie, 2006).With CSI, households might perceive that they are more likely to
receive assistance when they report greater use of these coping strategies (Hoddinott, 1999).
4.8.3 Dietary Diversity Score
Dietary diversity is measured by using a simple count of food or food groups consumed over a
reference period, ranging from 1 to 15 days (Hoddinott and Yohannes, 2002; FAO, 2007;
Swindale and Bilinsky, 2006; FAO, 2011). Swindale and Bilinsky (2006) mentioned that
dietary diversity questionnaire (Refer to Appendix 2) can be used at the household and
individual level, but calculation of the score is slightly different in each case. FAO (2011)
further mentioned that, individual dietary diversity scores (IDDS) aim at reflecting nutrient
adequacy. Studies in different age groups have shown that an increase in IDDS is related to
increased nutrient adequacy of the diet. It was also highlighted by Hoddinott and Yohannes
(2002) that, household dietary diversity score (HDDS) is meant to reflect the economic ability
of a household to access a variety of foods and its advantage is to reflect a quality of diet better

62
(Swindale and Bilinsky, 2006). HDDS looks at all people living under the same roof who share
meals while IDDS looks at the food eaten by the individual. According to FAO (2008) for
HDDS, foods eaten by any member of the household should be included and exclude foods
purchased and eaten outside the home. While for IDDS, all foods eaten inside or outside the
home by the individual, irrespective of where they were prepared is included. For HDDS, there
are 15 groups of food included (cereals, vitamin A rich vegetables and tubers, white tubers and
roots, dark green leafy vegetables, other vegetables, vitamin A rich fruits, other fruits, meat,
eggs, fish and other seafood, legumes, nuts and seeds, milk and milk products, oils and fats,
spices, condiments and beverages) and for IDDS there are 9 groups (starchy vegetables, dark
green leafy vegetables, other vitamin A rich fruits and vegetables, other fruits and vegetables,
organ meat, meat and fish, eggs, legumes, nuts and seeds, milk and milk products) (Swindale
and Bilinsky, 2006).
Both FAO (2007) and FAO (2011) mentioned that if the study is concerned with nutrient
adequacy of diet, information should be collected at individual level. Also, if on the regular
basis meals/snacks are purchased and consumed by one or more family members outside the
home. HDDS cannot be used because it is not possible to capture accurately meals/snacks
purchased and eaten outside the home at household level.
When FAO (2007) conducted a study in Mozambique to measure household food security,
HDDS was used to assess the household food security status. It was done to differentiate food
secure households from those which were food insecure. Respondents were asked to recall all
foods consumed by any household member in the previous 24 hours. Then, the score was a
simple sum of food groups consumed by any household member from the total of fifteen.
Households were classified into terciles: low dietary diversity = 3 or fewer food groups;
medium = 4; and high = 5 or more. A dichotomous indicator for poor dietary diversity (< 4 food
groups) was also created.
For the context of this study, HDDS was adopted. This food security measure was chosen in
order to distinguish households which were food secure from those that were food insecure. It
was also chosen because the number of different food groups consumed are calculated and
summed, rather than the number of different foods consumed, to better reflect a quality diet.
Knowing what households consume, for example, an average of four different food groups

63
implies that their diets offer some diversity in both macro-and micro-nutrients. This is a more
meaningful indicator than knowing that households consume four different foods, which might
all be cereals (FAO, 2007).
Information on household food consumption was collected using the previous 24-hours as a
reference period (24-hour recall). The reason for this was that longer reference periods result in
less accurate information due to imperfect recall (FAO, 2011). If the previous 24 hour period
was for a special occasion such as a funeral or feast or if most of the household members (e.g.6
out of 10 members) were absent, another day was selected for an interview. This helped to
prevent bias in the results. The persons who were responsible for the preparation of meals were
the key respondents.
This study was based on the theoretical framework which was discussed in the following
section.
4.9 Theoretical and conceptual frameworks
From a theoretical perspective, the decision whether or not to adopt the IRWH technique is
based on profit maximisation using scarce resources at the lowest cost (Senkondo et al., 1998).
This study borrows such a concept and the decision to adopt the IRWH technology is driven by
how much profit smallholder farmers will get from using the technique by using their limited
land and water. However smallholder farmers may have non-economic objectives and it may be
reasonable to assume that the objective of some famers is utility maximisation. For this study,
the utility maximisation theory was adapted from Gebregziabher et al. (2013). According to the
theory, a new technology will be adopted by a farmer if the utility obtained from the new
technology exceeds that of the former one (Gebregziabher et al., 2013).
The underlying utility function depends on household specific attributes X (e.g. age of the
household head, gender of the household head, education, access to credit, etc) and a
disturbance term having a zero mean:
Ui1 (X) = β1Xi + εi1 for adoption……………………….1
Ui0 (X) = β0Xi + εi0 for non- adoption…………………2

64
As utility is random the ith smallholder farmer will select the alternative “adoption” if and only
if Ui1 > Ui0. Thus, for the smallholder farmer i, the probability of adoption is given by:
P (1) = P (Ui1 > Ui0)
P (1) = P (β1Xi + εi1 > β0Xi + εi0 )
P (1) = P (εi1 - εi0 < β1Xi - β0Xi )
P (1) = P (εi < βXi )
P (1) = Φ (βXi)
Where, Ui1 = The utility a farmer obtains from the technology
Ui0 = No utility obtained by a farmer from the technology
P(1) = Probability of adopting IRWH technology
β0... β1= Estimated parameters
Xi = Independent variables
Φ = is the cumulative distribution function of the standard normal distribution.
εi = Disturbance term
Based on the above theoretical framework, the conceptual framework of this study was
formulated and presented below.
From Figure 4.1, adoption of the IRWH technology is influenced by social, economic,
institutional factors, advice from government and other stakeholders as well as from the
farmer’s perception that production will be increased through IRWH technology. If a
smallholder farmer decides to adopt the technology he/she may be more food secure because the
farmer will be able to sell surplus and afford to buy more nutritious food and obtain health care.
Also food will be accessible all year round. If a smallholder farmer decides not to adopt the
technology, the opposite is likely to happen.

65
Figure 4.1: Conceptual framework
The next section gives an overview of how data collected to establish whether or not
smallholder farmers adopted the IRWH technology was analysed.
4.10 Data analysis
This section describes how the major objectives of the study were answered; whose aim was to
determine the socio-economic factors influencing the adoption of the IRWH technology in
enhancing household food security by smallholder farmers. According to Bless et al. (2011)
data analysis allows the researcher to generalise the findings from the sample used in the
research to the larger population in which the researcher is interested. The collected survey data
was analysed using SPSS version 21. Results were presented using graphs, pie charts and tables
Social factors
Age
Gender
Education
Household size
Economic factors
Farm income
Household income
Land size
Land tenure security
Institutional factors
Access to hired labour
Access to market
Access to credit
Access to extension services
Access to information
Access to other water
sources
Advice from
government and
other stakeholders
Decision to adopt IRWH or not Farmers’ perception
towards technology
Perception of increased
production
Adopters Non-adopters
Food secure Food insecure

66
(including cross-tables). To assess the level of adoption of the IRWH technology by smallholder
farmers, descriptive analysis (mean, frequency and percentages) was used. The binary logistic
regression model was used to analyse the socio-economic factors which influence the adoption
of IRWH technology. To determine whether adopters of IRWH technology are more food
secure than non-adopters in the study areas in the EC, firstly, HDDS as used by FAO (2007)
was adopted as a measure of food security (as explained in Section 4.8.3). Then, socio-
economic factors influencing household food security were analysed using the binary logistic
regression model (as explained in the next section).
4.10.1 Binary logistic regression model (Logit model)
According to Gujarati (2002) the binary logistic model is appropriate when the response takes
one of only two possible values representing success and failure, or more generally the presence
or absence of an attribute of interest. This model is used when the dependent variable is not
continuous but instead has only two possible outcomes, 1 or 0 (Hill et al., 2001). In this
research, that is adoption of IRWH technology or not adopting.
The adopters were those smallholder farmers who continued to practice the technology after the
introduction period was over. The non-adopters were those smallholder farmers who only
practiced the technology during the introduction period and those who never practiced it. This
model is based on the probability that Y equals to one (P=P1). The value of Y is assumed to
depend on the value of X1…….X16.
The logit model representing the relationship of Y and X is given by:
ln (ODDS) = ln ( /1 – ) = βo + β1X1 + …+ βnXn + U………………….1
Where β0 = intercept
β1….. βn = Estimated parameters
X1…Xn = Independent variables
U = Error term
In equation 1, represents the probability of adopting IRWH and (1– ) represents the

67
probability of not adopting. Where is the predicted probability of the event which is coded
with 1 (adopt IRWH technique) rather than with 0 (do not adopt IRWH technique), is the
predicted probability of the other decision, and X represents predictor variables.
The specific logistic regression model is given as follows:
ADOP/ NADOP= β0 + β1 GEN + β2 AGE + β3EDUL + β4HHS+ β5ACHLBR + β6HHINCO +
β7FAMINCO + β8LNDTNRS + β9LANDSZ + β10ACMKT + β11ACCREDT + β12ACES +
β13ACINFO+ β14 LIVSTOWN +β15DWRTSOURC + β16FPTRWH +U.........................(2)
Independent variables were chosen based on the theory, assumptions and evidence from past
studies. For the third analysis when determining factors affecting household food security the
same logistic regression model and potential independent variables were used but the dependent
variable was food security status (Food secure =1 or food insecure = 0). Also, the adoption of
IRWH technology becomes an independent variable as presented in Table 4.4.
For this study, the binary logistic regression model was adapted because it is an extremely
flexible and easily used function. It leads itself to a meaningful interpretation as stated by
Gujarati (2002). The disadvantage of this model is that, it does not handle the missing values of
continuous variables unless they are divided into classes (Hill et al., 2001).
The description of variables that were used in the binary logistic regression model for the
incidence of adoption, how they were measured and their expected outcomes are presented in
Table 4.3 below.

68
Table 4.3: Variables that were used in the binary logistic regression model for incidence of
adoption
Variable name Variable description Type of
measurement
Expected
sign
Dependent variable
ADOP Adopters of IRWH technology = 1
NADOP Non adopters of IRWH technology = 0
Independent variables
GEN Gender of the household heads Dummy +/-
AGE Age of the household heads Categorical -
EDUL Educational level of the household heads Categorical +
HHS Household size Continuous +/-
ACLBR Access to hired labour Dummy +
HHINCO Household income Categorical +
FAMINCO Farm income Categorical +
LNDTNRS Land tenure security Dummy +
LNDSZ Land size Continuous +/-
ACMKT Access to market Dummy +
ACCREDT Access to credit Dummy -
ACES Access to extension services Dummy +
ACINFO Access to information Dummy +
LIVSTOWN Livestock ownership Continuous +
DWRTSOURC Distance to other water sources Continuous -
FPIRWH Farmers’ perception towards the IRWH
technology
Dummy +
The variables presented in Table 4.3 and their priori expectations are discussed in Section
4.10.1.1.
Factors which influence the household food security were also analysed using the binary
logistic regression model. Table 4.4 shows variables used in the regression model and their
expected outcome.

69
Table 4.4: Variables that were used in the binary logistic regression model for incidence of
household food security status
Variable name Variable description Type of
measurement
Expected
sign
Dependent variable
FS Food secure = 1
FI Food insecure = 0
Independent variables
ADOPIRWH Adoption of the IRWH technology Dummy +
GEN Gender of the household heads Dummy +/-
AGE Age of the household heads Categorical -
EDUL Educational level of the household
heads
Categorical +
HHS Household size Continuous +/-
ACLBR Access to hired labour Dummy +
HHINCO Household income Categorical +
FAMINCO Farm income Categorical +
LNDTNRS Land tenure security Dummy +
LNDSZ Land size Continuous +/-
ACMKT Access to market Dummy +
ACCREDT Access to credit Dummy -
ACES Access to extension services Dummy +
ACINFO Access to information Dummy +
LIVSTOWN Livestock ownership Continuous +
DWRTSOURC Distance to other water sources Continuous -
FPIRWH Farmers’ perception towards the IRWH
technology
Dummy +
The variables presented in Table 4.4 and their priori expectations are discussed below.
4.10.1.1 Explanatory variables and priori expectations
This section explains the variables and the expected outcome direction based on literature. The

70
explanatory variables explained here are thought to have an influence on the adoption of IRWH
technology and on household food security status. These include households’ demographic
variables and socio-economic variables.
4.10.1.1.1 Adoption of the IRWH technology
This variable was measured by asking households if they currently practice IRWH technology
and if the household practiced the technology it was represented by “1” and “0” if otherwise.
Botha et al. (2013) have observed that the adoption of IRWH technology enhances food and
nutritional security. For this study, it was hypothesised that the adoption of this technology
positively influences the likelihood of being food secure.
4.10.1.1.2 Gender of the household heads
Gender is a dummy variable that indexes the sex of the farmer; it has a value of 1 for male and 0
for female. Both males and females are likely to play different roles in technology adoption,
depending on the nature of the technology (He et al., 2007). IRWH technology requires a lot of
time and labour and also has a complex structure as noted by Moyo and Nyimo (2006).
Therefore, women are not likely to adopt this technology as compared to men. For these
reasons, there is a likelihood that women headed households will be less food secure. In this
study, it was hypothesised that gender of the household head has a positive or negative
influence on the adoption of the IRWH technology and household food security.
4.10.1.1.3 Age of the household heads
In this study age measures the years of household head. Younger farmers are easily attracted by
new technologies and are risk loving because they need extra cash while older farmers are more
conservative and easily discouraged to adopt new technologies, especially if labour demand is
very high (Badisa, 2011). Hence, it may happen that younger people will be more food secure
than older people. Therefore, it was hypothesised that the age of the household head negatively
influences adoption of the IRWH technology and the household food security status.
4.10.1.1.4 Educational level of the household heads
Educational level refers to the total number years into formal education (Mensah et al., 2013).

71
Education equips individuals with the necessary knowledge of how to make a living (Kai,
2011). Smallholder farmers with formal education are able to process and use information
relevant towards the adoption of new technologies; hence possibilities of being food secure
(Murgor et al., 2013). Less educated farmers are less likely to adopt new practices than
smallholder farmers with higher levels of educational achievement (Kai, 2011). Therefore, it
was expected that the level of education has a positive impact on adoption of the IRWH
technology in relation to household food security status.
4.10.1.1.5 Household size
This study considered household size as the number of individuals who reside in the
respondents’ household and related with labour supply. Due to the high labour demands of
IRWH technology, the larger the household size in terms of adults the greater the availability of
labour, which possibly will enhance adoption of the IRWH technology and a likelihood of being
food secure (Kalineza et al., 2008). On the other hand, larger household size with more children
is generally associated with a less labour force available (He et al. 2007). According to
Babatunde et al. (2007) larger households may be more likely to be vulnerable to food
insecurity. In this study, it was hypothesised that household size has a positive or negative
influence on the adoption of IRWH technology and household food security.
4.10.1.1.6 Access to hired labour
The access to hired labour variable was treated as a dummy variable, with 1 representing a
farmer having accessed hired labour and 0 otherwise. According to Mensah et al. (2013) hired
labour may influence the ability of the household to produce. Households with a higher labour
supply may be able to devote more labour to the production of crops. These households may be
able to produce more, making adoption of IRWH technology easier and also the probability of
being food secure. This variable is expected to have a positive impact on the adoption of IRWH
technology in enhancing household food security status.
4.10.1.1.7 Household income
The level of household income was measured by capturing the total household income per
month. Additional income earned through participation in non-farm activities improves farmers'

72
financial capacity and increases the ability to adopt new technology; hence, possibilities of
being food secure (von Braun, 2007). A positive relationship should be expected between
household income and the level of the IRWH technology adoption in relation to household food
security.
4.10.1.1.8 Farm income
In this study farm income was measured by capturing the total income per month smallholder
farmers received after they had sold their produce. According to Baiyegunhi (2014) higher farm
income received gives an incentive to adopt RWH technologies and a probability of being food
secure. Therefore, it was expected that the farm income has a positive impact on the adoption of
IRWH technology and household food security status.
4.10.1.1.9 Land tenure security
Land tenure security was treated as a dummy variable, with 1 implying that a farmer has secure
tenure to land and 0 implying otherwise. Smallholder farmers with secure land ownership are
more likely to adopt the technology and a possibility of being food secure than smallholder
farmers with insecure land ownership (He et al., 2007). In this study it was expected that land
tenure security will have a positive influence on the adoption of IRWH technology and
household food security.
4.10.1.1.10 Land size
Land size was measured by the actual number of hectares of the land used for planting. Land
size may positively or negatively influence the adoption of IRWH technology and household
food security status. This might happen because smallholder farmers with small farm sizes are
not likely to adopt the technique and may have a chance of being food insecure. Conversely,
that small farm size can be used productively such that households could have a likelihood of
being food secure, thus promote adoption of the IRWH technology (Woyessa et al., 2007).
4.10.1.1.11 Access to market
Access to market was measured by the actual distance in kilometres to the nearest input and
output markets. According to Gebregziabher (2014) the closer a household is to the input and

73
output markets, the greater the likelihood that they will adopt IRWH technology. This may
result in the probability of being food secure. In this study it was hypothesised that there will be
a positive relationship between access to market and adoption of IRWH technology in relation
to household food security. The variable was treated as a dummy variable where 1 implied a
farmer having accessed the market and 0 otherwise.
4.10.1.1.12 Access to credit
Lack of access to credit is one of the major stumbling blocks for smallholder farmers in the
developing world (Chisasa and Makina, 2012). Therefore, this may prevent them from having
the necessary capital for investing in new technologies (Kalineza et al., 2008). It was expected
that access to credit will negatively influence the adoption of IRWH technology and household
food security. The variable was treated as a dummy variable where 1 implied a farmer having
accessed credit and 0 otherwise.
4.10.1.1.13 Access to extension services and information
The access to extension services and information variables were treated as dummy variables,
with 1 representing a farmer having accessed extension services like governmental assistance,
training workshops as well as information and 0 otherwise. According to Ngwenya (2013)
extension officers are the ones who disseminate information about agricultural practices.
Smallholder farmers who have a frequent contact with them will have an easy access to
information and training; this will upgrade their knowledge on technology. This may result in
the higher adoption of IRWH technology and a possibility of being food secure. For this study,
access to extension services and information are expected to positively influence adoption of the
technology and household food security status.
4.10.1.1.14 Livestock ownership
Livestock ownership was used in this study as a proxy for wealth. The number of livestock was
represented as a continuous variable and represents the number of livestock owned by the
household. According to Shikur and Beshah (2012) livestock is a source of income which can
be liquidated into cash by the smallholder farmers to enable them to adopt IRWH technology,

74
such that households may have a chance of being food secure. This will positively influence the
adoption of IRWH technology and household food security status.
4.10.1.1.15 Distance to other water sources
Different types of other water sources include river, stream, tap water and borehole in this
research. This variable was measured by the total walking distance in minutes to other water
sources. The lesser the walking distance to other water sources, the lesser the likelihood of
adopting IRWH technology and this may lead to food insecurity (Murgor et al., 2013). A
negative relationship is expected between distance to other water sources and the adoption of
IRWH technology as well as household food security.
4.10.1.1.16 Farmers’ perception towards the IRWH technology
Smallholder farmers’ perception towards technology characteristics were said to condition the
adoption of that particular technology (Shikur and Beshah, 2012). If smallholder farmers have a
positive perception towards the IRWH technology, adoption will be high as well as their
likelihood of being food secure (Baiyegunhi, 2014). In this study, famers’ perception towards
the IRWH technology is expected to positively influence adoption of the technique and
household food security. This variable was treated as a dummy variable, with 1 representing
positive feelings towards the IRWH technology and 0 otherwise.
4.11 Summary
This chapter outlined the theoretical and conceptual frameworks for the study. Data was
collected from three villages in Nkonkobe Municipality in the EC Province from a sample size
of 120 smallholder farmers practicing agriculture. The Availability (accidental) and snowball
sampling which are non-probability sampling procedures were used to select respondents for
interviews. A semi-structured questionnaire was administered to the respondents through face-
to-face interviews. The advantages that are associated with face-to-face interviews have been
highlighted within the chapter. Also highlighted are previous studies on the adoption of
agricultural technologies and household food security as well as food security measures used in
related studies. Hypothesis of the study were also highlighted. HDDS was employed to identify
which households were food secure or food insecure because it better reflects a quality diet. The

75
binary logistic regression model was used to analyse factors influencing the adoption of IRWH
technology and also used for those influencing household food security. The same explanatory
variables that were used for the incidence of adoption were also used for household food
security where adoption was used as one of the independent variable. This model was used
because of the nature of the dependent variable (adoption of IRWH technology/food security),
which is dichotomous and for its simplicity.

76
CHAPTER 5
RESULTS OF THE DESCRIPTIVE ANALYSIS AND DISCUSSION
5.0 Introduction
In this chapter the results and discussions of the descriptive analysis are presented. The first
section begins with an analysis and discussion of the overall adoption status of IRWH
technology followed by household food security status in the study areas. After that,
households’ demographic and socio-economic characteristics that influence the adoption of
IRWH technology and household food security are also analysed. Full elaboration upon the
characteristics was done and literature was also consulted. Within the chapter, descriptive
statistics such as mean values, frequencies, percentages are presented in the form of tables,
cross-tables, pie charts and bar graphs.
5.1 Adoption status in the study areas
From the study areas it was found that 79% of the households did not adopt the IRWH
technology while 21% adopted the technology as shown in Table 5.1. This implies that the
adoption status of this technology is low in Krwakrwa, Khayalethu and Guquka villages.
Table 5.1: Adoption status in the study areas
Frequency Percentage
Non-adopters of IRWH technology 95 79
Adopters of IRWH technology 25 21
Total 120 100
Source: Survey data (2013)
The study also linked the relationship between adoption of the IRWH technology and household
food security, therefore the household food security status in the study areas was measured,
analysed and discussed in the next section.
5.2 Household food security status in the study areas
To measure household food security status in the study areas HDDS was adapted as discussed
in Section 4.8.3. The questionnaire on the food groups is presented in Appendix 1 and the

77
respondents were expected to answer Yes or No to the questions posed. The dietary diversity
scores were obtained from a simple count of foods groups (as listed in the questionnaire,
Appendix 1). The number of food groups was calculated by summing the number of food
groups consumed in the household in 24 hours as shown in Appendix 2. The value of HDDS
variable ranged from 0 to 15.
Since there were no established cut-off points in terms of the number of food groups to indicate
adequate or inadequate dietary diversity for the HDDS, the average HDDS indicator was
calculated for the sample population as shown in Appendix 2. An average of 5.01 was obtained
from the calculation (refer to Appendix 2). A household was food secure if the HDDS score was
above 5 and food insecure if the HDDS score was below 5.
Therefore, it was found that 70.8% households were food insecure and 29.2% were food secure
in the study areas as shown in Table 5.2. This implies that the majority of the households have a
low dietary diversity, hence reduced household food access.
Table 5.2: Household food security status in the study areas
Frequency Percentage
Food insecure 85 70.8
Food secure 35 29.2
Total 120 100
Source: Survey data (2013)
In order to know who is food secure or food insecure between the adopters of IRWH technology
and non-adopters in the study areas, adoption status was described in relation to household food
security status in the next section.
5.3 Adoption and household food security status in the study areas
Table 5.3 indicates that more non-adopters of IRWH technology (86%) were food insecure
while 76.5% of adopters were food secure in the study areas. It shows that there are high
instances of food insecurity in the study areas hence more households should adopt IRWH
technology to improve their food security status.

78
Table 5.3: Adoption and household food security status in the study areas
Adoption status Food security status
Food insecure Food secure
Frequency Percentage Frequency Percentage
Non-adopters of IRWH 30 86 65 23.5
Adopters of IRWH 5 14 20 76.5
Total 35 100 85 100
Source: Survey data (2013)
The following section gives a description of demographic and socio-economic characteristics in
relation to the adoption of IRWH technology and household food security status. Demographic
characteristics were analysed in the next section.
5.4.1 Demographic characteristics of the household heads in the study areas
Demographic characteristics such as gender, age, educational level and household size are
discussed in this section. Demographic characteristics of households play a pivotal role in
determining the behaviour of smallholder farmers (Woyessa et al., 2007). It then follows that
household demographic attributes are relevant in analysing factors influencing the adoption of
IRWH technology and household food security. Gender of the household heads was the first to
be described.
5.4.1.1 Gender of the household heads
Figure 5.1 shows the gender distribution of the household heads that were drawn from the
sample size of 120. From the data collected, the majority (64.2%) of households were female
headed while only 35.8% were male headed. This suggests that females are more dominant in
agriculture than men in the study areas as shown by the results. This may be because many men
migrate to urban areas to search for better employment opportunities. These results are
consistent with Kehler’s views (2001) to the effect that, in South African rural areas, women
play a vital role in agriculture as food producers, rather than men.

79
Figure 5.1: Gender distribution of the household heads
Source: Survey data (2013)
Figure 5.2 shows that there was a larger proportion of female non-adopters (72%) as compared
to 28% male non-adopters of IRWH technology. The proportion of adopting IRWH technique is
high in males (60%) as compared to females (40%). In conclusion, there were more male
adopters (60%) and 55% were food secure than female adopters (40%) where their food
insecurity status was 74.3%.
Figure 5.2: Adoption, household food security status and gender distribution
Source: Survey data (2013)
The reasons given by the non-adopters were that this technology requires a lot of time and is
resource demanding. This is in line with the findings of Murgor et al. (2013) which revealed
that female headed households are often more resource constrained particularly with regard to
labour and cash than their counterpart male headed households. In addition, Mensah et al.
(2013) have stated that men have more access and control over vital production resources than
35.8%
64.2%
Male
Female
28
72
60
40
25.7
74.3
55
45
0
10
20
30
40
50
60
70
80
Male Female
Per
cen
tage
Non-adopters of IRWH
Adopters of IRWH
Food Insecure
Food secure

80
women due to many socio-cultural values and norms. This has led to the adoption of IRWH
technology by female headed household to be low and likely be food insecure.
The following section gives analysis of age distribution of the household heads in the study
areas.
5.4.1.2 Age distribution of the household heads
According to Muchara (2011) the household heads’ age is an important aspect because it shows
whether the household benefits from the experience of elderly people or has to base its
decisions on the risk taking attitude of younger farmers. Findings on the age distribution are
presented in Figure 5.3.
Figure 5.3: Age distribution of the household heads
Source: Survey data (2013)
The age distribution for household heads shown in Figure 5.3 was categorised into age groups
of 31-40 years, 41-50 years and 51 years and above. Results show that 72.5% fall under 51 and
above category, 41-50 and 31-40 years categories had the percentages of 15%, 12.5%
respectively. This shows that the majority of households in the study areas are headed by older
people.
As shown in Figure 5.4 in the study areas, it was found that the majority (78%) of non-adopters
of the technology falls under age category 51years and above, as a result there is a high
percentage (87%) of food insecurity among the group. Age category 41–50 years consists of
13.8% non-adopters and 8.2% fall under age category 31-40 years. About 55% that adopted the
12.5 15
72.5
0
10
20
30
40
50
60
70
80
31-40 years 41-50 years 51 and above
Per
cen
tage
Age in years

81
technology fall under age category of 41-50 years. Age category 51 and above years is
comprised of 26.3% adopters and 18.7% falls under age category 31-40 years. Age category 51
and above have more non-adopters and are food insecure than age category 41-50 years which
have more adopters and are food secure.
Figure 5.4: Adoption, household food security status and age distribution of the household head
Source: Survey data (2013)
The result implies that the elderly are less fit and therefore cannot carry out the tasks associated
with the implementation of the technology. This is supported by Murgor et al. (2013) who have
observed that elderly farmers are likely to be more risk averse and more resistant to change and
therefore be reluctant towards technologies. This has led to low rates of the adoption of the
IRWH technology because households in the study areas are headed by elderly people.
Educational level of the household heads was described in the next section.
5.4.1.3 Educational level of the household heads
According to He et al. (2007) people who have a higher educational level are able to interpret
information better. Illiteracy is one of the factors that limit economic, social, physical, technical
and educational development in less developed countries (Amha, 2006). In this study, the level
of education ranges from those who do not have any formal education to those who attained
tertiary education as shown in Figure 5.5 below.
8.2 13.8
78
18.7
55
26.3 7.3 5.7
87
17.6
63.5
18.9
0
10
20
30
40
50
60
70
80
90
100
31-40 years 41-50 years 51 and above
Pe
rce
nta
ge
Age in years
Non-adopters of IRWH
Adopters of IRWH
Food insecure
Food secure

82
Figure 5.5: Educational level of the household heads
Source: Survey data (2013)
The results in Figure 5.5 reveal that 54.2% of the sampled household heads have a primary
education while 24.2% have high school education. The figure also illustrates that 11.6% and
10% had no formal education and had tertiary education, respectively. This implies that the
literacy level amongst the sampled household heads is relatively low.
Figure 5.6 shows that more respondents who are non-adopters of the IRWH technology have a
primary level in terms of education (63.7%), followed by those who never went to school by
20.8%. Non-adopters respondents that have high school education are 10% and those who went
to tertiary level accounted for 5.5%. It was also found that 49% of adopters have attained high
school level, followed by those who have a primary level at 20.3%. A proportion of 16.7% of
the adopters have a tertiary education while 14% never went to school. The highest percentage
of non-adopters (63.7%) has a primary education and in this group there is a huge percentage of
food insecurity of 85.7% as compared to adopters (49%) who have high school education,
where food security is 45.9%. This relates to the literature which states that, the more the
educated the farmer is, the higher the chances of adopting IRWH technology and a likelihood of
being food secure (He et al., 2007). This is the case because smallholder farmers who have a
higher educational level are able to interpret information better than those with little education
(Babatunde et al., 2007).
Never went to school
Primary High school Tertiary
Percentage 11.6 54.2 24.2 10
0
10
20
30
40
50
60 P
erc
en
tage

83
Figure 5.6: Adoption, household food security status and educational level
Source: Survey data (2013)
The size of the households in the study areas was analysed below.
5.4.1.4 Household size
Kai (2011) indicated that a larger family size also means that an increased labour capacity is
available in the form of young, middle aged and elderly members. Labour accessibility in adult
equivalent increases the adoption of IRWH technology (Ahmed et al., 2013). Ngwenya (2013)
has outlined that a larger household size discourages the selling of farm produce because the
household needs to meet its consumption demand before a decision to sell surplus produce for
cash can be arrived at. Similarly, Badisa (2011) stated that household size can give an indication
of the extent of the pressure that could be exerted on the household resources. The results are
tabulated in Table 5.4 below.
Table 5.4: Household size distribution
Variable Adopters of
IRWH
technology
% ge of
household size
Non-adopters of
IRWH technology
% ge of
household
size
Average
household size
6 ----- 5.25 ----
Members 16
years
5.61 75 3.27 68
Members < 16
years
1.20 25 2.49 32
Source: Survey data (2013)
20.8
63.7
10 5.5 14
20.3
49
16.7
8.6
85.7
5.7 0
14.1
25.9
45.9
14.1
0
10
20
30
40
50
60
70
80
90
Never went to school
Primary High school Tertiary
Pe
rce
nta
ge
Education level
Non-adopters of IRWH
Adopters of IRWH
Food insecure
Food secure

84
In the study areas, the average households’ size for adopters was comparatively higher than for
the non-adopters. The mean household size of the adopters and non-adopters was approximately
6 and 5 persons respectively as shown in Table 5.4. This suggests that adoption of the IRWH
technology was associated with large household sizes also implying a larger supply of labour
for the adopters. Furthermore, on average, more children are residing in the households of non-
adopters (32%) compared to adopters’ households (25%). The survey results were within the
range of what has been found by other studies. For example, Badisa (2011) found an average
household size of 7 for adopters of IRWH technology and 6 for non-adopters.
The following section highlights socio-economic characteristics determining the adoption of
IRWH technology and household food security in the study areas.
5.4.2 Socio-economic characteristics influencing the adoption of IRWH technology and
household food security
This section focused on household socio-economic factors related to farming. These include
access to hired labour, household income, farm income, land security of tenure, land size, access
to credit, access to extension services and information, livestock ownership, distance to other
water sources and farmers’ perception towards IRWH technology. Understanding these factors
is useful in determining the influences they may have on the adoption of IRWH technology and
household food security. Access to hired labour is discussed in the following section.
5.4.2.1 Access to hired labour
Table 5.5 illustrates that only 37.5% of households hired labour while the rest did not hire
labour to help with farming activities.
Table 5.5: Access to hired labour distribution of the household heads
Access to hired labour Percentage
Yes No
37.5 62.5
Source: Survey data (2013)
It appears that the majority of households use family members for labour provision and it can be
assumed that this is attributed to the fact that they do not have money or compensation to pay

85
for hired labour. This result corroborates with the findings of White (2012) on a theoretical
framework for understanding factors that contribute to household adoption of rainwater
harvesting in South East Queensland. According to Yengoh et al. (2010) labour constraints
affect a farmer’s choice of the technology and can also constrain the adoption of a labour
demanding technology.
Figure 5.7 shows that 89.6% non-adopters of the IRWH technology had no access to hired
labour and 10.4 % had access. Adopters (55.6%) indicated that they had access to hired labour
while 44.4% had no access. The food insecurity was as high as 65.9 % to those who said they
did not hire labour. It can be concluded that the unavailability of hired labour gave the incentive
not to adopt the IRWH technology because this technique is labour intensive. These results are
in line with the study of Badisa (2011) in the Limpopo Province.
Figure 5.7: Adoption, household food security status and access to hired labour
Source: Survey data (2013)
Household income distribution in the study areas is given below.
5.4.2.2 Household income distribution of the household heads
Most rural households are highly dependent on social grants and wage incomes in addition to
own food production. This is also evidenced in the study of Amha (2006) where the researcher
indicated that agricultural production is not the only source of monetary income. For monetary
income, South African rural households mainly depend on sources including claims against the
0
10
20
30
40
50
60
70
80
90
Adopters of IRWH
Non- adopters of IRWH
Food secure Food insecure
44.4
89.6
54.3
65.9
55.6
10.4
45.7
34.1
Pe
rce
nta
ge
No
Yes
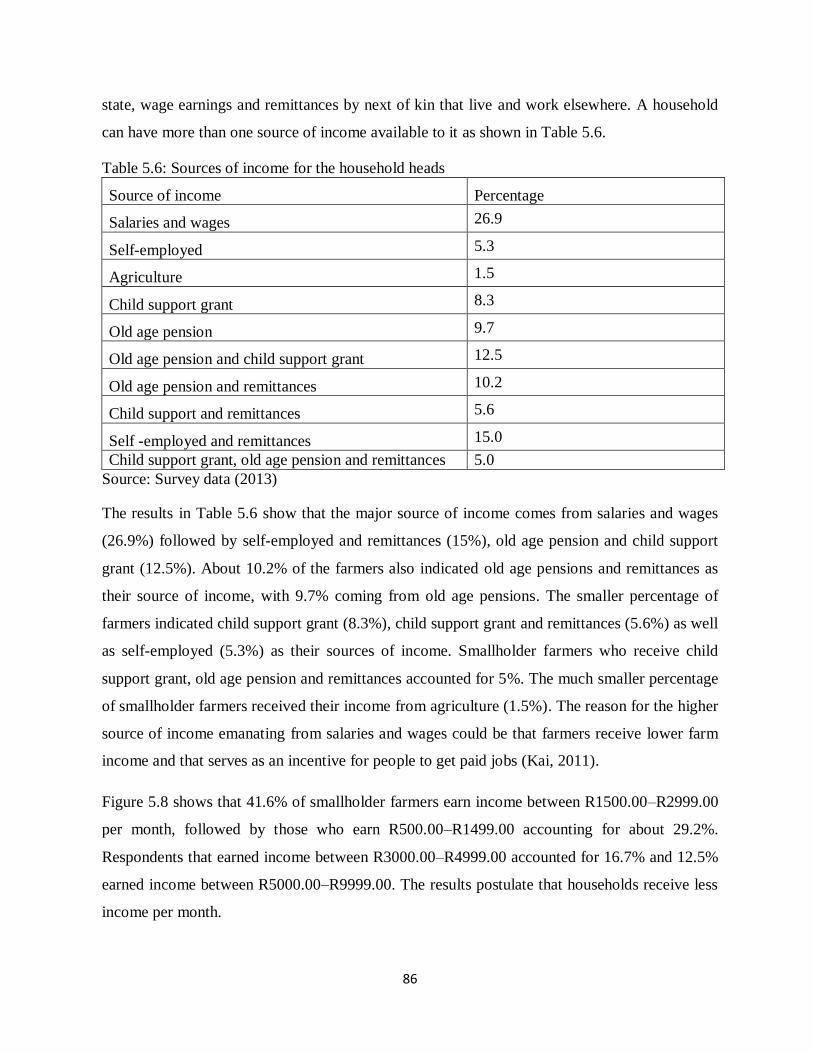
86
state, wage earnings and remittances by next of kin that live and work elsewhere. A household
can have more than one source of income available to it as shown in Table 5.6.
Table 5.6: Sources of income for the household heads
Source of income Percentage
Salaries and wages 26.9
Self-employed 5.3
Agriculture 1.5
Child support grant 8.3
Old age pension 9.7
Old age pension and child support grant 12.5
Old age pension and remittances 10.2
Child support and remittances 5.6
Self -employed and remittances 15.0
Child support grant, old age pension and remittances 5.0
Source: Survey data (2013)
The results in Table 5.6 show that the major source of income comes from salaries and wages
(26.9%) followed by self-employed and remittances (15%), old age pension and child support
grant (12.5%). About 10.2% of the farmers also indicated old age pensions and remittances as
their source of income, with 9.7% coming from old age pensions. The smaller percentage of
farmers indicated child support grant (8.3%), child support grant and remittances (5.6%) as well
as self-employed (5.3%) as their sources of income. Smallholder farmers who receive child
support grant, old age pension and remittances accounted for 5%. The much smaller percentage
of smallholder farmers received their income from agriculture (1.5%). The reason for the higher
source of income emanating from salaries and wages could be that farmers receive lower farm
income and that serves as an incentive for people to get paid jobs (Kai, 2011).
Figure 5.8 shows that 41.6% of smallholder farmers earn income between R1500.00–R2999.00
per month, followed by those who earn R500.00–R1499.00 accounting for about 29.2%.
Respondents that earned income between R3000.00–R4999.00 accounted for 16.7% and 12.5%
earned income between R5000.00–R9999.00. The results postulate that households receive less
income per month.

87
Figure 5.8: Distribution of income earned by farmers (Households)
Source: Survey data (2013)
Smallholder farmers (39.6%) who adopted the IRWH technology earned income between
R3000.00–R4999.00 per month and 34.2% were food secure while 43.1% non-adopters earned
income between R1500.00–R2999.00 per month with a huge percentage of food insecurity
(71.4%) (refer to Figure 5.9). This suggests that, those households with a higher income have
the ability to invest in technologies and be able to bear risk associated with its adoption. These
results concur with the findings of Kalineza et al. (2008) on factors that influence the adoption
of soil conservation in Tanzania.
Figure 5.9: Adoption, food security status and distribution of income earned by household head
Source: Data survey (2013)
R500.00 -R1499.00 R1500.00 - R2999.00
R3000.00 - R4999.00
R5000.00 - R9999.00
Percentage 29.2 41.6 16.7 12.5
0
5
10
15
20
25
30
35
40
45
Per
cen
tage
27.8
43.1
15.2 13.9
10.3
31.3
39.6
18.8 17.2
71.4
11.4
0 17.6
18.8
34.2 29.4
0
10
20
30
40
50
60
70
80
R500.00 - R1499.00
R1500.00 -R2999.00
R3000.00 - R4999.00
R5000.00 - R 9999.00
Per
cen
tage
Income earned per month
Non-adopters of IRWH
Adopters of IRWH
Food insecure
Food secure

88
Now that households’ income has been discussed, the following section gives analysis of farm
income distribution in the study areas.
5.4.2.3 Farm income distribution of the household heads
Figure 5.10 shows that 54.2% of interviewed farmers received no income from the sale of their
produce, 20% received less than R300.00 per month and 25.8% received between R600.00–
R1199.00 per month. The reason for the large percentage of respondents not receiving anything
is that they do not sell their produce. They only produce for consumption because they have
small pieces of land. These results are in line with the findings of Shikur and Beshah (2012).
Figure 5.10: Farm income distribution of the household heads
Source: Survey data (2013)
Figure 5.11 shows that the majority of non-adopters (70%) receive no income per month from
their produce which led to a food insecurity of 46%. A percentage of non-adopters (24%)
received less than R300.00 per month and 6% respondents received R600–R1199.00 per month.
About 29% adopters of the IRWH technology do not sell anything therefore do not receive
anything per month, 15% received less than R300.00 per month and 56% received between
R600.00–R1199.00 per month hence the food secure households were 59%. This shows that no
farm income received led to more smallholder farmers not adopting the technology. This is
probably because the land they cultivated was small hence they had to produce for
consumption. This concurs with literature which points out that if farmers receive low or no
income from produce, they will be discouraged from adopting that technology leading to a
likelihood of being food insecure (White, 2012).
R0.00 54.2%
<R300.00 20%
R600.00 - R1199.00
25.8%

89
Figure 5.11: Adoption, food security status and farm income distribution of the household heads
Source: Survey data (2013)
Land security of tenure distribution in the study areas was discussed in the following section.
5.4.2.4 Land security of tenure distribution of the household heads
According to Baiyegunhi (2014) there is no doubt that security of tenure is one of the most
crucial factors determining farm development. Land tenure implies land ownership. Land can be
attained through inheritance, allocation by the chief, buying, leasing and hiring. In the EC, Pote
(2008) found that land attained through inheritance had a significant and positive effect on long-
term on-farm investments by households as their land is more secure. Land tenure distribution
results in the study areas are shown in Table 5.7 below.
Table 5.7: Land tenure distribution of the household heads
Own land through inheritance Allocated by the chief Leasing
79% 20% 1%
Source: Survey data (2013)
In the study areas 79% attained land through inheritance, 20% were allocated by the chief and
1% were leasing as shown in Table 5.7. This postulates that the majority of households have
more secure tenure of land.
According to Phahlane (2007) land tenure security determines the smallholder farmers’ ability
to adopt agricultural practices. For this study, results are presented in Figure 5.12.
0
10
20
30
40
50
60
70
R0.00 < R300.00 R600.00 - R1199.00
70
24
6
29
15
56
46
37
17 14
27
59 P
erc
en
tage
Farm income recieved
Non-adopters of IRWH
Adopters of IRWH
Food insecure
Food secure

90
Figure 5.12: Adoption, food security status and land tenure distribution of the household heads
Source: Survey data (2013)
In this study, adopters (76%) of the IRWH technology had access to land through inheritance,
24% allocated by the chief and none were leasing. About 23% non-adopters had access to land
through inheritance, 32% allocated by the chief while 45% had access to land through leasing.
The findings indicate that most smallholder farmers who had access to land through inheritance
adopted the IRWH technology and were food secured (73%) as shown in Figure 5.12. This may
be because smallholder farmers feel that they have more security of tenure and do not consider
it to be economically viable to produce on leased land. The results corroborate with the findings
of Baiyegunhi (2014) on determinants of the RWH technologies adoption for home gardening
in KwaZulu-Natal.
Since land tenure security of the household heads had been analysed, the distribution of their
land size was discussed below.
5.4.2.5 Land size distribution of the household heads
Land size plays a crucial role in agricultural productivity. In South Africa smallholder farmers
have small farm holdings of about 0.5-4ha producing food for household consumption and little
for selling (Kalineza et al., 2008). For this study the distributions are tabulated in Table 5.8.
0
10
20
30
40
50
60
70
80
Inherited Allocated by the Chief
Leasing
23
32
45
76
24
0
56
40
4
73
27
0
Pe
rce
nta
ge
Non-adopters of IRWH
Adopters of IRWH
Food insecure
Food secure

91
Table 5.8: Land size distribution of the household heads
Adopters of IRWH technology Non-adopters of IRWH technology
Mean Mean
Land size 0.639 ha 0.453 ha
Source: Survey data (2013)
Table 5.8 shows that the mean land size owned by adopters and non-adopters of the IRWH
technology in the study areas is 0.639ha and 0.453ha respectively. Adopters possessed more
land than non-adopters in terms of the total land size. This is in-line with the literature which
provides that having more land is likely to have a positive effect on adoption of most practices
(Murgor et al., 2013).
Access to market was described below.
5.4.2.6 Access to market
In this study, access to market was measured by the actual distance in kilometers to the nearest
input and output markets. According to ARC (2001) access to markets, enhances farm income
but rural areas are characterised by a general lack of this access. This corresponds with what
was found in the study areas (refer to Table 5.9).
Table 5.9: Access to market
Percentage
Distance to market Below 30 km Above 30km
40 60
Source: Survey data (2013)
Table 5.9 shows that 60% of the respondents indicated that the distance to market they travel is
above 30km. This implies that they have a problem with market access while 40% indicated that
they travel less than 30km which means they have access to market.
Distance to market is the total time and distance that is required to reach the nearest available
input and output markets (Ahmed et al., 2013). The greater the distance to these markets, the
greater the transactional costs and time spent. As the market distance increases for smallholder
farmers to sell their produce, the adoption of the IRWH technology is expected to decrease (Kai,

92
2011). For this study results are shown in Figure 5.13 below.
Figure 5.13: Adoption, household food security status and access to market
Source: Survey data (2013)
In the study areas, it was found that 80.6% non-adopters had no access to market and 19.4%
non-adopters had an access to market. About 70.8% of adopters of the IRWH technology had
access to market while 29.2% had no access to market (refer to Figure 5.13). Food security
(62.4%) was high among those who had access to market and food insecurity (54.3%) was high
to those who had no access. This is supported by Bunclark and Lankford (2010) who reported
that a commonly cited challenge for the IRWH technology by smallholder farmers is the
unavailability of markets to dispose their surplus produce leading to a probability of being food
insecure.
The following section gives an overview of the access to credit in the study areas.
5.4.2.7 Access to credit
According to Chisasa and Makina (2012) access to credit is important in agriculture in order to
help farmers to buy inputs as well as implements but most rural farmers are resource poor.
Figure 5.14 shows that about 86.7% of smallholder farmers in the study areas had no access to
credit because they were pensioners and lacked collateral. Only 13.3% had access to credit
because they had formal jobs therefore they had collateral.
0
20
40
60
80
100
Non-adopters of IRWH
Adopters of IRWH
Food insecure Food secure
19.4
70.8
45.7
62.4
80.6
29.2
54.3
37.6
Pe
rce
nta
ge
Below 30km
Above 30km

93
Figure 5.14: Access to credit by the household heads
Source: Survey data (2013)
Table 5.10 shows that most smallholder farmers (85%) did not adopt the IRWH technology and
their reason was that they had no access to credit and a smaller proportion (15%) had access to
credit. About 76% adopters of the technology had no access to credit and 24% had access. The
level of food insecurity (79%) was very high to those non-adopters who had no access to credit
while adopters who had access to credit had higher food security status (81%). This indicated
that the more smallholder farmers do not get financial support the more they were likely not to
adopt the IRWH technology and may be food insecure. This means that financial services are
required to enable households to adopt the IRWH technique for the production of agricultural
produce (Badisa, 2011).
Table 5.10: Adoption, household food security status and access to credit
Access to credit Adoption status Household food security status
Non-adopters Adopters Food insecure Food secure
Percentage Percentage Percentage Percentage
Yes 15 24 21 81
No 85 76 79 19
Total 100 100 100 100
Source: Survey data (2013)
An overview of an access to extension services and information were highlighted in the
following section.
13.3%
86.7%
Yes
No

94
5.4.2.8 Access to extension services and information
Shikur and Beshah (2012) mentioned that extension services play a vital role in equipping
farmers with the necessary farming knowledge, techniques and skills in order to optimise
productivity. The study results are shown in Figure 5.15 below.
Figure 5.15: Access to extension services and information about IRWH technology
Source: Survey data (2013)
The results presented in Figure 5.15 reveals that about 56% of households indicated that they
did not have access to extension services while 44% had access. This indicates that a number of
households in the areas do not receive extension services. This has led to 58.3% of smallholder
farmers not accessing information about IRWH technology while 41.7% had access to the
information.
Access to extension services like training in agriculture improves the capacity of obtaining
information that is accurate (Moyo and Nyimo, 2006). Therefore, access to information is
essential because it can influence a households’ decision on adopting the IRWH technology.
According to Tesfay (2008) extension is also known to catalyse awareness, organisation,
exchange information and technology adoption among smallholder farmers. The number of
extension workers per unit of population influences extension delivery. For this study, results
are shown in Table 5.11.
44 41.7
56 58.3
0
10
20
30
40
50
60
Access to extension services Access to information about IRWH
Per
cen
tage
Yes
No

95
Table 5.11: Adoption, household food security status and access to extension services as well as
information
Access to
extension
services
Adoption status Food security status
Non-adopters Adopters Food insecure Food secure
Percentage Percentage Percentage Percentage
Yes 13 100 11.4 54
No 87 0 88.6 46
Total 100 100 100 100
Access to information
Yes 25 100 17 58
No 75 0 83 42
Total 100 100 100 100
Source: Survey data (2013)
About 75% non-adopters of the IRWH technology had no access to information about the
technology and 83% were food insecure while 25% had access to information. All adopters
(100%) indicated that they had access to information and 58% were food secure (refer to Table
5.11). This indicates that the majority of non-adopters are not informed about IRWH technology
and what is needed. This might be because extension officers do not visit the farmers frequently
enough. The results are in line with what was found by Hlanganise (2010) on the impact of
IRWH technology on household food security at Khayalethu and Guquka villages in the EC.
An overview of how many livestock were kept by the households in the study areas was
highlighted below.
5.4.2.9 Livestock ownership
In South African rural areas, livestock keeping is known as a tradition and a source of
livelihood (Featherstone, 1997). According to Gebregziabher (2013) the higher the number of
livestock owned, the wealthier the household. Therefore households that are wealthier have
greater chances of adopting the technology. In this study, livestock ownership was used as a
proxy for wealth.
Interestingly, Figure 5.16 presents that on average; non-adopters own a higher number of all the

96
types of livestock under study than adopters. This implies that non-adopters are wealthier than
adopters. This could be attributed to the fact that non-adopters are older than adopters and could
suggest that they have accumulated the types of livestock over a period of time. This led to low
adoption of IRWH technology in the study areas. These results are in contrast with what was
found by Shikur and Beshah (2012). It was found that adopters own more livestock than non-
adopters because smallholder farmers use their livestock as a source of income.
Figure 5.16: Livestock ownership between adopters and non-adopters Source: Survey data (2013)
Livestock production is identified as an agricultural enterprise with the greatest potential for
improving household food security (Babatunde et al., 2007). Therefore, the wealthier the
household the higher the likelihood of being food secure than those without livestock
(Gebregziabher, 2013).
The findings of this study in Figure 5.17 show that non-adopters had a greater percentage of
food insecurity (88.6%) while 69.4% adopters were food secure. The reason for this
development could be that livestock was kept to satisfy other needs like social status and could
also suggest that they did not see livestock as a source of income to finance household needs to
improve household food security status as reviewed by Babatunde et al. (2007). These results
are in line with the findings of Gebregziabher (2013) who established that non-adopters were
food insecure compared to adopters
Cattle Goats Sheep Pigs Chicken
Non-adopters 7.3 11.1 1 3.9 10.7
Adopters 5 6 0.2 1.1 8.2
0
2
4
6
8
10
12
Ave
rage
nu
mb
er
of
live
sto
ck

97
Figure 5.17: Adoption, household food security status and livestock ownership
Source: Survey data (2013)
The next section gives an overview of how many minutes the households walk to other water
sources.
5.4.2.10 Distance to other water sources
The distance to other available water sources to irrigate crops is important in the decision
whether to adopt IRWH technology or not (Joseph and Botha, 2012). The lesser the walking
distance to other water sources the less likely it is that the household will adopt the IRWH
technology (Monde and Aliber, 2007). The other sources of water include tap water, borehole,
stream and river in the study areas. For this study, results are shown in Table 5.12.
Table 5.12: Total walking distance to other water sources
Adopters of IRWH technology Non-adopters of IRWH technology
Mean Mean
Minutes 15.64 10.85
Source: Survey data (2013)
The results in Table 5.12 shows that on average the total walking distance to other water
sources was 15.64 minutes for adopters of IRWH technology and 10.85 minutes for non-
adopters. This postulates that adopters walk a longer distance while non-adopters walk a shorter
distance to other water sources. The results are in-line with the findings of Gebregziabher
(2013) where adopters walked 11.54 minutes and non-adopters walked 6.43 minutes to other
0
10
20
30
40
50
60
70
80
90
Adopters of IRWH Non-adopters of IRWH
69.4
30.6
11.4
88.6
Food secure
Food insecure

98
water sources. The closer the water source for irrigation purposes to the household, the less
vulnerable to food insecurity because agricultural productivity will be improved (Botha et al.,
2013).
In Figure 5.18, the results show no much difference between household food security status of
adopters (53%) and of non-adopters (47%) of the IRWH technology with respect to distance to
other water sources. Therefore it can be concluded that non-adopters had an access to water for
irrigation as much as adopters which enabled them to be food secure. The results concur with
the findings of Baiyegunhi (2014) on determinants of RWH technologies adoption for home
gardening in KwaZulu-Natal.
Figure 5.18: Adoption, household food security status and distance to other water sources
Source: Survey data (2013)
The next section discusses how smallholder farmers in the study areas perceived the IRWH
technology.
5.4.2.11 Farmers’ perception towards the IRWH technology
In order for the IRWH technology to be adopted it depends mainly on how smallholder farmers
perceive it (Kalineza et al., 2008). The technology can be perceived positively or negatively.
Figure 5.19 shows how the technology was perceived in the study areas.
0
10
20
30
40
50
60
Adopters of IRWH technology
Non-adopters of IRWH technology
53
47 44.5
55.5
Per
cen
tage
Food secure
Food insecure

99
Figure 5.19: Farmers’ perception towards the IRWH technology
Source: Survey data (2013)
From Figure 5.19 it shows that about 54.2% of smallholder farmers perceived this technology
negatively while 45.8% farmers had a positive perception towards the technology. This
indicates that most smallholder farmers had a negative perception towards IRWH technology.
The labour-intensive nature of the technology was the reason given for their negative
perception. The results are in-contrast with the findings of Baiyegunhi (2014) where the
majority of the farmers (70%) had a positive attitude towards the RWH technologies.
With a positive perception towards the IRWH technology, the higher the possibilities of
adoption of the technology but a negative perception may lead to a lower adoption and a
likelihood of being food insecure (Ahmed et al., 2013). The results from the study areas are
tabulated in Table 5.13.
Table 5.13: Adoption, food security status and farmers’ perception towards IRWH technology
Farmers’ perception
toward the IRWH
technology
Adoption status Food security status
Non-adopters Adopters Food insecure Food secure
Percentage Percentage Percentage Percentage
Positive 18 100 29 65
Negative 82 0 71 35
Total 100 100 100 100
Source: Survey data (2013)
54.2%
45.8% Negative
Positive

100
Table 5.13 shows that larger percentage (82%) had a negative perception and did not adopt the
technology leading to higher percentage of food insecurity (71%). Only lesser non-adopters
(18%) had a positive perception. All adopters had a positive perception towards the IRWH
technology and 65% were food secure. The reason given by the smallholder farmers for not
adopting the technology was that, during high rainfall periods there is a water logging problem
which causes irreversible damage to the structures of the IRWH technique. The other reason
could be that they have steeper slopes which allow rapid run-off which increases soil erosion.
Therefore, these problems limit the benefits achieved from practicing the IRWH production
technique. The results from the study areas concur with the findings of Kalineza et al. (2008) on
factors that influence the adoption of soil conservation in Tanzania.
5.5 Summary
This chapter discussed the household demographics as well as socio-economic characteristics of
the study population. The results of the survey revealed that the majority was constrained by a
general lack of credit, labour since IRWH technology is very labour intensive and access to
markets to sell their produce. Lack of cash may suggest that the smallholder farmers have
difficulties in purchasing farm inputs. The results also show that the adoption status of the
IRWH technology is low in Khayalethu, Guquka and Krwakrwa villages and food insecurity is
high among the non-adopters. The most contributing factor was that they own small land which
gave them lower or no farm income. This resulted in a negative perception towards the IRWH
technology hence low adoption and high food insecurity. Generally, the results of the survey
suggest that the household demographics and socio-economic variables may have an influence
on the factors that determines the adoption of IRWH technology and their household food
security.

101
CHAPTER 6
RESULTS OF THE EMPIRICAL ANALYSIS AND DISCUSSIONS
6.0 Introduction
This chapter presents the empirical results obtained from the logistic regression model that was
formulated and explained in Section 4.10.1. Within the chapter, the independent variables are
tested for their significance and conclusions are drawn based on the results. A detailed
explanation is provided for the significant variables and this is followed by the summary of the
chapter.
6.1 Empirical results
In this section all the variables that were discussed in the previous chapter were considered for
the model and tested for their significance. The logistic results are presented in Table 6.1 for
demographic and socio-economic factors influencing the adoption of IRWH technology and
Table 6.2 for demographic and socio-economic factors influencing household food security.
The tables show the estimated coefficients (β values), standard error, significance values and
odd ratio of the predictor or independent variables in the model.
According to Gujarati (2002) the coefficient values measure the expected change in the logit for
a unit change in each independent variable, all other independent variables being equal. The
positive or negative (+/-) sign of the coefficient shows the direction of influence of the variable
on the logit. If it follows a positive value, it indicates an increase in the likelihood that a
household will adopt IRWH technology or may be food secure. A negative value shows that it
is less likely that a household will consider adopting the IRWH technology or may be food
insecure.
The significance values (also known as p-values) show whether or not a change in the
independent variable significantly influences the logit at a given level. In this study, the
variables were tested at 1%, 5% and 10 % significance levels. Thus, if the significance value is
greater than 0.01, 0.05 or 0.10 then it shows that there is insufficient evidence to support that the
independent variable influences a change from not adopting the IRWH technology or a
likelihood of being food insecure. If the significance value is less or equal to 0.01, 0.05 or 0.10,

102
then there is enough evidence to support a claim presented by the coefficient value.
The odds ratio indicates the extent of the effect on the dependent variable caused by the
predictor variables. It gives the exponential of expected value of β raised to the value of the
logistic regression coefficient, which is the predicted change in odds for a unit increase in the
corresponding explanatory variable. According to Hill et al. (2001) and Gujarati (2002) a value
greater than one implies greater probability of variable influence on the logit and a value less
than one indicates that the variable is less likely to influence the logit. The standard error
measures the standard deviation of the error in the value of a given variable (Hill et al, 2001;
Gujarati, 2002).
The goodness-of-fit test for a logistic regression model measures the suitability of the model to
a given data set. The -2log likelihood is a test value used to determine whether or not the
independent variable has an effect on the dependent variable. It measures the relevance of the
model employed in the study. It indicates the difference between the estimated logistic model
and the perfect model.
6.1.1 Factors influencing adoption of the IRWH technology
The logistic results for demographic and socio-economic factors influencing the adoption of
IRWH technology are presented in this section in Table 6.1. The overall percentage of correct
predictions was 77.5% as shown below in Table 6.1. The results for the goodness-of-fit test
shown in Table 6.1 indicate that the model fits the data well. Thus, the results for Hosmer &
Lemeshow Test show that the binary logistic regression model is well suited to predict the
influence of the independent variable on the dependent variable. The Nagelkerke R2
is 0.51
(refer to Table 6.1) and it lies between 0 and 1, confirming the goodness of fit of the model.
The formula in Section 4.10.1 is briefly described by Gujarati (2002) as the cumulative logistic
distribution function for factors influencing the adoption of IRWH technology. The results of
the binary logistic regression equation (refer to Table 6.1), expressed in terms of the variables
used in this study are given as:
ln (ODDS) = ln ( /1 – ) = βo + β1X1 + …+ βnXn + U

103
= -1.52 -1.47 ACHLBR + 1.10 FAMINCO + 0.08 ACMKT +
0.32 ACES + 1.66 ACINFO + 0.87 FPTRWH
Table 6.1: Binary logistic results for adoption or non-adoption of IRWH technology
Variable Coefficient Standard
Error
Significance Odds
ratio
Gender of the household heads 0.61 0.48 0.20 1.85
Age of the household heads -0.03 0.02 0.19 0.97
Education level of the household heads 0.17 0.09 0.60 1.19
Household size 0.23 0.18 0.21 1.25
Access to hired labour -1.47 0.69 0.06* 0.23
Household income -0.83 0.66 0.21 0.43
Farm income 1.10 0.63 0.05* 0.30
Land tenure security -0.00 0.00 0.78 0.99
Land size 0.05 0.03 0.23 1.05
Access to market 0.08 0.04 0.03** 1.08
Access to credit -0.00 0.00 0.34 0.99
Access to extension services 0.32 0.15 0.00*** 8.37
Access to information 1.66 0.47 0.00*** 5.29
Livestock ownership -1.73 0.70 0.97 0.18
Distance to other water sources 1.18 0.68 0.82 0.44
Farmers’ perception towards the IRWH
technology
0.87 0.42 0.00*** 6.38
Constant -1.52 1.88 0.42 0.22
-2 Log likelihood
167.65
Nagelkerke R2 0.51
Hosmer & Lemeshow Test Chi-square Sig df
2.18 0.97 8
Percentage correctly predicted 77.5%
Significant at 1%***, 5%** and 10%* probability level
Source: Survey data (2013)
The significant explanatory variables included: access to hired labour, farm income, access to
market, access to extension services, access to information and farmers’ perception towards
IRWH technology (refer to Table 6.1). Each of these variables is briefly discussed below.

104
6.1.1.1 Access to hired labour
In this research access to hired labour was measured by asking smallholder farmers whether
they had hired labour for farming. This variable was found to be significant at 10% and related
negatively with the farmers’ desire to adopt the IRWH technology activity. A -1.47 coefficient
was obtained for access to hired labour. This indicates that as access to hired labour increases
by 1 unit, the probability to adopt the IRWH technology decreases by 1.47 units, ceteris
paribus. This was found to be in-contrast with the literature which said more labour availability
will positively influence adoption and the extent of adoption as it eases the labour constraint
faced by most smallholder farmers towards the implementation of IRWH technology (He et al.,
2007; Kai, 2011; Shikur and Beshah, 2012). The contributing factor could be that, the majority
of households use family members for labour provision and smallholder farmers cannot hire
labour because of the unavailability of funds which led to less adoption.
6.1.1.2 Farm income
According to Sithole et al. (2014) farm income shows a positive effect on households’ adoption
decision of improved technologies. In this study the variable farm income was measured by
capturing the total income per month smallholder farmers received after selling their produce. It
was significant at 10% and related positively with smallholder farmers’ desire to adopt the
IRWH technology activity, ceteris paribus. The coefficient of 1.10 was obtained for this
variable. This implies that as farm income increases by 1 unit, and the probability of adoption of
IRWH technology increases by 1.10 units. These results are in line with the priori expectations
of the probability which provide that if farm income increases, the adoption of IRWH
technology will also increase. This is supported by descriptive analysis of this study which
indicated that when farm income was less than R300.00 per month only 15% adopted the
technology and when income was between R600.00–R1999.00 per month more smallholder
farmers adopted (56%) as discussed in Section 5.4.2.3. In Ethiopia the study by Shikur and
Beshah (2012) also found that farm income was positively related to the adoption of RWH
technologies.
6.1.1.3 Access to market
Access to market was measured by the actual distance in kilometres to the nearest input and

105
output markets. As expected this variable was found to have a significant positive relationship
to the adoption of IRWH technology at 5% significant level, ceteris paribus. The coefficient
0.08 was found for this variable. This implies that as access to market increases by 1 unit,
farmers become motivated to produce hence increasing the probability of them adopting IRWH
technology by 0.08 units a development which enhances productivity. This result is consistent
with Murgor et al. (2013) who have observed that there is a potential for adopting new
technology, provided that households produce surplus and that they have an easy access to
markets (formal or informal) to sell their produce. Shikur and Beshah (2012) have also
concluded that distance to the market from the place of dwelling may matter in adopting RWH
technologies. Further in the study areas, it was found that more smallholder farmers adopted
(70.8%) the technology because they had access to market as discussed in Section 5.4.2.6.
6.1.1.4 Access to extension services
Access to extension services was measured by asking smallholder farmers whether they had
access to extension services like governmental assistance and trainings/workshops with regards
to IRWH technology. This variable was found to have a significant positive effect on the IRWH
technology adoption as was hypothesised. It is highly significant at 1% level and is positively
related to the adoption of IRWH technology, other things held constant. This suggests that the
findings of this study indicated that smallholder farmers who adopted the IRWH technology had
contacts with extension services more than non-adopters as discussed in Section 5.4.2.8. The
coefficient obtained was 0.32. This postulates that if access to extension services increases by 1
unit, the probability of adopting IRWH technology increases by 0.32 units.
In addition, Woyessa et al. (2006) highlighted that smallholder farmers who are in contact with
research development or extension agencies have a greater likelihood of adopting the IRWH
technique. Farmers who have a frequent contact with research extension agencies will have an
easy access to information and training workshops; this will upgrade their knowledge on
technology (Woyessa et al., 2006). Therefore it will help in the implementation of the IRWH
technology because it is too technological for the users (Moyo and Nyimo, 2006). This result is
consistent with the findings of Yengoh et al. (2010) on technology adoption in small-scale
agriculture in Cameroon and Ghana.

106
6.1.1.5 Access to information
The variable access to information was measured by asking smallholder farmers whether they
had enough knowledge on the IRWH technology. This variable was found to be highly
significant at 1% and related positively with the farmers’ desire to adopt the IRWH technology
activity, other things held constant, as hypothesised. The coefficient of 1.66 was obtained and
this indicates that, if access to information increases by 1 unit, the probability of adoption will
increase by 1.66 units. In other words, the greater the access to information, the more
smallholder farmers will adopt the IRWH technology. This is so because, according to
Baiyegunhi (2014) contact with extension officers allows farmers to have a greater access to
information on technology, through increased opportunities to participate in demonstration tests
and thus increase farmers’ ability to get, process and use IRWH technique. Also, the findings of
this study indicated that smallholder farmers adopting the IRWH technology had access to
information more than non-adopters as discussed in Section 5.4.2.8. This is in agreement with
Sunding and Zilberman (2000) who stated that exposure to information sources is expected to
have a positive influence on the adoption of new technologies. Furthermore, these results are
consistent with a study conducted in China by He et al. (2007) on the econometric analysis of
the determinants of adoption of rainwater harvesting and supplementary irrigation technology.
6.1.1.6 Farmers’ perception towards the IRWH technology
Farmers’ perception can be defined as the degree of farmers’ positive or negative feelings
towards the technology (Kalineza et al., 2008). In this study smallholder farmers were asked
whether they had positive or negative perception towards the IRWH technology. According to
Yengoh et al. (2010) a smallholder famer who has a positive attitude adopts the RWH
technologies at a higher rate than those smallholder farmers who have a negative attitude. For
example, in the preliminary findings of this study it was indicated that more smallholder farmers
(82%) did not adopt this technology because they had a negative perception towards it as
discussed in Section 5.4.2.11. Also Murgor et al. (2013) have come to the same conclusion
about factors influencing farmers to adapt RWH techniques in Kenya to the effect that
household members’ who did not adopt the technology had a negative attitude about the
technologies. From the regression results, farmers’ perception towards the IRWH technology is
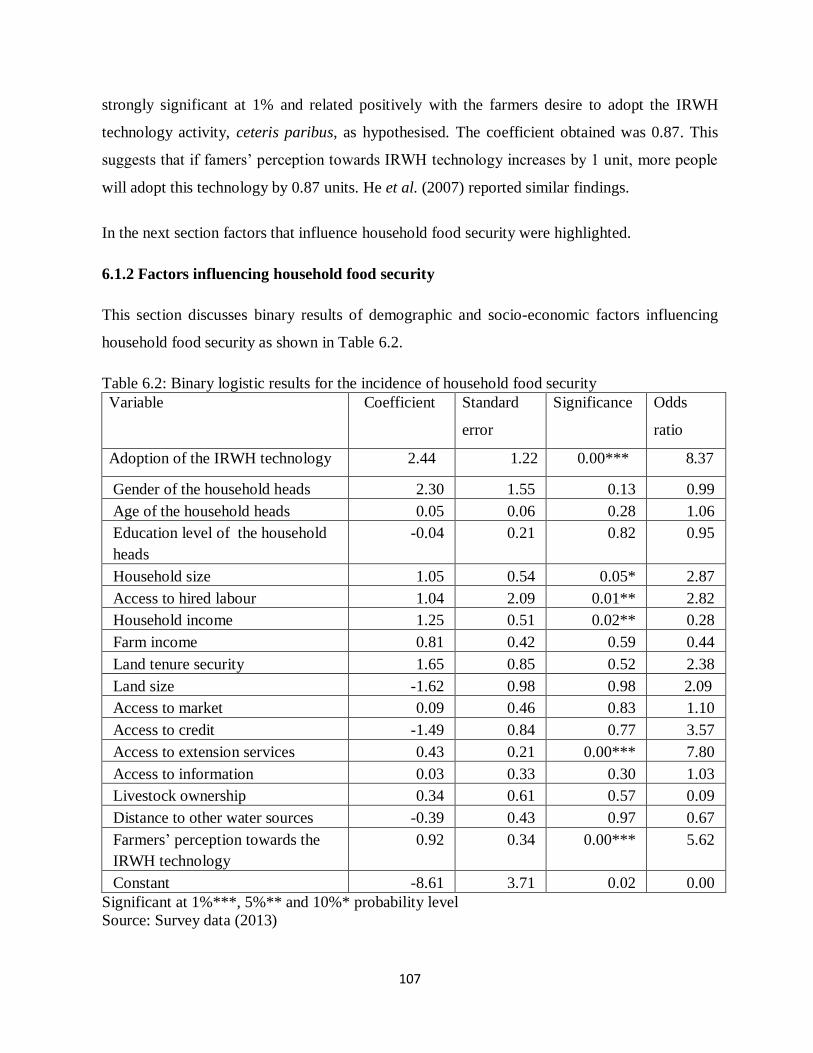
107
strongly significant at 1% and related positively with the farmers desire to adopt the IRWH
technology activity, ceteris paribus, as hypothesised. The coefficient obtained was 0.87. This
suggests that if famers’ perception towards IRWH technology increases by 1 unit, more people
will adopt this technology by 0.87 units. He et al. (2007) reported similar findings.
In the next section factors that influence household food security were highlighted.
6.1.2 Factors influencing household food security
This section discusses binary results of demographic and socio-economic factors influencing
household food security as shown in Table 6.2.
Table 6.2: Binary logistic results for the incidence of household food security
Variable Coefficient Standard
error
Significance Odds
ratio
Adoption of the IRWH technology 2.44 1.22 0.00*** 8.37
Gender of the household heads 2.30 1.55 0.13 0.99
Age of the household heads 0.05 0.06 0.28 1.06
Education level of the household
heads
-0.04 0.21 0.82 0.95
Household size 1.05 0.54 0.05* 2.87
Access to hired labour 1.04 2.09 0.01** 2.82
Household income 1.25 0.51 0.02** 0.28
Farm income 0.81 0.42 0.59 0.44
Land tenure security 1.65 0.85 0.52 2.38
Land size -1.62 0.98 0.98 2.09
Access to market 0.09 0.46 0.83 1.10
Access to credit -1.49 0.84 0.77 3.57
Access to extension services 0.43 0.21 0.00*** 7.80
Access to information 0.03 0.33 0.30 1.03
Livestock ownership 0.34 0.61 0.57 0.09
Distance to other water sources -0.39 0.43 0.97 0.67
Farmers’ perception towards the
IRWH technology
0.92 0.34 0.00*** 5.62
Constant -8.61 3.71 0.02 0.00
Significant at 1%***, 5%** and 10%* probability level
Source: Survey data (2013)

108
The binary logistic regression model fit was tested using the Hosmer & Lemeshow statistics.
The overall percentage of correct predictions was 89.2% as shown in Table 6.3. The p-value of
0.72 shows that there is a significant difference between the observed and predicted values of
the dependent variables, indicating that the models’ estimates fit the data well, at an acceptable
level. The Nagelkerke R2
is 0.60 (refer to Table 6.3) and it lies between 0 and 1, confirming the
goodness of fit of the model.
Table 6.3: Model summary
-2 Log likelihood
96.292
Nagelkerke R2 0.60
Hosmer & Lemeshow Test Chi-square Sig df
5.33 0.72 8
Percentage correctly predicted 89.2%
Source: Survey data (2013)
The results of the binary logistic regression equation (refer to Table 6.2), expressed in terms of
the variables used in this study are given as:
ln (ODDS) = ln ( /1 – ) = βo + β1X1 + …+ βnXn + U
= -8.61 +2.44 ADOPIRWH+1.05 HHS+1.04 ACHLBR + 1.25
HHINCO + 0.43 ACES+ 0.92 FPTRWH
The significant explanatory variables included: adoption of IRWH technology, household size,
access to hired labour, household income, access to extension services and farmer’s perception
towards IRWH technology (refer to Table 6.2). Each of these variables is briefly discussed
below.
6.1.2.1 Adoption of the IRWH technology
The adoption of IRWH technology variable was measured by asking households if they
currently practice the technology. The variable adoption of the IRWH technology was
positively significant at 1% level as was expected and hypothesised in the study. This shows a
positive relationship between adoption of IRWH technology and household food security status,
ceteris paribus. The coefficient for the adoption of IRWH technology was 2.44. This implies

109
that the higher the probability of adopting the IRWH technique by 1 unit the higher the
household food security status by 2.44 units because more crop yields could be obtained. This
could further indicate the importance of adoption of IRWH technology to smallholder farmers
and the potential to improve household food security and income generation. These results
correspond with the literature which states that IRWH technology increases yields in high
drought soils because run-off is directed and stored into the basin area improving water
availability (Hatibu et al., 2006). Badisa (2011) reported similar findings in Lambani village in
the Free State Province.
6.1.2.2 Household size
Household size variable was measured by capturing the actual number of members in a
household. From the binary logistic regression model results, household size is significant at
10% and related positively with household food security, other things held constant. The
coefficient of this variable was 1.05 which entails that if household size increases by 1 unit,
household food security improves by 1.05 units because IRWH technology is labour intensive
therefore more household labour will be available (Kai, 2011). As such, more diversified crops
will be planted resulting in higher yields. These results are supported by Kuwornu et al., (2013)
who have pointed out that smallholder farmers in Ghana have access to family labour, a
development which may translate to an increase in the demand for new innovations that are
labour intensive. However, the results are in-contrast with the findings of Babatunde et al.
(2007) who established that household labour is negatively related to household food security.
6.1.2.3 Access to hired labour
The study expected access to hired labour to be positively related to household food security
and it was found to be significant at the 5% significant level, ceteris paribus. The coefficient
obtained for this variable was 1.04. This indicates that with increasing hired labour force by 1
unit, household food security increases by 1.04 units. This might happen because there will be
an increased diversity in the production of crops planted leading to higher yields. This also
shows the importance of hired labour because the quantity of the harvest depends on the number
of labourers for ploughing, weeding and irrigating the crops (Monde, 2003). These results are
consistent with the literature which has stated that the more the farmers hired labour for farming

110
the more the yields they would receive which improves household food security (Hlanganise,
2010). Kuwornu et al. (2013) have also reported similar results in Ghana.
6.1.2.3 Household income
The household income variable was measured by capturing the total household income per
month. As hypothesised in the study, this variable was found to be positive and significant at
5% level. The coefficient of 1.25 was obtained for this variable. This indicates that the higher
the household income by 1 unit, the higher the probability that household would be food secure
by 1.25 units, other things held constant. This could be expected because the increased income
means increased access to healthy and nutritious food all the time (Hlanganise, 2010). These
results are supported by the descriptive findings of this study in Section 5.4.2.2 which indicated
that smallholder farmers who adopted (39.6%) the technology earned income between
R3000.00–R4000.00 per month and were food secure (34.2%) as compared to non-adopters
(43.1%) who earned income between R1500.00–R2999.00 per month, who were food insecure
(71.4%). These results are in line with the observations of Babatunde et al. (2007) who stated
that the greater the household income, the more food secure the household is. Similar results
were found by Kuwornu et al. (2013) who have revealed a positive and significant relationship
between household income and food security.
6.1.2.5 Access to extension services
Access to extension services like governmental assistance, information, training as well as
workshops helps smallholder famers to better understand the construction of IRWH technique
(Hatibu et al., 2006). Also, farmers mostly produce particular crops based on the knowledge
that they have on those specific crops (FAO, 1990). This study hypothesised and expected that
the variable access to extension services is highly significant at 1% and is positively related to
household food security, ceteris paribus. The coefficient obtained for this variable was 0.43 and
this means that if access to extension services increases by 1 unit, there would be a probability
of household food security increasing by 0.43 units. This could be the case because smallholder
farmers will harvest more quantities and sell the surplus in order to buy more nutritious food
and obtain health care (Hlanganise, 2010). Sithole et al. (2014) have reported similar findings.

111
This is also supported by the descriptive findings of this study in Section 5.4.2.8 which
indicated that all adopters (100%) of the technology had access to extension services and were
food secure (54%) more than non-adopters.
6.1.2.6 Farmers’ perception towards the IRWH technology
Farmers’ perception towards the IRWH technology also proved to be a highly significant
variable to household food security in the study areas. This variable is statistically significant at
1% significance level and positively related to household food security, as hypothesised. The
coefficient obtained for this variable was 0.92. This indicates that if a positive perception
towards IRWH technology that more yields will be obtained increases by 1 unit, the probability
of adopting IRWH technology will increase. Hence, a likelihood of more households being food
secure will in turn increase by 0.92 units, other things held constant. This is consistent with the
expectation that smallholder farmers are likely to invest in technologies that enable them to
maximise production in order to improve household food security and which are compatible
with their farming systems (Kai, 2011). In addition, smallholder production increases household
food security and reduces reliance on cash to feed the household thus releasing cash for other
household uses (Baiphethi and Jacobs, 2009).
6.2 Summary
This chapter discussed the influence of the significant predictor variables on the dependent
variable. The results from the socio-economic analysis for the incidence of adoption showed
that access to hired labour and farm income were significant at 10%. This means that these
variables appear to play a lesser role in influencing adoption of the IRWH technology as proved
by their significance levels. Access to hired labour negatively influences the adoption of IRWH
technique while farm income positively influences adoption. If farm income can be improved
adoption of the IRWH technology can be enhanced. Access to market was significant at 5% and
influences adoption positively meaning the more markets are available the higher the adoption
of IRWH technology. Farmers’ perception towards the IRWH technology, access to extension
services and access to information were found to be highly significant at 1% and positively
influences the adoption of IRWH technology. This suggests that improving farmers’ perception

112
towards the IRWH technology, access to extension services and access to information will
significantly improve the adoption of IRWH technology.
For the incidence of household food security, significant variables were all positively related to
household food security. Adoption of the IRWH technology, access to extension services and
farmers’ perception towards the IRWH technology were highly significant at 1% significance
level. This means that these variables appear to play a major role in influencing household food
security as proved by their significance levels. If smallholder farmers can improve their
adoption status of IRWH technology, more households will be food secure. Also if extension
officers which help with extension services like trainings, demonstrations, workshops,
information and government assistance can visit households more often, improving their access,
more households will adopt IRWH technique leading to improved household food security
status. If more smallholder farmers can perceive IRWH technology positively, their household
food security status will improve. Variables like household income and access to hired labour
were found to be significant at 5% significance level. Household size was significant at 10%
meaning it plays a lesser role in influencing household food security as proved by its
significance level in the binary logistic regression model.
Generally, the findings of this study suggest that any change in each one of the significant
variables can significantly influence the probability of adopting IRWH technology and
household food security.
113
CHAPTER 7
DISCUSSION, CONCLUSION AND RECOMMENDATIONS
7.0 Introduction
This chapter provides the summary of the research findings and conclusions basing on the
results of the study and puts forward some recommendations. Lastly, it also provides areas of
further studies.
7.1 Discussion and conclusion
The main objective of this study was to investigate the socio-economic factors influencing the
adoption of the IRWH technology for enhancing household food security by smallholder
farmers. The major determinants and their prior expectation were explained in Section 4.10.1.1.
The specific objectives of this study were to assess the level of adoption of IRWH technology
by smallholder farmers, to determine socio-economic factors influencing the adoption of IRWH
technology by smallholder farmers and to determine whether adopters of IRWH technology are
more food secure than non-adopters in the study areas in the EC.
To assess the level of adoption of IRWH technology by smallholder farmers, descriptive
statistics were employed. The main descriptive indicators that were employed were percentages,
frequency and mean values. The results were presented in graphs, pie-charts, tables and cross-
tables. The binary logistic regression model was used to test the factors that influence the
adoption of IRWH technology and household food security. To measure household food
security in the study areas, the HDDS was adapted and an average HDDS indicator of 5.01 was
obtained. A household was food secure if the HDDS score was above 5 and food insecure if the
HDDS score was below 5.
The descriptive results of the study revealed that level of adoption of the technology is low by
21% and the level of food insecurity is high amongst the non-adopters in the study areas by
86%. The contributing factor might that on average non-adopters have smaller land of 0.453ha
compared to adopters which have 0.639 ha. This has led to 70% of non-adopters to receive no
farm income per month which resulted in food insecurity of 46% because they have to produce
for consumption. It can be concluded that any change in each one of the significant variables

114
can significantly influence the probability of adopting IRWH technology and household food
security.
The empirical results show 6 out of 16 variables that are used to test the hypothesis are
significant in the incidence of adoption. These significant variables are access to hired labour
which negatively influences the adoption of IRWH technology. On the other hand farm income,
access to market, farmer’s perception towards IRWH technology, access to extension services
and access to information are found to be positively influencing the adoption of this technology.
The influence of farmer’s perception towards IRWH, access to extension services and access to
information appear to play a major role in influencing incentives for IRWH technology
adoption while farm income, access to market and access to hired labour play a lesser role as
shown by their level of significance. Based on the empirical results, IRWH technology does
contribute to household food security.
From the empirical results, out of 17 variables, only 6 variables affect household food security
of the smallholder farmers in the study areas. These variables are adoption of the IRWH
technology, household size, household income, access to hired labour, access to extension
services and farmer’s perception towards IRWH technology. They all positively influence the
household food security. As shown by their level of significance, adoption of IRWH
technology, access to extension service and farmer’s perception towards IRWH technology
strongly influences household food security while household size influences it to a lesser
degree.
Generally, empirical findings of this study indicate that there are socio-economic factors
influencing adoption of IRWH technology and household food security amongst smallholder
farmers.
To increase and promote the likelihood of farmers to adopt IRWH technology in order to
improve their food security status, this study recommends the measures outlined in the
following section.
7.2 Recommendations
The majority of the non-adopters in the study areas indicated that they have no access to

115
extension services and information about the IRWH technology. Access to extension services
can be a useful source of information as it can play a crucial role in empowering farmers with
farming knowledge, techniques and skills. Therefore, increasing smallholder farmers’
knowledge through better access to technical information, extension and training will help them
to develop a positive economic assessment of IRWH technology. As a result there is a need for
government to provide extension officers and research stations with the capacity, support and
physical means to expose smallholder farmers to IRWH technology through demonstrations and
trainings. This will help to improve adoption of IRWH technology as well as smallholder
farmers’ food security status.
On average non-adopters have smaller land size compared to adopters. With expansion to the
communal croplands, both adopters and non-adopters will be able to produce large enough
surpluses. This could solve the problem of not having enough land to construct the structure of
IRWH technology. Enough surpluses will help smallholder farmers to raise their farm incomes
and consequently improve their household food security status. This will also help to improve
the positive perception towards the technology and gives an incentive to adopt it.
The majority of non-adopters indicated that they have no access to hired labour. Hired labour
eases the labour constraints since this technology is labour intensive. Therefore, when
smallholder farmers are working as a co-operative or as an association, they will be able to help
each other in the construction and maintenance of the structure of IRWH technique. This
support service will have a positive influence on adoption and household food security status.
Results of this study reveal that most of smallholder farmers have no access to credit which is
one of the major constraints for smallholder farmers not adopting IRWH technology.
Smallholder farmers need access to finance to invest in basic inputs, such as improved seeds
and fertiliser to raise farm productivity and generate profits but they may not be getting access
to it because financial institutes may not be available in their areas. If government can introduce
agricultural finance institutions in rural areas mainly to assist the rural smallholder farmers
since other financial institutions like banks may have strict requirements in providing loans such
as collateral which the smallholder farmers may not have. The Department of Water Affairs
could establish a new policy to provide financial assistance to resource-poor irrigation farmers.

116
This will help to improve adoption and household food security status.
This study highlights and recommends that future research should focus into the following:
7.3 Areas of further studies
Investigation on socio-economic factors influencing IRWH technology in all
communities in the Province that have benefited from the project have to be done
because the importance of socio-economic factors affecting technology adoption differs
across countries and regions due to differences in natural resources, cultural and political
ideologies and socio-economic. Therefore the study urges policy makers, researchers,
specialists and others in South Africa to review socio-economic factors in each and
every region before they implement new technology so that major socio-economic
factors affecting adoption of IRWH technology would come out strongly.
While the results reported that the use of IRWH technique provides social and economic
benefits, these findings come from the assessment of the technique in a short period.
There is need for a continued monitoring of the impacts (economic and social) of this
technique. In this regards it would be necessary to conduct an impact assessment study
in three to four seasons. This could allow researchers and policy makers to have a better
understanding of the role that IRWH technology can play in the farming systems in arid
and semi-arid areas.

117
LIST OF REFERENCES
Abera, H.B., 2008. Adoption of improved tef and wheat production technologies in crop
livestock mix system in Northern and Western Shwewa zone of Ethiopia. University of
Pretoria.
Agricultural Research Council (ARC), 2001. In-Field Rainwater Harvesting: A climate-smart
sustainable production practice. Available at:
<http://www.iwmi.cgiar.org/News_Room/Archives/Durban_Climate_Change_Conference/PDF
/infield.pdf> [Accessed 14/03/2013].
Ahmed, I., Onwanga,R.N., Mburu, D. and Elhadi, Y., 2013. Evaluation of types and factors
influencing adoption of Rainwater harvesting techniques in Yatta District Kenya. International
journal of education and research, 1(6): 1 – 14.
Alem, G., 2001. Rainwater harvesting in Ethiopia: an overview. In: J. Pickford [Ed];
Proceedings of 25th WEDC conference: Integrated development for water supply and sanitation
(pp 387-390). Laughborough, UK.: Water Laughborough University, Engineering and
development center.
Aliber, M., Baiphethi, M., de Satge, R., Denison, J., Hart, T., Jacobs, P. and van Averbeke,W.,
with Alcock, R., Antwi, M., Belete, A., Cousins, B., Field, L., Mariga, I., Masika, P.,
Materechera, S., Mayson, D., Monde, N. and Tapela, B., 2009. Strategies to support South
African smallholders as a contribution to government’s second economy strategy: Situation
analysis, fieldwork findings and main conclusions. Institute for Poverty, Land and Agrarian
Studies. University of the Western Cape.
Amha, R., 2006. Impact assessment of Rainwater Harvesting Ponds: The Case of Alaba
Woreda, Ethiopia. MSc. Addis Ababa University.
Babatunde, R.O., Omotesho, O.A. and Sholotan, O.S., 2007. Socio-economics characteristics
and food security status of farming households in Kwara State, North – Central Nigeria.
Nigeria-Pakistan Journal of Nutrition, 6 (1): 49 -58.

118
Babbie, E. and Mouton, J., 2006. The practice of social research. Cape Town: Oxford
University Press.
Backeberg, G., 2009. In-field rainwater harvesting on croplands: opportunities and challenges.
Water Wheel, 8(2): 30-33.
Badisa, K.T., 2011. Socio-economic factors determining in-field rainwater harvesting
technology adoption for cropland productivity in Lambani village: A case study of Thulamela
Local Municipality of the Vhembe District in Limpopo Province. Msc. University of Limpopo.
Baiphethi, M.N., Viljoen, M.F., Kundhlande, G., Botha,J.J. and van Rensburg, L.D., 2006.
Quantifying the impact of in-field rainwater harvesting (IRWH) production techniques on
household food security for communal farmers in ThabaNchu, Free State Province. Agrekon, 45
(3): 239-45.
Baiphethi, M.N. and Jacobs, P.T., 2009. The contribution of subsistence farming to
food security in South Africa. Agrekon, 48 (4): 459-82.
Baiphethi, M.N., Viljoen, M.F. and Kundhlande, G., 2009. Rural women and rainwater
harvesting and conservation (RWH&C): anecdotal evidence from the Free State and Eastern
Cape Provinces. In: Human Sciences Research Council (HSRC), Responding to the global
crisis: Contribution of human and social science to social protection, growth and national
building, HSRC Social Sciences Research conferences, 16-17 September 2009.
Baiphethi, M. N., Viljoen, M. F., Kundhlande, G., Botha, J. J. and Anderson, J. J.,
2009. Reducing poverty and food insecurity by applying infield rainwater harvesting
(IRWH): How rural institutions made a difference. African Journal of Agricultural Research, 4
(12): 1358-63.
Baiphethi, M.N, Viljoen, M.F, Kundhlande, G. and Ralehlolo, N.G., 2010. Enhancing food and
livelihood security in the context of the food and financial crisis: challenges and opportunities
for small scale rainwater harvesting and conservation, In: Research in Agriculture and Applied
Economics, African Association of Agricultural Economists (AAAE)>2010 AAAE Third
Conference/AEASA 48th Conference, 19 -23 September 2010. Cape Town, South Africa.

119
Baiyegunhi, L., 2014. Determinants of rainwater harvesting technology (RWHT) adoption
for home gardening in Msinga, KwaZulu-Natal, South Africa. Water South Africa, 41 (1): 33-
39.
Baumüller, H., 2012. Facilitating agricultural technology adoption among the poor: The role of
service delivery through mobile phones. ZEF Working Paper Series 93, University of Bonn.
Bickel, G., Nord, M., Price, C., Hamilton, W. and Cook, J., 2000. Guide to measuring food
security, Revised 2000. Alexandria VA, USA.
Botha, J.J., van Rensburg, L.D., Anderson , J.J., Hensley, M., Macheli, M.S., van Staden, P.P.,
Kundhlande, G., Groenewald, D.G. and Baiphethi, M.N., 2003. Water Conservation Techniques
on Small Plots in Semiarid Areas to Enhance Rainfall Use Efficiency, Food Security, and
Sustainable Crop Production. South Africa: Water Research Commission.
Botha, J.J., 2005. Livelihoods: in-field rainwater harvesting for homestead backyard gardens,
South Africa. In: African Association of Agricultural Economists (AAAE)>2010 AAAE Third
Conference/AEASA 48th Conference, Cape Town, 19 -23 September 2010. South Africa:
AAAE.
Botha, J.J, Kundhlande, G, and Sanewe, A.J., 2005. Bio-Physical Requirements and Socio-
Economic Acceptance of Infield Rainwater Harvesting and Conservation in the Semi-Arid
Central Region of South Africa. In: Food and Agriculture Organisation (FAO),
FAO/Netherlands Conference on Water for Food and Ecosystems: Make it Happen, 31 January-
5 February 2005. Netherlands: FAO.
Botha, J.J., Anderson, J.J, Groenwald, D.C., Mdibe, N., Baiphethi, M.N., Nhlabatsi N.N. and
Zere, T.B., 2007. On-Farm Application of In-field Rainwater Harvesting Techniques on Small
Plots in the Central Region of South Africa: Main Report. Pretoria: Water Research
Commission.
Botha, J.J., Anderson, J.J., Joseph, L.F., van Staden, P.P., Smith, K., Beukes, D.J. and Hensley,
M., 2013. Increasing water productivity towards food security through rainwater harvesting and
conservation. Available at:

120
<http://www.combinedcongress.org.za/pdf/2013/CC13_Abstracts_ORAL.pdf> [Accessed
08/11/2014].
Bless, C., Higson, S.C. and Kagee, A., 2011. Fundamentals of Social research methods: An
African perspective. 4thedition. Cape Town: Juta.
Bunclark, L.A. and Lankford, B.A., 2010. Rainwater harvesting: A suitable poverty reduction
strategy for small-scale farmers in developing countries. Waterlines Journal, 30 (4):312-27.
Chisasa, J. and Makina, D., 2012. Trends in credit to smallholder farmers in South Africa.
International Business and Economics Research Journal, 11 (7): 15-21.
Department of water affairs (DWA), 2013. Water Supply and Sanitation Policy. White Paper,
water-an individual national asset. Cape Town. Available at:
<http://www.dwaf.gov.za/Documents/Policies/WSSP.pdf. > [Accessed 06/06/2013].
Featherstone, A.M., Kaliba, A.R.M. and Norman, D.W., 1997. A stall feeding management for
improved cattle in semi-arid central Tanzania: factors influencing adoption. Agricultural
Economics, 17:133–46.
Food and Agriculture Organisation (FAO), 1990. An international action programme on water
and sustainable agricultural development. Rome: FAO.
Food and Agricultural Organisation (FAO), 2007. Guidelines for measuring Household and
Individual Dietary Diversity. Available at:
<http://www.fantaproject.org/downloads/pdfs/tn4_dd.pdf> [Accessed 07/05/2013].
Food and Agriculture Organisation (FAO), 2008. World food crisis – world food situation.
Available at:<http:// www.fao.org> [Accessed 05/04/ 2013].
Food and Agricultural Organisation (FAO), 2011. Guidelines for Measuring Household and
Individual Dietary Diversity. Available
at:<http://www.FAO_guidelines_dietary_diversity2011.pdf > [Accessed 16/05/2013].
Fox, P. and Rockstrom, J., 2000. Water harvesting for supplementary irrigation of cereal crops
to overcome intra-seasonal dry-spells in the Sahel. Chemistry of the Earth, 25:289-96.

121
Gebregziabher, G., Rebelo, L-M., Notenbaert, A., Ergano, K. and Abebe, Y., 2013.
Determinants of adoption of rainwater management technologies among farm households in the
Nile River Basin. Sri Lanka: International Water Management Institute.
Gillespie, K., 2006. Coping strategy index as a measure of household food security. Washington
D.C.: International Food Policy Research Institute.
Gujarati, D., 2002. Basic Econometrics. 5th edition. New York: McGraw-Hill.
Hatibu, N., Mutabazi, K., Sekondo, E.M. and Msangi, A., 2006. Economics of rainwater
harvesting for crop enterprises in semi – arid areas of East Africa. Agricultural Water
Management, (80): 534-36.
He, X., Cao, H. and Li, F., 2007. Econometric analysis of the determinants of adoption of
rainwater harvesting and supplementary irrigation technology (RHSIT) in the semiarid Loess
Plateau of China. Agricultural Water Management, (89): 243 – 50.
Herman, D., van Schalkwyk, H., Groenewald, J., Fraser, C., Obi, A. and van Tilburg, A., 2012.
Unlocking markets to Smallholders: Lessons from South Africa. Netherlands: Wageningen
Academic Publishers.
Hill, R. C., Griffiths, W. E. and Judge, G. G., 2001. Econometrics. 2nd
edition. New York: John
Wiley & Sons.
Hlanganise, Y.H., 2010. Impact of in-field rainwater harvesting technology on household food
security: a case of Guquka and Khayalethu villages in central Eastern Cape Province. Msc.
University of Fort Hare.
Hoddinott, J., 1999. Choosing Outcome Indicators of Household Food Security. Washington,
D.C.: International Food Policy Research Institute.
Hoddinott, J. and Yohannes, Y., 2002. Dietary Diversity as a Food Security Indicator.
Washington D.C.: Food and Nutrition Technical Assistance Project, Academy for Educational
Development.
Hosu, S., Sibanda, M. and Mushunje, A., 2013. Scenario simulation of small farms

122
production efficiencies in the Eastern Cape Province, South Africa. In: African Association of
Agricultural Economists (AAAE), 4th International Conference of the AAAE, Hammamet, 22-
25 September 2013. Tunisia: AAAE.
Jari, B., 2009. Institutional and Technical factors influencing agricultural marketing channel
choices amongst smallholder and emerging farmers in the Kat River Valley. Msc. University of
Fort Hare.
Joseph, L.F. and Botha, J. J., 2012. Critical natural resources factors that promote the adoption
of new In-Field Rainwater Harvesting (IRWH) by extensionist in Lambani, Limpopo Province.
South African Journal, Agriculture, 1(40): 231 -38.
Kai, O., 2011. Food security status among cocoa growing households in Ondo and Kwara States
of Nigeria: A discriminant analysis approach. African Journal of Food, Agriculture, Nutrition
and Development, 11(7): 201 – 5.
Kalineza, H., Mdoe, N. and Mlozi, M., 2008. Factors influencing adoption of soil conservation
technologies in Tanzania: a Case study in Gario. Available at: <
http://www.tzonline.org/pdf/factorinfluencingadoptionofsoil.pdf> [Accessed 09/05/2013].
Kehler, J., 2001. Women and Poverty: The South African Experience. Journal of International
Labour Office, 2 (3): 143-45.
Kirkland, T.M., Kemp, R.S., Hunter, L.M. and Twine, M., 2011. Toward Improved
Understanding of Food Security: A Methodological Examination Based in Rural South Africa.
Food, Culture and Society, 16(1): 65–84.
Kirsten, J.F. and van Zyl, J., 1998. Defining small-scale farmers in the South African context.
Agrekon, 37(4): 560-71.
Kuwornu, J., Suleyman,D., Ditchfield,P. and Amegashie, P.K., 2013. Analysis of food security
status of farming households in the forest belt of the central region of Ghana. Russian Journal
of Agricultural and Socio-economic Science, 1 (13): 347 -56.
Leedy, P. and Ormrod, J., 2004. Practical Research: Planning and Design. 8th edition. Upper

123
Saddle River, New Jersey: Prentice –Hall.
Maxwell, D. and Caldwell, R., 2008. Measuring Food Insecurity. Food Policy, 33 (6):533-40.
Mensah, O., James, I., Aidoo, R. and Tuffour, T., 2013. Determinants of Household Food
Security in the Sekyere-Afram Plains District of Ghana. European Scientific Journal, (3):514-
21.
Ministry of Agriculture and Land Affairs, 1998. Agricultural policy in South Africa. A
discussion document. Pretoria: National Department of Agriculture.
Monde, N., 2003. Household Food Security in Rural Areas of Central Eastern Cape: The Case
of Guquka in Victoria East and Koloni in Middledrift Districts. Ph.D. University of Fort Hare.
Monde, N., 2005. Sustainable Techniques and Practices for Water Harvesting and Conservation
and their effective Application in Resource-Poor Agricultural Production: A Situation Analysis
of Guquka and Khayalethu at Nkonkobe District Municipality, Eastern Cape. Deliverable No.3
for WRC Project Nr K5/1477.
Monde, N., Chiduza, C., Brutsch, M., Mnkeni, P., Mtshali, S., Dladla, R., Modi, A., Mthembu,
B., van der Stoep, I. and Stevens, J., 2005. Best management practices for smallholder farming
on two irrigation schemes and surrounding areas in the Eastern Cape and KwaZulu-Natal
through participatory adaptive research: A Situation Analysis Report on the Zanyokwe and
Tugela Ferry Irrigation Schemes. Alice, South Africa: University of Fort Hare.
Monde, N. and Aliber, M., 2007. Multiple uses of water in rural areas of central Eastern Cape: a
case of three villages in Nkonkobe Local Municipality, Eastern Cape. Pretoria: Water Research
Commission.
Monde, N., Botha, J., Joseph, L., Anderson, J., Dube, S. and Lesoli,
M., 2012. Sustainable
techniques and practices for water harvesting and conservation and their effective application
in-resource-poor agricultural production. Pretoria: Water Research Commission.
Moyo, S. and Nyimo, T., 2006. Regional Annex Rainwater Harvesting in Southern Africa. The
WELL resource centre for water, sanitation and environmental health. Available at: <

124
http://www.lboro.ac.uk/orgs/well/resources/fact-sheets/fact-sheets
htm/RSA%20Rainwater%20in%20SA.htm> [Accessed 15/05/2013].
Muchara, B., 2011. Analysis of food value chains in smallholder crop and livestock enterprises
in the Eastern Cape Province of South Africa. Msc. University of Fort Hare.
Mugewra, N., 2007. Rainwater harvesting and rural livelihood improvement in banana growing
areas of Uganda. Ph.D. Linköping University.
Murgor, F.A, Owino, J.O, Cheserek, G.J. and Saina, C.K., 2013. Factors Influencing Farmers’
Decisions to Adapt Rain Water Harvesting Techniques in Keiyo District, Kenya. Journal of
Emerging Trends in Economics and Management Sciences, 4 (2): 133-39.
Mutekwa, V. and Kusangaya, S., 2006. Contribution of rainwater harvesting technologies to
rural livelihoods in Zimbabwe: The case of Ngundu ward in Chivi District. Water South Africa,
32 (3):437-44.
Mwenge, K., 2011. Decision support system for sustainable rainwater harvesting in South
Africa. Ph.D. University of the Witwatersrand.
National Department of Agriculture (NDA), 2007. Agricultural statistics. Available
at:<www.nda.agric.za> [Accessed 17/04/ 2013].
National Development Plan (NDP), 2013. Millennium development goals, country report.
Available at:
<http://www.za.undp.org/content/dam/south_africa/docs/Reports/The_Report/MDG_October-
2013.pdf > [Accessed 08/11/2013].
Ngigi, S.N., 2003. What is the limit of up-scaling rainwater harvesting in a river basin? Physics
and Chemistry of the Earth, 28: 943–56.
Ngwenya, K., 2013. Factors affecting rural farming households’ willingness to participate in a
proposed irrigation scheme: A situation analysis of Guquka in Nkonkobe District Municipality,
Eastern Cape, South Africa. Msc. University of Fort Hare.

125
Nhundu, K., 2010. Determinants of Farmer Participation in Irrigation Development Post “Fast
Track” Land Reform Programme; A Case Study of Mashonaland East Province, Zimbabwe.
Msc. University of Fort Hare.
Nkonkobe Municipality Spatial Development Framework Review (SDFR), 2010/11 -2012/13.
Available at:<http://drupal6dev15.econsultant.co.za/sites/psdp.ecprov.gov.za/files/Nkonkobe%
20LM%20SDF_pdf> [Accessed 14/04/2014].
Nkonkobe Municipality Intergrated Development Plan (IDP), 2013/2014. Available at:
<http://www.nkonkobe.gov.za/?q=system/files/filedepot/2/FINAL%20IDP%202013%2014.pdf
> [Accessed 14/04/2014].
Obi, A, Pote, P. and Chianu, J., 2011. Market access: Components Interactions and Implications
in Smallholder Agriculture in former homeland area of South Africa. Netherlands: Springer.
Orgainisation for Economic Co-operation and Development (OECD), 2001. Adoption of
Technologies for Sustainable Farming Systems: Wageningen Workshop Proceedings:
Agriculture and Food, Netherlands: OECD.
Phahlane, H., 2007. Market constraints and opportunities for the sustainable adoption of Infield
Rainwater Harvesting in Thaba Nchu: a Principal Component Analysis (PCA) approach.
Available at:
<http://www.findavenue.co.za/AEASA/Presentations/Market%20Constraints%20and%20Oppor
tunities.pdf> [Accessed 13/06/2013].
Pote, P., 2008. Technical Constraints to Smallholder Agriculture: Case study of Nkonkobe
Municipality, Eastern Cape, South Africa. Msc. University of Fort Hare.
Pretty, J.N., Morison, J.I.L. and Hine, R.E. 2003. Reducing food poverty by increasing
agricultural sustainability in developing countries. Agriculture, Ecosystems and Environment,
95:217-234.
Prinz, D., 2002. The role of water harvesting in alleviating water scarcity in arid areas. Keynote
lecture, proceedings, international conference on water resources management in arid regions.
23‐27 March 2002, Kuwait Institute for scientific research. Kuwait, 3: 107‐22.

126
Provide Project Background Paper (PPBP), 2005. A profile of the Eastern Cape Province:
Demographics, Poverty, Inequality and Unemployment. Cape Town: Elsenburg.
Rogers, E., 1995. Diffusion of innovation. 4th edition. New York: Free Press.
Senkondo, E.M.,Mdoe, N.S., Hatibu, N., Mahoo,H. and Gowing, J., 1998. Factors affecting the
adoption of Rain Water Harvesting technologies in Western Pare Lowlands of Tanzania. J.
Agric. S (1): 81-89.
Sithole, N., Lagat, J. and Masuku, B., 2014. Factors influencing farmers participation in
smallholder irrigation schemes: The case of Ntfonjeni Rural Development Area in Swaziland.
Journal of Economics and Sustainable Development, 5(22): 201-12.
Shikur, A. and Beshah, T., 2012. Analysis of influencing factors in adoption of rainwater
harvesting technology to combat the ever changing climate variability in Lanfuro Woreda,
Southern region, Ethiopia. Wudpecker Journal of Agricultural Research, 2(1):15-27.
Smith, L. C. and Ali, S., 2007. Measuring Food Security Using Household Expenditure
Surveys. Food Security in Practice technical guide series. Washington, D.C.: International Food
Policy Research Institute.
South African Explorer, 2013. Alice map. Available at<http://www.saexplorer.co.za/south-
africa/map/alice_map.asp> [Accessed 05/06/2013].
Sunding, D. and Zilberman, D., 2000. The Agricultural Innovation Process:Research and
Technology Adoption in a Changing Agricultural Sector. Handbook of Agricultural Economics,
1: 207-61.
Sibanda, M., 2009. Assessment of livelihoods, market size and potential adoption of open
pollinated varieties (OPVs) of maize at Zanyokwe and Kieskamahoek in Eastern Cape
Province. Msc. University of Fort Hare.
Statistics South Africa., 2013. Census 2011 Agricultural households key highlights. Pretoria:
Statistics South Africa.

127
Swindale, A. and Bilinsky, P., 2006. Household Dietary Diversity Score (HDDS) for
Measurement of Household Food Access: Indicator Guide VERSION 2. Washington, D.C.: FHI
360/FANTA.
Tesfay, N.H., 2008. Rainwater Harvesting in Ethiopia: Technical and socio-economic potentials
and constraints for adoption in Wukro District resources. Msc. Alemaya University.
Unganai, L. 2005. Coping with drought and climate change. Available
at:<http://www.thegef.org/gef/sites/thegef.org/files/documents/document/Zimbabwe%20Droug
ht%20and%20CCA_%20UNDP_SCCF.pdf > [Accessed 13/04/2013].
van Averbeke, W., 2008. Best Management Practices for Sustainable Subsistence Farming on
Selected Irrigation Schemes and Surrounding Areas through Participatory Adaptive Research in
Limpopo Province. WRC Report No. TT 344/08. Water Research Commission, 56 (2): 318.
van Averbeke,W. Denison. J. and Mnkeni, P., 2011. Smallholder irrigation schemes in South
Africa: a review of knowledge generated by the water research commission. Water South
Africa, 5 (37): 356-73.
van der Horst, B., 2013. A socio-technical feasibility study for an irrigation system in Guquka,
South Africa. Msc. Wageningen University.
Vengayi, C., 2009. Institutional constraints to smallholder agriculture: A case study of
Nkonkobe Municipality, Eastern Cape, South Africa. Msc. University of Fort Hare.
von Braun, J., 2007. Food security and Agriculture. Available at:
<www.sasix.co.za/files/sectors/food.pdf> [ Access 13/04/2013].
Water Research Commission (WRC), 2007. An improved soil survey technique for delineating
land suitable for IRWH. Available
at:<http://www.ewisa.co.za/misc/WRC_Facts/InfieldrainwaterharvestingA4.pdf> [Accessed
10/07/2013].

128
Wenhold, F., Faber, M., van Averbeke, W., Oelofse, A., van Jaarveld, P., Jansen van Rensberg,
W., van Heerden, I and Slabbert, R., 2007. Linking smallholder agriculture and water to
household food security and nutrition. Water South Africa, 33(3):327-36.
White, I., 2012. A theoretical framework for understanding factors that contribute to household
adoption of rainwater harvesting in south east Queensland. Available
at:<http://www.ctahr.hawaii.edu/hawaiirain/Library/papers/White_Ian.pdf> [Accessed
30/06/2013].
Woyessa, Y.E., Pretorius, E., Hensley, M. L., van Rensburg, D. and van Heerden, P.S., 2006.
Up-scaling of rain-water harvesting for crop production in the communal lands of the Modder
River basin in South Africa: Comparing upstream and downstream scenarios. Water South
Africa, 32(2): 223-28.
Woyessa, Y.E., Hensley, M. and van Rensburg, L.D., 2007. Catchment management in the
semi-arid area of central South Africa: Implications for River Basin Management. Water South
Africa, 32 (5): 648-54.
World Bank, 1986. Poverty and Hunger: Issues and Options for Food Security in Developing
Countries. A World Bank Policy Study. Washington D.C. :World Bank.
Yengoh, G.T., Ato, A.F. and Svensson, M.G., 2010. Technology Adoption in Small-Scale
Agriculture: The Case of Cameroon and Ghana. Science, Technology and Innovation Studies, 5
(2): 21–28.

129
APPENDIX 1
HOUSEHOLD SURVEY QUESTIONNAIRE
UNIVERSITY OF FORT HARE
Masters (Agricultural Economics)
Socio-economic factors influencing the adoption of IRWH technology in
enhancing household food security by smallholder farmers in the Nkonkobe
Municipality, Eastern Cape Province
KEY HOUSEHOLD QUESTIONNAIRE
NB: The information captured by this instrument will be treated with high level of privacy
and confidentiality.
BACKGROUND INFORMATION
Date………………………………………..Interviewer…………………………………………..……
Name of village……………………………Name of respondent (optional) …...………………….…..
Questionnaire number …………………………………………………………………………………..
Fill in the relevant information and where possible mark with an X
A.1 Gender A.2 Age (years) A.3 Education A.4 Household size
1) M 0)F 1) 31-40
2) 41-50
3) 51 and above
1) Never went to
school
2) Primary
3) High school
4) Tertiary
< 16 16-60 60> Total
1) 2) 3)
A.5 What is your employment status, total monthly income and source of income?
Employment status Income earned Source of income Amount (R)
1) Not employed 1) < R 500 1) Salaries and wages
2) Informally
employed
2) R 500 – R 1499 2) Self employed
3 )Formally
employed
3) R 1500 – R 2999 3) Child support grant
4) Pensioner 4) R 3000 –R 4999 4) Old age pension
5) Other (specify) 5) R 5000 – R 9999 5) Retirement pension
6) Remittances
7) Agriculture
8) Other (specify)
Total

130
A.6 Do you keep any livestock?
A.7 If Yes, which livestock do your household keep and indicate numbers owned?
Type owned Numbers owned
1) Poultry (Chicken)
2) Rabbits
3) Goats
4) Sheep
5) Pigs
6) Cattle
Other (specify)………………..
A.8 Do you have access to secure tenure?
A.9 If Yes, what tenure you hold, please tick
1) Bought (Title deed)
2) Leased
3) Inherited
4) Allocated by the chief
5) Renting and /or sharecropping
6) Other (specify)
A.10 How many hectares is your arable land? (ha)……………………………………………….
A.11 If No, to A8, state the problem(s)
…………………………………………………………………………………………………….
A.12 Do you have enough knowledge about IRWH technology?
A.13 If Yes, who is your source of information
A.14 If No, to A12, state the problem(s)
……………………………………………………………………………………………………..
1.Y 0. N
1.Y 0. N
1.Y 0.N
1) ARC
2) Extension officer
3) Other farmers
4) Other (specify)
…………………………

131
A.15 Do you have access to extension services?
A.16 If Yes, what assistance extension services do you receive with regards to IRWH
technology?
…………………………………………………………………………………………….……….
……………………………………………………………………………………………………..
A.17 How often does extension officers visit your farm? Please tick
1) Once a week
2) Once a fortnight
3) Once a month
4) Twice a month
5) Never
A.18 Do you currently practice IRWH technology?
A.19 If Yes, for how long? ……………………………………………………………………….
A.20 If No, to A15 state the problem (s)
……………………………………………………………………………………………..………
……………………………………………………………………………………………………..
A.21 Have you received any training/workshop with regards to IRWH
technology?
A.22 If Yes, what training did you received?
……………………………………………………………………………………………………..
……………………………………………………………………………………………………..
A.23 How do you harvest water? Please tick
1) Tank
2) Through a 2m wide strip and stored in 1m basin
3) Other: specify …………………………………………..
1.Y 0.N
1.Y 0.N
1.Y 0.N

132
A.24 Please indicate which crops were produced by household in 2012/2013 season
Crops Quantity produced
1) Onion
2) Cabbage
3) Spinach
4) Carrot
5) Tomatoes
6) Green pepper
7) Beetroot
8) Beans
9) Maize
10) Cauliflower
11) Other (specify)
……………………………
A.25 Do you sell your produce?
A.26 If Yes, where do you sell? ……………………………………………………………….….
A.27 How far is it to get to your main market? State km
A.28 How much quantity sold and consumed in the household? Fill table below
Crops Quantity
produced
Quantity sold Quantity consumed
1) Onion
2) Cabbage
3) Spinach
4) Carrot
5) Tomatoes
6) Green pepper
7) Beetroot
8) Beans
9) Maize
10) Cauliflower
11) Other (specify)
…………………
A.29 How much do you get per month from selling your produce? Please tick
Amount
1) R0.00
1.Y 0.N
1.Less than 30km 0. Above 30km

133
2) < R300.00
3) R600.00 – R1199.00
A.30 If No, to A25 state the problem (s)
……………………………………………………………………………………………………………………
……………………………………………………………………………………………………………………
A.31 Do you have access to credit?
A.32 If Yes, where do you acquire loans? Please tick
1) Commercial bank
2) Agric.Co-op
3) Other (specify)
…………………………………………….
A.33 If No, to A 31 state the problem (s)
……………………………………………………………………………………………………………………
……………………………………………………………………………………………………………………
A.34 Do you hire labour for farming?
A.35 If No, state the problem (s)
……………………………………………………………………………………………………………………
……………………………………………………………………………………………………………………
A.36 Is your garden fenced?
A.37 If No, state the problem (s)
……………………………………………………………………………………………………………………
……………………………………………………………………………………………………………………
A.38 Do you have any other source of water for irrigation?
A.39 If Yes, what is your source of water for irrigation and their total walking distance in
minutes from the household?
1.Y 0.N
1.Y 0. N
1.Y 0. N
1.Y 0. N

134
Water source 1)
River/stream
2) Tap
water
3) Bore
hole
4) Spring
Rainwater
5) Other specify
…………………
Total walking
distance in minutes
A.40 What are your general perceptions about IRWH technology?
A.41 If Positive, why?
……………………………………………………………………….……………………………
A.42 If Negative, why?
…………………………………………………………………………….………………………
A.43 In general, what are the problems and constraints that you encounter with regards to
IRHW technology?
….….................................................................................................................................................
Food Security status: Household dietary diversity score
Which of the following items did your household consume as part of a meal or snack,
YESTERDAY (24 hour period)?
Question no. and
Food group
Example Yes
(1)
No
(0)
A. Cereals bread, noodles, biscuits, cookies or any other foods
made from millet, sorghum, maize, rice, wheat +
insert local foods e.g. ugali, nshima, porridge or
pastes or other locally available grains
B. Vitamin A rich
vegetables and
tubers
pumpkin, carrots, squash, or sweet potatoes that are
yellow or orange inside + other locally available
vitamin-A rich vegetables
C. White tubers and
roots
White potatoes, white yams, cassava, or foods made
from roots.
D. Dark green leafy
vegetables
Sweet pepper, dark green/leafy vegetables,
including wild ones + locally available vitamin-A
rich leaves such as cassava leaves etc.
E. Other vegetables including wild vegetables
F. Vitamin A rich
fruits
Ripe mangoes, papayas, other locally available
vitamin A-rich fruits
1.Positive 0.Negative

135
G. The fruits other fruits, including wild fruits
H. Meat beef, pork, lamb, goat, rabbit, wild game, chicken,
duck, or other birds, liver, kidney, heart or other
organ meats or blood-based foods
I. Eggs fresh or dried fish or shellfish
J. Legumes, nuts
and seeds
beans, peas, lentils, nuts, seeds or foods made from
these
K. Milk and milk
products
milk, cheese, yogurt or other milk products
L. Oils and fats oil, fats or butter added to food or used for cooking
M. Sweets sugar, honey, sweetened soda or sugary foods such
as chocolates, sweets or candies
N. Spices and
caffeine or
alcoholic
beverages
spices, coffee, tea, alcoholic beverages or local
examples
O. Other
Y
(1)
N
(0)
1. Did you or anyone in your household eat anything (meal or snack) OUTSIDE
of the home yesterday?
Source: FAO, 2011
THANK YOU FOR YOUR COOPERATION

136
APPENDIX 2
Summation of food groups consumed by members of the household.
HDDS (0-15) Total number of food groups consumed by members of the
household. Values for A through O can be either “0” or “1”.
Sum(A + B + C + D + E + F + G + H + I + J + K + L+M+N+O)
Sum (1 + 1 + 0 + 1 + 1 + 1 + 0 + 1 + 0 + 0 + 1 + 1+1+0+0)
Average HDDS =Sum (HDDS)
Total number of households
=8+6+5+4+6+5+7+5+4+3+5+6+5+4+5+5+4+8+5+5+7+3+5+6+5+4+8+6+5+4+
4+5+6+5+6+7+4+5+6+6+7+5+4+8+6+6+4+6+7+5+5+3+5+4+8+5+6+7+4+4+5
+3+4+5+5+4+5+5+5+6+7+4+5+6+5+7+5+4+5+3+3+5+4+3+5+5+6+3+5+5+5+
4+8+5+6+7+4+6+4+3+5+6+5+3+3+5+4+5+5+4+3+3+4+5+3+4+5+5+5+4
120
= 601
120
= 5.01