Socio-Economic and Regional Factors of Digital Literacy ...
18
QUALITY INNOVATION PROSPERITY / KVALITA INOVÁCIA PROSPERITA 21/2 – 2017 ISSN 1335-1745 (print) ISSN 1338-984X (online) 124 Socio-Economic and Regional Factors of Digital Literacy Related to Prosperity DOI: 10.12776/QIP.V21I2.942 Nataša Urbančíková, Nataliia Manakova, Ganna Bielcheva Received: 18 July 2017 Accepted: 27 July 2017 Published: 31 July 2017 ABSTRACT Purpose: to study social, economic, demographic, regional factors of digital literacy as a basis of digital prosperity. Methodology/Approach: Three research questions are studied, using regression models for cross-sectional data - Pooling model, Random effects model and Fixed-effects model and the Item Cluster Analysis method. Findings: Age, education, income and household type are the most significant factors of digital literacy, giving rise to the societal digital divide in Slovakia. Less important factors are the city size and the sector of the economy, but only weak is the influence of region, gender and nationality. Research Limitation/implication: Only the contingency tables of the longitudinal surveys were available, so the microanalysis was not possible. Category: Research paper Keywords: digital literacy; digital prosperity; ICT revolution; vulnerable groups; regional disparities
Transcript of Socio-Economic and Regional Factors of Digital Literacy ...

QUALITY INNOVATION PROSPERITY / KVALITA INOVÁCIA PROSPERITA 21/2 – 2017
ISSN 1335-1745 (print) ISSN 1338-984X (online)
124
Socio-Economic and Regional Factors of Digital Literacy
Related to Prosperity
DOI: 10.12776/QIP.V21I2.942
Nataša Urbančíková, Nataliia Manakova, Ganna Bielcheva
Received: 18 July 2017 Accepted: 27 July 2017 Published: 31 July 2017
ABSTRACT
Purpose: to study social, economic, demographic, regional factors of digital literacy as a basis of digital prosperity.
Methodology/Approach: Three research questions are studied, using regression models for cross-sectional data - Pooling model, Random effects model and Fixed-effects model and the Item Cluster Analysis method.
Findings: Age, education, income and household type are the most significant factors of digital literacy, giving rise to the societal digital divide in Slovakia. Less important factors are the city size and the sector of the economy, but only weak is the influence of region, gender and nationality.
Research Limitation/implication: Only the contingency tables of the longitudinal surveys were available, so the microanalysis was not possible.
Category: Research paper
Keywords: digital literacy; digital prosperity; ICT revolution; vulnerable groups; regional disparities

QUALITY INNOVATION PROSPERITY / KVALITA INOVÁCIA PROSPERITA 21/2 – 2017
ISSN 1335-1745 (print) ISSN 1338-984X (online)
125
1 INTRODUCTION ICT PRODUCTIVITY PARADOX
The progress of Information Technology (IT) into all areas of the economy and society has brought dramatic changes and defined the entry into the 21st century as a digital age. The development of information and communication technologies has caused utter structural changes entailing the issue of their impact on economic growth, the rise in labour productivity, cost reduction and improvement of living standards. There are many outlooks on the benefits of IT technology for humanity, and the achievements of the digital economy are accompanied by concerns about future prosperity, the ongoing divide of the world and society on the basis of the digital capabilities, and threats to prosperity due to the loss of typical jobs.
The growth economics hypothetically predicts that investment in ICT drives economic growth. However, several empirical studies on the impact of ICT have produced mixed results, being partly influenced by fairly differing research methodologies and focusing on different countries. In reality, the exploration of the ICT effects has recognised paradoxically stunning little effect on productivity in the first decades of the computer revolution. This is often denoted as productivity paradox (or Solow computer paradox) because the rapid expansion of the information technology in the United States has been accompanied by the deceleration in productivity growth in the 1970s and 80s (Solow, 1987; Baily, 1986; Dewan and Kraemer, 1998; Oliner and Sichel, 2000). The expenditures on ICT have risen in almost all of the world economies while productivity growth has slowed (David, 1990; Rei, 2004).
The paradox could be explained in various ways, e.g. as a result of imprecise traditional productivity measurement of the input-output relationship failing to take into consideration new sources of value. Another presumed important factor of the paradox is dealing with time lags in productivity rise associated with slow technology diffusion, learning requirements or insufficient use of technologies.
Recent statistical approaches have allowed more accurate new data to be compiled, and to quantify the hardly measurable IT impacts to date. Credible explanations could have been documented only over time showing a significant increase in productivity in companies that invested heavily in IT. Ultimately, however, the productivity increased in the period 1995-2000 from average 1.4 to 2.6 percent and it increased even more to about 3.6 percent even further in 2001-2003 (Brynjolfsson and Saunders, 2010). Today, there is already a consensus on the tangible productivity acceleration based on IT revolution as well as on the implication of the time lag caused by the very new demands of learning and using new IT technologies denoted as digital literacy.
2 DIGITAL LITERACY AND DIGITAL PROSPERITY
The ICT innovations and expected boost of productivity are impossible without the investments into worker ICT knowledge and skills. Digital organisations have

QUALITY INNOVATION PROSPERITY / KVALITA INOVÁCIA PROSPERITA 21/2 – 2017
ISSN 1335-1745 (print) ISSN 1338-984X (online)
126
to afford more learning and training than in the other industries. It comes, employees need right IT skills and have to be trained to operate new digital processes, to search and find information effectively, but also to cope with exceptions and to make quick decisions. Digital literacy implies acting in new ways on information in digital form and through new organisational forms (Aral, Brynjolfsson and Van Alstyne, 2006; Brynjolfsson and Brown, 2005). New technology always plays a key role in discovering and determining new skills considered necessary for its enforcement in the economy. Growth driven by IT revolution is of course not possible without encouraging digital literacy and adoption of digital technologies. The deployment of ICT technologies in all the sectors is resulting in a new situation demanding for broad new skills.
Computers have long been regarded as a sole concern of hardware and programming specialists, requiring advanced new skills, what has evoked defensive reactions from the workers and hindered in their massive placement. Later, the Internet diffusion added significant pressure on the use of further Internet literacies. Digital literacy as a term has been first introduced rather generally, as an “ability to understand and to use information from a variety of digital sources”, as required by new digital age (Gilster, 1997). Also, some other authors argue and consider digital literacy as a special kind of mindset or thinking and not only a practical ability to use digital sources effectively.
Over the past three decades, several approaches have emerged to classify old and new literacy skills that are needed in the 21st century in workplaces and have been gradually introduced into education. Already before, computer and information literacy terms have been in use (Bawden, 2001; Behrens, 1994). The computer literacy is related to traditional computers, emphasising practical skills in using computer and software application packages. In comparison, information literacy is focused on the ways, in which information is accessed and evaluated (Martin, 2006), accentuating the location and identification, further evaluation, and use of media.
Also, a skill set can be assigned to digital literacy and one of the esteemed skill designs is named 21st-century skills (Warschauer and Matuchniak, 2010). Today, after many confusing attempts and critical discussions, digital literacy can be considered as an integrating framework of several forms of literacy and skill-sets (Martin, 2006).
Developed countries have therefore introduced digital literacy into general education as the prevalent majority of their citizens become an active element of the digital economy. Lack of digital literacy is a key factor of the low prosperity. The positive aspects of the impact of IT on productivity and growth also cause adverse effects of increasing economic and social disparities and creating a digital divide (Hoffman, 2008). ICT and the Internet have considerable power to strengthen traditional forms of inequality on the basis of uneven access to computer devices and internet and level of digital literacy.
QUALITY INNOVATION PROSPERITY / KVALITA INOVÁCIA PROSPERITA 21/2 – 2017
ISSN 1335-1745 (print) ISSN 1338-984X (online)
127
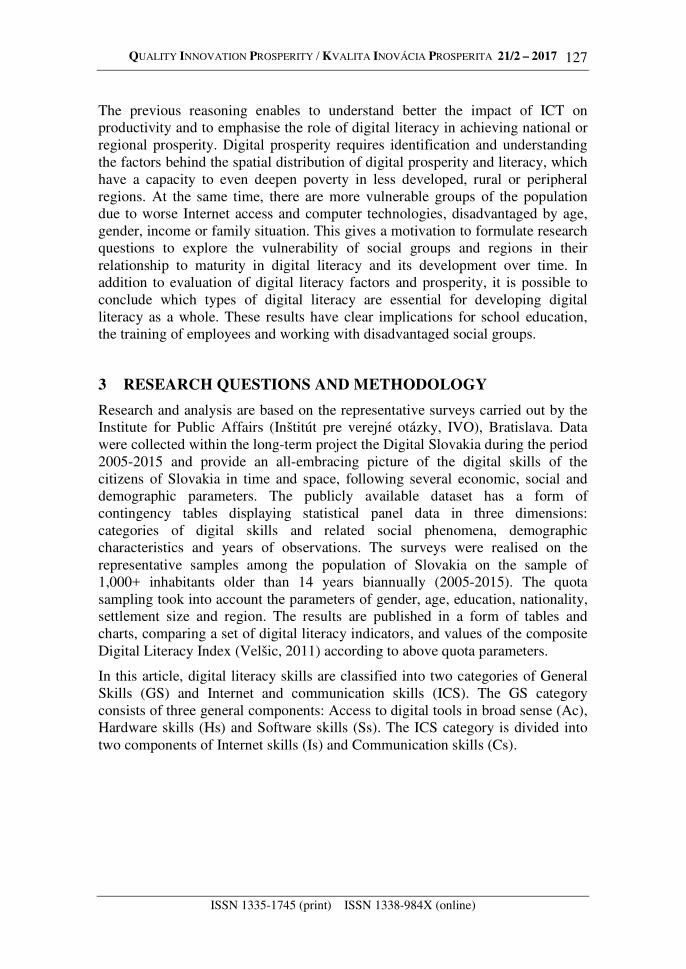
The previous reasoning enables to understand better the impact of ICT on productivity and to emphasise the role of digital literacy in achieving national or regional prosperity. Digital prosperity requires identification and understanding the factors behind the spatial distribution of digital prosperity and literacy, which have a capacity to even deepen poverty in less developed, rural or peripheral regions. At the same time, there are more vulnerable groups of the population due to worse Internet access and computer technologies, disadvantaged by age, gender, income or family situation. This gives a motivation to formulate research questions to explore the vulnerability of social groups and regions in their relationship to maturity in digital literacy and its development over time. In addition to evaluation of digital literacy factors and prosperity, it is possible to conclude which types of digital literacy are essential for developing digital literacy as a whole. These results have clear implications for school education, the training of employees and working with disadvantaged social groups.
3 RESEARCH QUESTIONS AND METHODOLOGY
Research and analysis are based on the representative surveys carried out by the Institute for Public Affairs (Inštitút pre verejné otázky, IVO), Bratislava. Data were collected within the long-term project the Digital Slovakia during the period 2005-2015 and provide an all-embracing picture of the digital skills of the citizens of Slovakia in time and space, following several economic, social and demographic parameters. The publicly available dataset has a form of contingency tables displaying statistical panel data in three dimensions: categories of digital skills and related social phenomena, demographic characteristics and years of observations. The surveys were realised on the representative samples among the population of Slovakia on the sample of 1,000+ inhabitants older than 14 years biannually (2005-2015). The quota sampling took into account the parameters of gender, age, education, nationality, settlement size and region. The results are published in a form of tables and charts, comparing a set of digital literacy indicators, and values of the composite Digital Literacy Index (Velšic, 2011) according to above quota parameters.
In this article, digital literacy skills are classified into two categories of General Skills (GS) and Internet and communication skills (ICS). The GS category consists of three general components: Access to digital tools in broad sense (Ac), Hardware skills (Hs) and Software skills (Ss). The ICS category is divided into two components of Internet skills (Is) and Communication skills (Cs).
QUALITY INNOVATION PROSPERITY / KVALITA INOVÁCIA PROSPERITA 21/2 – 2017
ISSN 1335-1745 (print) ISSN 1338-984X (online)
128
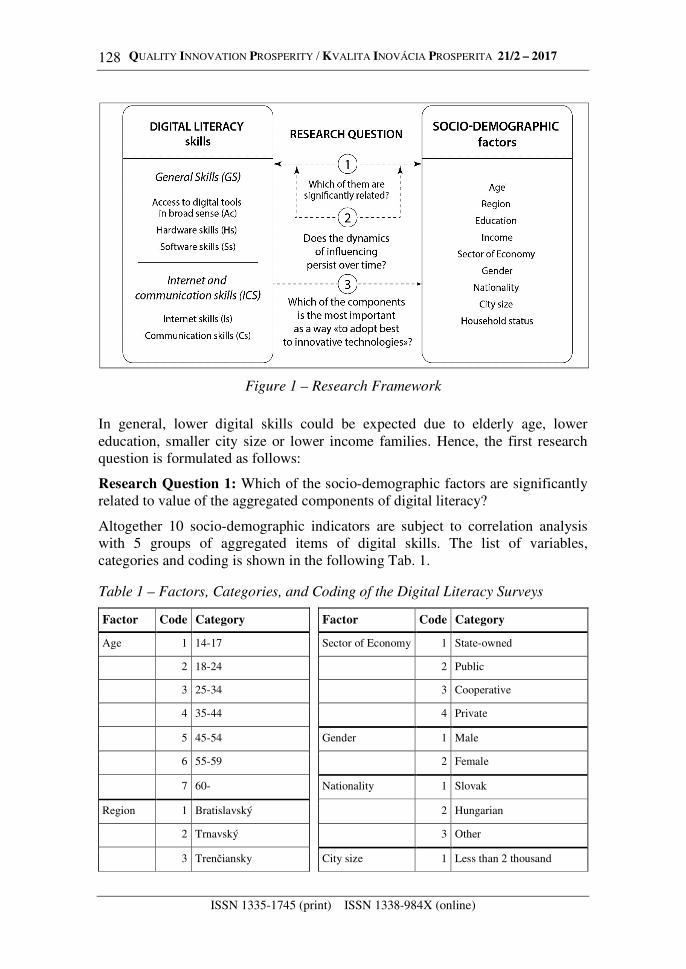
Figure 1 – Research Framework
In general, lower digital skills could be expected due to elderly age, lower education, smaller city size or lower income families. Hence, the first research question is formulated as follows:
Research Question 1: Which of the socio-demographic factors are significantly related to value of the aggregated components of digital literacy?
Altogether 10 socio-demographic indicators are subject to correlation analysis with 5 groups of aggregated items of digital skills. The list of variables, categories and coding is shown in the following Tab. 1.
Table 1 – Factors, Categories, and Coding of the Digital Literacy Surveys
Factor Code Category Factor Code Category
Age 1 14-17 Sector of Economy 1 State-owned
2 18-24 2 Public
3 25-34 3 Cooperative
4 35-44 4 Private
5 45-54 Gender 1 Male
6 55-59 2 Female
7 60- Nationality 1 Slovak
Region 1 Bratislavský 2 Hungarian
2 Trnavský 3 Other
3 Trenčiansky City size 1 Less than 2 thousand

QUALITY INNOVATION PROSPERITY / KVALITA INOVÁCIA PROSPERITA 21/2 – 2017
ISSN 1335-1745 (print) ISSN 1338-984X (online)
129
Factor Code Category Factor Code Category
4 Nitriansky 2 2 - 5 thousand
5 Žilinský 3 5 - 20 thousand
6 Banskobystrický 4 20 - 50 thousand
7 Prešovský 5 50 - 100 thousand
8 Košický 6 Above 100 thousand
Education 1 Elementary Household status 1 Young persons
2 Vocational 2 Young children household
3 Secondary 3 Average age children household
4 Higher 4 Adult children household
Income 1 Very well-off 5 Three-generation household
2 Relatively well-off 6 Elderly household (no children)
3 Average level well-off 7 Senior citizens
4 Inadequately well-off 8 Other household
5 Poor
Of course, it is notable to study how digital skills change over the period of 10 years and what the nature and pattern of the digital skills dynamics are. It might be expected that some factors of digital divide will lose their influence over time. Hence, a special class of regression models for cross-sectional data can be applied to study time effect including fixed effects, random effects and independently pooled time series effects as the second research question:
Research question 2. Does the influence of socio-demographic factors on digital skills level persist over time?
Given the proposed structure of skills, the third research question is dealing with possible improvements in the individual digital literacy and the ways how to set up the education and training effectively. The hierarchical clustering algorithm is used to study the structural relationship between the five components of digital literacy:
Research question 3. Which of the components of digital literacy under study are the most important to focus on to improve universal individual digital literacy as a way to adopt best to innovative technologies?
The original dataset had to be significantly modified, scaled, normalised and aggregated into categories subject to three models.

QUALITY INNOVATION PROSPERITY / KVALITA INOVÁCIA PROSPERITA 21/2 – 2017
ISSN 1335-1745 (print) ISSN 1338-984X (online)
130
The final dataset consisted of three dimensions represented by the variables and corresponding data:
1. Digital skills, aggregated into 5 components: Access to digital tools in broad sense (Ac), Hardware skills (Hs), Software skills (Ss), Internet skills (Is) and Communication skills (Cs).
2. Socio-demographic factors, aggregated into 9 categories of factors (Gender, Age, Education, Income, Nationality, Household status, Sector, Region, City size).
3. G1 as the dependent output variable is based on the answers in the surveys 2005, 2011, 2013, 2015: “How do you adapt and learn to master modern information and communication technologies (computers, the internet, electronic mail, electronic banking, etc.)?” It is supposed, the level of adaptation depends on the individual current computer skills, and directly describes the subjective ability to improve individual digital literacy.
4 DATA SOURCE DESCRIPTION AND BASIC STATISTICS
In accordance with the concept and the framework outlined above, digital skills indicators were selected and grouped into 5 components:
Table 2 – Groups, Components and Variables of Digital Literacy
Group Component Var Skills
GS:
General skills
Ac: Access to digital tools (in wide sense)
Hw1 Working with PC (desktop)
Hw2 Working with a laptop/smartphone
Hw: Hardware skills Hw3 Printing documents on a PC printer
Hw4 Work with the scanner
Hw5 Write data to portable media
Hw6 Install hardware to PC
Hw7 Carrying / Copying Data on LAN
Sw: Software skills Sw1 Working with a word processor
Sw2 Work with a spreadsheet
Sw3 Working with a database program
Sw4 Working with a graphic editor
Sw5 Working with a multimedia program
Sw6 Working with an Internet browser
Sw7 Install software and set up PC features

QUALITY INNOVATION PROSPERITY / KVALITA INOVÁCIA PROSPERITA 21/2 – 2017
ISSN 1335-1745 (print) ISSN 1338-984X (online)
131
Group Component Var Skills
ICS:
Internet and
communication
skills
IS: Internet skills IS1 Search for information and services on the Internet
IS2 Registration of access to information and services on the Internet
IS3 Using Internet Banking
IS4 Purchasing goods or services over the Internet
IS5 Search for different information in LAN
IS6 Download/upload files, data over the Internet
CS: Communication skills
CT1 Send and receive emails
CT2 Chat / video chat communication
CT3 Sending messages from mobile phone/smartphone (SMS, MMS)
CT4 Internet telephony (VoIP)
CT5 Communicating in newsgroups, forums, fanclubs
The general components of digital literacy describe basic skills, including elementary ability to work on a computer, stationary or portable (AC), work with various kinds of software (Sw), and particular skills that enable solving simple hardware issues (Hw). The most important for the concept of digital literacy as a tool for achieving digital prosperity are the skills assigned to the ICS group. Namely, two components of the ICS group (Internet and communication skills) are vital for direct provision of goods and services and communicating with people and institutions.
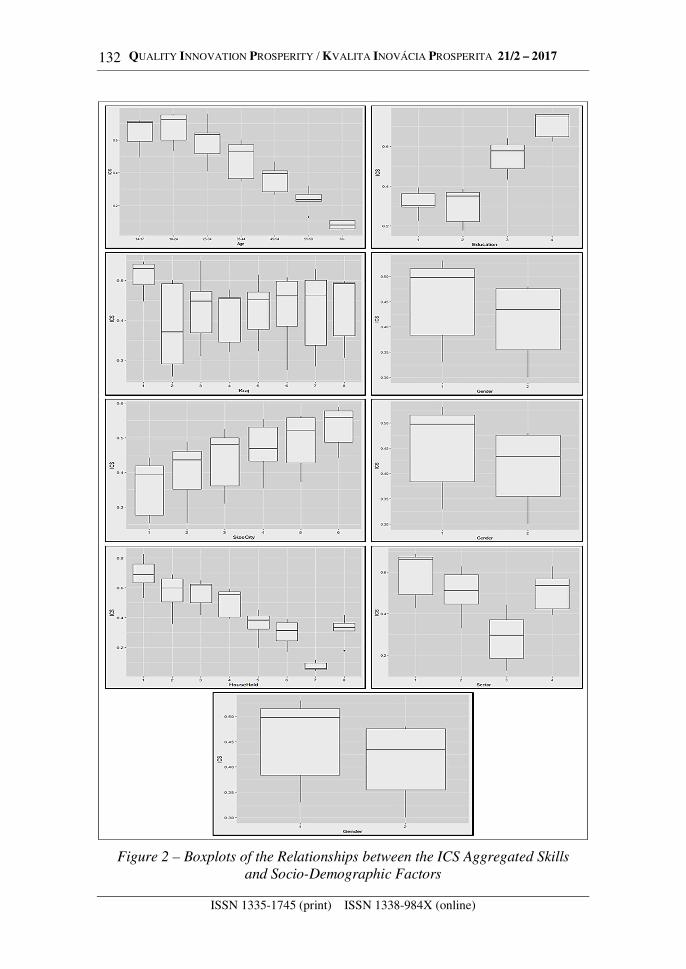
To check the consistency of the grouped skills obtained from the surveys, Alfa Cronbach values were calculated showing high internal consistency in all variables (alpha values always greater than 0.90). The relation between aggregated ICS group skills and 9 socio-demographic factors are visualised in the following pictures (Fig.2).
QUALITY INNOVATION PROSPERITY / KVALITA INOVÁCIA PROSPERITA 21/2 – 2017
ISSN 1335-1745 (print) ISSN 1338-984X (online)
132
Figure 2 – Boxplots of the Relationships between the ICS Aggregated Skills
and Socio-Demographic Factors
QUALITY INNOVATION PROSPERITY / KVALITA INOVÁCIA PROSPERITA 21/2 – 2017
ISSN 1335-1745 (print) ISSN 1338-984X (online)
133
The visual difference between the average values of individual socio-demographic factors is suggesting confirmation of the influence of the relevant factors on internet and communication skills such as age, education, income or city size. Digital divide and its borderlines can be seen immediately as a positive or negative correlation. Because of different type of variables (binary, nominal, ordinal), different measures of correlation or association testing have to be applied. A more detailed exploration of dependencies and dynamics following the research questions is presented in the following section.
5 STATISTICAL ANALYSIS AND RESULTS
Correlations between the socio-demographic variables (ordinal, nominal or binary scale) and the five components of digital literacy (interval scale) (Research question 1) require the use of different methods.
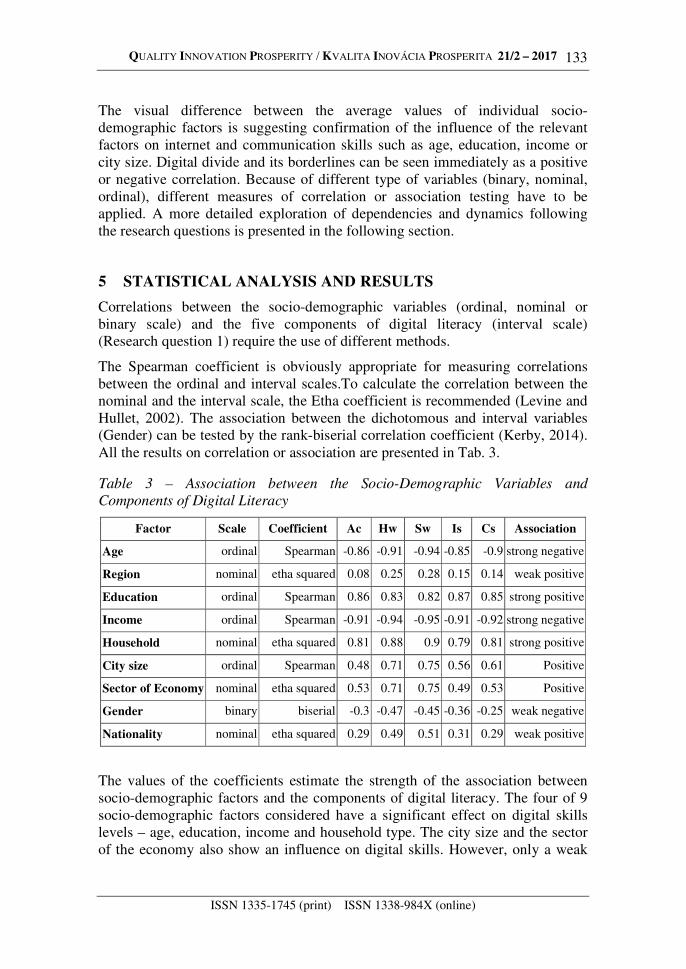
The Spearman coefficient is obviously appropriate for measuring correlations between the ordinal and interval scales.To calculate the correlation between the nominal and the interval scale, the Etha coefficient is recommended (Levine and Hullet, 2002). The association between the dichotomous and interval variables (Gender) can be tested by the rank-biserial correlation coefficient (Kerby, 2014). All the results on correlation or association are presented in Tab. 3.
Table 3 – Association between the Socio-Demographic Variables and
Components of Digital Literacy
Factor Scale Coefficient Ac Hw Sw Is Cs Association
Age ordinal Spearman -0.86 -0.91 -0.94 -0.85 -0.9 strong negative
Region nominal etha squared 0.08 0.25 0.28 0.15 0.14 weak positive
Education ordinal Spearman 0.86 0.83 0.82 0.87 0.85 strong positive
Income ordinal Spearman -0.91 -0.94 -0.95 -0.91 -0.92 strong negative
Household nominal etha squared 0.81 0.88 0.9 0.79 0.81 strong positive
City size ordinal Spearman 0.48 0.71 0.75 0.56 0.61 Positive
Sector of Economy nominal etha squared 0.53 0.71 0.75 0.49 0.53 Positive
Gender binary biserial -0.3 -0.47 -0.45 -0.36 -0.25 weak negative
Nationality nominal etha squared 0.29 0.49 0.51 0.31 0.29 weak positive
The values of the coefficients estimate the strength of the association between socio-demographic factors and the components of digital literacy. The four of 9 socio-demographic factors considered have a significant effect on digital skills levels – age, education, income and household type. The city size and the sector of the economy also show an influence on digital skills. However, only a weak

QUALITY INNOVATION PROSPERITY / KVALITA INOVÁCIA PROSPERITA 21/2 – 2017
ISSN 1335-1745 (print) ISSN 1338-984X (online)
134
influence relates to factors of region, gender and nationality, which are therefore detached from the further consideration.
In the second research question, the dynamics of the socio-demographic factors influence is tested. Three most-known regression models are selected for the analysis: Pooling model, Random effects model and Fixed-effects model. All three models can be written in the form:
yit=α+x’itβ+z’iγ+ci+uit (1)
whereby
i refers to a cross-sectional unit such a household;
t refers to a unit of time such as a year from 2005 till 2013;
x’it is a time-varying explanatory variable such a category of digital skills;
z’i is a time-invariant explanatory variable such a socio-demographic factor;
β and γ are coefficients related to type explanatory variables above;
ci is within cross-sectional unit error, that is time-invariant but varies across cross-sections;
uit is between cross-sectional unit error, that varies over time and households (our cross-sectional units), and is a truly stochastic error term.
Pooling model (P) assumes that the groups or objects under consideration do not have individual differences, that is, the data can be viewed as a general time series, without a panel structure, so it is assumed ci.= 0. In the fixed-effect model (FE), each unit is considered "unique" and cannot be regarded as a result of a random choice from a certain general population, so it is assumed ci. depends on xi. This approach is often confirmed when the cross-sectional units under study have important time-invariant differences that persist over time. If the objects are in the panel "accidentally" as a result of sampling from a large population (so ci and uit depend on xi), then the model with a random effect (RE) is acceptable.
Standard hypothesis testing techniques make possible to choose a model taking into consideration hierarchy among them. The pooling model P is a special case of both models FE and RE. Also, the model with random effects RE can be regarded as a special case of the model with fixed effects FE.
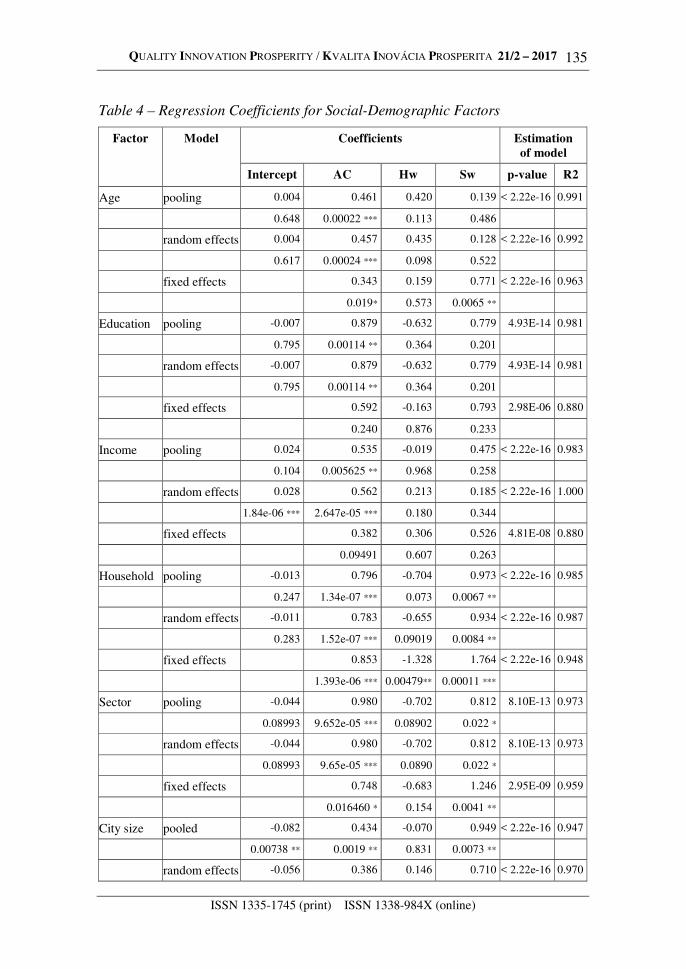
When testing the statistical hypotheses for the choice of the model, the null hypothesis is stated as validity of a narrower model, and the alternative hypothesis relates to a more general model. Thus, the model and its coefficients are tested to determine their significance. The Tab. 4 displays the coefficients of the three models for significant social-demographic factors: age, education, income, household type, employment sector and city size.
QUALITY INNOVATION PROSPERITY / KVALITA INOVÁCIA PROSPERITA 21/2 – 2017
ISSN 1335-1745 (print) ISSN 1338-984X (online)
135
Table 4 – Regression Coefficients for Social-Demographic Factors
Factor Model Coefficients Estimation
of model
Intercept AC Hw Sw p-value R2
Age pooling 0.004 0.461 0.420 0.139 < 2.22e-16 0.991
0.648 0.00022 *** 0.113 0.486
random effects 0.004 0.457 0.435 0.128 < 2.22e-16 0.992
0.617 0.00024 *** 0.098 0.522
fixed effects 0.343 0.159 0.771 < 2.22e-16 0.963
0.019* 0.573 0.0065 **
Education pooling -0.007 0.879 -0.632 0.779 4.93E-14 0.981
0.795 0.00114 ** 0.364 0.201
random effects -0.007 0.879 -0.632 0.779 4.93E-14 0.981
0.795 0.00114 ** 0.364 0.201
fixed effects 0.592 -0.163 0.793 2.98E-06 0.880
0.240 0.876 0.233
Income pooling 0.024 0.535 -0.019 0.475 < 2.22e-16 0.983
0.104 0.005625 ** 0.968 0.258
random effects 0.028 0.562 0.213 0.185 < 2.22e-16 1.000
1.84e-06 *** 2.647e-05 *** 0.180 0.344
fixed effects 0.382 0.306 0.526 4.81E-08 0.880
0.09491 0.607 0.263
Household pooling -0.013 0.796 -0.704 0.973 < 2.22e-16 0.985
0.247 1.34e-07 *** 0.073 0.0067 **
random effects -0.011 0.783 -0.655 0.934 < 2.22e-16 0.987
0.283 1.52e-07 *** 0.09019 0.0084 **
fixed effects 0.853 -1.328 1.764 < 2.22e-16 0.948
1.393e-06 *** 0.00479** 0.00011 ***
Sector pooling -0.044 0.980 -0.702 0.812 8.10E-13 0.973
0.08993 9.652e-05 *** 0.08902 0.022 *
random effects -0.044 0.980 -0.702 0.812 8.10E-13 0.973
0.08993 9.65e-05 *** 0.0890 0.022 *
fixed effects 0.748 -0.683 1.246 2.95E-09 0.959
0.016460 * 0.154 0.0041 **
City size pooled -0.082 0.434 -0.070 0.949 < 2.22e-16 0.947
0.00738 ** 0.0019 ** 0.831 0.0073 **
random effects -0.056 0.386 0.146 0.710 < 2.22e-16 0.970

QUALITY INNOVATION PROSPERITY / KVALITA INOVÁCIA PROSPERITA 21/2 – 2017
ISSN 1335-1745 (print) ISSN 1338-984X (online)
136
Factor Model Coefficients Estimation
of model
Intercept AC Hw Sw p-value R2
0.015539 * 0.001787 ** 0.625 0.0274 *
fixed effects 0.302 -0.017 1.216 3.32E-12 0.929
0.131 0.966 0.0041 **
Comparison of the models exploits three different tests:
1. The standard F-test: fixed effects model against pooling regression. Null hypothesis: the pooling model is correct/fixed effects model is incorrect.
2. The Hausman test: fixed effects model against random effects model. Null hypothesis assumes consistency of the coefficients in both models. If rejected, the coefficients are untenable in the RE model.
3. The Breusch-Pagan test: random effects model against pooling regression. Null hypothesis assumes the pooling regression is correct.
Table 5 – Testing of the Dynamics of the Socio-Demographic Factors over Time
Test F-test H-test BP-test Conclusion
H0: Pooling RE Pooling
H1: FE FE RE
Age 0.059 0.001 0.663 fixed effect model is significant
H0 H1 H0
Education 0.867 0.924 0.155 random effect model is significant
H0 H0 H0
Income 0.6615 0.2931 0.09201 random effect model is significant
H0 H0 H0
Household 0.0811 0.002716 0.6645 fixed effect model is significant
H0 H1 H0
Sector 0.2183 0.05028 0.6674 random effect model is significant
H0 H0 H0
SizeCity 0.6262 0.02398 0.2791 fixed effect model is significant
H0 H1 H0
The model with fixed effects well represents three factors of Age, Household type and City size showing individual group differences. In other words, the differences of the digital skills in groups divided by Age, City Size, and
QUALITY INNOVATION PROSPERITY / KVALITA INOVÁCIA PROSPERITA 21/2 – 2017
ISSN 1335-1745 (print) ISSN 1338-984X (online)
137
Household Type are significant and time invariant. By contrast, Education, Sector of economy and Income are well described by the random effects model indicating the differences in the groups are not confirmed. Progressing Internet accessibility and affordability have brought lower dependence of Digital skills on higher education, income or special skills related to the sector of employment.
At last, the Research Question 3 is studied, namely which of the components of digital literacy is the most important for increasing individual digital literacy as a way to adapt to innovative technologies. In other words, to figure out, which digital skills have a potential to serve as means to overcome the societal digital divide and to increase individual digital literacy. To understand the role of the single digital skills in improving digital literacy, the indicator of adaptation to digital tools (denoted below as Adapt) is employed.
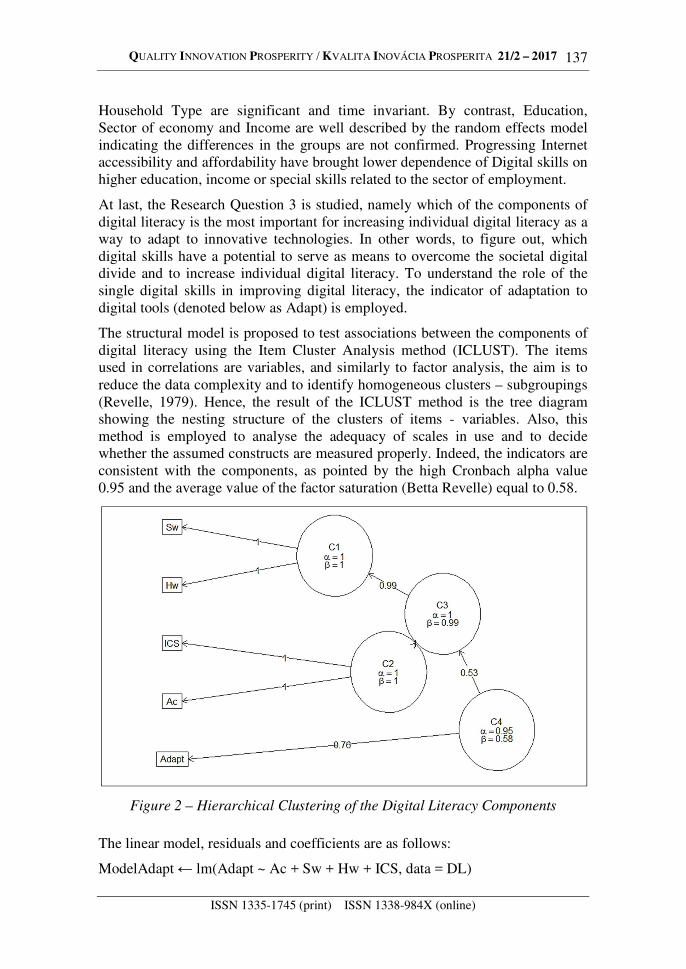
The structural model is proposed to test associations between the components of digital literacy using the Item Cluster Analysis method (ICLUST). The items used in correlations are variables, and similarly to factor analysis, the aim is to reduce the data complexity and to identify homogeneous clusters – subgroupings (Revelle, 1979). Hence, the result of the ICLUST method is the tree diagram showing the nesting structure of the clusters of items - variables. Also, this method is employed to analyse the adequacy of scales in use and to decide whether the assumed constructs are measured properly. Indeed, the indicators are consistent with the components, as pointed by the high Cronbach alpha value 0.95 and the average value of the factor saturation (Betta Revelle) equal to 0.58.
Figure 2 – Hierarchical Clustering of the Digital Literacy Components
The linear model, residuals and coefficients are as follows:
ModelAdapt ← lm(Adapt ~ Ac + Sw + Hw + ICS, data = DL)
QUALITY INNOVATION PROSPERITY / KVALITA INOVÁCIA PROSPERITA 21/2 – 2017
ISSN 1335-1745 (print) ISSN 1338-984X (online)
138
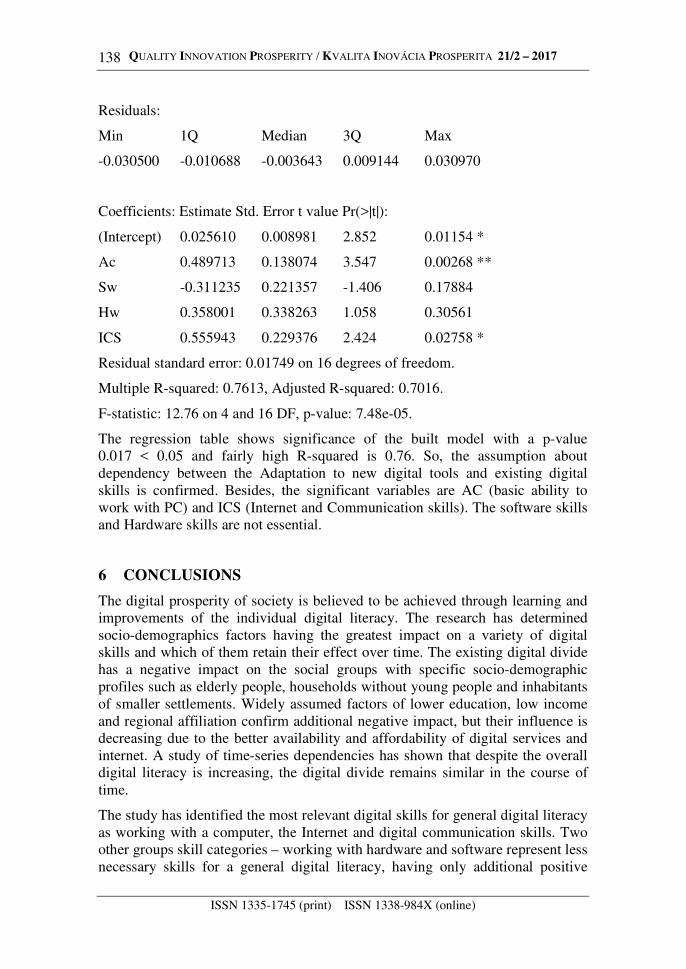
Residuals:
Min 1Q Median 3Q Max
-0.030500 -0.010688 -0.003643 0.009144 0.030970
Coefficients: Estimate Std. Error t value Pr(>|t|):
(Intercept) 0.025610 0.008981 2.852 0.01154 *
Ac 0.489713 0.138074 3.547 0.00268 **
Sw -0.311235 0.221357 -1.406 0.17884
Hw 0.358001 0.338263 1.058 0.30561
ICS 0.555943 0.229376 2.424 0.02758 *
Residual standard error: 0.01749 on 16 degrees of freedom.
Multiple R-squared: 0.7613, Adjusted R-squared: 0.7016.
F-statistic: 12.76 on 4 and 16 DF, p-value: 7.48e-05.
The regression table shows significance of the built model with a p-value 0.017 < 0.05 and fairly high R-squared is 0.76. So, the assumption about dependency between the Adaptation to new digital tools and existing digital skills is confirmed. Besides, the significant variables are AC (basic ability to work with PC) and ICS (Internet and Communication skills). The software skills and Hardware skills are not essential.
6 CONCLUSIONS
The digital prosperity of society is believed to be achieved through learning and improvements of the individual digital literacy. The research has determined socio-demographics factors having the greatest impact on a variety of digital skills and which of them retain their effect over time. The existing digital divide has a negative impact on the social groups with specific socio-demographic profiles such as elderly people, households without young people and inhabitants of smaller settlements. Widely assumed factors of lower education, low income and regional affiliation confirm additional negative impact, but their influence is decreasing due to the better availability and affordability of digital services and internet. A study of time-series dependencies has shown that despite the overall digital literacy is increasing, the digital divide remains similar in the course of time.
The study has identified the most relevant digital skills for general digital literacy as working with a computer, the Internet and digital communication skills. Two other groups skill categories – working with hardware and software represent less necessary skills for a general digital literacy, having only additional positive

QUALITY INNOVATION PROSPERITY / KVALITA INOVÁCIA PROSPERITA 21/2 – 2017
ISSN 1335-1745 (print) ISSN 1338-984X (online)
139
influence and representing skills which remain indispensable to selected groups of IT professionals.
The digital economy and society development requires higher digital literacy, and several social-demographics factors represent typical factors of exclusion. To ensure democratic principles towards to digital prosperity, it is supposed to provide equal opportunities to all demographic groups. This is the role of the government and regional stakeholders, to shape the education, learning and trainings having capacity in reducing the divide. The study gives several hints on sensitive socio-demographic factors of digital divide, as well as about the key areas of intervention.
ACKNOWLEDGMENTS
This work was supported by the project of Ministry of Education of the Slovak Republic: VEGA-1/0454/15 “Redefining regional development - moving towards resilient regions” and by the project of the Slovak Research and Development Agency APVV-14-0512 "Universities and economic development of regions – UNIREG".
REFERENCES
Aral, S., Brynjolfsson, E. and Van Alstyne, M., 2006. Information, Technology and Information Worker Productivity: Task Level Evidence. In: Proceedings of
the 27th Annual International Conference on Information Systems. Milwaukee, Wisconsin, USA, 9-10 December 2006.
Bawden, D., 2001. Information and digital literacies: a review of concepts. Journal of Documentation, [e-journal] 57(2), pp.218-259. http:/dx.doi.org/10.1108/EUM0000000 007083.
Baily, M.N., 1986. What has happened to productivity growth?. Science, [e-journal] 234(4775), pp.443 - 451. http:/dx.doi.org//10.1126/science.234. 4775.443.
Behrens, S., 1994. A conceptual analysis and historical overview of information literacy. College and Research Libraries, [e-journal] 55(4), pp.309 - 322. http://dx.doi.org/10. 5860/crl_55_04_309.
Brynjolfsson, E. and Brown, P., 2005. VII Pillars of IT Productivity. Optimize, 4(5), pp.26-35.
Brynjolfsson, E. and Saunders, A., 2010. Wired for innovation: how information
technology is reshaping the economy. London: The MIT Press.
David, P.A., 1990. The Dynamo and the Computer: A Historical Perspective on the Modern Productivity Paradox. The American Economic Review, [e-journal] 80(2), pp.355 - 361. http://dx.doi.org/10.1108/17410401011006086.

QUALITY INNOVATION PROSPERITY / KVALITA INOVÁCIA PROSPERITA 21/2 – 2017
ISSN 1335-1745 (print) ISSN 1338-984X (online)
140
Dewan, S. and Kraemer, K.L., 1998. International dimensions of the productivity paradox. Communications of the ACM, [e-journal] 41(8). pp. 56 - 62. http://dx.doi.org/ 10.1145/280324.280333.
Gilster, P., 1997. Digital literacy. New York: John Wiley & Sons Inc.
Hoffman, R., 2008. Socioeconomic differences in old age mortality. Dordrecht: Springer.
Kerby, D.S., 2014. The simple difference formula: An approach to teaching nonparametric correlation. Comprehensive Psychology, [e-journal] 3(1), pp.1 - 9. http://dx.doi.org/10.2466/11.IT.3.1.
Levine, T.R. and Hullett, C.R., 2002. Eta squared, partial eta squared, and misreporting of effect size in communication research. Human Communication
Research, [e-journal] 28, pp.612 - 625. http://dx.doi.org/10.1111/j.1468-2958.2002.tb00828.x.
Martin, A., 2006. Literacies for the digital age. In: A. Martin and D. Madigan, eds. 2006. Digital literacies for learning.London: Facet Publishing. pp.3-25.
Oliner, S.D. and Sichel, D.E., 1994. Computers and Output Growth Revisited: How Big Is the Puzzle?. Brookings Papers on Economic Activity, 2, pp.273-334.
Rei, C.M., 2004. Causal evidence on the “productivity paradox” and implications for managers. International Journal of Productivity and Performance
Management, [e-journal] 53(2), pp.129 - 142. https://doi.org/10.1108/ 17410400410515034.
Revelle, W., 1979. Hierarchical cluster-analysis and the internal structure of tests. Multivariate Behavioral Research, 14(1), pp.57-74.
Solow, R., 1987. We'd better watch out. New York Times Book Review, 12 p. 36.
Velšic, M., 2011. Digital literacy in Slovakia 2011. In: 9th International
Conference on Emerging eLearning Technologies and Applications (ICETA). Stara Lesna, Slovakia, 27-28 Oct. 2011. http://dx.doi.org// 10.1109/ICETA.2011.6112568.
Warschauer, M and Matuchniak T., 2010. New Technology and Digital Worlds: Analyzing Evidence of Equity in Access, Use, and Outcomes. Review of
Research in Education, [e-journal] 34, pp.179 - 225. http://dx.doi.org//10.3102/0091732X 09349791.

QUALITY INNOVATION PROSPERITY / KVALITA INOVÁCIA PROSPERITA 21/2 – 2017
ISSN 1335-1745 (print) ISSN 1338-984X (online)
141
ABOUT AUTHORS
Nataša Urbančíková is an associate professor at the Department of Regional Science and Management, Faculty of Economics, Technical University of Kosice. Her research is mostly focused on innovation, HRD and management, e-mail: [email protected].
Nataliia Manakova is an associate professor at the Department of Applied Mathematics and Information Technology, O. M. Beketov National University of urban economy in Kharkiv. Her main research topics are information technology, data mining and visualization, statistical and spatial analysis, e-mail: [email protected].
Bielcheva Ganna is a Ph. D student at the Department of Media Systems and Technologies, Faculty of Computer Science, Kharkiv National University of Radioelectronics. Her research is dealing with data mining and visualisation, HRM, e-mail: [email protected].
© 2017 by the authors. Submitted for possible open access publication under the terms and conditions of the Creative Commons Attribution (CC-BY) license (http://creativecommons.org/licenses/by/4.0/).