Socially Responsible Investment Performance in France
34
EDHEC RISK AND ASSET MANAGEMENT RESEARCH CENTRE 393-400 promenade des Anglais 06202 Nice Cedex 3 Tel.: +33 (0)4 93 18 78 24 Fax: +33 (0)4 93 18 78 41 E-mail: [email protected] Web: www.edhec-risk.com Socially Responsible Investment Performance in France December 2008 Noël Amenc Professor of Finance and Director of the EDHEC Risk and Asset Management Research Centre Véronique Le Sourd Senior Research Engineer at the EDHEC Risk and Asset Management Research Centre
Transcript of Socially Responsible Investment Performance in France
EDHEC RISK AND ASSETMANAGEMENT RESEARCH CENTRE
393-400 promenade des Anglais06202 Nice Cedex 3Tel.: +33 (0)4 93 18 78 24Fax: +33 (0)4 93 18 78 41E-mail: [email protected]: www.edhec-risk.com
Socially Responsible Investment Performance in France
December 2008
Noël AmencProfessor of Finance and Director of the EDHEC Risk and Asset Management Research Centre
Véronique Le SourdSenior Research Engineer at the EDHEC Risk and Asset ManagementResearch Centre
In 2008, the EDHEC Risk and Asset Management Research Centre studied the performance of socially responsible investment (SRI) funds distributed in France. It seems to us that the French SRI market makes for a legitimate field of study, what with its great recent expansion. France is home to one of the largest markets for SRI in continental Europe: according to a Eurosif1 2006 report, it is number four in Europe for the amount invested in SRI funds. SRI funds may well account for only 1% of the mutual funds in offer in France, but this share should continue to increase in the coming years. Indeed, this asset class is of great interest to institutional investors in a country where capitalism is not always held in esteem and where there are no pension funds. As it happens, firm savings plans must now offer at least one such fund.
This study covered a six-year period (2002-2007) and focused more specifically on funds invested in assets from France, the Euro zone, and Europe. Using the Fama-French three-factor model to compute alpha, we did not identify alpha values both positive and statistically significant for SRI funds. In fact, for most SRI funds, we obtained negative, but not statistically significant alpha, indicating that SRI security selection in itself does not lead to outperformance. Our results show that SRI fund performance is accounted for instead by style biases and market cycles.
After the results of the study were made public in April 2008, we received some comments from businesses involved in SRI, in particular from Altedia, an investment consulting firm. In April 2008, Altedia also published a short study,2 the main conclusion of which was that SRI funds had outperformed conventional funds over the previous twelve months. When these results were questioned, Altedia defended its conclusions by criticising3 the EDHEC study, especially the sample size and the choice to restrict our study to the French market. Altedia argues that its own study, based on more funds but on a shorter period, offers a more accurate view of the current SRI market. Our study highlighted the results obtained for funds invested in Euro zone assets and showed in an appendix the results obtained for funds invested in assets from France and Europe; Altedia concluded too hastily that our study dealt only with Euro zone funds, which in fact make up only half of our sample.
In addition, Altedia suggested that eliminating young funds, for a six-year study, biased the results and made it impossible to get a view of SRI as it is now. In response to this criticism, we include in the sample for our initial study the group of funds invested in World assets, which we had first set aside because it was more heterogeneous than funds invested in France, Euro zone, and Europe assets. We also perform computations over shorter periods and including a greater number of funds.
The remainder of this document is organised as follows. In the first part, we review the definition of the notion of socially responsible investment, the recent evolution of this definition, and the image conveyed by this type of investment. In the second part, we study the likelihood that the choice of the sample of funds will bias the results of a study of the performance of SRI. In the third part, we look into the influence on the results of the choice of evaluation period. Finally, we examine the conclusions that this study makes it possible to draw about socially responsible investment in France.
Introduction
2 1 - Eurosif (European Social Investment Forum) is an association created in 2001 that covers socially responsible investment issues in Europe. 2 - Magnier and Schaff (2008). 3 - Altedia’s criticism of the EDHEC study is reproduced in appendix 1.

Noël Amenc is Professor of Finance and Director of Research and Development at EDHEC Business School, where he heads the Risk and Asset Management Research Centre. He has a Masters in Economics and a PhD in Finance and has conducted active research in the fields of quantitative equity management, portfolio performance analysis, and active asset allocation, resulting in numerous academic and practitioner articles and books. He is Associate Editor of the Journal of Alternative Investments and a member of the scientific advisory council of the AMF (French financial regulatory authority).
Véronique Le Sourd, has a Master’s degree in Applied Mathematics from the Pierre and Marie Curie University in Paris. From 1992 to 1996, she worked as research assistant in the Finance and Economics department of the French business school HEC and then joined the research department of Misys Asset Management Systems in Sophia Antipolis. She is currently a senior research engineer at the EDHEC Risk and Asset Management Research Centre.
About the authors
3The work presented herein is a detailed summary of academic research conducted by EDHEC. The opinions expressed are those of the authors. EDHEC Business School declines all reponsibility for any errors or omissions.

4
Introduction ……………………………………………………………………………………………………………… 2
1. Socially Responsible Investment from Past to Present …………………………………… 5
2. Does the Population Studied by EDHEC Make it Possible to Draw
Conclusions about SRI in France? ……………………………………………………………………… 7
3. How Credible is the Altedia Study? ……………………………………………………………… 14
4. The Conclusions to be Drawn about SRI in France ………………………………………… 22
Appendix ………………………………………………………………………………………………………………… 24
References ……………………………………………………………………………………………………………… 31
Table of contents

At the outset, the form of investment now known as socially responsible was mainly concerned with ethics and the respect of moral values. It was intended for a niche of investors, such as religious congregations, who wanted to invest in accordance with their moral principles and to avoid such sectors as weapons, alcohol, or tobacco.4
This form of investment has since expanded to a larger audience, evolving from a purely ethical orientation, with complete exclusion of entire investment sectors, to a broader concept, also including investment based no longer on exclusion but on the selection of companies deemed to have the best environmental and social practices. In recent years, investors have been more and more interested in the impact of corporate activity on the environment, as well as in corporate social policy and governance. Asset management companies have seized the opportunity to develop products that attempt to respond to this growing interest.
Investors choosing socially responsible investment thus have a double objective. First, they want to put their money in the companies identified as having the best practices. Second, they also want to increase their savings. As one can easily imagine, this second objective is the main one for a majority of them. So asset management companies have sought to promote socially responsible investment as an investment that makes it possible to perform at least as well as an investment not including extra financial criteria and to provide investors the additional satisfaction of occupying the moral high ground.
Using the Factiva database, we searched the French-language press over a period of more than six years (January 2002-August 2008) for mentions of socially responsible investment (under all its various names) that describe it as a source of added value.
About sixty results, most of them ultimately from asset management firms, associate SRI with performance. These results are not exhaustive, as they are restricted to publications available on Factiva. Between 2004 and 2007, the results are distributed uniformly, but have increased in 2008, with more references over only eight months than over the twelve months of any of the other years. Before 2004, by contrast, there are hardly any results.
We provide here several examples of the most typical of the mentions that have appeared in recent years. According to a survey of 100 institutional investors taken in May 2008 by the consulting firm Seeds Finance, jointly with the French insurance company La Macif, “The expectations [of the institutional investors] who have made SRI a part of their portfolios of assets have to do first with the diversification of this portfolio (26%) and with the benefits of manager alpha”. At the beginning of the year, a wealth management specialist from McKinsey declared: “There are opportunities to be had, in socially responsible or environmental investing, say, that will allow you to maintain your profitability”. In 2004, Dexia Asset Management declared: “Studies show that taking SRI criteria into account costs nothing, so socially responsible added value is ‘free’”. In the same year, the French daily Les Echos published the following comment:5 “As the constraints inherent to socially responsible practices emerge, the companies that were the first to embrace SRI criteria should in theory benefit from positive alpha, which suggests that over the medium term socially responsible investments will outperform”. All these quotations suggest that choosing socially responsible investment will benefit the investor, or at least will not lower the returns on his investments.
1. Socially Responsible Investment from Past to Present
5 4 - A brief history and description of socially responsible investment is provided in many academic articles about SRI. See, for example, the fall 2005 issue of The Journal of Investing, which was devoted entirely to socially responsible investment. 5 - This quotation is from Emmanuel Gautier of the French company Natexis Epargne Entreprises.

6
1. Socially Responsible Investment from Past to Present
6 - On the development of new SRI funds, see Novethic (2007).
However, it is hard to believe that a company that invests in reducing the environmental impact of its business does not experience at least a short-term fall in profits. In addition, as companies are apparently more and more concerned with environmental preservation, more and more of them are engaging in environmental initiatives and attempting to avail themselves of the SRI label. It is likely that the difference between SRI funds that practice positive selection and non-SRI funds, already slight, will become even less pronounced in the coming years.
This observation undoubtedly led to the recent development of a new type of funds, known as thematic funds,6 categorised as SRI by asset management firms but greatly different from what was once called SRI. Indeed, it is only by virtue of their investment sectors that these funds can claim the SRI name, as they do not systematically apply the usual environmental, social, and governance (ESG) screening criteria. They invest in a single environment-related sector (water, renewable energies, and so on). These funds choose to invest not in socially responsible companies per se but in companies that work in what are deemed socially responsible industries. The “social” term thus becomes inappropriate and more often than not is replaced by the name “sustainable”. As the sectors selected for these funds are currently in full expansion, it makes it possible for the asset management firms to offer funds that are currently performing well. In view of the short data histories currently available, however, it is difficult to forecast the long-term performance of these funds.
How can we tackle the subject of performance measurement for socially responsible investment in the context of
a fund population that is becoming more and more diversified? Should we not make a distinction between socially responsible investment and environmental sector investment? A study such as EDHEC’s, based on a history of several years and including only the funds that have data for the entire period, may be seen as a study of what investors earned from having taken part in SRI investment during this period. A study such as Altedia’s, based on a short period and including more funds, may give a more current picture of SRI, but it does not make it possible to foresee the longer-term future of current trends. One may well wonder if these studies make it possible to draw conclusions about SRI investment practices and results in France.
2.1. Conclusions of the EDHEC Study
EDHEC studied7 the performance of SRI-labelled funds distributed in France. This study covers funds registered in France, Luxembourg and Belgium—which also provides a good coverage of the SRI mutual funds available in the Euro zone—and still in existence on December 31, 2007. We limit our study to funds classified as equities according to their prospectuses. Our main source for this list of funds was the Novethic8 website, complemented by a search of asset management firms’ websites. We thus obtained sixty-two funds available to French investors and in existence at least over the period from January 2002 to December 2007. These funds were then divided by investment zone (as described in the fund prospectus) into four groups: France (five funds), the Euro zone (twenty-five funds), Europe (twelve funds), and World (twenty funds). An initial release of this study (February 2008) analysed only the funds in the France, Euro zone and Europe groups. A second release in September 2008 included the funds in the World group. These funds were initially left out, as their greater heterogeneity made it harder to use the same factor model to analyse all the funds in the group.
We also computed an index made up of the equal-weighted average of the SRI funds (we call it the average SRI fund index) for each investment zone, including all fund data available, even for the funds that do not survive until the end of the period and for those available for shorter periods. These average indices were made up of seven funds for France, thirty-six for the Euro zone, thirty-three for Europe, and forty-eight for World, that is, 124 funds in all. Included in these indices are twice as many funds as are analysed individually, but half participate for only part of the study
period. We also analysed eleven SRI indices covering the various investment zones.
All the computations were performed using weekly data returns, in order to have more data than with monthly data, without generating too much noise in our data series, as we would have had if we had used daily data. Moreover, some funds are evaluated only once a week, usually on Friday, which leads us to choose to compute returns on Friday, rare exceptions being dealt with separately.
The study shows various statistical indicators for funds and indices (mean return, standard deviation, skewness, kurtosis), as well as performance indicators (Sharpe ratio, Jensen’s alpha, and Fama-French alpha). As a comparison, statistical indicators were also computed for conventional indices of the same investment zones, but Jensen’s alpha and Fama-French alpha could not be computed for these indices, as they serve as market factors for these models.
Table 1 (below) shows statistical indicators for SRI and conventional indices, as well as for the average SRI fund index for each investment zone.
We can see on this table that, for all investment zones except World, the conventional index posts higher returns, with lower risk, than the SRI indices. As a result, the conventional index has a higher Sharpe ratio. Our detailed study of SRI funds also provides us similar results for most of them, as only four of the forty-two SRI funds from the France, Euro zone and Europe groups have Sharpe ratios higher than that of the conventional index for the corresponding investment zone. For the World group, SRI and conventional market indices post Sharpe ratios close to zero, but negative, while half of the SRI funds post
2. Does the Population Studied by EDHEC Make it Possible to Draw Conclusions about SRI in France?
77 - Le Sourd (2008).8 - www.novethic.fr. Novethic is a French research centre whose mission is to observe and provide information about socially responsible investment and corporate social and environmental responsibility.

8
positive Sharpe ratios. This group is more heterogeneous than the other three and includes some specialised funds invested in restricted sectors such as renewable energy, which tend to perform quite differently from the average of the group.
We also observe that skewness is negative for all indices, whatever their investment zone, while some SRI funds exhibited positive skewness. Moreover, excess kurtosis appears very high for most of the
funds, while kurtosis values for indices are moderate. On average, the lowest excess kurtosis for SRI funds is to be found in the World group, while the conventional and the SRI World indices exhibit higher excess kurtosis, which renders this group atypical. High kurtosis means that the return distributions have fat tails—in other words, the funds experienced returns far from their mean. And as the skewness of most of these funds is negative, these exceptional returns are more often negative than positive.
2. Does the Population Studied by EDHEC Make it Possible to Draw Conclusions about SRI in France?
Table 1: Statistical indicators for SRI indices over the period from 2002 to 2007, compared to those of a conventional index for the same investment zone.
INVESTMENT ZONE
January 2002 - December 2007
Correlations with
Indices Mean return
Standard deviation
Skewness Excess kurtosis
Sharpe ratio
Market SRI Index
Conventional index
FRANCE SBF 250 8.89% 16.47% -0.33 1.02 0.36 1.00 0.95
EURO ZONE DJ EURO STOXX 8.17% 16.80% -0.36 0.93 0.31 1.00 0.99
EUROPE DJ STOXX 6.93% 15.15% -0.33 1.22 0.27 1.00 0.99
WORLD MSCI WORLD 1.93% 14.89% -0.18 1.75 -0.06 1.00 0.98
SRI indices
FRANCE DJSI FRANCE COMPOSITE
8.88% 18.87% -0.11 1.85 0.32 0.95 1.00
EURO ZONE ASPI EUROZONE 7.48% 17.95% -0.24 1.19 0.26 1.00 0.99
DJ EURO STOXX SUSTAINABILITY
6.60% 19.30% -0.23 1.27 0.19 0.99 1.00
E. CAPITAL ETHICAL EURO
6.15% 16.14% -0.24 1.08 0.20 0.97 0.96
DJ EURO STOXX SUSTAIN 40
8.59% 19.15% -0.14 1.23 0.30 0.98 0.99
EUROPE DJSI EUROPE COMPOSITE
5.93% 15.70% -0.22 1.63 0.19 0.99 1.00
FTSE4GOOD EUROPE
5.68% 15.84% -0.32 1.41 0.18 1.00 1.00
FTSE4GOOD EUROPE 50
3.70% 16.38% -0.27 1.74 0.05 0.98 0.99
DJ STOXX SUSTAINABILITY
5.82% 15.92% -0.25 1.58 0.18 0.99 1.00
DJ STOXX SUSTAIN 40
6.03% 17.30% -0.23 1.72 0.18 0.98 0.99
WORLD DJSI WORLD 2.81% 15.12% -0.16 2.01 -0.01 0.98 1.00
Average SRI fund index
FRANCE 5.82% 17.20% 0.12 5.34 0.17 0.86 0.81
EURO ZONE 6.00% 16.24% -0.08 3.57 0.19 0.92 0.91
EUROPE 4.71% 14.44% -0.12 2.48 0.13 0.94 0.93
WORLD 3.75% 13.23% -0.14 1.36 0.07 0.93 0.92
The mean returns and standard deviations, computed with weekly returns, are annualised.

2. Does the Population Studied by EDHEC Make it Possible to Draw Conclusions about SRI in France?
9
For a more precise picture about extreme risks, we can also compute the Cornish-Fisher VaR. Value-at-Risk (VaR) is a global risk measure that makes it possible to evaluate the possible losses of a position. For a given probability, it provides the maximum value of the loss which is likely to occur in a given period, in the event of unfavourable market moves. Most of the time, however, VaR is computed assuming that asset returns have a Gaussian distribution, which fails to take into account the risk of loss related to extreme variations of risk factors, likely to occur in a context of financial crisis, for example. VaR based on the Cornish-Fisher (1937) extension is a semi-parametric method that makes it possible to correct the Gaussian VaR computation by including the third (skewness) and fourth (kurtosis) moments of the return distribution in the computation.9
We perform this computation over the period from 2002 to 2007 for each of the conventional and SRI indices, as well as for each average SRI fund index for all investment zones. We use a 95% confidence threshold and a period of one week, which means that there is only a five in one hundred chance that the indices will suffer a loss higher than the estimated VaR over a period of one week. The values shown in table 2 represent the percentage of portfolio value that can be lost in one week. These values fall in a narrow range, from 2.97% to 4.24%. For each investment zone, the VaR of SRI indices is slightly higher than that of the conventional indices. For their part, the average SRI fund indices have a VaR slightly lower than that of the conventional indices. The diversification effect obtained by the computation of the equal weighted mean of all the funds, which lowers the risk, accounts for this lesser value. Note that VaR estimation for individual SRI funds produces
more dispersed values, comparable to those obtained for SRI indices.
Table 2: Cornish-Fisher VaR for conventional and SRI indices over the period from 2002 to 2007 for each investment zone.
SRI promoters describe their offerings as providing smoother performance than does conventional investment, but our findingssuggest that in reality SRI is not free of extreme risks, and that SRI indices have more volatile performance than conventional indices.
9 - The Cornish-Fisher extension is given by:
where zα is the critical value for the probability (1 −α ) , S is the portfolio’s skewness and K its kurtosis.The Cornish-Fisher VaR is then given by: VaR(1 −α ) = μ + %zασ , where μ is the portfolio mean return and σ its volatility.
%zα = zα +
16
( zα
2 −1)S +124
( zα
3 − 3zα )( K − 3) −136
( 2zα
3 − 5zα )S2
%zα = zα +
16
( zα
2 −1)S +124
( zα
3 − 3zα )( K − 3) −136
( 2zα
3 − 5zα )S2∼
%zα = zα +
16
( zα
2 −1)S +124
( zα
3 − 3zα )( K − 3) −136
( 2zα
3 − 5zα )S2∼
INVESTMENT ZONE
January 2002 - December 2007 Cornish-Fisher
VaR (95%)Indices
Conventional indices
FRANCE SBF 250 3.75%
EURO ZONE DJ EURO STOXX 3.86%
EUROPE DJ STOXX 3.46%
WORLD MSCI WORLD 3.39%
SRI indices
FRANCE DJSI FRANCE COMPOSITE
4.12%
EURO ZONE ASPI EUROZONE 4.06%
DJ EURO STOXX SUSTAINABILITY
4.38%
E. CAPITAL ETHICAL EURO
3.67%
DJ EURO STOXX SUSTAIN 40
4.24%
EUROPE DJSI EUROPE COMPOSITE
3.53%
FTSE4GOOD EUROPE 3.64%
FTSE4GOOD EUROPE 50
3.76%
DJ STOXX SUSTAINABILITY
3.60%
DJ STOXX SUSTAIN 40
3.90%
WORLD DJSI WORLD 3.41%
Average SRI fund index
FRANCE 3.48%
EURO ZONE 3.48%
EUROPE 3.18%
WORLD 2.97%
10
2. Does the Population Studied by EDHEC Make it Possible to Draw Conclusions about SRI in France?Our results also show that SRI funds and conventional market indices are slightly more correlated than are SRI funds and SRI indices for the individual funds and for the mean average funds. The following phase of the study evaluates fund alpha, i.e., the returns accounted for not by market movements or investment style but by security selection alone. We use Sharpe’s one-factor model and the Fama-French three-factor model. In both cases, we obtain negative alpha for both SRI funds and indices. With the one-factor model, the only index to post positive alpha—but not significant—alpha is the DJSI World index. Three of the eleven SRI indices post significant alpha—negative, alas. Positive alpha for funds is to be found in the Euro zone group (three of the twenty-five funds), in the Europe group (one of the twelve funds), and in the World group (eleven of the twenty funds), but with one exception, the values are not significant. Only three funds post significant alpha, two significantly negative in Europe, and one significantly positive in the World group. This single fund of our sixty-two fund sample with positive and significant
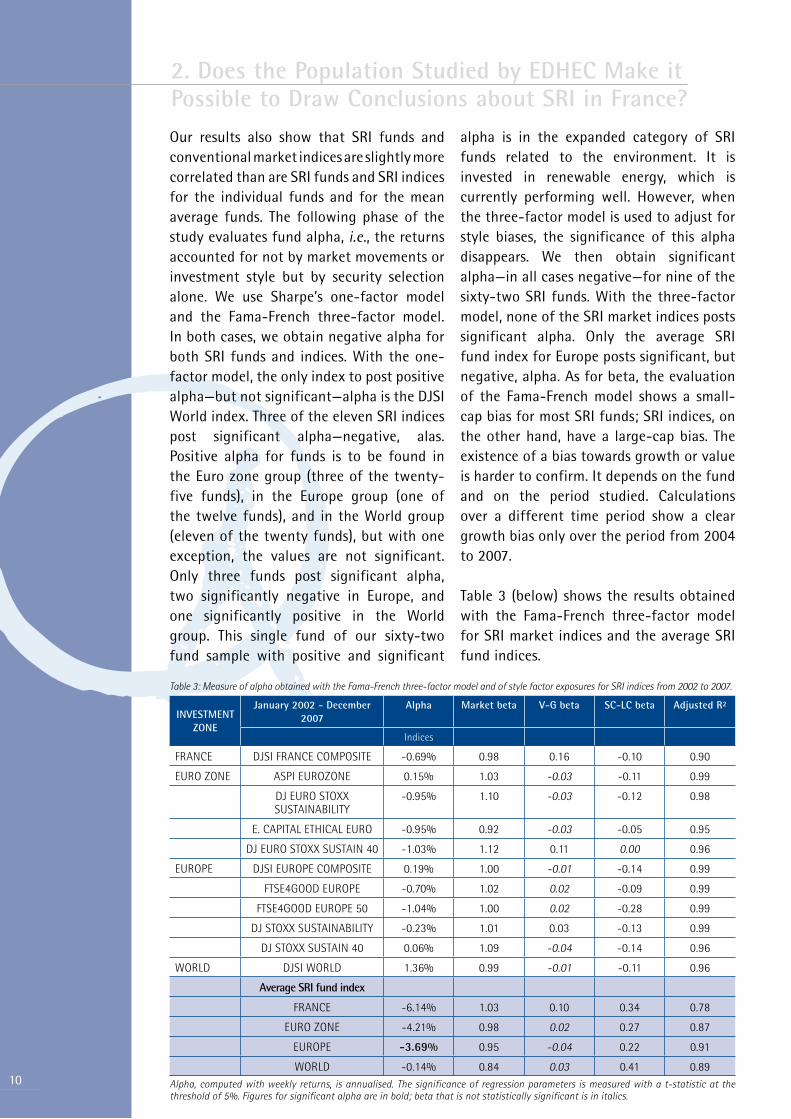
alpha is in the expanded category of SRI funds related to the environment. It is invested in renewable energy, which is currently performing well. However, when the three-factor model is used to adjust for style biases, the significance of this alpha disappears. We then obtain significant alpha—in all cases negative—for nine of the sixty-two SRI funds. With the three-factor model, none of the SRI market indices posts significant alpha. Only the average SRI fund index for Europe posts significant, but negative, alpha. As for beta, the evaluation of the Fama-French model shows a small-cap bias for most SRI funds; SRI indices, on the other hand, have a large-cap bias. The existence of a bias towards growth or value is harder to confirm. It depends on the fund and on the period studied. Calculations over a different time period show a clear growth bias only over the period from 2004 to 2007.
Table 3 (below) shows the results obtained with the Fama-French three-factor model for SRI market indices and the average SRI fund indices.
Table 3: Measure of alpha obtained with the Fama-French three-factor model and of style factor exposures for SRI indices from 2002 to 2007.
INVESTMENT ZONE
January 2002 - December 2007
Alpha Market beta V-G beta SC-LC beta Adjusted R²
Indices
FRANCE DJSI FRANCE COMPOSITE -0.69% 0.98 0.16 -0.10 0.90
EURO ZONE ASPI EUROZONE 0.15% 1.03 -0.03 -0.11 0.99
DJ EURO STOXX SUSTAINABILITY
-0.95% 1.10 -0.03 -0.12 0.98
E. CAPITAL ETHICAL EURO -0.95% 0.92 -0.03 -0.05 0.95
DJ EURO STOXX SUSTAIN 40 -1.03% 1.12 0.11 0.00 0.96
EUROPE DJSI EUROPE COMPOSITE 0.19% 1.00 -0.01 -0.14 0.99
FTSE4GOOD EUROPE -0.70% 1.02 0.02 -0.09 0.99
FTSE4GOOD EUROPE 50 -1.04% 1.00 0.02 -0.28 0.99
DJ STOXX SUSTAINABILITY -0.23% 1.01 0.03 -0.13 0.99
DJ STOXX SUSTAIN 40 0.06% 1.09 -0.04 -0.14 0.96
WORLD DJSI WORLD 1.36% 0.99 -0.01 -0.11 0.96
Average SRI fund index
FRANCE -6.14% 1.03 0.10 0.34 0.78
EURO ZONE -4.21% 0.98 0.02 0.27 0.87
EUROPE -3.69% 0.95 -0.04 0.22 0.91
WORLD -0.14% 0.84 0.03 0.41 0.89Alpha, computed with weekly returns, is annualised. The significance of regression parameters is measured with a t-statistic at the threshold of 5%. Figures for significant alpha are in bold; beta that is not statistically significant is in italics.

2. Does the Population Studied by EDHEC Make it Possible to Draw Conclusions about SRI in France?
11
Generally speaking, our results show that, whatever the evaluation model used, the great majority of SRI funds exhibit negative alpha, but that in most cases this alpha is not significant. In addition, the alpha of SRI indices is on average higher than that of SRI funds. Our analysis suggests that only a few SRI funds exhibit positive alpha and that in all cases this alpha is not significant, as the only significant positive alpha disappears after correcting the results for style biases. These results are obtained for the four investment zones. Our results are in line with those of previous academic studies done in other countries, which also find mostly negative alpha, most of it not significant; the little significant alpha found is invariably negative. We obtain similar results by evaluating fund alpha adjusted for sector rather than style exposure.
The purpose of this study was to see whether the residual performance (alpha) of SRI funds accounted for by the selection of SRI assets alone, and obtained after discounting the effect of rewards for risks associated with the style of the fund, was positive. This study shows that this alpha is not positive for a majority of SRI funds and that the SRI style in itself does not lead to outperformance.
According to our study, so-called positive selection, the approach to SRI common in France and in continental Europe in general, results in funds whose composition does not differ greatly from that of funds that do not boast the SRI label. Indeed, most SRI funds do not refer to a SRI benchmark in their prospectuses or management reports; instead, they compare their performance to conventional market indices, even when suitable SRI indices exist. SRI funds invested in Euro zone assets, for example, report that they use the Dow Jones Euro Stoxx index as an index of reference, even though the Dow Jones Euro Stoxx Sustainability index, its
SRI counterpart, would have seemed more natural. This choice is further proof that there is only a slight difference between the performance of SRI and that of conventional investment performance.
2.2. Comments on the Results of this StudyThe initial EDHEC study (Le Sourd 2008) was intended not to evaluate the mean returns of SRI funds but to ascertain whether SRI security selection is in itself likely to produce performance or whether the performance of SRI funds is explained by style biases induced by restriction of the investment universe. For this purpose, we evaluated fund alpha with a factor model that makes it possible to isolate fund performance attributable to investment style (growth, value, small caps), which can be obtained by passive investment in a combination of style indices, from performance attributable to SRI security selection.
Our study did not identify alpha both positive and significant. Few funds produce significant alpha, and these rare significant alpha values are negative. To find out if the choice of fund sample for this study—that is, the choice to study only funds with at least a six-year data history—influences the results, we look at recent fund performance by fund age.
2.2.1. Do older funds and recently created funds perform differently?The funds of our sample (all investment zones) available at least throughout 2007 are divided into groups by age. The first group includes funds with more than six years of existence as of December 31, 2007, i.e., available since at least January 1, 2002. There are sixty-two funds in this group. A second group includes funds with more than two entire years of existence but

12
2. Does the Population Studied by EDHEC Make it Possible to Draw Conclusions about SRI in France?less than six, that is, funds created after January 1, 2002, but before January 1, 2006. In this group there are thirty-two funds. The last group—made up of nine funds—includes the funds created as of January 1, 2007. The graphs showing the complete distribution of fund alpha calculated over 2007, by fund age, as well as the distribution of the correlations of the returns of funds and those of an SRI index representing the fund investment zone, also calculated over 2007, are displayed in the appendices (see graphs 1 and 2, appendix 2). Alpha values are obtained with the Fama-French three-factor model, which makes it possible to correct the values for style biases.
To compare the results of groups by fund age, we compute for each group the mean alpha value, as well as the extreme values. We do the same computations for the correlation of funds and an SRI index (see table 4).
These results show that for 2007 alpha values are on average higher for the younger funds than for the older ones. However, the highest and lowest extremes are obtained for older funds and those from the intermediate group. As a result, considering only funds with more than six years of existence does not exclude the funds likely to produce the highest alpha values.
On average, younger funds and SRI indices are less highly correlated, which suggests that these funds are more likely to stray from the initial SRI concept. However, the more extreme values are again observed among the older funds and the funds from the
intermediate group, which again suggests that these groups also include funds that stray far from the usual SRI concept.
This comparison shows clearly that each age group includes funds that produce results far from the average distribution. Some funds in the group of older funds produced high alpha values in 2007. Funds weakly correlated with the SRI index representing their investment zone are also found among the older funds. Our results show that the older funds are a more diversified group than the younger funds, with more extreme values. Although the number of young funds is relatively low, we can see that this group is made up partly of funds with results close to the average and partly of funds that exhibit atypical behaviour. The younger funds are essentially thematic funds labelled SRI as a result of the broadening of the definition of the term
So it seems that it is not the age of the fund that is likely to cause funds to perform differently; the cause of these differences in performance is instead the fund’s particular SRI categorisation.
2.2.2. Do the performance differences depend on investment zone? World versus France—Euro zone—EuropeTo examine in greater detail the results presented in the paragraph above, we divide our sample by investment zone; a first group is made up of the funds invested in assets from France, the Euro zone, and Europe, and a second group of funds invested in assets from the World zone. The greater heterogeneity of the funds in the
Table 4: Mean and extreme values for fund alpha, and for correlations of fund returns and SRI index returns, for 2007, by fund age, for all investment zones considered as a whole.
Jan. 2007-Dec. 2007 Number of funds
Alpha Correlation
Fund age Mean Min Max Mean Min Max
≥ 6 years 62 1.24% -8.00% 41.09% 0.90 0.46 0.99
< 6 years and ≥ 2 years 32 3.84% -8.22% 45.86% 0.89 0.60 0.99
< 2 years and ≥ 1 year 9 7.72% -3.73% 23.87% 0.82 0.69 0.99

latter group determined this division. The detailed results for the distribution of fund alpha and for the correlation of funds and SRI indices are displayed in the appendices (for France, the Euro zone, and Europe, see appendix 2, graphs 3 and 4; for World, graphs 5 and 6). For each of the two main investment zones, table 5 (below) sums up the results provided by the distributions.
As expected, funds from France, the Euro zone, and Europe show less disparity in the distribution of alpha values, whatever the fund creation date, while funds from the World group show more disparity, not only between funds considered as a whole, with a spread between alpha maximum and minimum value much greater than in the France-Euro zone-Europe group, but also between funds of different ages. Comparing tables 4 and 5, it appears that the France-Euro zone-Europe group provides minimum alpha values for all the periods, while the World group provides the maximum values, which are extremely high values, not comparable with those obtained for the France-Euro zone-Europe group. We also observe that the funds from the World group are on average slightly less correlated with an SRI index than are the funds from the France-Euro zone-Europe group. However, for the older and the younger funds, the minimum value is
provided by the France-Euro zone-Europe group, which also provides the maximum value for all age groups.
We thus observe that the World group differs greatly from the France-Euro zone-Europe group. Differences by investment zone are much more pronounced than differences by age. As mentioned above, the SRI category has recently expanded to include funds that in no way correspond to the initial definition of socially responsible investment. In view of our results, it seems that differences in performance depend above all on fund composition, with a distinction between environment-themed funds and traditional SRI funds, but that these differences are not primarily related to fund age. Thematic funds are on average younger than diversified SRI funds, but for the moment, they are a new stream that is joining the older one but not submerging it. Moreover, it seems to us that these new thematic funds, which focus on only one sector, should be analysed separately from the group of diversified SRI funds. The good recent performance posted by these funds is explained not so much by SRI asset selection as by their investments in a sector (energy) that has recently enjoyed great favour. But one wonders about the risk exposure of funds invested in a single sector.
2. Does the Population Studied by EDHEC Make it Possible to Draw Conclusions about SRI in France?
13
Table 5: Mean and extreme values for fund alpha and for correlations of fund returns with SRI index returns, for 2007, by fund age. Comparison of France-Euro zone-Europe and World.
Jan. 2007-Dec. 2007
Number of funds
Alpha Correlation
Fund age Mean Min Max Mean Min Max
France – Euro Zone– Europe
≥ 6 years 42 -0,15% -8,00% 5,82% 0,90 0,46 0,99
< 6 years and ≥ 2 years 22 -0,11% -8,22% 9,93% 0,92 0,73 0,99
< 2 years and ≥ 1year 3 1,42% -3,73% 4,83% 0,80 0,69 0,99
World
≥ 6 years 20 4,15% -7,37% 41,09% 0,88 0,65 0,99
< 6 years and ≥ 2 years 10 12,52% -0,47% 45,86% 0,84 0,60 0,93
< 2 years and ≥ 1 year 6 10,87% 0,02% 23,87% 0,83 0,72 0,89

14
3. How Credible is the Altedia Study?
3.1. Main Results of the Altedia Study
Altedia studied the performance of a sample of 139 SRI funds (the detailed list is not provided in the study) for a one-year period. These funds are from asset management firms based in Europe, the United States, Canada, Australia, and Asia, and are grouped in two main categories, in keeping with the SRI approach taken by Altedia: the “best in class” category (eighty-four funds) and the “thematic” category (fifty funds). The study period covers the twelve months immediately preceding the date of the study, i.e., April 2007 to March 2008.
Broadly, the study concludes that, unlike conventional investments, SRI funds outperformed their benchmarks during this period. Each fund has its own benchmark, but this benchmark is not specified in the study. The larger funds performed better. For all the funds, the average return in excess of the benchmark was 0.3%, while for the funds with more than €500 million of assets under management it was 4.8%. However, the study also shows that absolute performance was negative during this period, with -15.9% for the SRI funds as a whole and -12.7% for the funds with more than €500 million under management.
In addition, the study considers separately the “best in class” funds, i.e., those that select the securities of the companies that, in each sector of activity, best respect SRI criteria, and the thematic funds, which invest in such specialised sectors as the environment. The results of the study show that the “best in class” funds as a whole do not beat their benchmarks, as their relative performance is negative (1.3%) over the study period. It is the same for the funds invested in the Euro zone (-1%). The only “best in class” funds to beat their benchmarks are those invested
in the Euro zone and with more than €100 million of assets under management; they post relative average performance of 0.4%. The thematic funds posted better results, with relative performance of 3.3% for the funds as a whole, whatever the investment zone. Considering all thematic investment, but only funds invested in World assets, the relative average performance was 1.1%. Finally, relative performance of environment-themed funds was 8.3%.
This study shows that the SRI funds that achieve the higher performance are those with an investment thematic related to the environment and invested in World assets. The study does not specify the distribution of funds by geographic zone or by sector in the thematic category.
3.2. Comments on the Results and Methodology of the Altedia Study
3.2.1. Choice of the sample size and length of the data historyThe concept of socially responsible investment may not be new, but it is only recently that it has been pitched to the general public. Before that, it was considered a niche investment for religious congregations. Consequently, most SRI funds are recent creations. The number of SRI funds became significant in France in the early years of the new millennium and has since grown considerably. Note that some funds disappear, while others merge or lose their SRI label. As a result, to perform a SRI fund study, we have to reconcile a sufficient number of funds and a sufficiently long data history. We collect the SRI fund available on December 31, 2007, by age (see table 6), taking into account only the funds invested in equities and available to French investors.

This list includes only funds with at least one year of existence as of December 31, 2007. It does not take into account the funds created in 2007 and 2008. For example, a study performed over one year of data history could include 103 funds, while a six-year study would have a sample of sixty-two funds, and a ten-year study a sample of only nine. We thus see the importance of the choice of the study period. If we want to have a long data history, the number of funds is not sufficient and does not enable an accurate reading of SRI funds as a whole. On the contrary, if the study gives priority to the number of funds and the period of the study is only one year, the results cannot be considered significant or representative of SRI fund performance over the long term.
So it is necessary to reach a compromise between the size of the sample of funds and the length of the data history. Altedia chose to use a short period (one year) to have a great number of funds (139), while the EDHEC study was limited to sixty-two funds to have a data history of a sufficient length (six years) and to obtain more significant results. Sixty-two is not a bad number, since the study includes only funds distributed in France and available to French investors, while the Altedia study
covers funds distributed by a wider group of asset management firms, based not only in France but also in Europe, the United States, Canada, Australia, and Asia.
To evaluate how the length of the period may influence the results of the study, we estimate the alpha values over rolling periods including only one year of data history. We also estimate alpha values over periods of decreasing lengths, from six years to one.
3.2.2. Are the results obtained with one year of data significant? We thought it worthwhile to evaluate fund alpha on rolling periods of one year over the period from 2002 to 2007, in order to see how alpha varied from one year to the next. This computation is done using the average equal-weighted SRI fund indices including all the data of funds available for each period, in order to reduce the selection bias. As before, we use the Fama-French three-factor model to estimate alpha values. Our results, shown in table 7, show that for the six years, and for the four investment zones, i.e., twenty-four computations, only one alpha value is significant, and it is negative. This is the alpha value of the average SRI fund index for Europe in 2004. We also observe very high variations in alpha values from one year to the next. We again find mostly negative alpha values for the France, Euro zone, and Europe groups, with four of six values for alpha negative, while the World group produces as many positive as negative values for alpha. These results show that evaluating alpha using only one year of data gives little information about average long-term fund behaviour.
3. How Credible is the Altedia Study?
15
Table 6: Number of SRI funds invested in equities between 1996 and 2007.
Period Number of SRI funds
January 96 - December 07 3
January 97 - December 07 6
January 98 - December 07 9
January 99 - December 07 16
January 00 - December 07 27
January 01 - December 07 48
January 02 - December 07 62
January 03 - December 07 73
January 04 - December 07 78
January 05 - December 07 84
January 06 - December 07 93
January 07 - December 07 103

16
3.2.3. Alpha computation over periods of various lengths
To illustrate how the length of data history may influence the results of alpha evaluation, we also evaluate fund alpha, still corrected for style biases, over periods of decreasing length (six years, three years, and one year) and we compare the results obtained for the various periods. The computations are done for both the average SRI fund indices and the individual SRI funds. Using average SRI fund indices makes it possible to obtain results with reduced selection bias, as all funds are included in the indices, whether their data history covers the entire period or not. Using individual SRI funds, on the other hand, makes possible a depiction of fund diversity.
Concerning SRI fund average indices for each investment zones, we obtain negative alpha over the period from 2002 to 2007, with only one instance of significant alpha—for the Europe index. From 2005 to 2007, we obtain significant and positive alpha for the World index. In 2007, alpha
values become positive for all investment zones except Europe, but none of the alpha values is significant. These results are shown in table 8 (below).
For the average SRI fund indices, we can see that both alpha values and the significance of these values vary by length of period. Average SRI fund indices are made up of the same funds whatever the period, as these indices are not restricted to the only funds for which the data are available for the full period. Our results show that alpha values are higher in the recent period for all investment zones, but that the alpha significance decreases over the shorter periods, except for the World zone.
The study of individual funds includes an increasing number of funds as the length of the period decreases. The distribution of alpha values obtained for all the funds, considered first without separating investment zones, and then dividing the funds into two groups—one of funds invested in France, the Euro zone, and Europe assets, and the other invested in World assets—are shown in the appendices
3. How Credible is the Altedia Study?
Table 7: Average equal-weighted SRI fund index alpha computed with one year of data from 2002 to 2007.
Invest-ment zone
FRANCE EURO ZONE EUROPE WORLD
Period alpha t-stat Adjusted R²
alpha t-stat Adjusted R²
alpha t-stat Adjusted R²
alpha t-stat Adjusted R²
2002 -2.50% -0.18 0.78 0.48% 0.05 0.88 5.52% 0.83 0.92 -8.32% -1.22 0.87
2003 -15.61% -1.40 0.72 -9.07% -1.00 0.80 -7.08% -1.03 0.85 -5.64% -1.42 0.94
2004 -9.44% -1.60 0.75 -4.84% -1.37 0.91 -3.77% -1.97 0.97 -0.06% -0.02 0.91
2005 -1.60% -0.36 0.83 0.34% 0.12 0.92 0.01% 0.01 0.97 0.42% 0.14 0.90
2006 1.75% 0.34 0.81 -4.40% -1.44 0.94 -3.29% -1.82 0.98 5.60% 1.27 0.84
2007 1.86% 0.40 0.90 0.84% 0.33 0.97 -1.02% -0.50 0.98 7.57% 1.90 0.93
The significant alpha values at the threshold of 5% are in bold.
Table 8: Average equal-weighted SRI fund index alpha computed over three periods of decreasing length (six years, three years, one year).
January 2002 - December 2007 January 2005 - December 2007 January 2007 - December 2007
Alpha t-stat Adjusted R²
Alpha t-stat Adjusted R²
Alpha t-stat Adjusted R²
FRANCE -6.14% -1.85 0.78 -0.41% -0.15 0.86 1.86% 0.40 0.90
EURO ZONE -4.21% -1.75 0.87 -1.00% -0.62 0.95 0.84% 0.33 0.97
EUROPE -3.69% -2.11 0.91 -1.18% -1.17 0.98 -1.02% -0.50 0.98
WORLD -0.14% -0.08 0.89 5.41% 2.47 0.88 7.57% 1.90 0.93
The significant alpha values at the threshold of 5% are in bold.
(see appendix 2, graphs 7 to 12). As we note in the previous section, we proceed with this division into these two groups not because of their differing investment zones but because of their differing approaches to SRI.
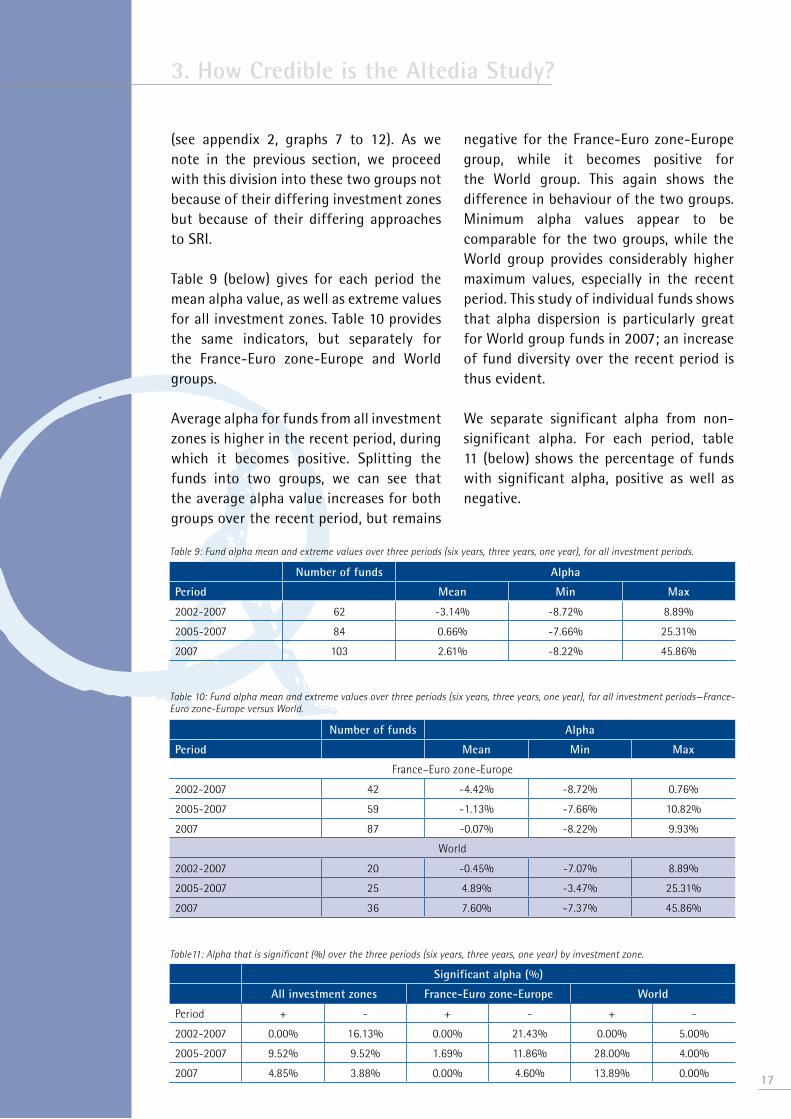
Table 9 (below) gives for each period the mean alpha value, as well as extreme values for all investment zones. Table 10 provides the same indicators, but separately for the France-Euro zone-Europe and World groups.
Average alpha for funds from all investment zones is higher in the recent period, during which it becomes positive. Splitting the funds into two groups, we can see that the average alpha value increases for both groups over the recent period, but remains
negative for the France-Euro zone-Europe group, while it becomes positive for the World group. This again shows the difference in behaviour of the two groups. Minimum alpha values appear to be comparable for the two groups, while the World group provides considerably higher maximum values, especially in the recent period. This study of individual funds shows that alpha dispersion is particularly great for World group funds in 2007; an increase of fund diversity over the recent period is thus evident.
We separate significant alpha from non-significant alpha. For each period, table 11 (below) shows the percentage of funds with significant alpha, positive as well as negative.
3. How Credible is the Altedia Study?
17
Table 9: Fund alpha mean and extreme values over three periods (six years, three years, one year), for all investment periods.
Number of funds Alpha
Period Mean Min Max
2002-2007 62 -3.14% -8.72% 8.89%
2005-2007 84 0.66% -7.66% 25.31%
2007 103 2.61% -8.22% 45.86%
Table 10: Fund alpha mean and extreme values over three periods (six years, three years, one year), for all investment periods—France-Euro zone-Europe versus World.
Number of funds Alpha
Period Mean Min Max
France–Euro zone-Europe
2002-2007 42 -4.42% -8.72% 0.76%
2005-2007 59 -1.13% -7.66% 10.82%
2007 87 -0.07% -8.22% 9.93%
World
2002-2007 20 -0.45% -7.07% 8.89%
2005-2007 25 4.89% -3.47% 25.31%
2007 36 7.60% -7.37% 45.86%
Table11: Alpha that is significant (%) over the three periods (six years, three years, one year) by investment zone.
Significant alpha (%)
All investment zones France-Euro zone-Europe World
Period + - + - + -
2002-2007 0.00% 16.13% 0.00% 21.43% 0.00% 5.00%
2005-2007 9.52% 9.52% 1.69% 11.86% 28.00% 4.00%
2007 4.85% 3.88% 0.00% 4.60% 13.89% 0.00%

18
As table 11 shows, significant alpha values are considerably less numerous than non-significant alpha values. In almost all cases, we observe more significant negative than positive alpha values. From 2002 to 2007, all significant alpha is negative. The World group differs again from the others by exhibiting more significant positive than negative alpha values over the two more recent periods.
We also observe that none of the funds in existence from at least 2002—for which it was possible to compare the results for the three periods—and generating significant alpha on the longest period (2002-2007) exhibited significant alpha over the two other periods. We recall that all these alpha values were negative. One of these funds exhibited significant alpha in one of the two other periods (2005-2007), but this alpha was still negative. These results show that fund alpha values are not stable over time.
We observe through all these analyses that the SRI funds of the two groups, France-Euro zone-Europe and World, differ greatly. It is clear that a great number of funds from the World group are from a new and very recent category of SRI, which selects not the companies with the best environmental and social practices but those specialised in particular “environmental” or natural resource sectors. For funds built on these criteria, all the companies in the selected sector are fair game, as it were, as the usual financial screening is not systematically used. These funds are no longer termed “socially responsible” but “sustainable”. They may also be known as “green funds” or SRI thematic funds, with themes including water and renewable energies.
These thematic funds, which are both very recent and specialised, recently benefited from a favourable environment. At the
time, the increase in the price of oil, for example, was particularly favourable to the development of renewable energies. However, there is not enough hindsight to know how these funds will do over the long term, the recent good performance being no guarantee of future performance for these funds. In addition, their great specialisation makes them vulnerable. Lastly, this new vision of SRI, which departs from the initial concept, is currently making it possible to boost SRI performance; SRI as initially conceived did not really offer added value in terms of performance. It should be noticed too that the performance of thematic funds is attributable primarily to the choice of investment sector, rather than to the selection of assets boasting the SRI label. It seems wise to us to make a clear distinction between SRI funds as they were once defined and thematic funds. There are in one corner well diversified funds that will perform much as financial markets as a whole do and in the other very specialised funds that will perform much as the sector they are invested in does and that are susceptible to great fluctuations. These latter funds are, above all, sector funds.
3.2.4. Is the methodology used by Altedia to evaluate fund performance relevant?We have some reservations about the methodology used by Altedia to evaluate the performance of SRI funds. The study does not explain the choice of benchmark, and it fails to define the methodology used to evaluate fund excess performance. When Altedia is questioned about these possible shortcomings, the firm suggests that the excess performance of SRI funds is the simple difference between the return of SRI funds and the return of an index of reference specific to each fund. This lack of detail about the evaluation process makes it impossible to draw conclusions from the results produced.
3. How Credible is the Altedia Study?
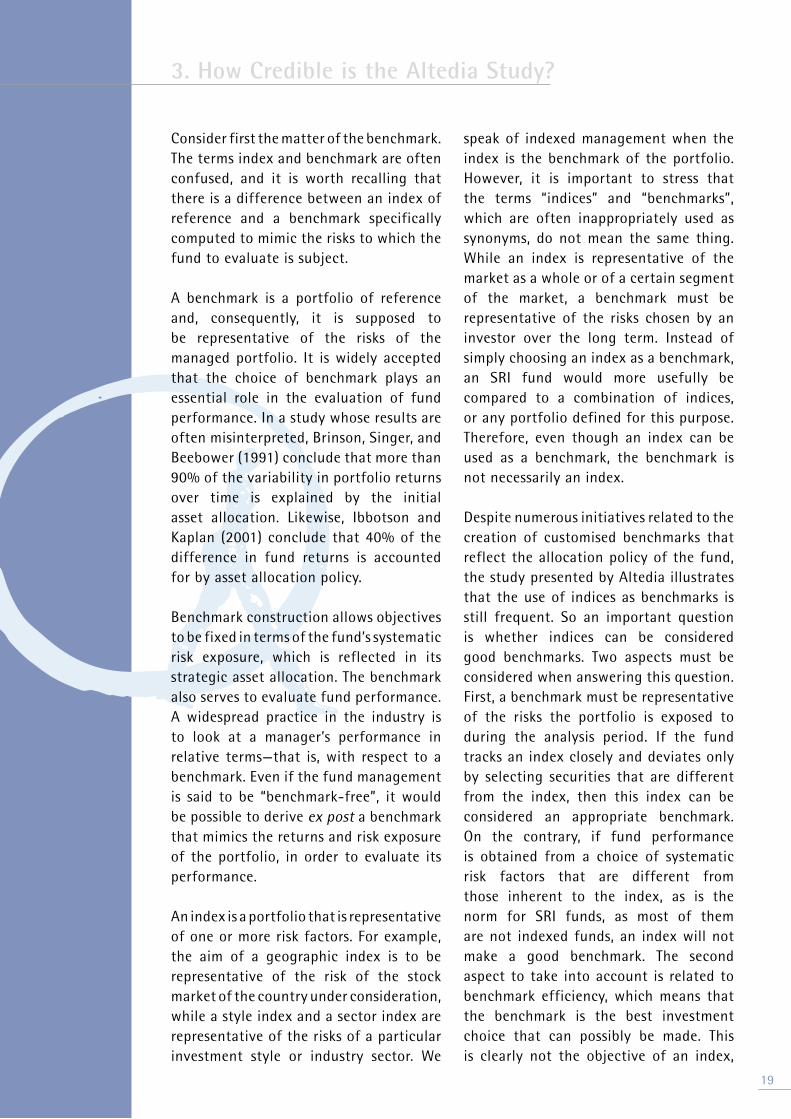
Consider first the matter of the benchmark. The terms index and benchmark are often confused, and it is worth recalling that there is a difference between an index of reference and a benchmark specifically computed to mimic the risks to which the fund to evaluate is subject.
A benchmark is a portfolio of reference and, consequently, it is supposed to be representative of the risks of the managed portfolio. It is widely accepted that the choice of benchmark plays an essential role in the evaluation of fund performance. In a study whose results are often misinterpreted, Brinson, Singer, and Beebower (1991) conclude that more than 90% of the variability in portfolio returns over time is explained by the initial asset allocation. Likewise, Ibbotson and Kaplan (2001) conclude that 40% of the difference in fund returns is accounted for by asset allocation policy.
Benchmark construction allows objectives to be fixed in terms of the fund’s systematic risk exposure, which is reflected in its strategic asset allocation. The benchmark also serves to evaluate fund performance. A widespread practice in the industry is to look at a manager’s performance in relative terms—that is, with respect to a benchmark. Even if the fund management is said to be “benchmark-free”, it would be possible to derive ex post a benchmark that mimics the returns and risk exposure of the portfolio, in order to evaluate its performance.
An index is a portfolio that is representative of one or more risk factors. For example, the aim of a geographic index is to be representative of the risk of the stock market of the country under consideration, while a style index and a sector index are representative of the risks of a particular investment style or industry sector. We
speak of indexed management when the index is the benchmark of the portfolio. However, it is important to stress that the terms “indices” and “benchmarks”, which are often inappropriately used as synonyms, do not mean the same thing. While an index is representative of the market as a whole or of a certain segment of the market, a benchmark must be representative of the risks chosen by an investor over the long term. Instead of simply choosing an index as a benchmark, an SRI fund would more usefully be compared to a combination of indices, or any portfolio defined for this purpose. Therefore, even though an index can be used as a benchmark, the benchmark is not necessarily an index.
Despite numerous initiatives related to the creation of customised benchmarks that reflect the allocation policy of the fund, the study presented by Altedia illustrates that the use of indices as benchmarks is still frequent. So an important question is whether indices can be considered good benchmarks. Two aspects must be considered when answering this question. First, a benchmark must be representative of the risks the portfolio is exposed to during the analysis period. If the fund tracks an index closely and deviates only by selecting securities that are different from the index, then this index can be considered an appropriate benchmark. On the contrary, if fund performance is obtained from a choice of systematic risk factors that are different from those inherent to the index, as is the norm for SRI funds, as most of them are not indexed funds, an index will not make a good benchmark. The second aspect to take into account is related to benchmark efficiency, which means that the benchmark is the best investment choice that can possibly be made. This is clearly not the objective of an index,
3. How Credible is the Altedia Study?
19

20
which aims to be representative of a risk. An index cannot be the optimal market portfolio, which is unobservable, as Roll (1977) explains. Indeed, the true market portfolio would have to contain all the risky assets in proportion to their market values, including assets that are not traded on markets, such as those related to human capital (salaries, stock options, and so on).
Bailey, Richards, and Tierney (1992) and Bailey (1992) have set out rules, now commonly accepted, on the characteristics of an appropriate benchmark.A benchmark must be unambiguous, investable, measurable, and appropriate. In addition, it must reflect the investor’s current investment views, and it must be specified in advance. To respect these conditions, it is necessary to define a benchmark for which the risk exposure is truly reflective of the neutral or “normal” weights of the fund over a given period. Broad market indices do not reflect the characteristics of a managed portfolio, and will not be suitable for evaluating the performance of a fund that has an exposure to systematic risk factors that differs from that of the index. In addition, broad market indices constitute specific choices of risk factors rather than a “neutral” risk exposure. Moreover, their risk exposure may undergo modifications over time and no longer correspond to the fund’s initial risk choices.
Style indices, developed to respond to the growth of specialisation in portfolio management, are supposed to reflect more accurately the characteristics of portfolios managed in a specific style. However, a style index should be chosen with caution as well, as the composition and construction methods of these indices differ greatly from one provider to another. As a consequence, differences
in returns from one competing equity style index to another can be substantial. In addition, a generic index may not truly reflect a particular fund’s style, as there are generic indices for only some pre-defined categories. So the construction of customised benchmarks appears to be the best way of providing a benchmark suited to a fund style.
Although it is often neglected, the choice of benchmark is a determining element in the performance analysis of SRI funds, both for risk and return evaluation, as the results will depend on this choice. The use of inappropriate benchmarks can lead to an incorrect evaluation of the fund’s performance and reward the fund’s choice of style rather than the manager’s skill.
As a result, in view of the information provided by Altedia, we cannot be sure that the funds were evaluated with a suitable benchmark, as suitable benchmarks are usually defined. But if we assume that Altedia used a simple index for the study, as we are led to believe, the fund performance they presented is not adjusted for risk.
Moreover, the Altedia study identifies outperformance of 8.3% for funds related to the environment and invested in World assets over their study period (April 2007-March 2008). For our part, we come up with a comparable result (see table 8) with an alpha value of 7.57% also over a one-year period, from January to December 2007, for the World group, a group made up of many thematic funds during this period. As mentioned above, thematic funds are, in a sense, a galaxy of their own in the socially responsible investment universe. Funds invested in renewable energies have recently performed well. It is likely that it is these thematic funds that pull the performance
3. How Credible is the Altedia Study?

3. How Credible is the Altedia Study?
21
of the sample upwards, as results provided by Altedia show. The results obtained by Altedia are thus attributable to a specific group of funds that have recently behaved atypically.

22
The results of our study show that none of the sixty-two funds in our sample, covering various investment zones, manage to produce alpha both positive and significant over a six-year period. The few significant alpha values are negative. Moreover, most of the funds generate negative, non-significant alpha. Older and younger funds perform in much the same ways, as shown by the evaluation of their average performance in 2007. Thematic funds, by contrast, stand out from traditional SRI funds over the recent period, achieving much higher performance values. If we observe only thematic funds for 2007, we might be tempted to conclude that SRI can generate high performance. But our study also shows that alpha values estimated over one year change greatly from one year to the next. The use of a period of various lengths shows that results can vary greatly from one length to another as well. It thus seems to us that we do not have grounds to conclude that the selection of SRI securities alone generates outperformance. The performance of these funds is instead explained by the style biases induced by this selection and is related to market cycles and style management.
It seems regrettable to us that, despite the lack of empirical evidence for the existence of such outperformance, asset management firms and consultants have larded their communication with promises of SRI fund outperformance and failed to express the necessary reservations. SRI is still growing fast, as shown by Novethic’s latest survey (2008), published in May. The survey shows that the French SRI market has experienced a 30% increase in assets under management; the equivalent increase for French mutual funds as a whole was only 1.7%. More precisely, institutional investors increased their holdings of SRI assets by 36% and individual investors by 19%. In France, SRI appears to be popular
with institutional investors, as well as with the general public, as shown by the results of a June 2007 IFOP10 survey cited by the Europlace11 report of May 2008. 73% of individual shareholders responding to the IFOP survey report that they are interested in information about socially responsible investment, and nearly half state that they have chosen at least one investment for its socially responsible characteristics. In addition, the existence of an SRI label would be a decisive criterion for 87% of them.
It is worth keeping in mind that many recently created SRI funds are in fact thematic funds—a departure from the initial SRI concept, closer to sector investment—that allow investment management companies to find new performance niches, at least for a limited time.
4. The Conclusions to be Drawn about SRI in France
10 - IFOP is a French Institute that takes opinion polls. 11 - Europlace is a Paris-based French organisation that promotes Paris as a financial market.

23
B. Magnier, Altedia IC: SRI Funds Often Beat Their BenchmarksBy Jean Cholet / 15 May 2008 / 04:17 Newsmanagers.com (Agefi)
According to Benoît Magnier, co-head of Altedia Investment Consulting, the funds with more than €500 million of assets under management outperformed their benchmarks by 4.8% in one year.
Altedia IC has just published a study of the performance of socially responsible and sustainable funds. This study, done by Altedia IC, of a sample of 139 international funds shows that, unlike conventional funds, socially responsible and sustainable funds have, on average, outperformed their benchmarks for a year, a period during which stock markets fell. Eighty-four of these funds are in the “best in class” category (without major sector deviations) and fifty are “thematic”.
Altedia IC observes that the largest socially responsible and sustainable funds, that is, those with more than €500 million of assets under management have outperformed to the tune of 4.8% for the year.
For Benoît Magnier, the contradictory results of many recent studies of SRI funds are linked to differences in the means of analysis.
Novethic has published studies on the quality of the processes and the assets but not so much on fund performance. The EDHEC study led to different results: “We think that our study, which looks at 139 World funds is representative of a broader approach than that of EDHEC, on the euro zone, which looks at twenty-eight funds distributed in France,” says Benoît Magnier.
Benoît Magnier thinks that drawing conclusions about the performance of SRI products on the strength of a study of little more than two dozen funds is premature or even reductive: “Many of those of us in the business would like to see a clearer, more transparent image of SRI, and we all have an interest in a shared approach to the market. Our study has convinced us that SRI funds have outperformed their benchmarks”.
Appendix 1

24
Graphs 1 and 2 display the complete alpha fund distribution, for 2007, by fund age, as well as the distribution of the correlation of the SRI fund returns and the returns of an SRI index for the corresponding investment zone. All investment zones are considered
as a whole. Alpha values are computed using the Fama-French three-factor model, which makes it possible to correct the results for style biases.
Appendix 2
Graph 1: Comparison of alpha fund distribution by fund age, all investment zones considered as a whole. The computation was made in 2007.
Graph 2: Comparison of the distribution of the correlations between SRI funds returns and the returns of an SRI index for the corresponding investment zone by fund age.

25
Appendix 2
Graphs 3 to 6 display the complete alpha fund distribution, for the 2007 year, by fund age, as well as the distribution of the correlation of the SRI fund returns and the returns of an SRI index for the corresponding investment zone. Funds are split into two groups by investment zone:
France, the Euro zone, and Europe in one group, and World in the other. Alpha values are computed using the Fama-French three-factor model, which makes it possible to correct the results for style biases.
Graph 3: Comparison of alpha fund distribution by fund age, for France, Euro zone, and Europe. The computation was done in 2007.
Graph 4: Comparison of the distribution of the correlations between SRI funds returns and the returns of an SRI index for the corresponding investment zone, by fund age.

26
Appendix 2
Graph 5: Comparison of alpha fund distribution according to fund age, for the World zone. The computation was done in 2007.
Graph 6: Comparison of the distribution of the correlations between SRI funds returns and the returns of an SRI index for the corresponding investment zone, by fund age.

27
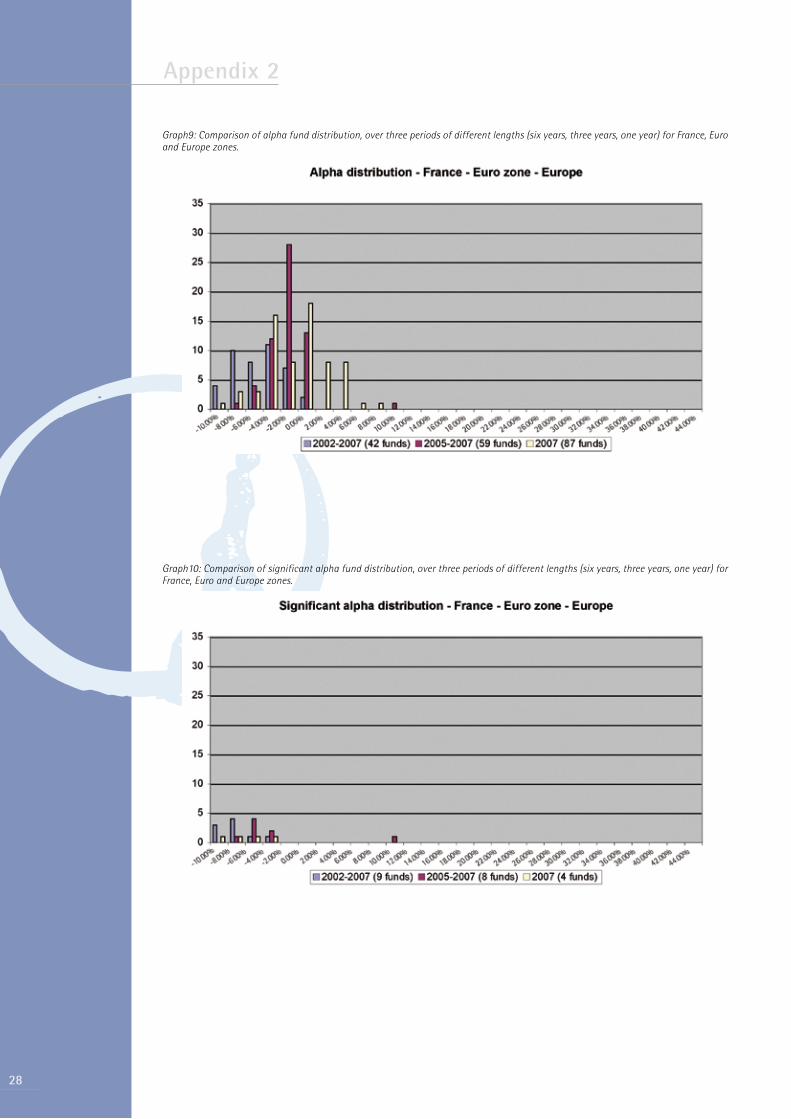
Graphs 7 to 12 display the complete alpha fund distribution, computed over three periods of various length (six years, three years, one year), first considering all investment zones as a whole (graphs 7 and 8), then separately for the France-Euro zone-Europe group (graphs 9 and 10) and for the World group (graphs 11 and
12). Alpha values are computed using the Fama-French three-factor model which makes it possible to correct the results for style biases. In all cases, we isolated on the graphs the significant alpha values (see the graphs displayed in the right column) from the non-significant ones
Appendix 2
Graph 7: Comparison of alpha fund distribution, over three periods of different lengths (six years, three years, one year) for all investment zones considered as a whole.
Graph 8: Comparison of significant alpha fund distribution, over three periods of different lengths (six years, three years, one year) for all investment zones considered as a whole.
28
Appendix 2
Graph9: Comparison of alpha fund distribution, over three periods of different lengths (six years, three years, one year) for France, Euro and Europe zones.
Graph10: Comparison of significant alpha fund distribution, over three periods of different lengths (six years, three years, one year) for France, Euro and Europe zones.

29
Appendix 2
Graph11: Comparison of alpha fund distribution, over three periods of different lengths (six years, three years, one year) World zone.
Graph12: Comparison of significant alpha fund distribution, over three periods of different lengths (six years, three years, one year) for World zone.

30
References
• Bailey, J. V. 1992. Are manager universes acceptable performance benchmarks? Journal of Portfolio Management 18 (3): 9-13.
• Bailey, J. V., T. M. Richards, and D. E. Tierney. 1990. Benchmarks, portfolios and the manager/plan sponsor relationship. In Current Topics in Investment Management, Frank J. Fabozzi and T. Dessa Fabozzi eds., Harper Collins: New York, 349-63.
• Brinson, G. P., B. D. Singer, and G. L. Beebower. 1991. Determinants of portfolio perfor-mance II: an update. Financial Analysts Journal 47(3): 40-8.
• Cornish, E. A., and R. A. Fisher. 1937. Moments and cumulants in the specification of distributions. Review of the International Statistical Institute 5: 307-20.
• Ibbotson, R. G., and P. D. Kaplan. 2000. Does asset allocation policy explain 49, 90 or 100 percent of performance? Financial Analysts Journal 56 (1): 26-33.
• Le Sourd, V. 2008. The performance of socially responsible investment – a study of the French market. EDHEC Risk and Asset Management Research Centre.
• Magnier, B., and E. Schaff. 2008. RSI fund performance analysis of responsible and sustainable equity funds. Altedia Investment Consulting (April).
• Novethic. 2007. The new frontiers of SRI: the green investments claiming to be SRI. Novethic Surveys (October).
• Novethic. 2008. 2007 annual study of the French SRI market: pooled, delegated and internal management (May).
• Roll, R. 1977. A critique of the asset pricing theory’s tests. Journal of Financial Economics 4 (2): 129-76.

31
Notes
....................................................................................................................................................................................................
....................................................................................................................................................................................................
....................................................................................................................................................................................................
....................................................................................................................................................................................................
....................................................................................................................................................................................................
....................................................................................................................................................................................................
....................................................................................................................................................................................................
....................................................................................................................................................................................................
....................................................................................................................................................................................................
....................................................................................................................................................................................................
....................................................................................................................................................................................................
....................................................................................................................................................................................................
....................................................................................................................................................................................................
....................................................................................................................................................................................................
....................................................................................................................................................................................................
....................................................................................................................................................................................................
....................................................................................................................................................................................................
....................................................................................................................................................................................................

32
Notes
....................................................................................................................................................................................................
....................................................................................................................................................................................................
....................................................................................................................................................................................................
....................................................................................................................................................................................................
....................................................................................................................................................................................................
....................................................................................................................................................................................................
....................................................................................................................................................................................................
....................................................................................................................................................................................................
....................................................................................................................................................................................................
....................................................................................................................................................................................................
....................................................................................................................................................................................................
....................................................................................................................................................................................................
....................................................................................................................................................................................................
....................................................................................................................................................................................................
....................................................................................................................................................................................................
....................................................................................................................................................................................................
....................................................................................................................................................................................................
....................................................................................................................................................................................................

33
Notes
....................................................................................................................................................................................................
....................................................................................................................................................................................................
....................................................................................................................................................................................................
....................................................................................................................................................................................................
....................................................................................................................................................................................................
....................................................................................................................................................................................................
....................................................................................................................................................................................................
....................................................................................................................................................................................................
....................................................................................................................................................................................................
....................................................................................................................................................................................................
....................................................................................................................................................................................................
....................................................................................................................................................................................................
....................................................................................................................................................................................................
....................................................................................................................................................................................................
....................................................................................................................................................................................................
....................................................................................................................................................................................................
....................................................................................................................................................................................................
....................................................................................................................................................................................................

EDHEC RISK AND ASSETMANAGEMENT RESEARCH CENTRE
393-400 promenade des Anglais06202 Nice Cedex 3Tel.: +33 (0)4 93 18 78 24Fax: +33 (0)4 93 18 78 41E-mail: [email protected]: www.edhec-risk.com
EDHEC is one of the top five business schools in France. Its reputation is built on the high quality of its faculty (110 professors and researchers from France and abroad) and the privileged relationship with professionals that the school has been developing since its establishment in 1906. EDHEC Business School has decided to draw on its extensive knowledge of the professional environment and has therefore focused its research on themes that satisfy the needs of professionals.
EDHEC pursues an active research policy in the field of finance. The EDHEC Risk and Asset Management Research Centre carries out numerous research programmes in the areas of asset allocation and risk management in both the traditional and alternative investment universes.
Copyright © 2008 EDHEC