
Social_Cards_2.20.15_DL
13
SOCIAL CARDS TRACKING Q1
-
Upload
derrick-ly -
Category
Documents
-
view
31 -
download
0
Transcript of Social_Cards_2.20.15_DL

SOCIAL CARDS
TRACKING Q1
BDE
Ad Status
Website Clicks
Benchmark CTR
Actual CTR
Actual CPC Budget Spent
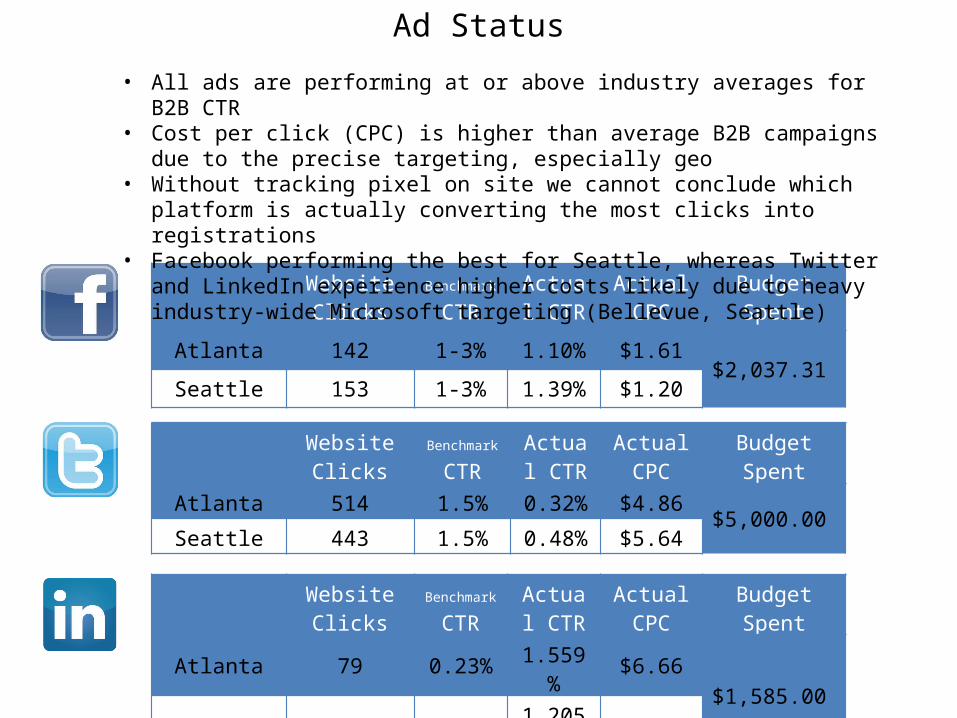
Atlanta 142 1-3% 1.10% $1.61$2,037.31
Seattle 153 1-3% 1.39% $1.20
• All ads are performing at or above industry averages for B2B CTR• Cost per click (CPC) is higher than average B2B campaigns due to the precise targeting,
especially geo• Without tracking pixel on site we cannot conclude which platform is actually
converting the most clicks into registrations• Facebook performing the best for Seattle, whereas Twitter and LinkedIn experience
higher costs likely due to heavy industry-wide Microsoft targeting (Bellevue, Seattle)
Website Clicks
Benchmark CTR
Actual CTR
Actual CPC Budget Spent
Atlanta 514 1.5% 0.32% $4.86$5,000.00
Seattle 443 1.5% 0.48% $5.64
Website Clicks
Benchmark CTR
Actual CTR
Actual CPC Budget Spent
Atlanta 79 0.23% 1.559% $6.66$1,585.00
Seattle 178 0.23% 1.205% $5.45

Ads Overview

ODT
MapR ODT Results
Campaign Name
Website Clicks
Benchmark CTR CTR CPC Reach Budget
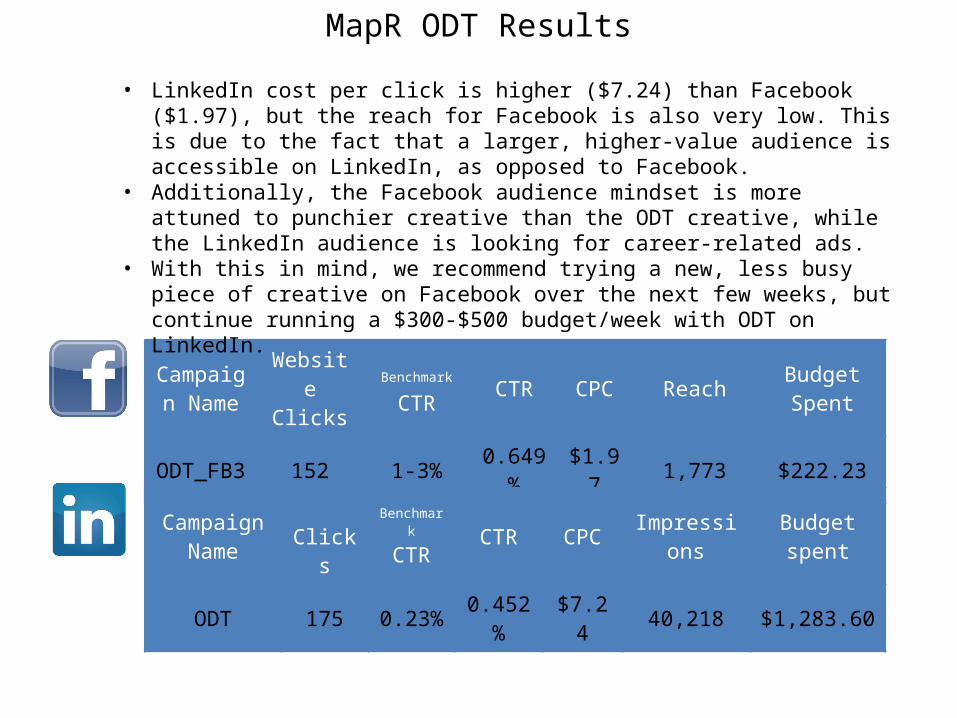
SpentODT_FB3 152 1-3% 0.649% $1.97 1,773 $222.23
Campaign Name Clicks Benchmark
CTR CTR CPC Impressions Budget spent
ODT 175 0.23% 0.452% $7.24 40,218 $1,283.60
• LinkedIn cost per click is higher ($7.24) than Facebook ($1.97), but the reach for Facebook is also very low. This is due to the fact that a larger, higher-value audience is accessible on LinkedIn, as opposed to Facebook.
• Additionally, the Facebook audience mindset is more attuned to punchier creative than the ODT creative, while the LinkedIn audience is looking for career-related ads.
• With this in mind, we recommend trying a new, less busy piece of creative on Facebook over the next few weeks, but continue running a $300-$500 budget/week with ODT on LinkedIn.

MapR ODT Status

5 Q’s

Twitter 5Q’s Results
Campaign Name Clicks Benchmark
CTR CTR CPC Impressions Budget spent
Twitter_5Q’s 246 1.5% 0.32% $1.59 76,059 $392.15
• We tested this as a Drive to Site card initially due to best practice learnings that the Lead Gen card often produces more spam than valuable leads. This week, we can try a head-to-head or keep running the drive-to-site, which is performing well.

Budget Status

Social Cards Spend to Date
Campaign Spend to date Budget Remaining
LinkedIn: BDE $1,585.00LinkedIn: ODT $1,283.60
Total Spend: $2,868.60 Remaining: $2,131.40
Facebook: BDE $2,037.31
Facebook: ODT $222.23
Total Spend: $2,259.54 Remaining: $2,740.46
Twitter: 5Qs $392.15Twitter: BDE $5,000.00
Total Spend: $5,392.15 Remaining: $4,607.85
Next Steps

Next Steps
This week’s NEW social card mix recommendations:SQL – Facebook ($500), LinkedIn ($500), Twitter – Drive to Site ($500)/Lead Gen ($500)• This banner below is being resized for social drive to site• Do we want Lead Gen too, despite the mixed reviews?Quick Start – Need URL and messaging doc once Jeannie shares matrix
Ongoing – recommended mix:5Q’s – Twitter Drive to Site ($500) ODT – $500 LinkedIn


