Social’and’Technological’’ Network’Analysis’ Lecture’6 ...
30
Social and Technological Network Analysis Lecture 6: Internet and Network Robustness Dr. Cecilia Mascolo
Transcript of Social’and’Technological’’ Network’Analysis’ Lecture’6 ...

Social and Technological Network Analysis
Lecture 6: Internet and Network Robustness
Dr. Cecilia Mascolo

In This Lecture
• We revisit power-‐law networks and define the concept of robustness
• We show the effect of random and targeted aIacks on power law networks versus random networks

Internet AS topology
• Autonomous System (AS): a collecLon of networks under the same administraLon
• 2009: 25,000 ASs in the Internet

Topology InformaLon
• By reading the rouLng tables of some gateways connected ASs, Internet topology informaLon could be gathered
• October 08: – Over 30,000 ASs (including repeated entries) – Over 100,000 edges

Degree distribuLon of ASs: A scale free network!
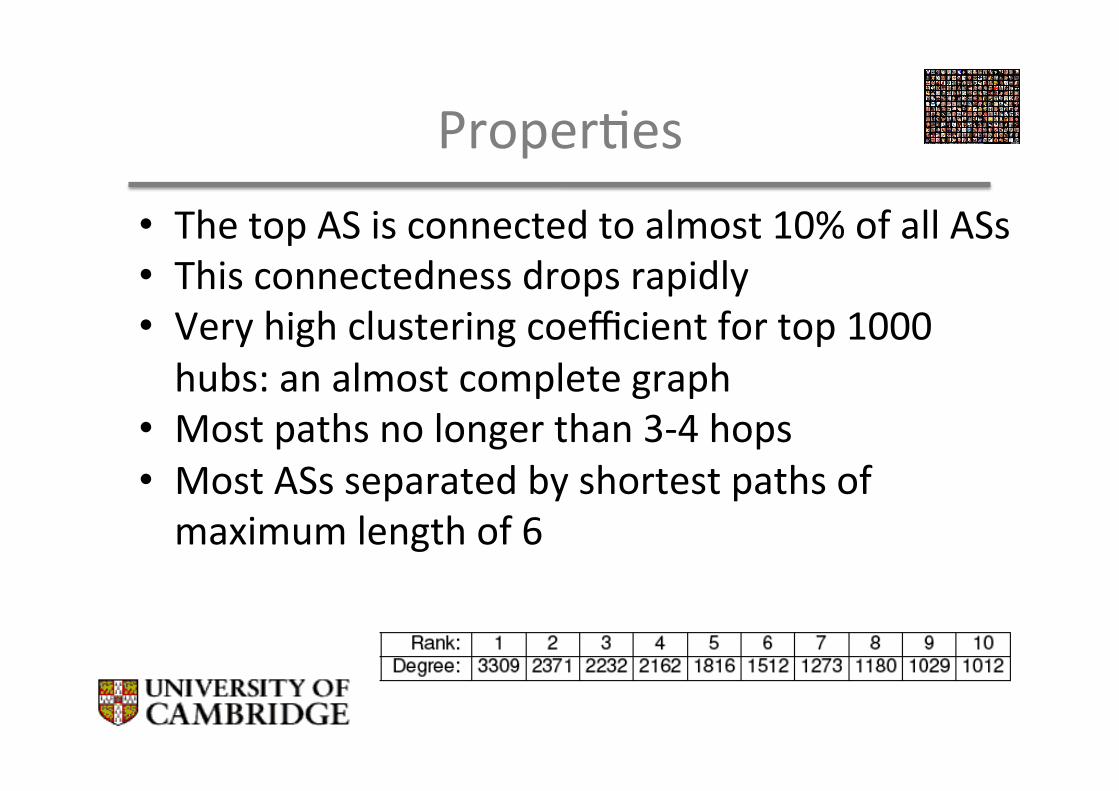
ProperLes • The top AS is connected to almost 10% of all ASs • This connectedness drops rapidly • Very high clustering coefficient for top 1000 hubs: an almost complete graph
• Most paths no longer than 3-‐4 hops • Most ASs separated by shortest paths of maximum length of 6
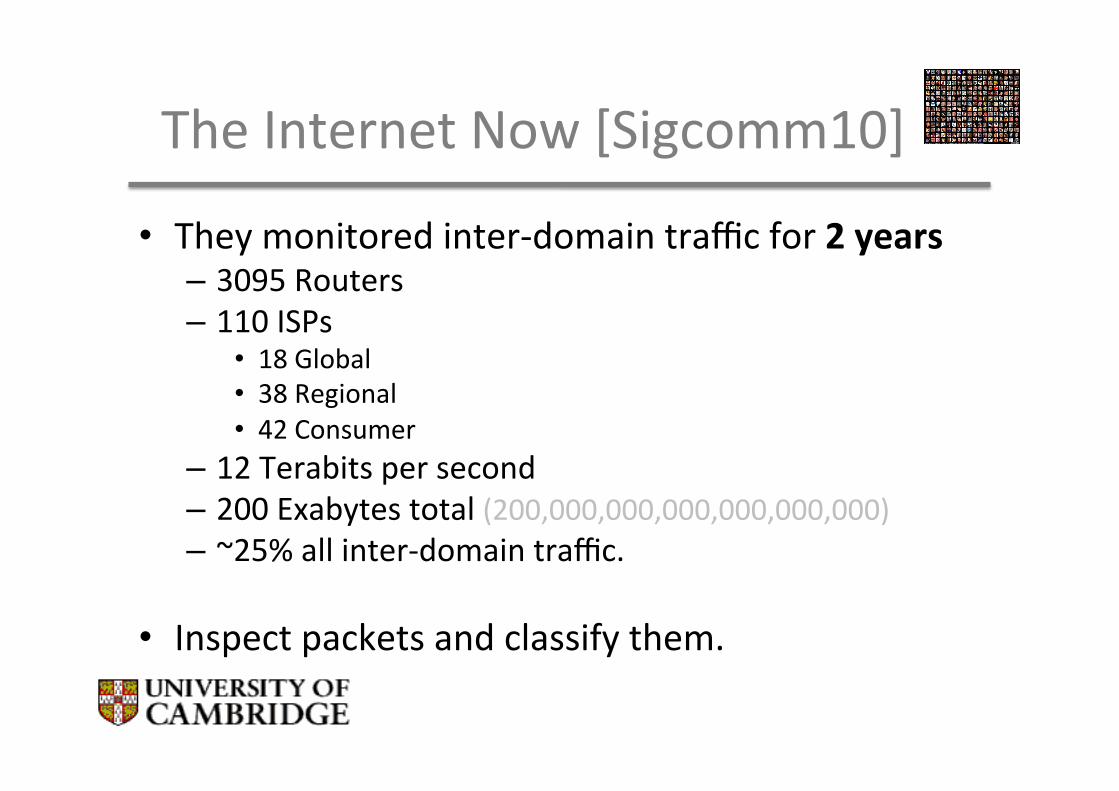
The Internet Now [Sigcomm10]
• They monitored inter-‐domain traffic for 2 years – 3095 Routers – 110 ISPs
• 18 Global • 38 Regional • 42 Consumer
– 12 Terabits per second – 200 Exabytes total (200,000,000,000,000,000,000) – ~25% all inter-‐domain traffic.
• Inspect packets and classify them.

Internet 2007

Internet 2009

Internet traffic: responsibility to few
Robustness
• If a fracLon of nodes or edges are removed: – How large are connected components? – What is the average distance between nodes in the components?
• This is related to Percola(on – each edge/node is removed with probability (1-‐p) • Corresponds to random failure
– Targeted aIacks: remove nodes with high degree, or edges with high betweenness.
• The formaLon or dissoluLon of a giant component defines the percolaLon threshold

How Robust are These?

Edge (or Bond) PercolaLon
• 50 nodes, 116 edges, average degree 4.64 • ager 25% edge removal • 76 edges, average degree 3.04 – sLll well above percolaLon threshold

average degree
size of giant com
pone
nt
av deg = 0.99 av deg = 1.18 av deg = 3.96
PercolaLon threshold: how many edges have to be removed before the giant component disappears? As the average degree increases to 1, a giant component suddenly appears Edge removal is the opposite process – at some point the average degree drops below 1 and the network becomes disconnected
PercolaLon threshold in Radom Graphs

Site PercolaLon
Ordinary Site PercolaLon on Lajces: Fill in each site (site percolaLon) with probability p
n low p: small islands of connected components. n p cri9cal: giant component forms, occupying finite fracLon of infinite lajce.
Other component sizes are power-‐law distributed n p above cri9cal value: giant component occupies an increasingly large fracLon of the
system.

Barabasi-‐Yeong-‐Albert’s study (2000)
• Given 2 networks (one exponenLal one scale free) with same number of nodes and links
• Remove a small number of nodes and study changes in average shortest path to see if informaLon communicaLon has been disrupted and how much.

Let’s look at the blue lines
• Random graph: increasing monotonically
• SF: remains unchanged unLl at least 5%
FracLon of deleted nodes
Network diam
eter

Let’s look at the red lines
• Random graph: same behaviour if nodes with most links are chosen first
• SF: with 5% nodes removed the diameter is doubled
FracLon of deleted nodes
Network diam
eter

Effect of aIacks and failure on WWW and Internet
FracLon of deleted nodes
Network diam
eter

Effect on Giant Component
FracLon of deleted nodes

Internet and WWW: Effect on Giant Component
FracLon of deleted nodes

Scale-‐free networks are resilient with respect to random aIack
• Example: Gnutella network, 20% of nodes removed
574 nodes in giant component 427 nodes in giant component

Targeted aIacks are affecLve against scale-‐free networks
• Example: same Gnutella network, 22 most connected nodes removed (2.8% of the nodes)
301 nodes in giant component 574 nodes in giant component

Another study of power-‐laws
• Graph shows fracLon of GC size over fracLon of nodes randomly removed
• Robustness of the Internet (γ is the exponent of PL). – γ =2.5 Virtually no threshold exists which means a GC is always present
– For γ=3.5 there is a threshold around .0.4
• K indicates the connecLvity level of the network considered

% of nodes removed, from highest to lowest degree
kmax is the highest degree among the remaining nodes
Skewness of power-‐law networks and effects and targeted aIack
γ= 2.7 only 1% nodes removed leads to no GC
Kmax needs to be very low (10) to destroy the GC

PercolaLon: let’s get formal
• PercolaLon process: • OccupaLon probability ϕ = number of nodes in the network [ie not removed]
• It can be proven that the criLcal threshold depends on the degree:
• This tells us the minimum fracLon of nodes which must exist for a GC to exist.
!
"c =< k >
< k 2 > # < k >

Threshold for Random Graphs
• For Random networks ϕcriLcal=1/c where c is the mean degree • If c is large the network can withstand the loss of many verLces
• c=4 then ¼ of verLces are enough to have a GC [3/4 of the verLces need to be destroyed to destroy the GC]

Threshold for Scale Free Networks
• For the Internet and Scale Free networks with 2<α<3 • Finite mean <k> however <k2> diverges (in theory)
• Then ϕcriLcal is zero: no maKer how many ver9ces we remove there will always be a GC
• In pracLce <k2> is never infinite for a finite network, although it can be very large, resulLng in very small ϕcriLcal , so sLll highly robust networks

Non random removal
• The threshold models we have presented hold for random node removal but not for targeted aIacks [ie removal of high degree nodes first]
• The equaLon for non random removal cannot be solved analyLcally

References • R. Albert, H. Jeong, A.-‐L. Barabási. Error and a-ack
tolerance of complex networks. Nature 406, 378-‐482 (2000).
• Cohen et al., Resilience of the Internet to Random Breakdowns. Phys. Rev. LeI. 85, 4626 (2000).
• D. S. Callaway, M. E. J. Newman, S. H. Strogatz, and D. J. WaIs, Network robustness and fragility: Percola(on on random graphs, Phys. Rev. LeI., 85 (2000), pp. 5468–5471.
• Craig Labovitz, ScoI Iekel-‐Johnson, Danny McPherson, Jon Oberheide, Farnam Jahanian. Internet inter-‐domain traffic. Proceedings of ACM SIGCOMM 2010 conference. Pages 75-‐86. ACM.