Social Welfare, Redistribution, and the Tradeoff between ... · Social Welfare, Redistribution, and...
30
Social Welfare, Redistribution, and the Tradeoff between Efficiency and Equity, with Developing Country Applications Jon Bakija Williams College First Draft: August 2012 This Draft: August 2014 Abstract: The economic literature on “optimal income taxation” addresses the question of how to design tax and transfer policy so as to maximize “social welfare,” which is some function of the well- being of all members of society. It clarifies how the social-welfare-maximizing policy depends on one’s philosophy of distributive justice, and on empirical evidence about the behavioral response to incentives, and thus provides a systematic way of evaluating the tradeoff between equity and efficiency. Here, I explain the key insights of the optimal income taxation literature in a way that should be accessible to those with a familiarity with introductory economics, and then provide a brief introduction to some interesting pieces of evidence from around the world that are relevant to this question. 1
Transcript of Social Welfare, Redistribution, and the Tradeoff between ... · Social Welfare, Redistribution, and...
Social Welfare, Redistribution, and the Tradeoff between Efficiency and Equity, with Developing Country Applications
Jon Bakija
Williams College First Draft: August 2012 This Draft: August 2014
Abstract: The economic literature on “optimal income taxation” addresses the question of how to design tax and transfer policy so as to maximize “social welfare,” which is some function of the well-being of all members of society. It clarifies how the social-welfare-maximizing policy depends on one’s philosophy of distributive justice, and on empirical evidence about the behavioral response to incentives, and thus provides a systematic way of evaluating the tradeoff between equity and efficiency. Here, I explain the key insights of the optimal income taxation literature in a way that should be accessible to those with a familiarity with introductory economics, and then provide a brief introduction to some interesting pieces of evidence from around the world that are relevant to this question.
1
I. Social Welfare, the Tradeoff between Equity and Efficiency, and Optimal Income Taxation: Theory
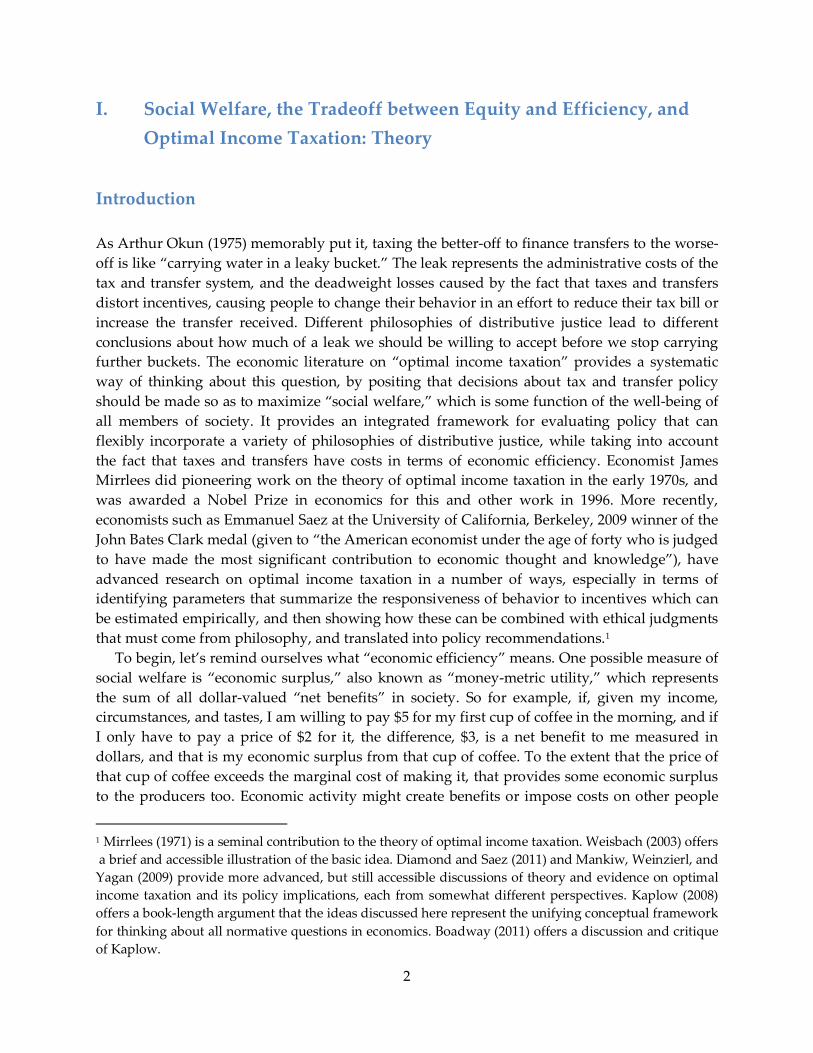
Introduction As Arthur Okun (1975) memorably put it, taxing the better-off to finance transfers to the worse-off is like “carrying water in a leaky bucket.” The leak represents the administrative costs of the tax and transfer system, and the deadweight losses caused by the fact that taxes and transfers distort incentives, causing people to change their behavior in an effort to reduce their tax bill or increase the transfer received. Different philosophies of distributive justice lead to different conclusions about how much of a leak we should be willing to accept before we stop carrying further buckets. The economic literature on “optimal income taxation” provides a systematic way of thinking about this question, by positing that decisions about tax and transfer policy should be made so as to maximize “social welfare,” which is some function of the well-being of all members of society. It provides an integrated framework for evaluating policy that can flexibly incorporate a variety of philosophies of distributive justice, while taking into account the fact that taxes and transfers have costs in terms of economic efficiency. Economist James Mirrlees did pioneering work on the theory of optimal income taxation in the early 1970s, and was awarded a Nobel Prize in economics for this and other work in 1996. More recently, economists such as Emmanuel Saez at the University of California, Berkeley, 2009 winner of the John Bates Clark medal (given to “the American economist under the age of forty who is judged to have made the most significant contribution to economic thought and knowledge”), have advanced research on optimal income taxation in a number of ways, especially in terms of identifying parameters that summarize the responsiveness of behavior to incentives which can be estimated empirically, and then showing how these can be combined with ethical judgments that must come from philosophy, and translated into policy recommendations.1
To begin, let’s remind ourselves what “economic efficiency” means. One possible measure of social welfare is “economic surplus,” also known as “money-metric utility,” which represents the sum of all dollar-valued “net benefits” in society. So for example, if, given my income, circumstances, and tastes, I am willing to pay $5 for my first cup of coffee in the morning, and if I only have to pay a price of $2 for it, the difference, $3, is a net benefit to me measured in dollars, and that is my economic surplus from that cup of coffee. To the extent that the price of that cup of coffee exceeds the marginal cost of making it, that provides some economic surplus to the producers too. Economic activity might create benefits or impose costs on other people
1 Mirrlees (1971) is a seminal contribution to the theory of optimal income taxation. Weisbach (2003) offers a brief and accessible illustration of the basic idea. Diamond and Saez (2011) and Mankiw, Weinzierl, and Yagan (2009) provide more advanced, but still accessible discussions of theory and evidence on optimal income taxation and its policy implications, each from somewhat different perspectives. Kaplow (2008) offers a book-length argument that the ideas discussed here represent the unifying conceptual framework for thinking about all normative questions in economics. Boadway (2011) offers a discussion and critique of Kaplow.
2
not directly involved in the market transaction, and that would be accounted for in economic surplus too – so for example, in the case of an “externality” such as pollution, the dollar-valued harm from the pollution would represent a loss of economic surplus. In the absence of “market failures” such as externalities, free markets are economically efficient, in the sense of maximizing economic surplus, because consumers and producers will do all things for which the dollar-valued benefits exceed the dollar-valued costs to them, and none of the things for which the dollar-valued costs exceed the dollar-valued benefits to them. The optimal income tax literature is motivated by the recognition that economic surplus is a highly imperfect concept of social welfare.
Utilitarian Social Welfare Analysis
An influential alternative concept of social welfare is utilitarian social welfare, which is the sum of individual utilities in society. Whereas economic efficiency is about maximizing the sum of money metric utilities (economic surplus, or well-being measured in dollars), utilitarianism is about maximizing the sum of utilities, denominated in units of happiness rather than in dollars. While that might seem like a subtle distinction, the implications for public policy can be wildly different under utilitarianism compared to an ethic that only values economic efficiency. Utilitarianism is a more general and flexible concept of social welfare than economic surplus, in that that allows for the plausible possibility that there is diminishing marginal utility – that is, an additional dollar of well-being translates to a larger improvement in utility for someone who is economically worse-off compared to someone who is economically better-off. So for example, an additional $100 might enable an affluent family to buy a few more magazine subscriptions, but it might enable a poor family to avoid starvation.
Empirical evidence on how people respond to risky situations (for example, buying insurance, or demanding a risk premium to be willing to hold a risky asset) are consistent with the idea of diminishing marginal utility.2 In principle, one can estimate how quickly marginal utility diminishes as income increases for a given individual by observing how their behavior changes in response to risky situations, the degree to which they try to smooth their consumption over time, and so forth. We cannot scientifically estimate how levels of utility differ across people, though. There is no way to objectively measure and compare the absolute level of joy or pain across people. So to make a utilitarian social welfare analysis operational, we need to make some assumptions about the nature of each person’s utility function that are potentially testable (e.g., the curvature of each individual’s the utility function), and some assumptions that not empirically testable (e.g., how the level of utility compares across individuals). Alternatively, we might think of assumptions about the latter as ethical judgments about how much each person’s utility should count when adding up social welfare.
Utilitarianism is often criticized on the grounds that there is no objective way to make inter-
2 An explanation of the connection between behavior in response to risk and diminishing marginal utility is provided in Chapter 12 of Gruber (2011).
3
personal comparisons of utility. However, it is also well-recognized in economics that evaluating policy based on whether or not it is “economically efficient” implicitly involves a similar problem, unless we confine ourselves only to recommending actual Pareto improvements (changes that make at least one person better off without harming anyone else). Actual Pareto improvements are so rare as to make the concept almost completely useless as a guide to policy. If we instead evaluate a policy change based on whether it is “economically efficient” in the sense of increasing economic surplus, then there may be both winners and losers from the policy, and all we can say is that the gains to the winners are larger than the losses to the losers when measured in dollars. If we claim that a policy change that is not a Pareto improvement is “good” or “social welfare enhancing” because it has a net positive impact on economic surplus, then our evaluation implicitly involves an inter-personal comparison of well-being, and that comparison relies on a metric of well-being which ignores diminishing marginal utility.3
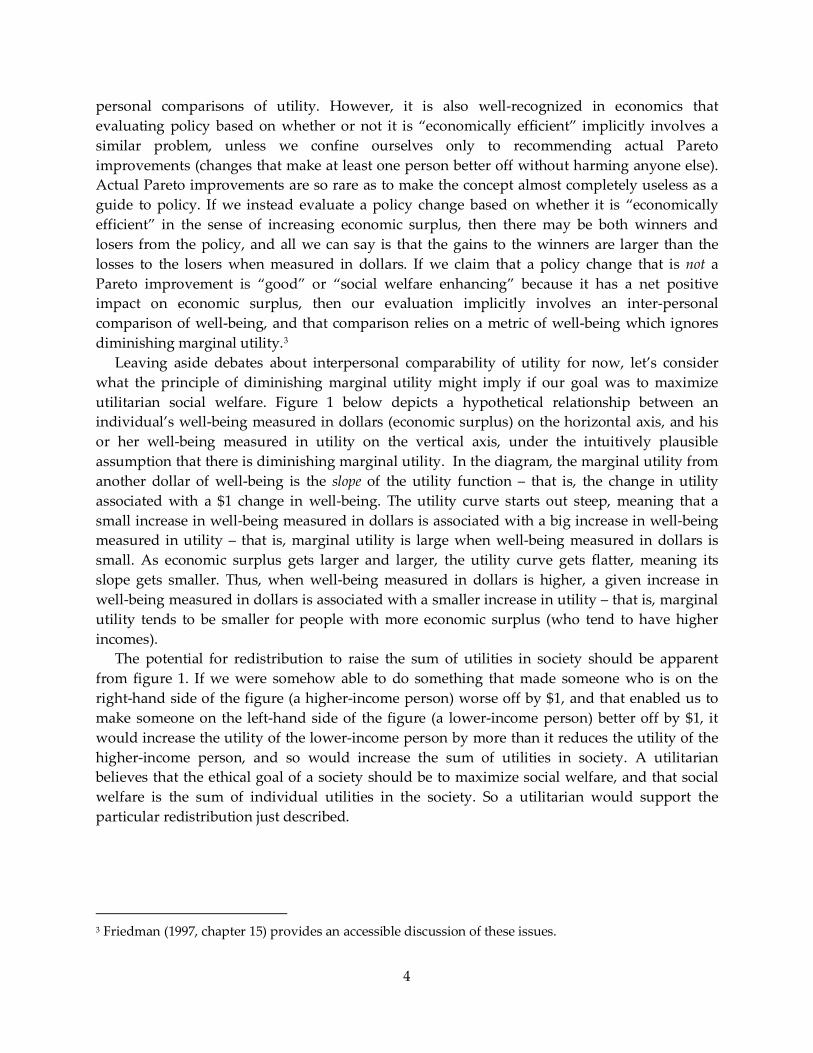
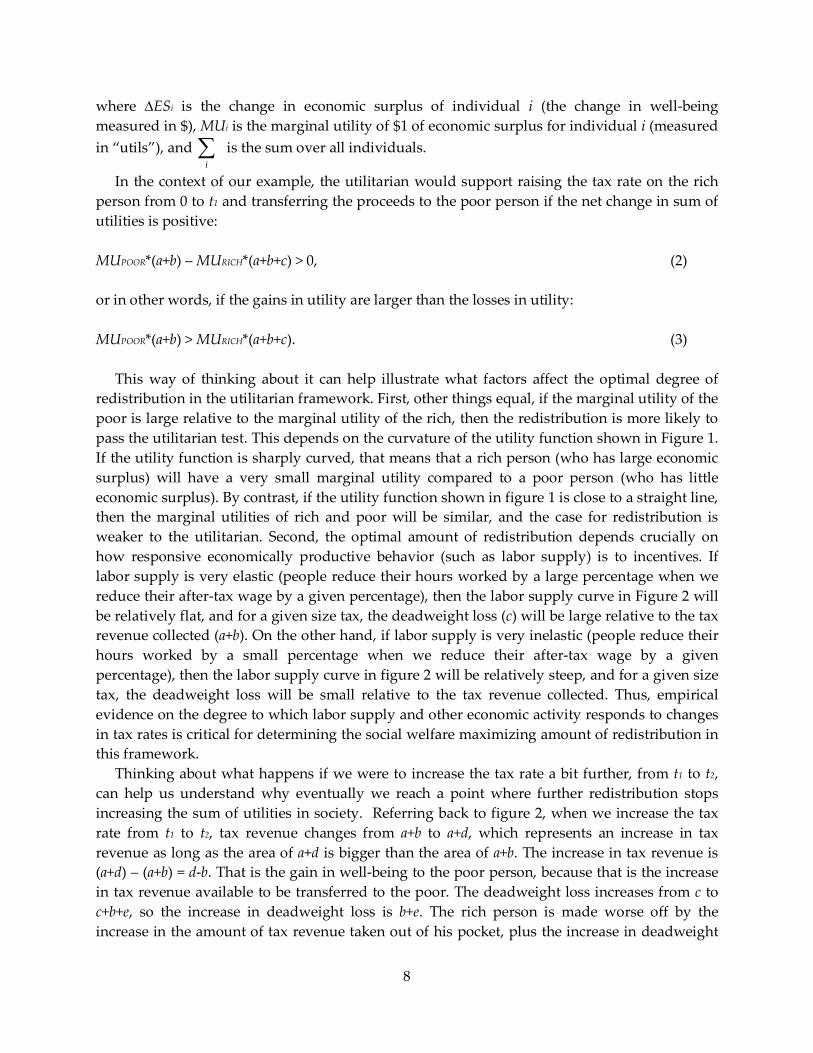
Leaving aside debates about interpersonal comparability of utility for now, let’s consider what the principle of diminishing marginal utility might imply if our goal was to maximize utilitarian social welfare. Figure 1 below depicts a hypothetical relationship between an individual’s well-being measured in dollars (economic surplus) on the horizontal axis, and his or her well-being measured in utility on the vertical axis, under the intuitively plausible assumption that there is diminishing marginal utility. In the diagram, the marginal utility from another dollar of well-being is the slope of the utility function – that is, the change in utility associated with a $1 change in well-being. The utility curve starts out steep, meaning that a small increase in well-being measured in dollars is associated with a big increase in well-being measured in utility – that is, marginal utility is large when well-being measured in dollars is small. As economic surplus gets larger and larger, the utility curve gets flatter, meaning its slope gets smaller. Thus, when well-being measured in dollars is higher, a given increase in well-being measured in dollars is associated with a smaller increase in utility – that is, marginal utility tends to be smaller for people with more economic surplus (who tend to have higher incomes).
The potential for redistribution to raise the sum of utilities in society should be apparent from figure 1. If we were somehow able to do something that made someone who is on the right-hand side of the figure (a higher-income person) worse off by $1, and that enabled us to make someone on the left-hand side of the figure (a lower-income person) better off by $1, it would increase the utility of the lower-income person by more than it reduces the utility of the higher-income person, and so would increase the sum of utilities in society. A utilitarian believes that the ethical goal of a society should be to maximize social welfare, and that social welfare is the sum of individual utilities in the society. So a utilitarian would support the particular redistribution just described.
3 Friedman (1997, chapter 15) provides an accessible discussion of these issues.
4
In the utilitarian framework, one needs to take into account that redistributing from rich to
poor requires taxes and transfers that generally reduce incentives to engage in productive activity. That is part of what creates the “leak in the bucket.” The deadweight loss (net reduction in aggregate economic surplus in society) from taxation means that redistribution from rich to poor makes the rich worse off by more than it makes the poor better off when measured in dollars. To a utilitarian, this must be weighed against the gains in utility from redistributing from people with low marginal utility to people with high marginal utility described earlier.
One way to do this would be to make assumptions about the functional forms of peoples’ utility functions, measure their wages, and work out the social-welfare maximizing tax rates and transfers. The basic idea is that a utility function that includes consumption and leisure implies a particular labor supply curve for that individual, and once you know the individual’s utility function and labor supply curve, you can derive how hours worked, tax revenues, and the transfers financed by tax revenues change when tax rates change, which gives you everything you need to solve the problem. The utilitarian would then favor the combination of tax rates and transfers that maximizes the sum of utilities in society. Weisbach (2003) illustrates the basic idea with a simple example, although the example is not meant to be empirically realistic, but rather mathematically convenient so as to illustrate the principles involved. Actually determining the nature of peoples’ utility functions would be an extremely difficult empirical and philosophical challenge, but economists have done a great deal of empirical research that contributes to piecing together this puzzle.
In what follows, I provide a simplified way to think about the question that helps convey the basic issues involved, and points out key factors that influence where the social-welfare maximizing point might lie, in a way that is more transparent than Weisbach’s example. Even though some of these factors may be difficult or impossible to pin down empirically, some are
Utility
Economic Surplus ($)
Utility Function
Figure 1 – A Hypothetical Relationship between Well-Being Measured in Dollars and Well-Being Measured in Utility
5
indeed amenable to empirical investigation, and others are arguably matters of ethical reasoning – this kind of analysis at least helps clarify where the ethical judgments come into play and how they matter.
To illustrate what factors the social welfare maximizing solution depends on, let’s consider a simple example where we are going to tax the labor income of one rich person, and then transfer the resulting tax revenue directly to a poor person as a lump-sum grant. In this simplified example, we only need to worry about the deadweight loss caused by taxing the rich person, because lump-sum transfers cause no deadweight loss.4 To keep things simple, we will also assume that the demand for the rich person’s labor is perfectly elastic at his pre-tax wage. This is a non-trivial assumption, because if demand for the labor of the rich is not perfectly elastic, then some of the burden of the tax on them will be shifted onto someone else, and we’d have to take that into account too – to the extent the burden of taxes on the rich are shifted onto other people who are less well-off, that would reduce the optimal amount of redistributive taxation in a utilitarian framework, because the taxation may be hurting some of the people we are intending to help. This is part of what opponents of high tax rates on the rich have in mind when they lament that taxing the “job creators” ends up hurting others. But starting with the assumption of perfectly elastic demand for the labor of the rich enables us to illustrate the basic ideas simply by confining our attention to just two people.
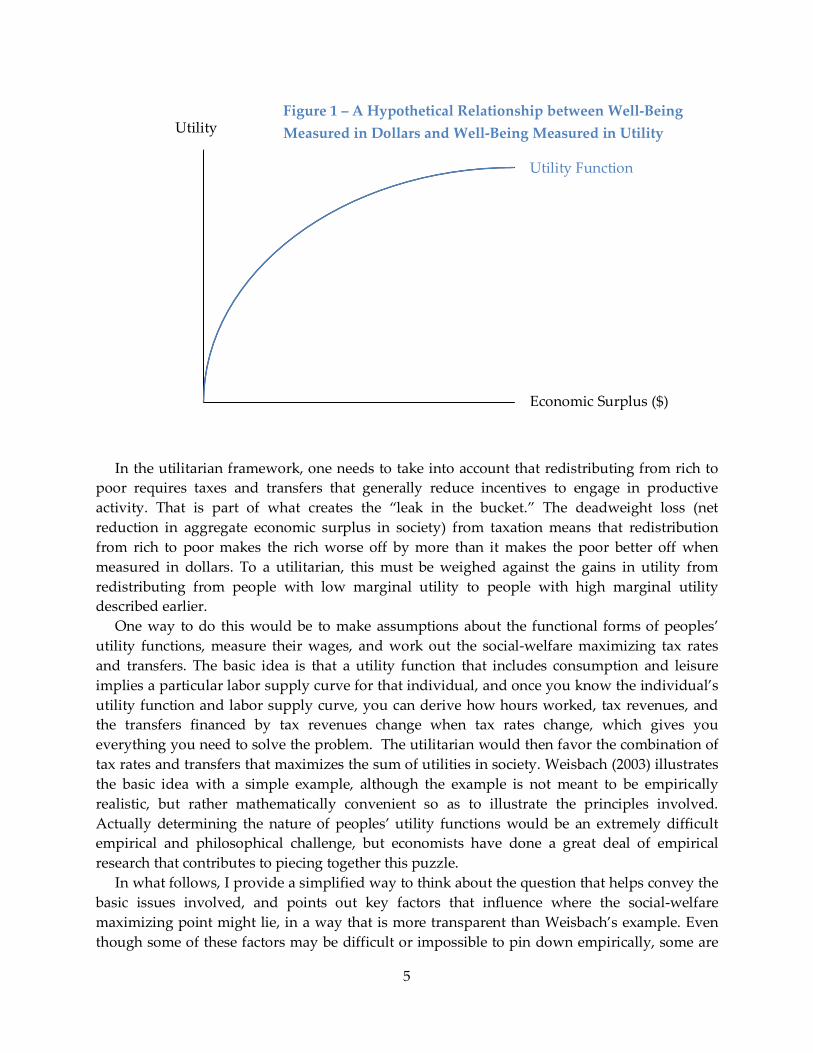
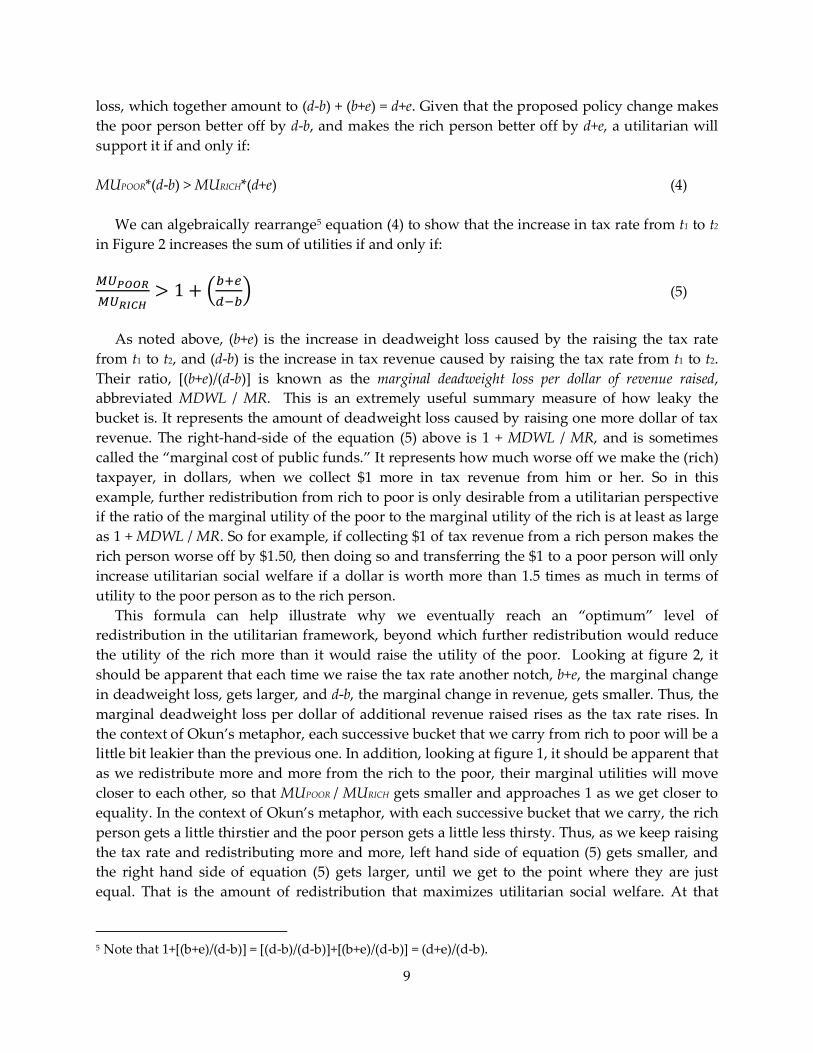
Under the assumptions described above, figure 2 depicts the effects of a labor income tax on the labor supply and economic surplus of the rich person. To begin, suppose that we are starting from a situation with no taxes or transfers, and we are considering whether to impose a tax on the labor income of the rich person at a rate of t1. This puts a wedge between the demand for the rich person’s labor and the supply equal to t1W, where W is the rich person’s pre-tax wage (in other words, t1W is the tax per hour worked expressed in dollars). The revenue from the tax will be transferred entirely to the poor person in a lump-sum fashion. Each letter a through f represents the area of the shape that the letter labels (the areas are measured in dollars).
A tax at rate t1 causes the rich person to reduce hours worked from H0 to H1. It collects tax revenue equal to a+b, and that is how much we have available to transfer to the poor person, and thus how much better-off we can make the poor person, measured in dollars. However, the rich person is made worse off by more than that when measured in dollars: a+b+c. The difference (c) arises due to the deadweight loss of taxation – the loss of economic surplus that occurs because people change their behavior when their incentives are distorted by taxes. By reducing hours worked from H0 to H1, the rich person’s before-tax income is reduced by c+f. This is partly compensated by a gain in leisure, but the extra leisure is only worth f to the rich person (recall that the area under the supply curve represents the opportunity cost, or value of the next best alternative, for the activity in question – in this case, the opportunity cost of working is the value of the leisure that is foregone). The difference between the lost pre-tax income and the
4 “Lump-sum” means that the tax or transfer is a fixed amount regardless of what the person does -- there is no way to change one’s behavior in order to reduce or increase the amount of a lump-sum tax or transfer. For an explanation of why lump-sum taxes and transfers do not involve deadweight loss, see Rosen and Gayer (2008, pp. 331-340) and Bakija (2011).
6
value of the leisure gained is c, and that is the deadweight loss or “excess burden” (hidden cost) of taxation. Reducing hours worked from H0 to H1 reduces the rich person’s tax bill by more than the deadweight loss, which is why it makes sense to do this from his or her individual perspective. But the tax bill that the rich person avoids just represents transfer, not a net change in aggregate economic surplus for the society (avoiding the tax is a gain to the rich person, but an equal loss to the poor person who would otherwise have received a bigger transfer). The deadweight loss, by contrast, is a net loss of economic surplus to society. It represents the amount by which the dollar value of income between H0 and H1 that we are losing had exceeded the dollar value leisure that we get instead.
To a utilitarian, taxing the rich person at a rate of t1 and transferring the revenue to the poor
person is only a good idea if making the poor person better off by a+b dollars increases his or her utility by more than making the rich person worse off by a+b+c dollars reduces his or her utility. In order to figure out whether that is so, we need to convert changes in well-being measured in dollars into changes in well-being measured in utility. That requires multiplying each person’s change in well-being measured in dollars (change in economic surplus, or ΔES for short) by his or her marginal utility (that is, the change in utility associated with one more dollar of economic surplus, or MU for short). As a general rule, a utilitarian will support a policy change if:
( )( ) 0i i
iES MU ∆ > ∑ (1)
Demand (pre-tax wage)
Supply Wage ($)
Hours Worked H0 H1 H2
c b a
e d
t1W
Figure 2 – A Tax on Labor Income
f
t2W
7
where ∆ESi is the change in economic surplus of individual i (the change in well-being measured in $), MUi is the marginal utility of $1 of economic surplus for individual i (measured in “utils”), and
i∑ is the sum over all individuals.
In the context of our example, the utilitarian would support raising the tax rate on the rich person from 0 to t1 and transferring the proceeds to the poor person if the net change in sum of utilities is positive:
MUPOOR*(a+b) – MURICH*(a+b+c) > 0, (2)
or in other words, if the gains in utility are larger than the losses in utility:
MUPOOR*(a+b) > MURICH*(a+b+c). (3)
This way of thinking about it can help illustrate what factors affect the optimal degree of
redistribution in the utilitarian framework. First, other things equal, if the marginal utility of the poor is large relative to the marginal utility of the rich, then the redistribution is more likely to pass the utilitarian test. This depends on the curvature of the utility function shown in Figure 1. If the utility function is sharply curved, that means that a rich person (who has large economic surplus) will have a very small marginal utility compared to a poor person (who has little economic surplus). By contrast, if the utility function shown in figure 1 is close to a straight line, then the marginal utilities of rich and poor will be similar, and the case for redistribution is weaker to the utilitarian. Second, the optimal amount of redistribution depends crucially on how responsive economically productive behavior (such as labor supply) is to incentives. If labor supply is very elastic (people reduce their hours worked by a large percentage when we reduce their after-tax wage by a given percentage), then the labor supply curve in Figure 2 will be relatively flat, and for a given size tax, the deadweight loss (c) will be large relative to the tax revenue collected (a+b). On the other hand, if labor supply is very inelastic (people reduce their hours worked by a small percentage when we reduce their after-tax wage by a given percentage), then the labor supply curve in figure 2 will be relatively steep, and for a given size tax, the deadweight loss will be small relative to the tax revenue collected. Thus, empirical evidence on the degree to which labor supply and other economic activity responds to changes in tax rates is critical for determining the social welfare maximizing amount of redistribution in this framework.
Thinking about what happens if we were to increase the tax rate a bit further, from t1 to t2, can help us understand why eventually we reach a point where further redistribution stops increasing the sum of utilities in society. Referring back to figure 2, when we increase the tax rate from t1 to t2, tax revenue changes from a+b to a+d, which represents an increase in tax revenue as long as the area of a+d is bigger than the area of a+b. The increase in tax revenue is (a+d) – (a+b) = d-b. That is the gain in well-being to the poor person, because that is the increase in tax revenue available to be transferred to the poor. The deadweight loss increases from c to c+b+e, so the increase in deadweight loss is b+e. The rich person is made worse off by the increase in the amount of tax revenue taken out of his pocket, plus the increase in deadweight
8
loss, which together amount to (d-b) + (b+e) = d+e. Given that the proposed policy change makes the poor person better off by d-b, and makes the rich person better off by d+e, a utilitarian will support it if and only if:
MUPOOR*(d-b) > MURICH*(d+e) (4)
We can algebraically rearrange5 equation (4) to show that the increase in tax rate from t1 to t2
in Figure 2 increases the sum of utilities if and only if:
𝑀𝑈𝑃𝑂𝑂𝑅𝑀𝑈𝑅𝐼𝐶𝐻
> 1 + �𝑏+𝑒𝑑−𝑏
� (5)
As noted above, (b+e) is the increase in deadweight loss caused by the raising the tax rate
from t1 to t2, and (d-b) is the increase in tax revenue caused by raising the tax rate from t1 to t2. Their ratio, [(b+e)/(d-b)] is known as the marginal deadweight loss per dollar of revenue raised, abbreviated MDWL / MR. This is an extremely useful summary measure of how leaky the bucket is. It represents the amount of deadweight loss caused by raising one more dollar of tax revenue. The right-hand-side of the equation (5) above is 1 + MDWL / MR, and is sometimes called the “marginal cost of public funds.” It represents how much worse off we make the (rich) taxpayer, in dollars, when we collect $1 more in tax revenue from him or her. So in this example, further redistribution from rich to poor is only desirable from a utilitarian perspective if the ratio of the marginal utility of the poor to the marginal utility of the rich is at least as large as 1 + MDWL / MR. So for example, if collecting $1 of tax revenue from a rich person makes the rich person worse off by $1.50, then doing so and transferring the $1 to a poor person will only increase utilitarian social welfare if a dollar is worth more than 1.5 times as much in terms of utility to the poor person as to the rich person.
This formula can help illustrate why we eventually reach an “optimum” level of redistribution in the utilitarian framework, beyond which further redistribution would reduce the utility of the rich more than it would raise the utility of the poor. Looking at figure 2, it should be apparent that each time we raise the tax rate another notch, b+e, the marginal change in deadweight loss, gets larger, and d-b, the marginal change in revenue, gets smaller. Thus, the marginal deadweight loss per dollar of additional revenue raised rises as the tax rate rises. In the context of Okun’s metaphor, each successive bucket that we carry from rich to poor will be a little bit leakier than the previous one. In addition, looking at figure 1, it should be apparent that as we redistribute more and more from the rich to the poor, their marginal utilities will move closer to each other, so that MUPOOR / MURICH gets smaller and approaches 1 as we get closer to equality. In the context of Okun’s metaphor, with each successive bucket that we carry, the rich person gets a little thirstier and the poor person gets a little less thirsty. Thus, as we keep raising the tax rate and redistributing more and more, left hand side of equation (5) gets smaller, and the right hand side of equation (5) gets larger, until we get to the point where they are just equal. That is the amount of redistribution that maximizes utilitarian social welfare. At that
5 Note that 1+[(b+e)/(d-b)] = [(d-b)/(d-b)]+[(b+e)/(d-b)] = (d+e)/(d-b).
9
point, any further redistribution would reduce the utility of the rich more than it increases the utility of the poor. Other things equal, when behavior such as labor supply is more elastic with respect to incentives, then MDWL / MR will be larger, and the social welfare maximizing tax rate will be lower.
The simplified analysis above is of course just an approximation. One reason is that the marginal utility of each person is changing continuously with each dollar of redistribution, so using a fixed value of MU in any of the equations above will not get things exactly right. Still, for reasonably small changes in tax rate, using the MU that applied at the beginning tax rate and holding it constant will usually come very close to giving you the right answer. Another reason is that the deadweight loss measured from figure 2 will also just be an approximation as long as a tax change has both substitution effects and income effects. For technical reasons, measuring deadweight loss accurately requires isolating the change in economic behavior that is due solely to the substitution effect, and removing any changes arising from the income effect.6
Other Philosophies of Distributive Justice and Social Welfare Analysis
Saez and Stantcheva (2013) show how the basic optimal income tax framework laid out above can be adapted to accommodate virtually any philosophy of distributive justice, and can even accommodate combinations of the different philosophies. The key insight is to replace the marginal utilities (MU) in the example above with “marginal social welfare weights,” which represent the ethical value that we assign to dollar-valued gains and losses to different people. The idea is that in virtually any philosophy of distributive justice, we ought to care about the dollar-valued costs and benefits of achieving our ethical goals, but we also ought to weight dollar-valued costs and benefits to different people differently depending on the ethical value of gains and losses to those people. Here are a few examples.
Philosopher John Rawls argued that public policy should be designed so as to maximize the well-being of the worst-off person in society. In the Saez and Stantcheva framework, that would correspond to evaluating whether a policy change is an improvement by multiplying dollar-valued gains and losses to the worst-off person in society by a marginal social welfare weight of one, and multiplying dollar-valued gains and losses to all other members of society by a marginal social welfare weight of zero. In our stylized example above, that would mean raising taxes on the rich person to the revenue maximizing rate (i.e., going to the peak of the Laffer curve, but no further). At that point, any further increases in the tax rate would reduce tax revenue, and therefore the transfer to the poor person, making the poor person worse off.
“Equality of opportunity” is another ethical principle commonly invoked in the debate over the appropriate role for government, although not everyone agrees on what it means or implies for policy. To some influential thinkers, such as philosopher Ronald Dworkin and economist John Roemer, equality of opportunity requires designing government policy to compensate as fully as possible for differences in well-being that are due to luck (or more generally, factors beyond the individual’s control), and to compensate as little as possible for differences in well-
6 See Bakija (2011b) and Rosen and Gayer (2008) for an explanation.
10
being that are due to effort and voluntary choice. The idea (also known as “luck egalitarianism”) is that individuals have a stronger moral claim to income arising from effort than from luck, and a stronger moral claim on help from society to the extent their bad fortune arises through no fault of their own. The difficulty of disentangling what portion of one’s circumstance is caused by one’s own effort and choices from what is due to factors beyond one’s control makes it infeasible to implement this principle precisely. But some practical government policy measures, such as improving access to high-quality education among children born to low-income parents, or helping those with medical problems arising from genetic bad luck to afford health care, seem consistent with this principle. Moreover, it implies that even if we can’t practically disentangle the role of effort from the role of luck for any particular individual, the ethically desirable degree of tax progressivity ought to be greater when luck accounts for a larger portion of income variation in general. The idea does seem to capture an important element of popular thinking on inequality – as Google chief economist, and former Berkeley and University of Michigan professor, Hal Varian, says, “if you want to determine whether someone is a Republican or a Democrat, just ask that person whether differences in income come mostly from luck...”
In the Saez and Stantcheva framework, a “luck egalitarian” ethic would correspond to assigning large marginal social welfare weights to dollar-valued gains and losses of people who are badly off through no fault of their own, and smaller marginal social welfare weights to dollar-valued gains and losses of people who are well-off due to good luck, or badly off due to their own choices and effort. Again, practically speaking, this might mean particularly favoring redistribution that takes the form of government provided or subsidized insurance against unfortunate circumstances, such as disability or genetic health conditions, or providing high-quality early childhood education to children unlucky enough to be born into disadvantaged home.
By contrast, a view of justice commonly advocated by libertarians is that as long as the economic system that determines (pre-tax) incomes in society is just (for example, the income did not result from theft), then the outcomes are just: people have a right to keep what they earn. This view is elucidated by philosopher Robert Nozick in his 1977 book Anarchy, State and Utopia. Mankiw (2010) appeals to Nozick’s principle in arguing that the distribution of tax burdens should be guided exclusively by something like the “benefit principle,” where tax payments should be made to correspond as closely as possible to the value of benefits received from the government. Nozick, at least initially, made a much farther-reaching assertion -- that government should be limited to a minimal role, providing only services, such as criminal justice and national defense, necessary to prevent people from violating each others’ rights and to avoid chaos and anarchy, which would impoverish everyone. Once that was achieved, according to Nozick, justice required relying as much as possible on voluntary consent, and as little as possible on the government coercion that would be necessary to enforce enough taxation to finance a bigger government. Many who are sympathetic to these views, including Milton Friedman, Friedrich Hayek, Mankiw, and even Nozick himself later in life, would allow for a larger role for government, but would prefer it to play a smaller role than it does in most countries today.
11
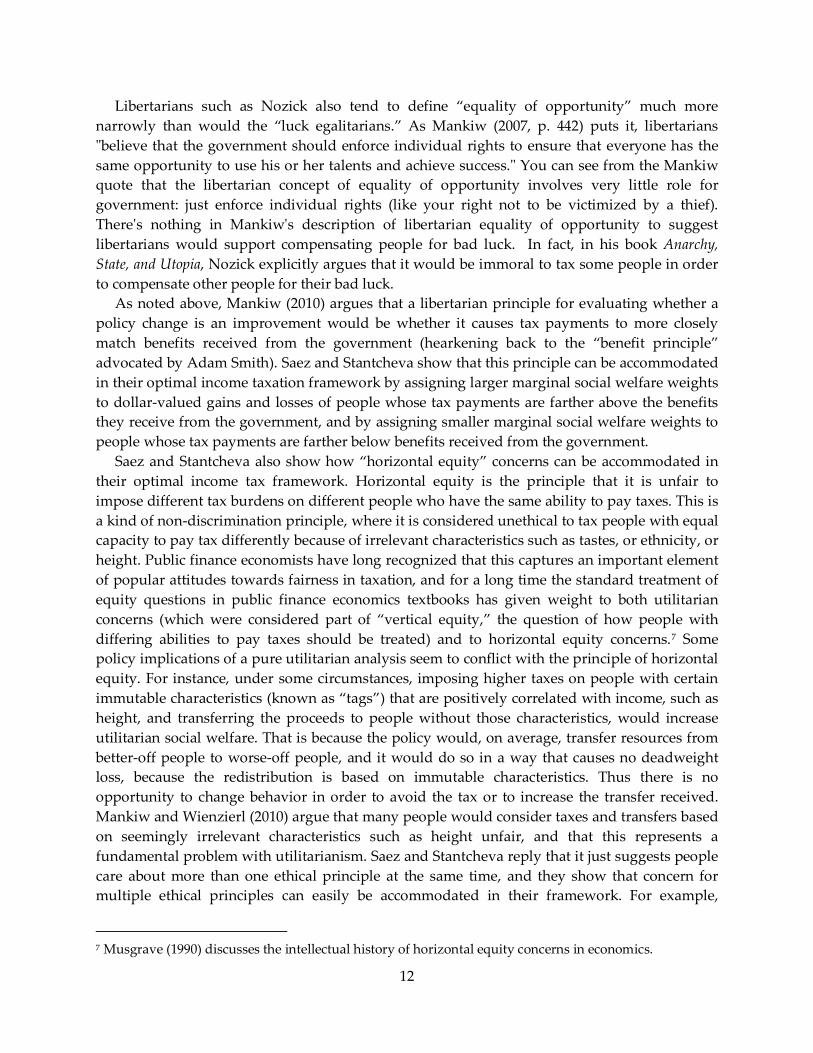
Libertarians such as Nozick also tend to define “equality of opportunity” much more narrowly than would the “luck egalitarians.” As Mankiw (2007, p. 442) puts it, libertarians "believe that the government should enforce individual rights to ensure that everyone has the same opportunity to use his or her talents and achieve success." You can see from the Mankiw quote that the libertarian concept of equality of opportunity involves very little role for government: just enforce individual rights (like your right not to be victimized by a thief). There's nothing in Mankiw's description of libertarian equality of opportunity to suggest libertarians would support compensating people for bad luck. In fact, in his book Anarchy, State, and Utopia, Nozick explicitly argues that it would be immoral to tax some people in order to compensate other people for their bad luck.
As noted above, Mankiw (2010) argues that a libertarian principle for evaluating whether a policy change is an improvement would be whether it causes tax payments to more closely match benefits received from the government (hearkening back to the “benefit principle” advocated by Adam Smith). Saez and Stantcheva show that this principle can be accommodated in their optimal income taxation framework by assigning larger marginal social welfare weights to dollar-valued gains and losses of people whose tax payments are farther above the benefits they receive from the government, and by assigning smaller marginal social welfare weights to people whose tax payments are farther below benefits received from the government.
Saez and Stantcheva also show how “horizontal equity” concerns can be accommodated in their optimal income tax framework. Horizontal equity is the principle that it is unfair to impose different tax burdens on different people who have the same ability to pay taxes. This is a kind of non-discrimination principle, where it is considered unethical to tax people with equal capacity to pay tax differently because of irrelevant characteristics such as tastes, or ethnicity, or height. Public finance economists have long recognized that this captures an important element of popular attitudes towards fairness in taxation, and for a long time the standard treatment of equity questions in public finance economics textbooks has given weight to both utilitarian concerns (which were considered part of “vertical equity,” the question of how people with differing abilities to pay taxes should be treated) and to horizontal equity concerns.7 Some policy implications of a pure utilitarian analysis seem to conflict with the principle of horizontal equity. For instance, under some circumstances, imposing higher taxes on people with certain immutable characteristics (known as “tags”) that are positively correlated with income, such as height, and transferring the proceeds to people without those characteristics, would increase utilitarian social welfare. That is because the policy would, on average, transfer resources from better-off people to worse-off people, and it would do so in a way that causes no deadweight loss, because the redistribution is based on immutable characteristics. Thus there is no opportunity to change behavior in order to avoid the tax or to increase the transfer received. Mankiw and Wienzierl (2010) argue that many people would consider taxes and transfers based on seemingly irrelevant characteristics such as height unfair, and that this represents a fundamental problem with utilitarianism. Saez and Stantcheva reply that it just suggests people care about more than one ethical principle at the same time, and they show that concern for multiple ethical principles can easily be accommodated in their framework. For example,
7 Musgrave (1990) discusses the intellectual history of horizontal equity concerns in economics.
12
utilitarian marginal social welfare weights (which are proportional to marginal utilities) can be multiplied by factors that put greater weight on gains and losses of utility to people who are suffering from horizontal inequity.
Clearly, fundamental disagreements about which is the right philosophy of distributive justice pose a challenge for any kind of policy analysis. Still, the kind of analysis discussed here can be invaluable for clarifying where the philosophical disagreements come into play, and how the answer to the question “what is a good policy?” may change depending on one’s philosophical preferences.
Another more prosaic challenge is that it is difficult to get good convincing empirical evidence on the responsiveness of economic behavior to incentives. In almost any philosophy of distributive justice, the dollar-valued costs and benefits of a policy change ought to matter when evaluating whether the policy change is an improvement or not, and these benefits and costs depend importantly on how economic behavior responds to changes in incentives caused by government tax or spending policies. There is lots of interesting and credible empirical research on this question to be explored. You’ll have the opportunity to read some of this evidence in our spring semester course on tax policy, and the next section below provides a very brief introduction to some relevant and relatively accessible evidence to give you a taste of how one might go about investigating this, and the challenges involved.
II. Empirical Evidence on the Behavioral Response to Taxes: A Very Brief
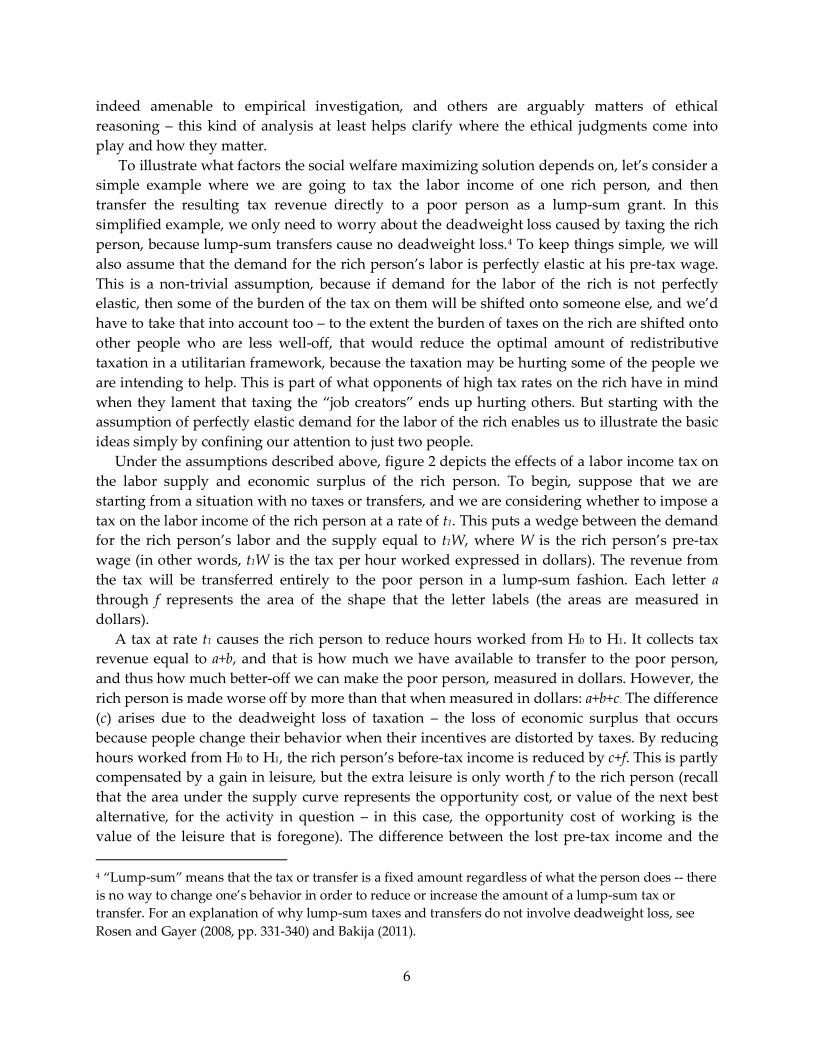
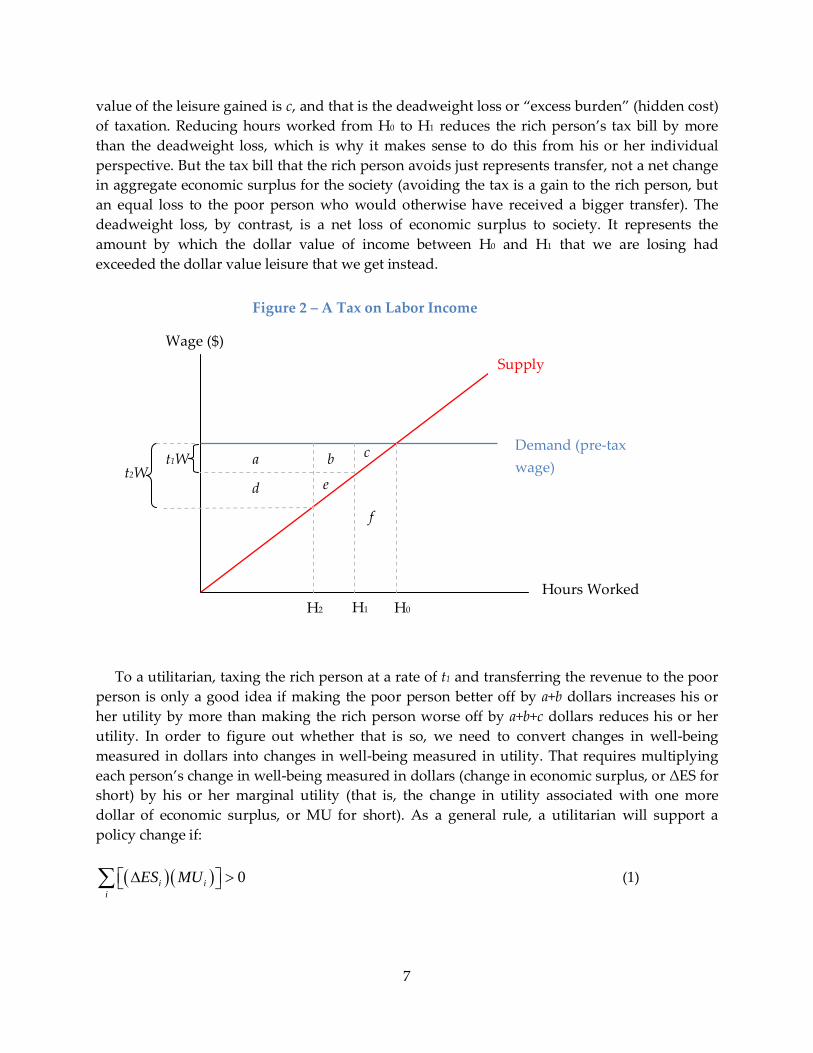
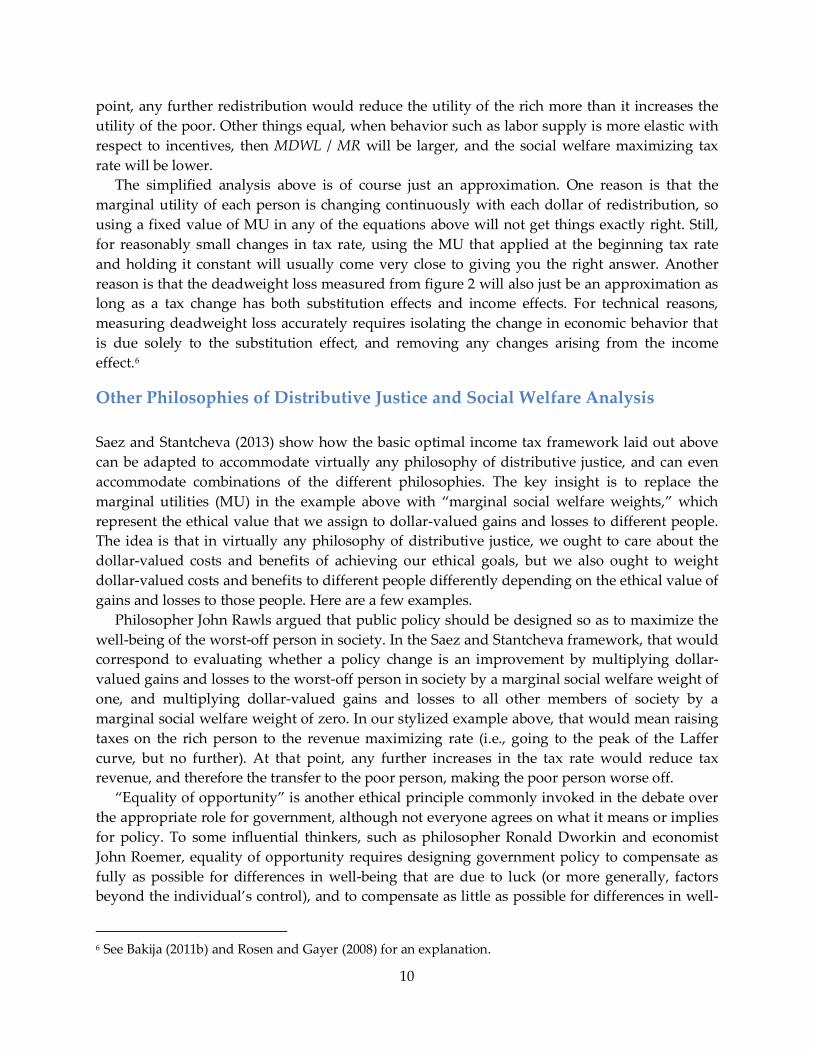
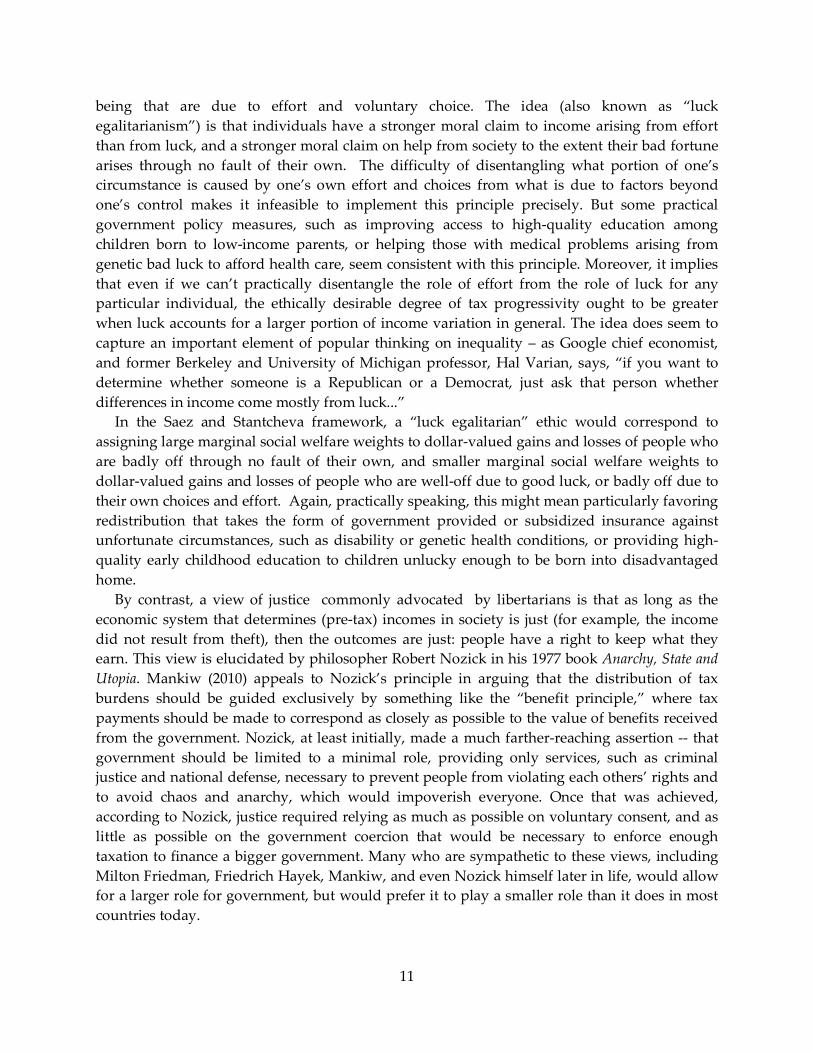
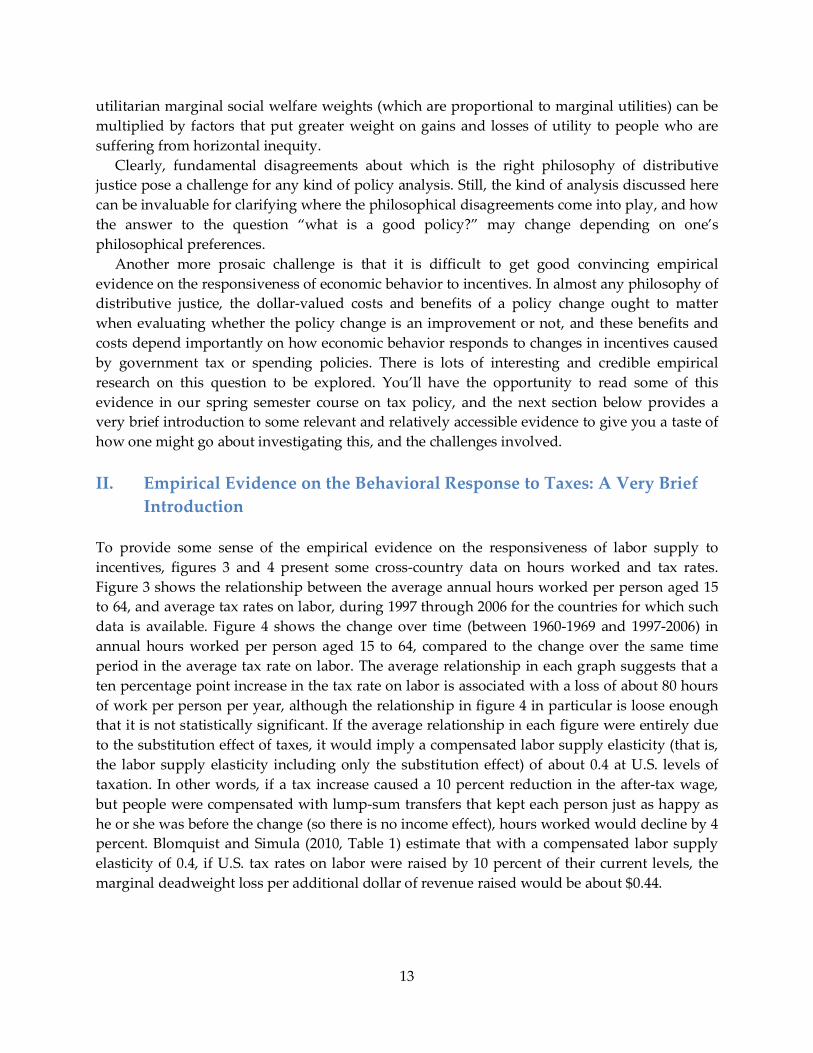
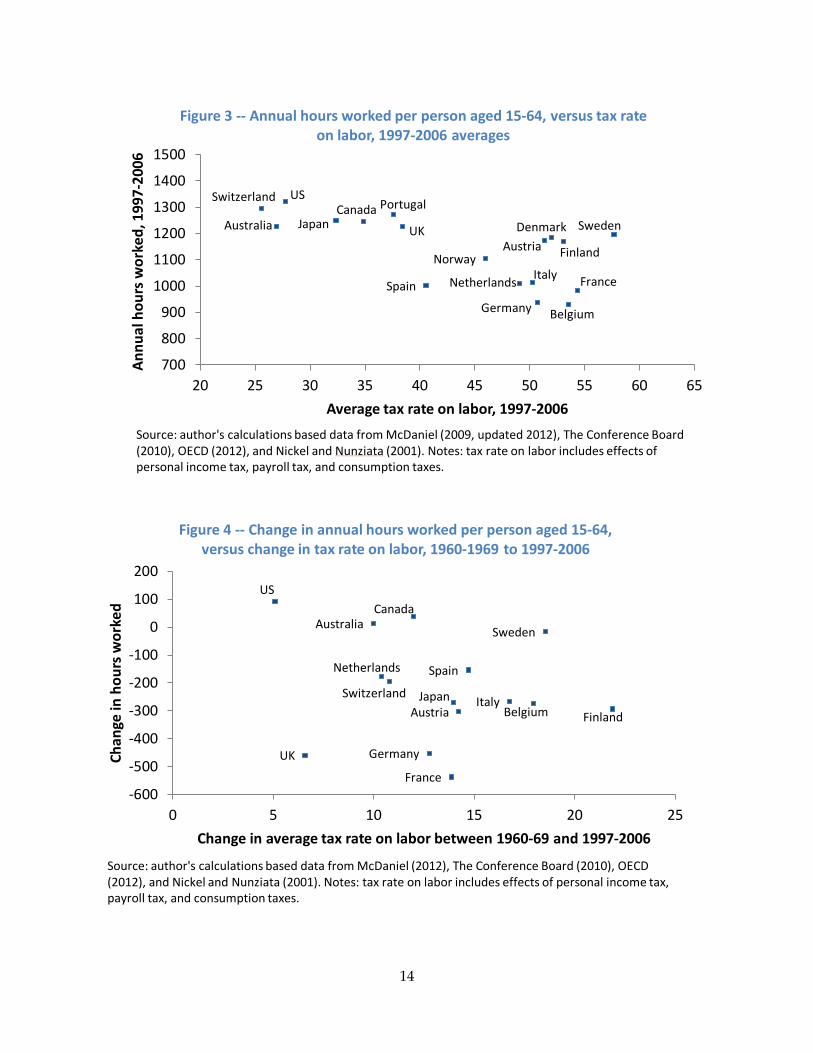
Introduction To provide some sense of the empirical evidence on the responsiveness of labor supply to incentives, figures 3 and 4 present some cross-country data on hours worked and tax rates. Figure 3 shows the relationship between the average annual hours worked per person aged 15 to 64, and average tax rates on labor, during 1997 through 2006 for the countries for which such data is available. Figure 4 shows the change over time (between 1960-1969 and 1997-2006) in annual hours worked per person aged 15 to 64, compared to the change over the same time period in the average tax rate on labor. The average relationship in each graph suggests that a ten percentage point increase in the tax rate on labor is associated with a loss of about 80 hours of work per person per year, although the relationship in figure 4 in particular is loose enough that it is not statistically significant. If the average relationship in each figure were entirely due to the substitution effect of taxes, it would imply a compensated labor supply elasticity (that is, the labor supply elasticity including only the substitution effect) of about 0.4 at U.S. levels of taxation. In other words, if a tax increase caused a 10 percent reduction in the after-tax wage, but people were compensated with lump-sum transfers that kept each person just as happy as he or she was before the change (so there is no income effect), hours worked would decline by 4 percent. Blomquist and Simula (2010, Table 1) estimate that with a compensated labor supply elasticity of 0.4, if U.S. tax rates on labor were raised by 10 percent of their current levels, the marginal deadweight loss per additional dollar of revenue raised would be about $0.44.
13
Australia Austria
Belgium
Canada Switzerland
Germany
Spain
Finland
France
UK
Italy
Japan
Netherlands
Sweden
US
Denmark
Norway
Portugal
700
800
900
1000
1100
1200
1300
1400
1500
20 25 30 35 40 45 50 55 60 65
Annu
al h
ours
wor
ked,
199
7-20
06
Average tax rate on labor, 1997-2006
Figure 3 -- Annual hours worked per person aged 15-64, versus tax rate on labor, 1997-2006 averages
Source: author's calculations based data from McDaniel (2009, updated 2012), The Conference Board (2010), OECD (2012), and Nickel and Nunziata (2001). Notes: tax rate on labor includes effects of personal income tax, payroll tax, and consumption taxes.
Australia
Austria Belgium
Canada
Switzerland
Germany
Spain
Finland
France
UK
Italy Japan
Netherlands
Sweden
US
-600
-500
-400
-300
-200
-100
0
100
200
0 5 10 15 20 25
Chan
ge in
hou
rs w
orke
d
Change in average tax rate on labor between 1960-69 and 1997-2006
Figure 4 -- Change in annual hours worked per person aged 15-64, versus change in tax rate on labor, 1960-1969 to 1997-2006
Source: author's calculations based data from McDaniel (2012), The Conference Board (2010), OECD (2012), and Nickel and Nunziata (2001). Notes: tax rate on labor includes effects of personal income tax, payroll tax, and consumption taxes.
14
Of course, many other factors could explain cross-country differences in hours worked and their changes over time. Alberto Alesina, Edward Glaeser, and Bruce Sacerdote (2005) argue that it is impossible to empirically distinguish the effects of rising taxes on changes in hours worked across OECD countries from the effects of unions, which grew in power and changed their strategies in Europe relative to the U.S. at the same time as taxes were going up relatively more in Europe. European unions have pushed hard for laws imposing mandatory vacation time, mandatory paid leave, and mandatory restrictions on the maximum number of hours an individual can work in a week (achieving, for example, the well-known 35-hour work week in France) under the slogan “work less, work all,” on the (apparently misguided) theory that reducing hours worked for each worker would open up more jobs. Alesina et al. further hypothesize that mandatory hours reductions in Europe might have been partly motivated by the plausible notion that leisure time is more valuable to each individual when there are more other people to share it with, a coordination problem that might be ameliorated by regulations mandating vacation time, for instance. It’s at least possible that the unions’ actions could have been motivated by workers’ desire to reduce hours worked in response to taxes, but the rhetoric used by the unions as they fought for these changes suggest the other motivations noted above predominated. Furthermore, many other non-tax policies and institutions in Europe, such as public pension rules, generous unemployment insurance, and high minimum wages, also discourage work and/or hiring, further weakening the case that taxes alone are to blame for relatively lower hours of work there. Faggio and Nickel (2007) also point out that in some European countries, such as Sweden, unions followed very different strategies that were not about reducing hours worked, and non-tax policies were more work-friendly (e.g., Sweden has generous government subsidies for child care, which make it easier for both spouses to work). Such countries tended to have relatively small declines in hours worked over time, despite large increases in tax rates, as illustrated by Sweden in figure 4. If non-tax factors explain, say, half of the relationship between taxes and hours worked shown in figures 3 and 4, that would imply a compensated elasticity of labor supply of about 0.2. Blomquist and Simula estimate that with an elasticity of 0.2, if U.S. tax rates on labor were raised by 10 percent of their current levels, the marginal deadweight loss per additional dollar of revenue raised would be about $0.24. See Alesina et al. for a review of the broader empirical literature on the elasticity of labor supply in rich countries, which with generally suggests (with some exceptions) similarly modest elasticities.
Convincing evidence on how taxes affect peoples’ economic decisions in low- and middle-income countries is harder to find. An important consideration in these countries is of course that people can more easily evade taxes, for example by switching their business from the formal sector to the informal sector. Higher tax rates might induce more such evasion, since the marginal benefit of hiding another dollar from the tax authorities is the marginal tax rate. Tax evasion involves some deadweight loss, because people take economically costly actions, such as switching to a job in which they are less productive but which more easily escapes the attention of tax authorities, or avoiding the use of banks so there is no paper trail for the tax authorities to follow, in order to facilitate evasion. However, if most of the response to high tax rates involves tax evasion, as opposed to working fewer hours, the policy implications might be different. To the extent that the problem is tax evasion, an alternative to reducing tax
15
progressivity would be to improve tax administration and enforcement. That is much easier said than done, but it is clearly the most important tax policy issue in developing countries.
Yuriy Gorodnichenko, Jorge Martinez-Vazquez, and Klara Sabirianova Peter (2009) study the effects of a “flat tax” reform in Russia to shed some light on these questions. They compare how reported pre-tax income changed over time for upper-income people who experienced a big cut in marginal income tax rates because of the reform (the treatment group), relative to the change over time in reported income for low- and middle-income people, who experienced little or no change in tax rates (the control group). They infer how much of the change over time in reported pre-tax income might be due to changes in tax evasion by comparing it with the change over time in reported consumption expenditures, which the authors demonstrate in various ways to be much more accurately reported both before and after the reform. Although their data is based on a household survey rather than tax records, it is plausible that people were afraid to report their true incomes to the government survey takers (out of concern that the information would be shared with the tax authorities, which it was not), but were less afraid of accurately reporting the amounts they spent on various specific consumption categories (which the authors then added up to compute a total value for consumption expenditures). To corroborate this, they show that the consumption expenditures reported in the survey match the national accounts data for consumption fairly well, whereas the reported pre-tax income in the survey is far below what it should be according to the national accounts (in addition to being far below reported consumption in the survey). Gorodnichenko et al. find that both reported consumption and reported pre-tax income increased over time for people who got a marginal tax rate cut compared to people who did not, but that reported income increased a lot more over time than reported consumption, suggesting that much of the response to reduced tax rates had to do with reduced tax evasion as opposed to increases in real economic activity. Nonetheless, they show that their estimates suggest a relatively modest amount of deadweight loss from taxation. They estimate that the average deadweight loss per dollar of revenue raised by the Russian income tax is somewhere between $0.04 and $0.13, depending on the extent to which tax evasion involves real economic costs. They do not report the marginal deadweight loss per dollar of revenue raised, but that would be somewhat higher.
Jessica Goldberg (2011) implemented a randomized experiment that enabled her to estimate the elasticity of labor supply in rural Malawi. She randomly varied the daily wage offered to day laborers in various different parts of rural Malawi, and recorded how many people took up the offer to work at different wage rates. Her estimates suggest a labor supply elasticity of about 0.15 – that is, a 10 percent increase in the daily wage was associated with about 1.5 percent increase days worked. This would imply a rather small amount of deadweight loss from taxation, although of course it does not account for other ways people may change their behavior in response to taxes.
While changes in labor supply and tax evasion are probably the most important factors contributing to the economic efficiency costs of redistributive taxation in most countries, there are many other ways that people might change their behavior in response to taxation, and any of these can involve deadweight loss too. For example, taxes on capital income (interest, dividends, etc.) and taxes on corporate profits can affect the amount of saving and investment in an economy. However, a country might still be able to implement highly redistributive taxes
16
and transfers without significantly harming savings and investment. Redistribution could be achieved by taxing labor income and consumption (e.g., through a value-added tax), which distort the incentive to work and earn income, but do not discourage saving or investment any more than an equal-revenue lump-sum tax would, because they do not affect incentives to save or invest at the margin.
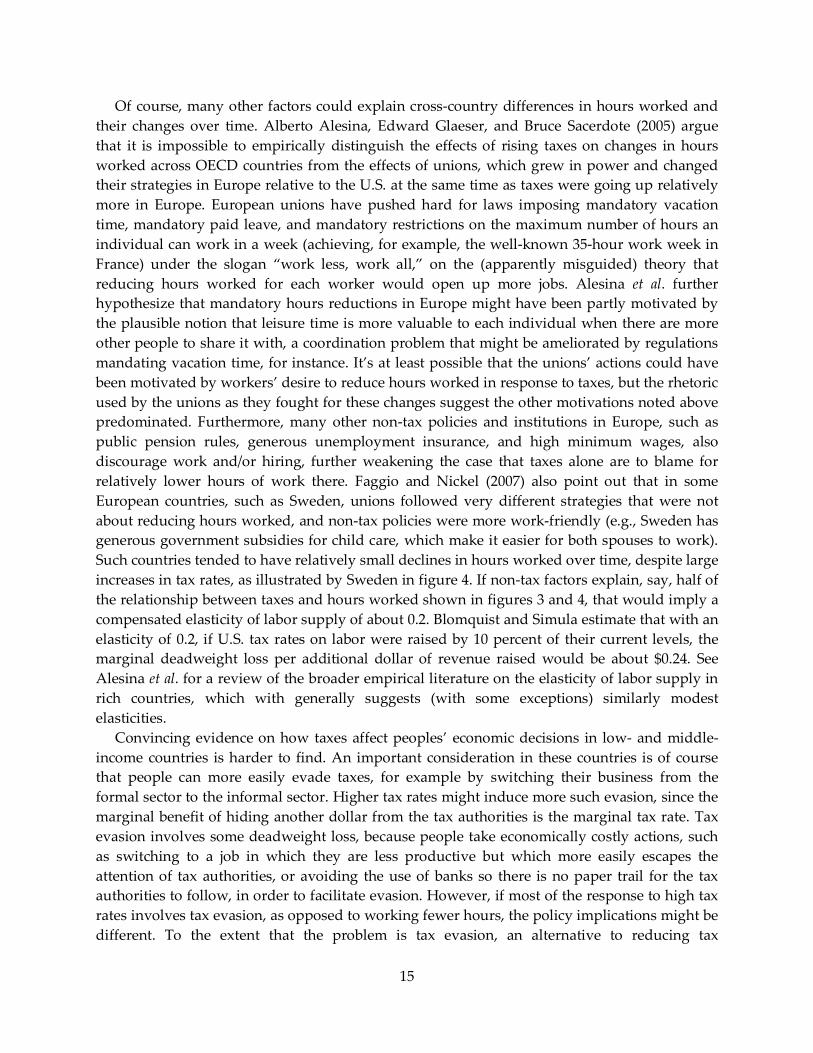
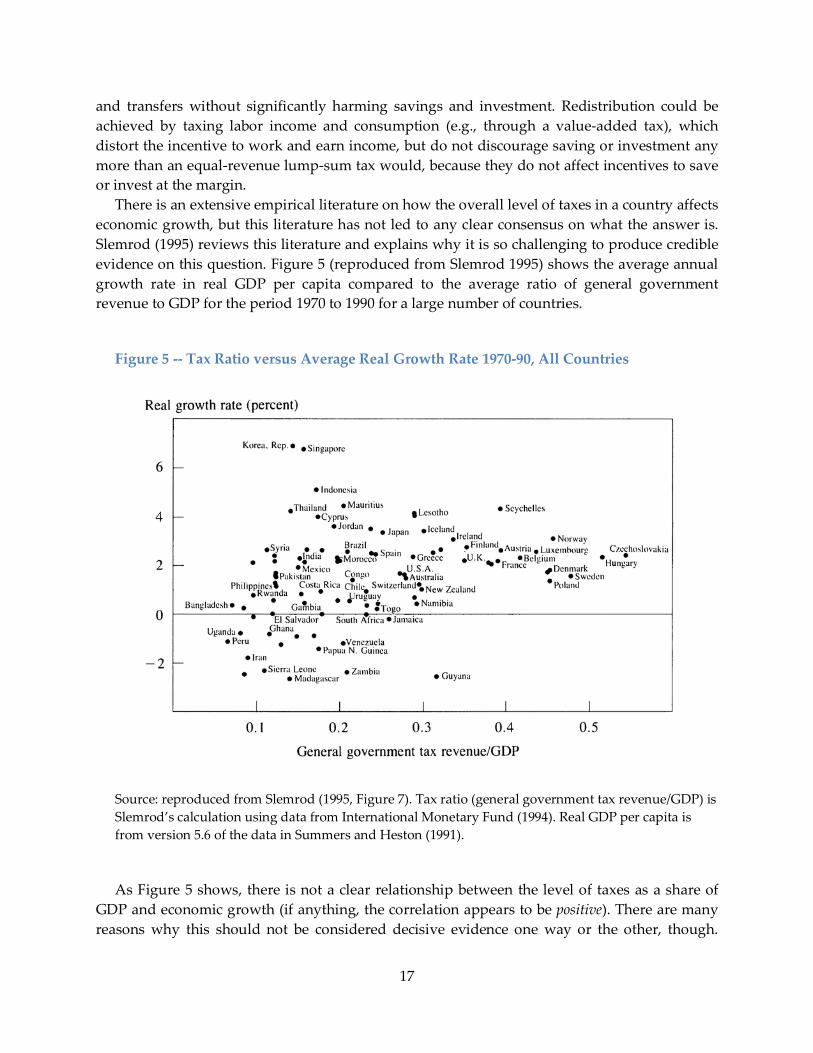
There is an extensive empirical literature on how the overall level of taxes in a country affects economic growth, but this literature has not led to any clear consensus on what the answer is. Slemrod (1995) reviews this literature and explains why it is so challenging to produce credible evidence on this question. Figure 5 (reproduced from Slemrod 1995) shows the average annual growth rate in real GDP per capita compared to the average ratio of general government revenue to GDP for the period 1970 to 1990 for a large number of countries.
Figure 5 -- Tax Ratio versus Average Real Growth Rate 1970-90, All Countries
Source: reproduced from Slemrod (1995, Figure 7). Tax ratio (general government tax revenue/GDP) is Slemrod’s calculation using data from International Monetary Fund (1994). Real GDP per capita is from version 5.6 of the data in Summers and Heston (1991).
As Figure 5 shows, there is not a clear relationship between the level of taxes as a share of GDP and economic growth (if anything, the correlation appears to be positive). There are many reasons why this should not be considered decisive evidence one way or the other, though.
17
Isolating the causal effect of tax revenues on economic growth is difficult because of severe reverse causality problems. For example, economic growth may cause the demand for government services to increase, and it leads to improvements in tax administration and enforcement that make it possible to collect more revenues. Economic booms and recessions cause automatic changes in tax revenue. Many other factors influence economic growth and we don’t have good control variables for all of them. Moreover, if our goal is to determine whether large redistributive taxes are necessarily bad for growth, controlling in an econometric analysis for certain other factors that influence growth, such as educational attainment or corruption, could give us a worse answer to the question we are interested in. Perhaps improvements in educational attainment and reduced corruption (which might arise from better pay for civil servants) are channels through which higher taxes help improve growth, in which case the taxes should be given credit for that. Finally, there is no reason to think the effect of the size of government on growth should be uniform across countries. Rather, the effect ought to depend on the quality of government (i.e., are policies well-designed and well-implemented, with tolerably low levels of corruption, etc.). Cross-country econometric analyses have come up with solutions to these problems that are highly imperfect at best, and estimates have been shown to be quite sensitive to reasonable changes in the set of control variables included, so there is not at present a consensus on what the evidence shows (see Slemrod 1995 for further details).
Our discussion here only begins to scratch the surface of theory and empirical evidence on the economic effects of taxation. The point is certainly not to conclude that existing empirical evidence is unhelpful for answering the question at hand. Rather the point is that there is more for you to learn. If you are interested in investigating these questions further, the spring semester course on tax policy will delve into these issues in much greater depth.
III. Examples of Social Welfare Analysis
David Weisbach’s example is just meant to illustrative the basic principles involved in social welfare analysis and the tradeoff between equity and efficiency, and is not intended to be empirically realistic. Wojciech Kopczuk, Joel Slemrod, and Shlomo Yitzhaki (2005) undertake the ambitious task of computing social-welfare-maximizing tax rates and transfers for almost every country in the world, and for the world as a whole, in a way that is intended to be reasonably consistent with empirical evidence. The basic structure of their exercise is very similar to that in Weisbach – for example, they restrict their analysis to schemes where there is a single flat tax rate on labor income, coupled with a per-capita lump-sum cash transfer financed by the flat tax (a flat-rate consumption tax, which may be more administratively feasible in developing countries, would lead to similar conclusions). They assume a utility function that implies a relatively large degree of deadweight loss from taxation relative to typical findings in the empirical literature. The assumed utility function implies a compensated elasticity of labor supply of one. That means that the substitution effect of a change in after-tax wage is such that a one percent reduction in after-tax wage causes a one percent reduction in hours worked, holding utility constant. So in other words, they are assuming that if government imposes a 30%
18
tax on labor income (reducing the incentive to work), but gives people back enough of a lump-sum cash transfer that their level utility is unchanged, they would work 30% fewer hours than they did in the absence of the tax and transfer. That would imply a great deal of deadweight loss. Blomquist and Simula (2010, Table 1) compute that such a labor supply elasticity implies that if tax rates on labor in the United States were raised by 10 percent of their current levels for all individuals, the marginal deadweight loss per dollar of additional revenue raised would be about one dollar. That is, the tax rate increase would make people worse off by about twice as much as the revenue the government would collect. There is disagreement in the empirical literature about how responsive economic behavior is to incentives, but that assumes far more responsiveness to incentives than most evidence suggests, and therefore implies a larger degree of deadweight loss. Kopczuk et al. choose such a large elasticity partly to provide a conservative estimate of the social welfare maximizing tax rate and transfer, and partly to allow for the fact that taxation distorts many decisions, not just labor supply, and all of those distorted decisions involve deadweight loss.
Instead of using a utilitarian social welfare function, Kopczuk and Slemrod use a social welfare function that is part of the way between utilitarian and Rawlsian. It achieves this by putting greater weight on the utilities of people with smaller utilities. Their social welfare function (SWF) = Σi {[1/(1 − v)](Ui)1-v}, where Ui is each individual’s utility, and v is a parameter that affects how much weight we put on the utility of different people in the SWF. If v = 0, the SWF is the utilitarian social welfare function, Σi Ui, putting equal weight on each person’s utility. In their base case, v = 2, which yields
SWF = Σi (-1/Ui) (6) This particular SWF puts a lot more weight on people with small utility than on people with
large utility. A one unit increase in utility causes a much larger increase in this SWF for someone starting at a low level of utility than for someone starting at a high level of utility. As a sensitivity analysis, they also try v = 0.5, which yields SWF = Σi [2�𝑈𝑖]. This SWF also puts greater weight on people with lower utilities, but is closer to the utilitarian case. They apply this approach to real data on income distributions and wages in 118 different countries to compute optimal tax rates and per capita transfers within each of the countries and for the world as a whole. Table 1 shows the results of their analysis for a selected group of countries (the U.S. and most countries represented at the CDE in recent years), along with information from World Development Indicators on income per person and the distribution of income within each country.
Focusing first on the social welfare maximizing tax rate and transfer for the world as a whole (i.e., what would happen if there were a single world government trying to maximize the social welfare function described above), Kopczuk et al. come to the provocative conclusion that the social-welfare-maximizing degree of redistribution across the world would be vastly higher than we actually observe to be taking place. For example, when v=2, the worldwide optimal tax rate is estimated to be 62 percent, and each person in the world would receive a lump-sum transfer of $3,887 (in constant year 2009 U.S. dollars, adjusted for purchasing power parity), as shown in the top row of Table 1. This would imply massive transfers from the richest countries
19
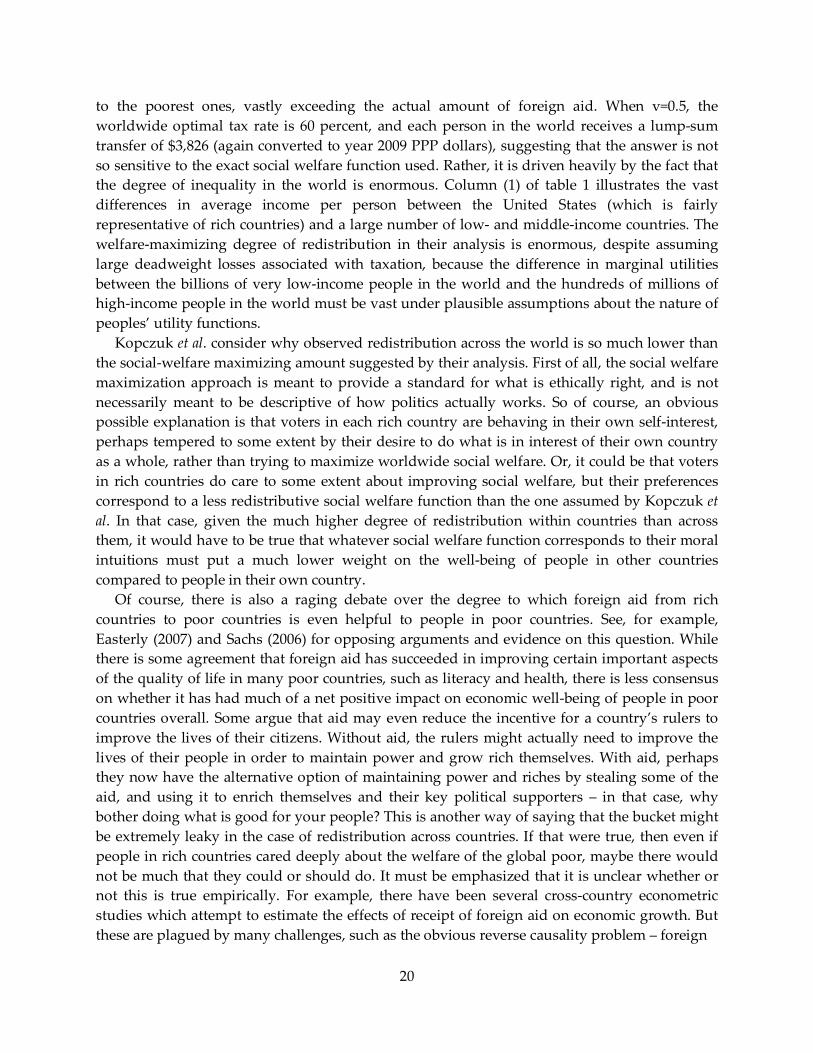
to the poorest ones, vastly exceeding the actual amount of foreign aid. When v=0.5, the worldwide optimal tax rate is 60 percent, and each person in the world receives a lump-sum transfer of $3,826 (again converted to year 2009 PPP dollars), suggesting that the answer is not so sensitive to the exact social welfare function used. Rather, it is driven heavily by the fact that the degree of inequality in the world is enormous. Column (1) of table 1 illustrates the vast differences in average income per person between the United States (which is fairly representative of rich countries) and a large number of low- and middle-income countries. The welfare-maximizing degree of redistribution in their analysis is enormous, despite assuming large deadweight losses associated with taxation, because the difference in marginal utilities between the billions of very low-income people in the world and the hundreds of millions of high-income people in the world must be vast under plausible assumptions about the nature of peoples’ utility functions.
Kopczuk et al. consider why observed redistribution across the world is so much lower than the social-welfare maximizing amount suggested by their analysis. First of all, the social welfare maximization approach is meant to provide a standard for what is ethically right, and is not necessarily meant to be descriptive of how politics actually works. So of course, an obvious possible explanation is that voters in each rich country are behaving in their own self-interest, perhaps tempered to some extent by their desire to do what is in interest of their own country as a whole, rather than trying to maximize worldwide social welfare. Or, it could be that voters in rich countries do care to some extent about improving social welfare, but their preferences correspond to a less redistributive social welfare function than the one assumed by Kopczuk et al. In that case, given the much higher degree of redistribution within countries than across them, it would have to be true that whatever social welfare function corresponds to their moral intuitions must put a much lower weight on the well-being of people in other countries compared to people in their own country.
Of course, there is also a raging debate over the degree to which foreign aid from rich countries to poor countries is even helpful to people in poor countries. See, for example, Easterly (2007) and Sachs (2006) for opposing arguments and evidence on this question. While there is some agreement that foreign aid has succeeded in improving certain important aspects of the quality of life in many poor countries, such as literacy and health, there is less consensus on whether it has had much of a net positive impact on economic well-being of people in poor countries overall. Some argue that aid may even reduce the incentive for a country’s rulers to improve the lives of their citizens. Without aid, the rulers might actually need to improve the lives of their people in order to maintain power and grow rich themselves. With aid, perhaps they now have the alternative option of maintaining power and riches by stealing some of the aid, and using it to enrich themselves and their key political supporters – in that case, why bother doing what is good for your people? This is another way of saying that the bucket might be extremely leaky in the case of redistribution across countries. If that were true, then even if people in rich countries cared deeply about the welfare of the global poor, maybe there would not be much that they could or should do. It must be emphasized that it is unclear whether or not this is true empirically. For example, there have been several cross-country econometric studies which attempt to estimate the effects of receipt of foreign aid on economic growth. But these are plagued by many challenges, such as the obvious reverse causality problem – foreign
20
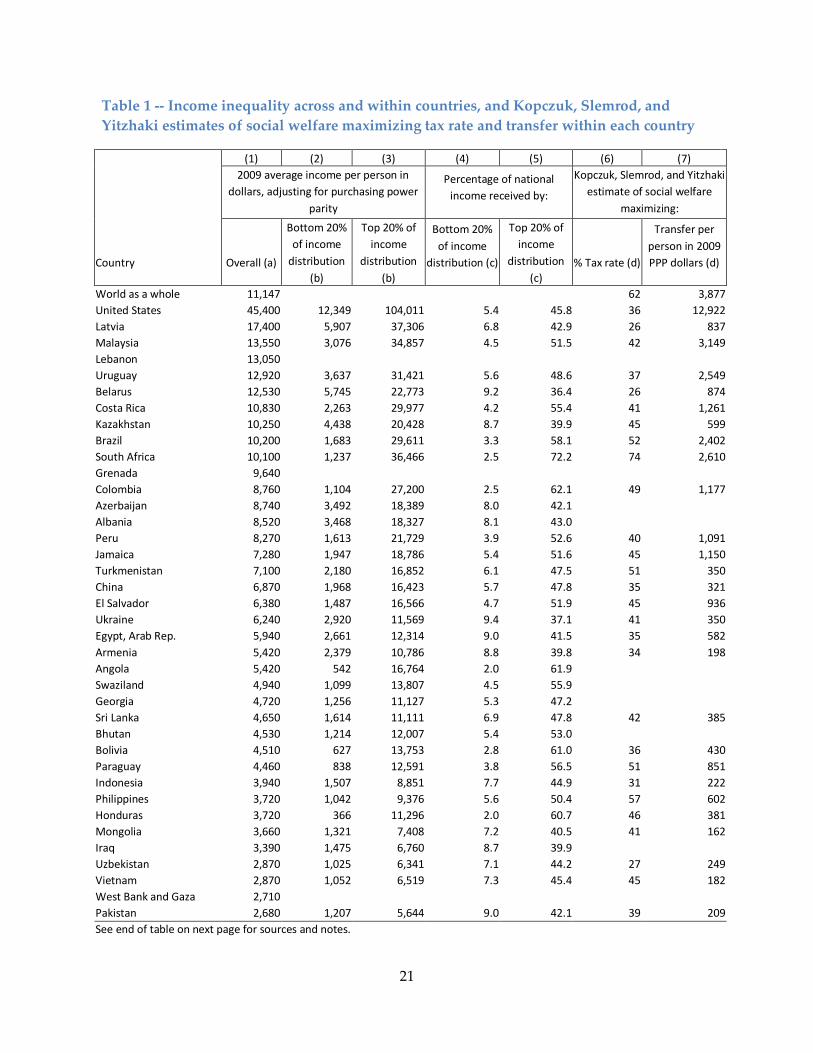
Table 1 -- Income inequality across and within countries, and Kopczuk, Slemrod, and Yitzhaki estimates of social welfare maximizing tax rate and transfer within each country
Country
(1) (2) (3) (4) (5) (6) (7) 2009 average income per person in
dollars, adjusting for purchasing power parity
Percentage of national income received by:
Kopczuk, Slemrod, and Yitzhaki estimate of social welfare
maximizing:
Overall (a)
Bottom 20% of income
distribution (b)
Top 20% of income
distribution (b)
Bottom 20% of income
distribution (c)
Top 20% of income
distribution (c)
% Tax rate (d)
Transfer per person in 2009 PPP dollars (d)
World as a whole 11,147
62 3,877 United States 45,400 12,349 104,011 5.4 45.8 36 12,922 Latvia 17,400 5,907 37,306 6.8 42.9 26 837 Malaysia 13,550 3,076 34,857 4.5 51.5 42 3,149 Lebanon 13,050
Uruguay 12,920 3,637 31,421 5.6 48.6 37 2,549 Belarus 12,530 5,745 22,773 9.2 36.4 26 874 Costa Rica 10,830 2,263 29,977 4.2 55.4 41 1,261 Kazakhstan 10,250 4,438 20,428 8.7 39.9 45 599 Brazil 10,200 1,683 29,611 3.3 58.1 52 2,402 South Africa 10,100 1,237 36,466 2.5 72.2 74 2,610 Grenada 9,640
Colombia 8,760 1,104 27,200 2.5 62.1 49 1,177 Azerbaijan 8,740 3,492 18,389 8.0 42.1
Albania 8,520 3,468 18,327 8.1 43.0 Peru 8,270 1,613 21,729 3.9 52.6 40 1,091
Jamaica 7,280 1,947 18,786 5.4 51.6 45 1,150 Turkmenistan 7,100 2,180 16,852 6.1 47.5 51 350 China 6,870 1,968 16,423 5.7 47.8 35 321 El Salvador 6,380 1,487 16,566 4.7 51.9 45 936 Ukraine 6,240 2,920 11,569 9.4 37.1 41 350 Egypt, Arab Rep. 5,940 2,661 12,314 9.0 41.5 35 582 Armenia 5,420 2,379 10,786 8.8 39.8 34 198 Angola 5,420 542 16,764 2.0 61.9
Swaziland 4,940 1,099 13,807 4.5 55.9 Georgia 4,720 1,256 11,127 5.3 47.2 Sri Lanka 4,650 1,614 11,111 6.9 47.8 42 385
Bhutan 4,530 1,214 12,007 5.4 53.0 Bolivia 4,510 627 13,753 2.8 61.0 36 430
Paraguay 4,460 838 12,591 3.8 56.5 51 851 Indonesia 3,940 1,507 8,851 7.7 44.9 31 222 Philippines 3,720 1,042 9,376 5.6 50.4 57 602 Honduras 3,720 366 11,296 2.0 60.7 46 381 Mongolia 3,660 1,321 7,408 7.2 40.5 41 162 Iraq 3,390 1,475 6,760 8.7 39.9
Uzbekistan 2,870 1,025 6,341 7.1 44.2 27 249 Vietnam 2,870 1,052 6,519 7.3 45.4 45 182 West Bank and Gaza 2,710
Pakistan 2,680 1,207 5,644 9.0 42.1 39 209 See end of table on next page for sources and notes.
21
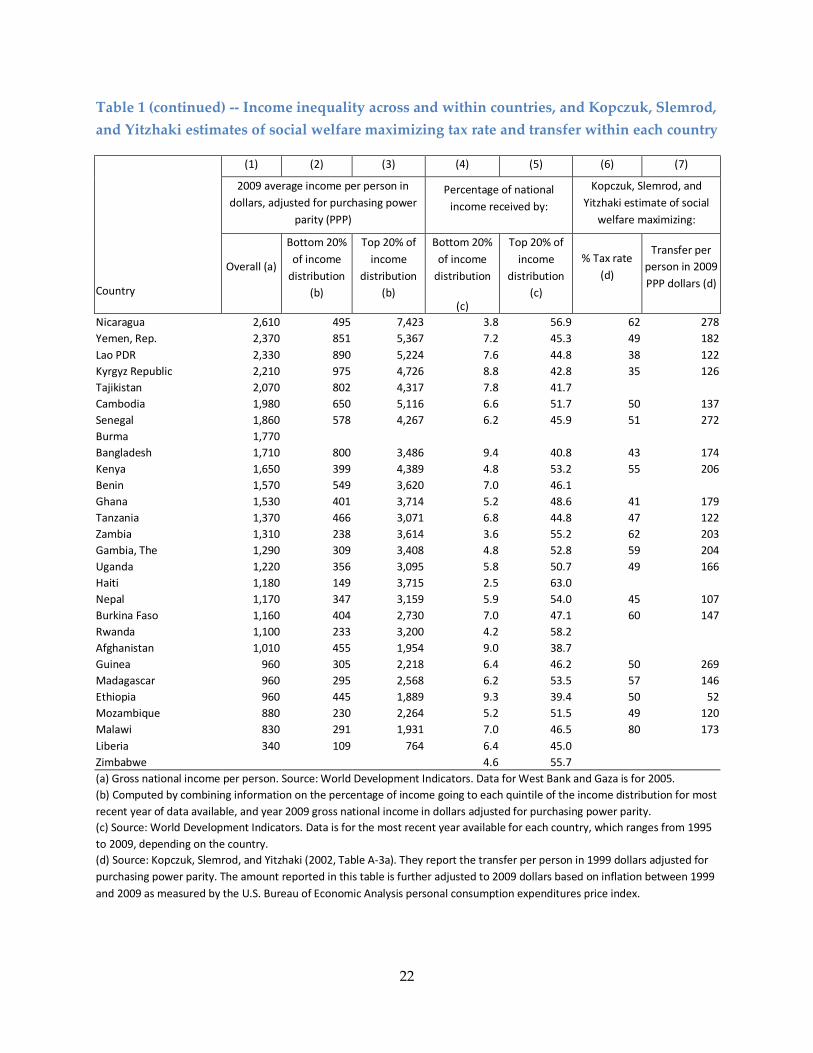
Table 1 (continued) -- Income inequality across and within countries, and Kopczuk, Slemrod, and Yitzhaki estimates of social welfare maximizing tax rate and transfer within each country
Country
(1) (2) (3) (4) (5) (6) (7)
2009 average income per person in dollars, adjusted for purchasing power
parity (PPP)
Percentage of national income received by:
Kopczuk, Slemrod, and Yitzhaki estimate of social
welfare maximizing:
Overall (a)
Bottom 20% of income
distribution (b)
Top 20% of income
distribution (b)
Bottom 20% of income
distribution
(c)
Top 20% of income
distribution (c)
% Tax rate (d)
Transfer per person in 2009 PPP dollars (d)
Nicaragua 2,610 495 7,423 3.8 56.9 62 278 Yemen, Rep. 2,370 851 5,367 7.2 45.3 49 182 Lao PDR 2,330 890 5,224 7.6 44.8 38 122 Kyrgyz Republic 2,210 975 4,726 8.8 42.8 35 126 Tajikistan 2,070 802 4,317 7.8 41.7
Cambodia 1,980 650 5,116 6.6 51.7 50 137 Senegal 1,860 578 4,267 6.2 45.9 51 272 Burma 1,770
Bangladesh 1,710 800 3,486 9.4 40.8 43 174 Kenya 1,650 399 4,389 4.8 53.2 55 206 Benin 1,570 549 3,620 7.0 46.1
Ghana 1,530 401 3,714 5.2 48.6 41 179 Tanzania 1,370 466 3,071 6.8 44.8 47 122 Zambia 1,310 238 3,614 3.6 55.2 62 203 Gambia, The 1,290 309 3,408 4.8 52.8 59 204 Uganda 1,220 356 3,095 5.8 50.7 49 166 Haiti 1,180 149 3,715 2.5 63.0
Nepal 1,170 347 3,159 5.9 54.0 45 107 Burkina Faso 1,160 404 2,730 7.0 47.1 60 147 Rwanda 1,100 233 3,200 4.2 58.2
Afghanistan 1,010 455 1,954 9.0 38.7 Guinea 960 305 2,218 6.4 46.2 50 269
Madagascar 960 295 2,568 6.2 53.5 57 146 Ethiopia 960 445 1,889 9.3 39.4 50 52 Mozambique 880 230 2,264 5.2 51.5 49 120 Malawi 830 291 1,931 7.0 46.5 80 173 Liberia 340 109 764 6.4 45.0
Zimbabwe 4.6 55.7 (a) Gross national income per person. Source: World Development Indicators. Data for West Bank and Gaza is for 2005. (b) Computed by combining information on the percentage of income going to each quintile of the income distribution for most recent year of data available, and year 2009 gross national income in dollars adjusted for purchasing power parity. (c) Source: World Development Indicators. Data is for the most recent year available for each country, which ranges from 1995 to 2009, depending on the country. (d) Source: Kopczuk, Slemrod, and Yitzhaki (2002, Table A-3a). They report the transfer per person in 1999 dollars adjusted for purchasing power parity. The amount reported in this table is further adjusted to 2009 dollars based on inflation between 1999 and 2009 as measured by the U.S. Bureau of Economic Analysis personal consumption expenditures price index.
22
aid goes to countries precisely because they are poor, and poor countries that experience sufficiently large economic growth stop getting aid. Creative efforts to get around these obstacles to credible evidence have been imperfect and have not led to consensus. See, for example, Burnside and Dollar (2000), Easterly (2003), and Djankov, Montalvo, and Reynal-Querol (2008).
In any case, poor country governments can have little influence over how much worldwide redistribution occurs, so from the perspective of most people in this class, the more pertinent question may be how much redistribution should be done within their own countries. The Kopczuk et al. analysis also arrives at provocative conclusions about the social welfare maximizing tax rates and transfers within each country, this time driven by the fact that there is considerable inequality within countries. Columns (2) through (4) of table 1 provide estimates of average incomes in the bottom 20 percent of the income distribution and the top 20 percent of the income distribution, as well as the percentages of national income going to each of those groups, within each country. This demonstrates within most low- and middle-income countries, there is a significant degree of income inequality, with the average incomes of the best-off fifth of the population being many times higher than the average incomes of the worst-off fifth. Given the likelihood that the marginal utility of income is very high at the extremely low levels of income shown in the bottom fifth of the distribution of most countries, it is plausible that there is substantial scope to improve social welfare through within-country transfers that benefit the poorest. Columns (6) and (7) of table 1 show the tax rates and transfers that Kopczuk et al. calculate would maximize social welfare within each country, assuming there is no redistribution across countries. The within-country optimal tax rates and transfers are quite large relative to incomes in most countries. The variation across countries in within-country tax rates and transfers mostly arises from differences across countries in the degree of within-country inequality. In an analysis such as this, the optimal redistributive tax rate and transfer will be larger when the degree of inequality within the country is higher. For example, if everyone had the same income, there would be no point in redistribution at all.
In most countries, the optimal tax rate for within-country redistribution shown in table 1 is below the 62 percent rate that Kopczuk et al. determined to be optimal for the world as a whole under worldwide redistribution. The difference mainly reflects the fact that inequality across countries is large relative to inequality within countries. For example, in more than half the countries shown in the table, the average income in the top 20 percent of the income distribution is less than the average income of people in the bottom 20 percent of the U.S. income distribution. Given how much richer the rich countries are compared to the poor countries, there is potentially a lot more room for improving social welfare through redistribution across countries than within them. This also suggests that the potential gains to the poor from economic growth could in the long run be much more important than the potential gains from redistribution.
On the other hand, the within-country social welfare maximizing tax rates and transfers shown in table 1 are in almost all cases considerably higher than the actual effective tax rates and transfers observed in most of these countries. Bahl and Bird (2008) report that tax revenues averaged 17 percent of GDP in developing countries and 29 percent of GDP in transitional countries during the early 2000s, and that is the tax revenue devoted to all government
23
functions, not just transfers. Chu, Davoodi, and Gupta (2004) present evidence suggesting that government policies in developing and transition economies do typically reduce inequality, but not by nearly as much as the Kopczuk et al. analysis suggests would be social-welfare-maximizing. Some of these countries have very high statutory tax rates (that is, the tax rates written into law), but the taxes they actually collect are a much smaller share of income. Even if one sensibly thinks of the transfers in the Kopczuk et al. analysis as including not only cash and in-kind aid to the poor, but also many goods and services provided by governments to their citizens for free or at minimal charge, such as education, health care, roads, police protection, etc., there is still a lot less of this in most low- and middle-income countries than their analysis suggests would be optimal.
The divergence between actual within-country policies and those suggested by the analysis in Kopczuk et al. could be explained by any number of factors. Actual government policy is determined by politics, and for reasons we’ll consider later in class but which are probably already obvious to you, there is no particular reason to think the outcomes of the political process in a particular country would necessarily be social welfare maximizing. This would be especially true in places without effective democracy, but is also generally true, just to a lesser extent, even in places with well-functioning democratic elections. Still, in places with legitimate democratic voting, and even to some extent in places with dictators that need some popular support to survive, the government has some incentive to choose policies that make the majority of the population happy, which might not be that far from what would maximize social welfare. Another obvious possibility is that most peoples’ ethical views may in fact be very different from those that are implicit in the social welfare functions used in Kopczuk et al. Concerns that the negative economic consequences of high taxes and transfers might much larger than the Kopczuk et al. analysis assumes might also explain some of what is going on. Or it could be that poor tax administration, rampant tax evasion, and corruption simply make it very difficult for low- and middle-income countries to do much more in this regard than they already are doing.
Martin Ravallion (2010) offers a rather different perspective on within-country redistribution in developing countries. He shows empirically that in the poorest countries, the vast majority of people have such low incomes, and there are so few people with high incomes, that the countries simply do not have the capacity to bring significant numbers of their poorest people up to some minimum acceptable level of income (say $1.25 per day) through within-country redistribution. Moreover, providing significant aid to the poorest in these countries requires redistributing away from people who, while relatively well-off by the standards within their own countries, would definitely be considered poor by rich country standards. By contrast, countries that have experienced enough economic growth to reach at least a moderate level of development – for example, that of Brazil or China, with per capita incomes of $10,200 and $6,870, respectively in 2009 -- do have the capacity to make a serious dent in poverty through redistribution. He concludes that the latter group of countries can achieve much through within-country redistribution, but that the former group of countries should focus more on policies to promote economic growth and less on redistribution until they graduate to the second group. He also argues that rich country foreign aid should be focused more on the poorest countries, to help compensate for their low capacity for within-country redistribution.
24
The perspective taken in the Kopczuk et al. analysis, by contrast, is that even if the within-country redistribution that is possible in the poorest countries cannot bring the poor up to some minimally acceptable standard of living, these people are so poor and have such a high marginal utility for income that it is ethically imperative to use within-country redistribution to help them to the extent that sufficient aid from rich countries is not forthcoming. They would agree with Ravaillion that policies to promote economic growth are a good idea, that whether redistribution is wise depends partly on the consequences of that redistribution for economic growth, and that redistribution across borders can potentially do a lot more to help the poorest people in the poorest countries than within-country redistribution can. But the perspective taken in the Kopczuk et al. paper suggests that within-country redistribution is not pointless for the poorest countries.
The Kopczuk et al. analysis should be viewed with healthy degree of skepticism. Indeed, the authors themselves view their own work that way. But their paper does offer a striking indicator of just how stark income inequality is, not only within countries but especially across the globe, and points out that the ethical implications might be dramatic. Moreover, the within-country analysis suggests that there could be considerable scope for the governments in low- and middle-income countries to improve the well-being of their citizens through better policy. But achieving this would require making progress in addressing very difficult problems such as corruption and tax evasion. Overall, it raises many interesting questions for discussion and further study.
Ben Olken (2006) provides an interesting application of social welfare analysis in a developing country context. He evaluates a redistributive program in Indonesia that used general tax revenues to finance subsidized bags of rice that were supposed to be distributed to poor households. Olken compares central government administrative data on the amount of rice that was initially distributed by the central government against household survey data on how much rice various types of households reported actually receiving. Based on this, he estimates that about 18 percent of the rice was stolen by corrupt local officials. He takes this into account in his social welfare analysis by assuming that the stolen rice was consumed by the most affluent person in each village (likely the village head). He then computes social welfare when the redistributive program is in effect, and compares it with a counterfactual where the redistributive program is eliminated and the funds are used instead to reduce the value-added tax. He uses a utilitarian social welfare function, and incorporates the deadweight loss of taxation through various assumptions about the marginal cost of public funds (which, as noted above, is $1 plus the marginal deadweight loss per dollar of revenue raised).
Olken assumes a “constant relative risk aversion” (CRRA) utility function: Ui = (Ci1-ρ – 1)/(1-ρ), (7)
where ρ is a parameter governing how sharply curved the utility function is. He shows results for two cases, ρ = 1 and ρ = 2. When ρ = 1, the CRRA utility function becomes Ui = ln(Ci), which
25
implies that the marginal utility of consumption is 1/Ci.8 He also shows results for ρ = 2, which implies a more sharply curved utility function (and thus more rapidly diminishing marginal utility). He normalizes social welfare to a scale ranging from 0 to 100, where 0 represents the level of social welfare that occurs if the taxes to pay for the program are collected, but then the tax revenue is completely wasted (e.g., the bags of rice are purchased but then they are all dumped into the sea), and 100 is the level of social welfare that would occur if the taxes to pay for the program are collected, and all of the rice is distributed to the households that are in the greatest need (i.e., the program is perfectly targeted on the poorest). The actual redistributive rice program falls short of that ideal because the rice does not go to the people who need it most, both because of theft by corrupt officials, and because of imperfect targeting (rice sometimes went to better-off households instead of worse-off households partly because of the administrative difficulty of determining who is most in need). The numbers reported in his Table 4 then represent the percentage of the maximum possible gain in social welfare from the program that actually occur under the two different policy options (redistributive rice program vs. tax cut) under different scenarios for the curvature of the utility function, the deadweight loss from taxes, the amount of corruption, and the effectiveness of targeting.
When ρ = 1, the redistributive program with corruption and imperfect targeting increases social welfare by about 52 percent of the increase that would have occurred with perfect targeting and no corruption, relative to collecting the tax revenue and completely wasting it. If taxes are assumed to involve no deadweight loss, then eliminating the program and using the savings to finance an across-the board cut in the VAT rate reduces social welfare relative to keeping the actual program (along with its imperfect targeting and corruption). In that case, when ρ = 1, eliminating the program and cutting taxes produces about 47 percent of the gain in social welfare that you would get from the perfect redistributive program, relative to collecting the taxes and dumping the rice in the sea. Since that is less than 52 percent, the actual program is better for social welfare than killing the program and cutting taxes. But if ρ = 1 and the marginal deadweight loss per dollar of revenue raised through taxes is $0.12 or above, eliminating the program in order to provide a tax cut produces higher social welfare than the actual program. For example, when the deadweight loss associated with $1 of government revenue is $0.20, the gain in social welfare from the tax cut is 1.2 times as much as the tax revenue the government sacrifices – i.e., the tax cut is now not only reducing the amount of government revenue taken out of peoples’ pockets, but is also reducing the hidden costs of taxation (deadweight loss) that had also been hurting them. When deadweight loss from taxes is $0.20 per dollar of revenue raised and ρ = 1, killing the rice program and cutting taxes raises social welfare by 56 percent of the gain in social welfare that occurs under the perfect rice program, relative to collecting the taxes and wasting the revenue, which is better than the actual program, which as noted above only produces 52 percent of the gain in social welfare that would occur under the perfect program. If the corruption could have been eliminated, and we assume ρ = 1, then the redistributive program would have produced greater social welfare than the tax cut when the marginal deadweight loss per dollar of revenue raised is $0.35 or less.
8 To see why Ui = (Ci1-ρ – 1)/(1-ρ) becomes Ui = ln(Ci) when ρ = 1 requires an understanding of L’Hopital’s rule from calculus.
26
When ρ = 2, the actual redistributive program (with corruption and imperfect targeting) yields higher social welfare than the tax cut as long as the marginal deadweight loss per dollar of revenue raised is $0.42 or less. If corruption could have been eliminated, the redistributive program would have resulted in higher social welfare than the tax cut even if the marginal deadweight loss per dollar of revenue raised were as high as $0.60.
Olken’s study helps illustrate one of the costs of corruption – it reduces social welfare by diverting redistributive aid away from those who are most in need. If the goal is to maximize social welfare, Olken’s analysis suggests some combination of the following two policy implications: (1) reducing corruption can have an important positive effect on social welfare, which strengthens the case for policies and political reforms that would cut down on corruption; and (2) to the extent that it is not possible to reduce corruption, that could reduce the amount of redistribution that the government should attempt.
References Alesina, Alberto, Edward Glaeser, and Bruce Sacerdote. 2005. “Work and Leisure In The U.S. and Europe: Why So Different?” NBER Macroeconomics Annual, Vol. 20 Issue 1. (Link to freely accessible working paper version: http://papers.ssrn.com/sol3/papers.cfm?abstract_id=706982). Bakija, Jon. 2011. “Notes on indifference curve analysis of the choice between leisure and labor, and the deadweight loss of taxation.” Bahl, Roy W., and Richard M. Bird. 2008. "Tax Policy in Developing Countries: Looking Back--and Forward." National Tax Journal Vol. 61, no. 2. Blomquist, Sören and Laurent Simula, 2010. "Marginal Deadweight Loss when the Income Tax is Nonlinear," CESifo Working Paper Series 3053, CESifo Group Munich. < http://www.cesifo-group.de/portal/page/portal/DocBase_Content/WP/WP-CESifo_Working_Papers/wp-cesifo-2010/wp-cesifo-2010-05/cesifo1_wp3053.pdf> Boadway, Robin. 2010. "Efficiency and Redistribution: An Evaluative Review of Louis Kaplow's The Theory of Taxation and Public Economics." Journal of Economic Literature Vol. 48, no. 4: 964-979 Burnside, Craig, and David Dollar. 2000. "Aid, Policies, and Growth." American Economic Review. Vol. 90, no. 4: 847-868. Chu, Ke-Young, Hamid Davoodi, and Sanjeev Gupta. 2004. "Income Distribution and Tax and Government Social-Spending Policies in Developing Countries." In Inequality, Growth, and Poverty in an Era of Liberalization and Globalization, Oxford and New York: Oxford University Press, pp. 249-270. Conference Board. 2010. “Total Economy Database, Output, Labor, and Labor Productivity Country Details, 1950-2009.” (http://www.conference-board.org/economics/database.cfm).
27
Diamond, Peter and Emmanuel Saez. 2011. “"The Case for a Progressive Tax: From Basic Research to Policy Recommendations." Journal of Economic Perspectives. Vol. 5, No. 4 (Fall), pp. 165-190 <http://www.aeaweb.org/atypon.php?return_to=/doi/pdfplus/10.1257/jep.25.4.165>. Djankov, Simeon, Jose G. Montalvo, and Marta Reynal-Querol. 2008. "The Curse of Aid." Journal of Economic Growth. Vol. 13, no. 3: 169-194. Dworkin, Ronald. 2000. Sovereign Virtue: The Theory and Practice of Equality. Cambridge, MA: Harvard University Press. Easterly, William. 2003. "Can Foreign Aid Buy Growth?." Journal Of Economic Perspectives 17, no. 3: 23-48. Easterly, William. 2007. The White Man's Burden: Why the West's Efforts to Aid the Rest Have Done So Much Ill and So Little Good. Penguin Books. Faggio, Giulia, and Stephen Nickell. 2007. "Patterns of Work across the OECD." Economic Journal 117, no. 521: F416-40. Goldberg, Jessica. 2011. “Kwacha Gonna Do? Experimental Evidence about Labor Supply in Rural Malawi.” Working paper, University of Maryland. <http://econweb.umd.edu/~goldberg/docs/goldberg_ganyu.pdf>. Gorodnichenko, Yuriy, Jorge Martinez-Vazquez, and Klara Sabirianova Peter. 2009. "Myth and Reality of Flat Tax Reform: Micro Estimates of Tax Evasion Response and Welfare Effects in Russia." Journal of Political Economy Vol. 117, no. 3 Gruber, Jonathan. 2011. Public Finance and Public Policy, New York: Worth Publishers. International Monetary Fund. 1994. Government Finance Statistics Yearbook. Washington: International Monetary Fund. Kaplow, Louis. 2008. The Theory of Taxation and Public Economics, Princeton and Oxford: Princeton University Press. Kopczuk, Wojciech, Joel Slemrod, and Shlomo Yitzhaki. 2005. "The Limitations of Decentralized World Redistribution: An Optimal Taxation Approach." European Economic Review, Vol. 49, no. 4. Kopczuk, Wojciech, Joel Slemrod, and Shlomo Yitzhaki. 2002. "Why World Redistribution Fails." NBER Working Paper No. 9186 (September) <http://www.nber.org/papers/w9186>. Mankiw, N. Gregory. 2007. "The Political Philosophy of Redistributing Income," from Principles of Microeconomics, 4th Edition. Thomson-Southwestern, pp. 439-442.
28
Mankiw, N. Gregory. 2010. "Spreading the Wealth Around: Reflections Inspired by Joe the Plumber: Presidential Address." Eastern Economic Journal. Vol. 36, No. 3, pp. 285-298. Mankiw, N. Gregory, Matthew Weinzierl, and Danny Yagan. 2009. "Optimal Taxation in Theory and Practice." Journal of Economic Perspectives, Vol. 23, no. 4: 147-174. <http://www.aeaweb.org/atypon.php?return_to=/doi/pdfplus/10.1257/jep.23.4.147>. Mankiw, Gregory and Matthew Weinzierl. 2010. “The Optimal Taxation of Height: A Case Study of Utilitarian Income Redistribution." American Economic Journal: Economic Policy, Vol. 2, No. 1, pp. 155-76. McDaniel, Cara. 2009. “Average tax rates on consumption, investment, labor, and capital in the OECD 1950-2003.” Data updated in 2012 available at <http://www.caramcdaniel.com/researchpapers>. Mirrlees, James A. 1971. "An Exploration in the Theory of Optimal Income Taxation." Review of Economic Studies, Vol. 38, pp. 175-208. Musgrave, Richard A. 1990. “Horizontal Equity, Once More.” National Tax Journal. Vol. 43, No. 2, pp. 113-22. <http://ntj.tax.org/wwtax/ntjrec.nsf/A42168FEAB9541FF8525686C00686DCA/$FILE/v43n2113.pdf>. Nickell, Stephen, Luca Nunziata. 2001. “Labour Market Institutions Database.” September 21. (http://cep.lse.ac.uk/pubs/download/data0502.zip). Nozick, Robert. 1977. Anarchy, State, and Utopia. New York: Basic Books. OECD (Organization for Economic Cooperation and Development). 2012. iLibrary Statistics (http://www.oecd-ilibrary.org/statistics). Okun, Arthur. 1975. Equality and Efficiency: The Big Tradeoff. Washington: Brookings Institution Press. Olken, Benjamin A. 2006. "Corruption and the Costs of Redistribution: Micro Evidence from Indonesia." Journal of Public Economics Vol. 90, no. 4-5: 853-870. Piketty, Thomas, Emanuel Saez, and Irina Stantcheva. 2011. “Optimal Taxation of Top Labor Incomes: A Tale of Three Elasticities.” NBER Working Paper No. 17616. (Link to freely available working paper version: http://elsa.berkeley.edu/~saez/piketty-saez-stantchevaNBER11thirdelasticity.pdf)
29
Rawls, John. 1971. A Theory of Justice. Cambridge, MA: Harvard University Press. Roemer, John E. 1998. Equality of Opportunity. Harvard University Press. Ravallion, Martin. 2010. "Do Poorer Countries Have Less Capacity for Redistribution?" Journal Of Globalization And Development. Vol. 1, no. 2. Rosen, Harvey S., and Ted Gayer. 2008. “Taxation and Efficiency.” Excerpted from pp. 331-335 and 337-340 of Public Finance, 8th ed. New York: McGraw-Hill Irwin. Sachs, Jeffrey. 2006. The End of Poverty. Penguin Books. Slemrod, Joel. 1995. "What Do Cross-Country Studies Teach Us About Government Involvement, Prosperity, and Economic Growth?" Brookings Papers on Economic Activity, No. 2. <http://www.brookings.edu/~/media/Files/Programs/ES/BPEA/1995_2_bpea_papers/1995b_bpea_slemrod_gale_easterly.pdf> Summers, Robert, and Alan Heston. 1991. "The Penn World Table (Mark 5): An Expanded Set of International Comparisons, 1950-1988." Quarterly Journal of Economics. 106(2): 327-68. Weisbach, David. 2003. "Redistribution," from “Should Legal Rules be used to Redistribute Income?” University of Chicago Law Review. Vol. 70, [Excerpt, pp. 440-446].
30