Social Security in Developing Countries Myth or Necessity. Evidence From India

Munich Personal RePEc Archive
Social Security System in India: An
International Comparative Analysis
Jha, Rupak Kumar and Bhattacharyya, Surajit
Indian Institute of Technology Bombay
15 January 2010
Online at https://mpra.ub.uni-muenchen.de/20142/
MPRA Paper No. 20142, posted 19 Jan 2010 18:31 UTC
Social Security System in India: An International Comparative Analysis
by
Rupak Kumar Jha♣
Research Scholar in Economics
Department of Humanities & Social Sciences
IIT-Bombay. Powai. Mumbai – 400 076.
E-mail: [email protected]
and
Surajit Bhattacharyya
Assistant Professor of Economics
Department of Humanities & Social Sciences
IIT-Bombay. Powai. Mumbai – 400 076.
E-Mail: [email protected]
♣ This paper is based on the selected portions of the M.Phil dissertation of the first author at IIT-Bombay. An
abridged version of this paper was presented in the International Conference on “Emergent Business Models and
Strategies for the Knowledge Economy: Impact on Business, Government & Society” at IBA, Bengaluru, 19-21
November, 2009. The author gratefully acknowledges the comments and suggestions made by the conference
participants. However, the usual disclaimer applies.
2
Social Security System in India: An International Comparative Analysis
Abstract
This paper examines selected components of social security system in India and compares them
with their OECD counterparts. Historically, the Indian policy makers have viewed the pension
system as a welfare measure and therefore, it lacks in financial professionalism, diversification,
and in the belief that pension funds can also be treated as an asset. The Indian system is biased
towards the organized formal sector as workers in this sector are benefitted with the provisions
under various labor laws. Even then the pension provisions in India are way far behind the
OECD benchmark. In the unorganized sector, old age income remains mainly confined to
voluntary savings. The New Pension System although makes the pension amount an old age
asset, is silent on the social security provisions to the poor. The average income earners are not
able to replace their pre-retirement earnings with pensions compared to most of the OECD
countries. In terms of the gross pension wealth, India is nearer to the OECD average only in the
low income category for men. Out of 5% of health care expenditure as a percentage of GDP,
government’s share in India accounts even less than 1% which is significantly lower than the
OECD benchmark.
Keywords: Social Security System, Pension Funds, India, OECD.
JEL Classification: H55, J14, J33.

3
1. Introduction
A Social Security System (SSS) is one whereby the state provides various benefits to those who
are unable to provide the same for themselves. Such a system is generally meant to serve the
socially deprived conditions, such as poverty, old age, disability, and unemployment, etc. The
most important forms of social security system are retired-worker benefits, and dependents'
benefits. Therefore, SSS is a means of living independently during the old age and supporting the
dependents in the family. Individuals while working are expected to set aside a part of their
income as long term savings to take care of their needs in post-retirement years. Apart from the
increased cost of living, the steeply rising cost of medical treatments in recent times and the need
for personalized services in the old age, there are always apprehensions that the savings made
during the working life will be inadequate unless some institutional arrangements are in place.
Population age structure of an economy plays an important role in deciding the savings
generation potential of that economy.i In a dynamic economy, the age structure of population
influences the income growth. With population growth there will be more young people to save
and their contribution to income growth will be significant. In other words, with larger share of
younger population who are working, the net savings of the economy will be positive; the
induced income growth propels total savings at a higher level.
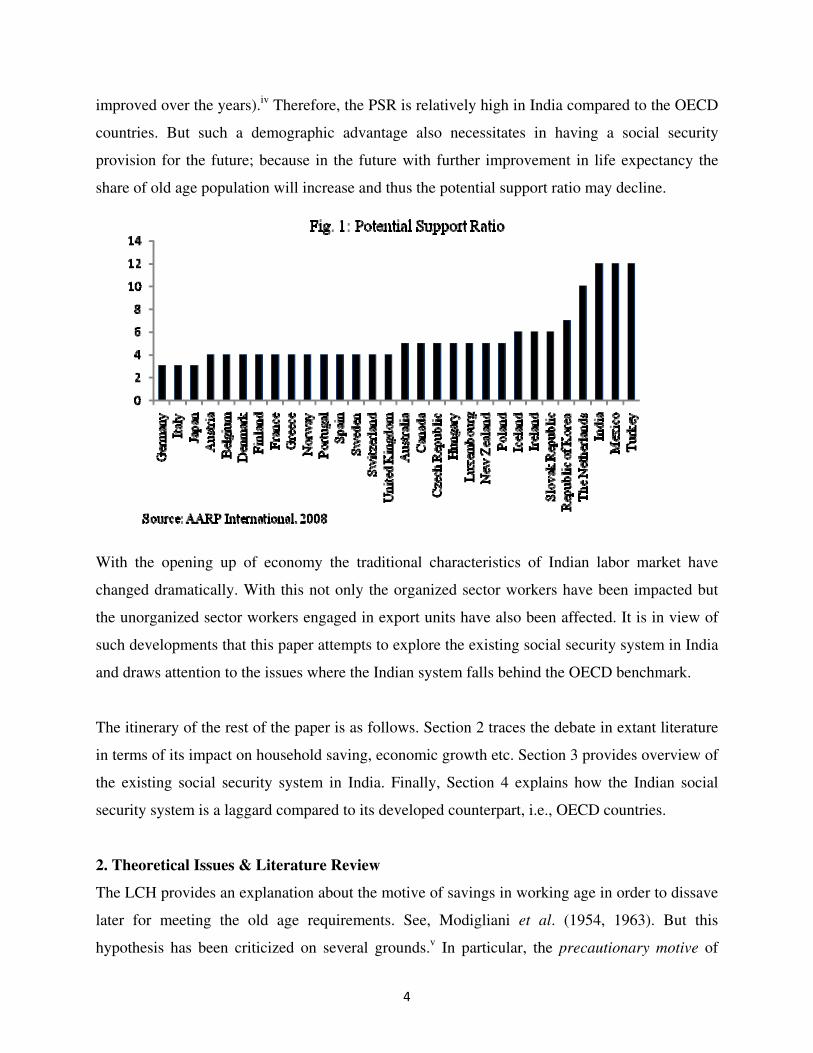
This study tries to assess the existing social security system in India with that of the OECD
countries. Comparing the demographic features between India and OECD, it is observed that the
Indian demographic features are better than the overall OECD average and India has a larger
pool of young population than most of the OECD countries. Potential Support Ratio (PSR)
stands very high for India meaning that the existing population is very young and in the working
age group.ii Hence, they have very less number of elderly to support. With Mexico and Turkey,
the PSR of India stands at 12. On the other hand, the PSR of countries like Japan, Italy, and
Germany is very low and support the aging argument in these countries.iii
The OECD countries
are graying fast and with weak savings potential their prospects of future growth momentum is
reaching saturation. On the contrary, the population growth rate in India has declined
consistently (from 2.25% in 1980-85 to 1.62% in 2000-05) and is estimated to be 0.25% in 2045-
50. Not only that, the life expectancy at the age of 60 is also relatively low (though it has
4
improved over the years).iv
Therefore, the PSR is relatively high in India compared to the OECD
countries. But such a demographic advantage also necessitates in having a social security
provision for the future; because in the future with further improvement in life expectancy the
share of old age population will increase and thus the potential support ratio may decline.
With the opening up of economy the traditional characteristics of Indian labor market have
changed dramatically. With this not only the organized sector workers have been impacted but
the unorganized sector workers engaged in export units have also been affected. It is in view of
such developments that this paper attempts to explore the existing social security system in India
and draws attention to the issues where the Indian system falls behind the OECD benchmark.
The itinerary of the rest of the paper is as follows. Section 2 traces the debate in extant literature
in terms of its impact on household saving, economic growth etc. Section 3 provides overview of
the existing social security system in India. Finally, Section 4 explains how the Indian social
security system is a laggard compared to its developed counterpart, i.e., OECD countries.
2. Theoretical Issues & Literature Review
The LCH provides an explanation about the motive of savings in working age in order to dissave
later for meeting the old age requirements. See, Modigliani et al. (1954, 1963). But this
hypothesis has been criticized on several grounds.v In particular, the precautionary motive of
5
savings even can force old aged people not to dissave as much as has been depicted by the LCH;
because they may fear that the future contingency can offset the available level of income. On
the other hand, because of the liquidity constraints, people cannot smooth out their consumption
pattern for a long period. The existing literature on social security system has extensively used
the LCH to analyze and discuss its role and impact over the household savings behavior. Aaron
(1967), finds that the social security expenditure to national income ratio have a negative
relationship with the household savings ratio. Feldstein (1974) extended the LCH framework to
show that presence of social security system decreases personal savings. But Leimer et al. (1982)
and Eisner (1983) contradict Feldstein (ibid.). According to them, the presence of social security
in the periods of unemployment enhances the consumption and thus the national income
increases which in turn reinforces the savings and investment. The literature also provides the
debate about the influence of age of the social security system on household savings [Feldstein
(1977) and Kopits et al. (1980)]. The impact of social security on household savings can be
measured through three effects: income effect, wealth effect and retirement effect.vi
Any change
in benefits or payroll taxes alters the disposable income available with the individuals and thus
have an income effect. However, the income effect is neutralized in the long-run if the raised
disposable income is offset by the equivalent increment in payroll taxes. The wealth effect
indicates the direct savings response of individuals to expected future benefits. It is negative if
the households feel that in the presence of adequate social security provisions there is less
savings requirement for future. On the other hand, the wealth effect will be positive if the social
security program educates the households that it is essential to insure themselves against the old
age requirements and contingencies like sickness and unemployment (Cagan, 1965). In addition
to this, the retirement effect affects the savings ratio indirectly as the benefits from retirement
may induce the individuals to go for early (say, voluntary) retirement than they would in the
absence of it. Therefore, the retirement effect is positive when the provisions of retirement
benefits induce the aged worker(s) to drop out from the labor market. However, the relative
strength of the wealth and retirement effects can be leveled for criticism incorporating the
possibility of existence of joint family system whereby the working individuals support the
elderly, non workings and incapables with the hope that they will get the similar support from
their children in a similar way as they are doing to their dependents.

6
The public pension plans affect the growth of the economy. Denton et al. (1981) report short
term impact of pension plan outlays on the growth prospects of Canada. They find that
introduction of a national pension plan temporarily reduces the rate of economic growth. Weil
(1994) provides evidence from developed economies that the old by providing bequests lowers
the savings among the young.vii
These authors argue that the extent of savings reduction and
hence the impact on the level of income in the long-run is affected by the nature of aggregate
savings behavior. Most of the existing empirical studies are focused on advanced countries. Only
a few have attempted so far to explore the case for some of the developing countries. For
instance, see Feldstein (1977) and Kopits et al. (1980). But they do not find statistically
significant results for those developing countries. Ashraf et al. (2003) argue that the strong
withdrawal side features of saving schemes deter the individuals to go for the future savings. In
general, the anomalies in savings behavior can be cited to the presence of weak and stagnant
organized sector in the developing economies.
3. Social Security System in India: An Overview
With a presence of large unorganized sector, India has not been able to provide a quintessential
social security cap to all. In India, the World Bank’s three pillar approach of pension system is
partially followed as there is no minimum guaranteed pension for the participants (hence, the
first pillar is nonexistent).viii
There are various employment linked pension schemes existing in
India, but they are limited only to the organized segment of the workforce. As against the OECD
average of mandatory pension schemes of covering population of the age group 15-65 and the
labor force (which stands to 60.4% and 80.3%, respectively) India stands far behind: it covers
only 5.7% of population in the age group of 15-65 and 9.1% of the labor force. Workforce
engaged in unorganized sector has to resort to the third pillar of pension system which is of
voluntary nature. Hence, the Indian pension system is largely privately managed at individual
level; Poirson (2007). Since Indian policy makers viewed pension system as a welfare measure,
it lacked in financial professionalism, diversification, and in the belief that the pension funds
could be treated as an asset; see, Vaidyanathan (2006). The Indian Social Security System is
broadly classified as follows:ix
(i) Civil Service Pensions; (ii) Statutory Pension Scheme and
Provident Fund Scheme for the Organized Sector; (iii) Superannuation; (iv) Small Saving

7
Schemes; (v) Pension Schemes and Welfare Funds for the Senior Citizens and Destitute; and (vi)
Micro Pension Schemes.
The first three Pension provisions are meant for the organized sector workers. The fourth
component is of special importance because with this instrument the central and state
governments encourage the households to save and thereby generate funds to finance their debts.
The interest returns on these funds are generally higher than the market interest rates and some of
these funds are also tax advantaged. The fifth component is meant for the targeted community in
the ‘unorganized sector’ including the destitute. Finally, the Micro Pension Schemes designed
with the UTI and SEWA bank encourage the unorganized sector women worker to save in order
to meet their old age needs.
3.1 Pension Provisions to the Organized Sector in India
The government employees in India are entitled to receive the Superannuation Pension and
Retiring Pension under the various rules of civil services pension schemes. Besides, there are
provisions for health disability, family pension and even for the employees under (disciplinary)
penalty. However, new entrants to the central government work force (except the armed forces)
who have joined after January 2004 have been placed under the New Pension System (NPS)
which is a Defined Contribution (DC) based pension scheme.x NPS is regarded as India's
equivalent of the individual retirement accounts in the USA; Asher (2006). On the other hand,
for the government and private enterprises, social security provision are constitutional and the
laws enacted in India are: (i)The Employees' Provident Funds & Miscellaneous Provisions (EPF
& MP) Act, 1952; (ii) The Employees' State Insurance (ESI) Act, 1948; and (iii) The Payment of
Gratuity Act, 1972. In case of the first one, both the DC and DB schemes are run simultaneously
to benefit the employees and their families. Similarly, the Employees’ Deposit Linked Insurance
(EDLI) Scheme, 1976 gives insurance cover to the dependents with the employers’ contribution.
The ESI Act comprises of DC schemes for the (organized sector) factory workers. These have
been extended to benefit the workers employed in restaurants, multiplexes, etc. Finally, the
payment of the gratuity benefit is a statutory requirement for employers and it is applicable to all
the permanent employees, regardless of their category or salary.
8
3.2 Small Saving Schemes
The small saving schemes are the saving instruments which the households save for the
contingencies and future purpose. Barring Post Office Savings and Savings Bank Accounts, in
general other small saving schemes generate interest yield higher than the interest rate prevailing
in the market. Public Provident Fund (PPF) because of its long term maturity period is
considered as a pension scheme similar to the schemes existing for the workers of organized
sector. These saving schemes are important considering the cyclical nature of income and short
term contingencies in the unorganized sector.
3.3 Pension Schemes and Welfare Funds for Senior Citizens and Destitute
These are typically targeted social assistance programs and welfare funds. The pension
provisions for the elderly of informal sector are: (i) Senior Citizen Saving Schemes (SCSS); and
(ii) National Old Age Pension Schemes (NOAPS). The SCSS aims to benefit the senior citizens
by providing them a simple and high yielding channel with a small maturity period and high
interest return (9%). Easy and premature withdrawal is allowed which caters to the old age
contingencies. On the other hand, NOAPS is a non-contributory scheme designed particularly for
the elderly citizens falling below the poverty line and the destitute.
3.4 Micro Pension Schemes
Micro Pension Schemes are particularly meant for the informal sector women workers. In this
scheme, the saving is accumulated over a period of time and intermediated through financial and
capital markets by professional fund managers. At an agreed withdrawal age (usually 58 or 60)
the accumulated balance can be withdrawn either as a lump-sum amount or phased withdrawals,
or a combination of the two. SEWA (Self Employed Women Association) is one such scheme
managed by UTI AMC in which the contribution is made up to the age of 55 and the pension
starts after 58.
4. Comparison of India Social Security System with the OECD Countries
This section examines the social security system in India in comparison with the OECD
countries in terms of the health care expenditure as a percentage of GDP, basic structure of
9
pension schemes in the organized sector, replacement rates, pension wealth and pension asset as
a percentage of GDP.
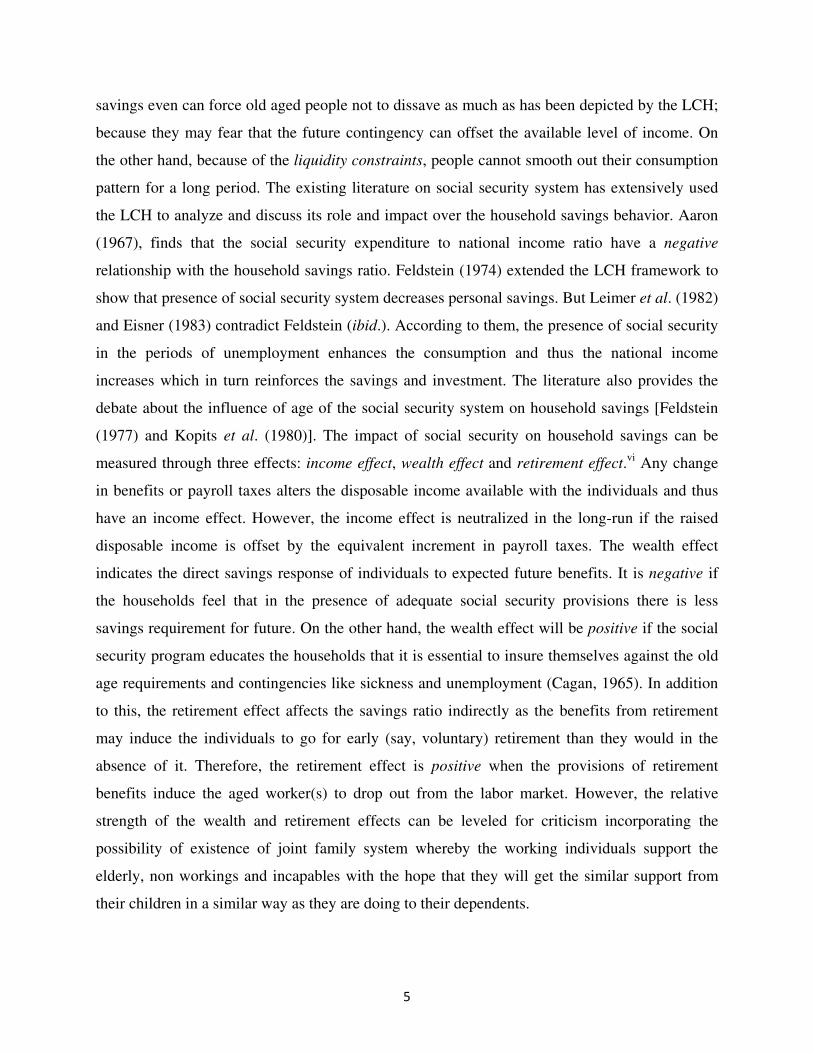
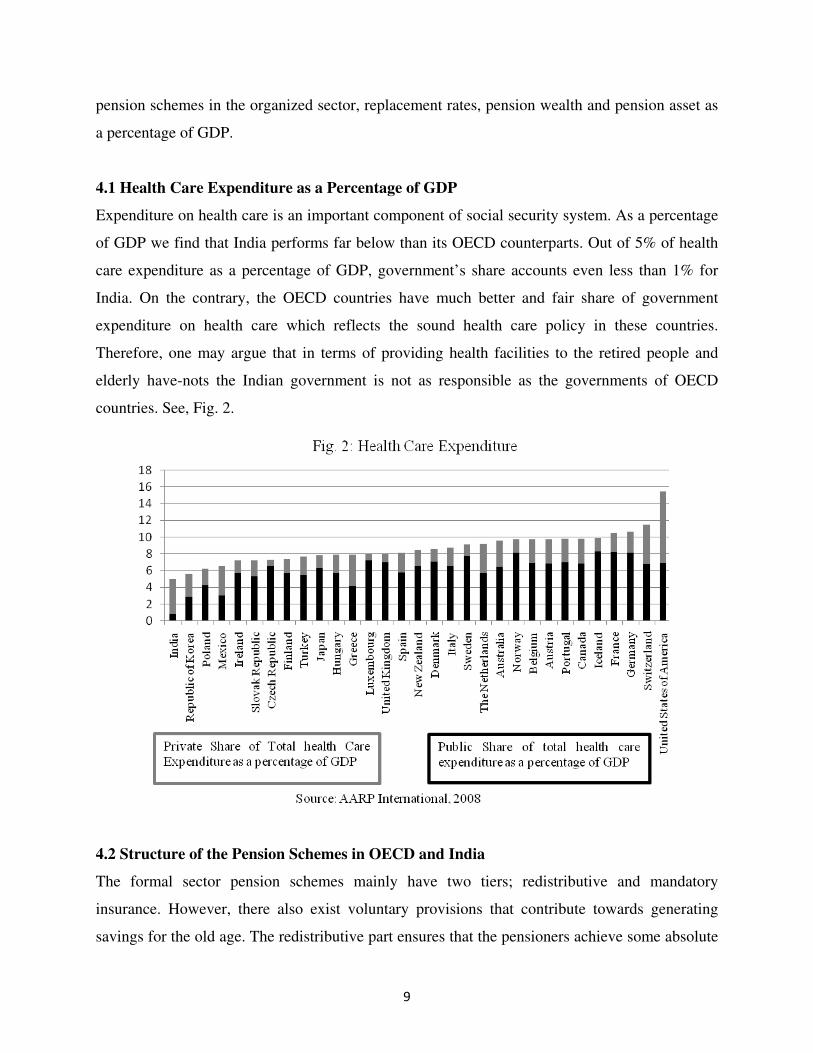
4.1 Health Care Expenditure as a Percentage of GDP
Expenditure on health care is an important component of social security system. As a percentage
of GDP we find that India performs far below than its OECD counterparts. Out of 5% of health
care expenditure as a percentage of GDP, government’s share accounts even less than 1% for
India. On the contrary, the OECD countries have much better and fair share of government
expenditure on health care which reflects the sound health care policy in these countries.
Therefore, one may argue that in terms of providing health facilities to the retired people and
elderly have-nots the Indian government is not as responsible as the governments of OECD
countries. See, Fig. 2.
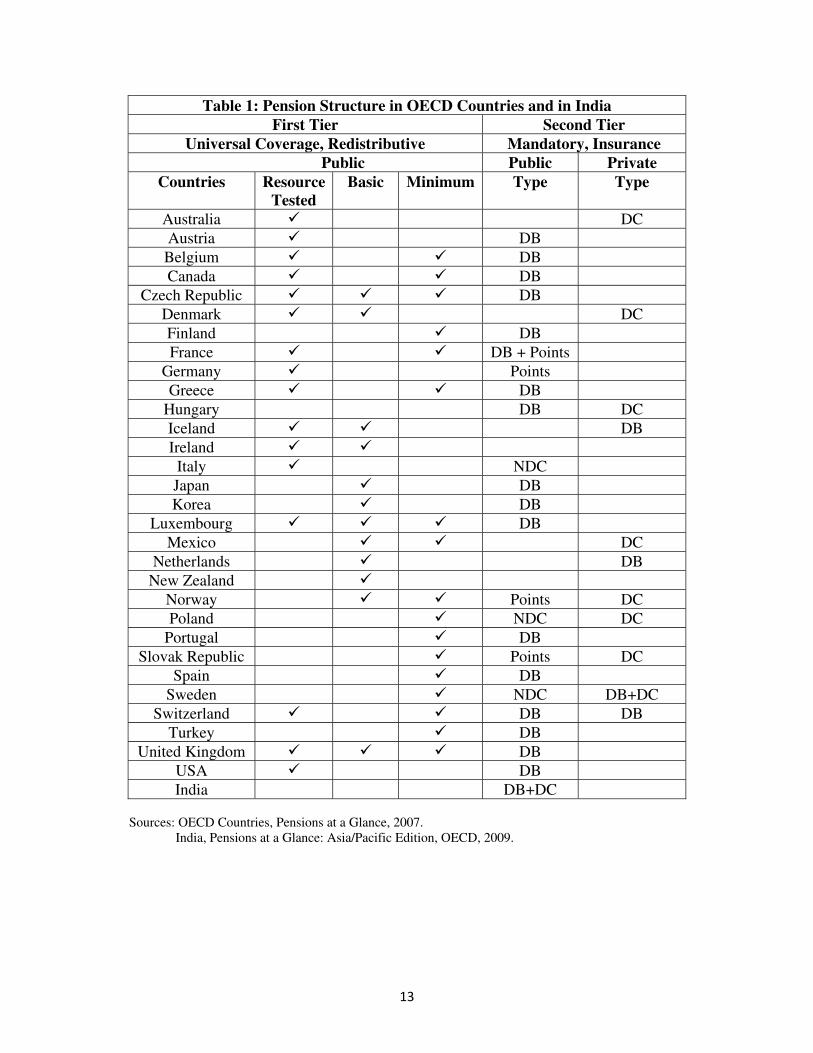
4.2 Structure of the Pension Schemes in OECD and India
The formal sector pension schemes mainly have two tiers; redistributive and mandatory
insurance. However, there also exist voluntary provisions that contribute towards generating
savings for the old age. The redistributive part ensures that the pensioners achieve some absolute

10
and minimum standard of retired living. The insurance component of the pension schemes are
some targeted retirement savings in comparison to the earnings during pre-retirement years. In
the redistributed tier there are three components ⎯ resource-tested, basic, and minimum
pensions.xi
The second tier (mandatory insurance) consists of Defined Benefit (DB), Defined
Contribution (DC),xii
Notional Accounts (NDC)xiii
and Points.xiv
Based on these features,
comparing the pension structure existing in OECD countries and in India, we find that the Indian
formal sector does not guarantee the redistributive pension. Therefore it lags behind the pension
system available in the OECD countries. Refer to Table 1. For details, see Pensions at a Glance,
2007, Pp. 24-25).
4.3 Comparison Based on Replacement Rates
The old-age pension replacement rate measures how effectively a pension system provides a
retirement income to replace earnings during the working years, the main source of income
before retirement. Gross and Net Replacement Ratesxv
are the two indicators based on which the
formal sector pension schemes are compared between India and OECD countries. Table 2
represents the difference in terms of Gross Replacement Rate (GRR) performances in both the
domain. Considering the group of average income earners, the GRR in India stands below the
OECD average in both the sexes’ category. This implies that, in the formal sector the average
income earners (both men and women) in India are not able to replace their pre-retirement
earnings with pensions compared to most of the OECD countries (notwithstanding, some notable
exceptions such as UK, Mexico and Japan). If compared with the OECD average, this also holds
true for the Indian low income earners (both the sexes). However, on the basis of cross-country
difference, in India the GRR of the low income category is better than many of the OECD
countries. For the high income earners, in India the GRR performance is not very encouraging.
With reference to the Net Replacement Rate, although it is higher than the GRR in all the OECD
countries as well as in India;xvi
but for all categories: low, average and high for both men and
women, India stands below the OECD average. Refer to Table 3.
4.4 Comparison Based on Pension Wealth
Pension wealth is considered to be a better indicator than the replacement rates as it includes the
life expectancy, retirement age, and the indexation of pension benefits that determine for how

11
long the pension benefit must be paid and how its value evolves over time. The Gross Pension
Wealth (GPW) refers to the magnitude of pension flow. In terms of GPW, while India is nearer
to the OECD average in the low income category for men, it lags in other income groups for both
the sexes. Having consistency with the findings on replacement rates, GPW for low income
category people (both for men and women) in India is better than many of the OECD countries
on the basis of cross-country differential. India’s relative performance in terms of Net Pension
Wealth also exhibits the similar trend. Refer to Table 4 & 5, respectively.
4.5 Comparison Based on Financial Depth
In some of the OECD countries the financial depth (measured as pension asset as a percentage of
GDP) happens to be more than 100% (e.g., Netherlands, Switzerland and Australia) compared to
a meager 5.75% in India. It highlights the fact that in the OECD countries the pension provision
system yield high returns and are well invested. Therefore, in the OECD countries, the returns on
pension funds are lucrative and the aged have relatively better life in the post-retirement years.
India’s pension asset as a percentage of GDP though does not look that impressive but is still
better than some of the OECD countries such as Germany, Italy, Belgium, Czech Republic, and
France. See, Fig. 3.

12
5. Summary and Conclusion
In any economy, the social security system is primarily meant to provide protection to elderly
poor and destitute from economic deprivation. In advanced countries, the social safety net is
quite wide in terms of its contribution to meet the needs of their elderly population; a large chunk
of the labor force there is in the organized sector and enjoys the coverage of labor laws. It covers
the workers and their dependents against the physical (and/or mental) disability, unemployment
and thus covers the income and health risks. But in the case of India, the lack of such a wide
social security net does have serious implications for well-being of aged, poor people who are
unable to meet their old age needs for reasons beyond their control. The incidence of wide-
spread poverty and unemployment make the situation more adverse.
India’s workforce is largely engaged in the unorganized sector where the pension provisions are
mainly of voluntary nature. In fact, the largeness of this sector is a bottleneck in the social
security provisions to the elderly poor in India. Though the NPS is a professional move to make
the Indian social security system in tandem with the international practice, the benefits are likely
to be carried away by the organized sector workers as they have consistent and regular cash flow
of income. The targeted assistance and micro pension schemes although caters to the need of old
age poor and women, are not significant enough to meet the future requirements. In addition, the
government’s burden of the pension provision with the administered interest rate (which is
usually high compared to the market rate of interest) makes the government vulnerable to its debt
sustainability. If we compare the formal sector pension scheme in India with the pension
provisions practiced in the developed world, it performs far below than the OECD average. The
Indian formal sector pension scheme does not guarantee the redistributive pension. This makes
the provision privately managed. It is not surprising that the replacement ratios and pension
wealth are also not at par with the pension provisions available in the OECD countries. The low
health care expenditure is an indicator of how much the Indian government has been
irresponsible towards its people. Finally, the bottom place of India in the pension asset as a
percentage of GDP pyramid shows that India has to go further in order to professionalize the
pension schemes.
13
Table 1: Pension Structure in OECD Countries and in India
First Tier Second Tier
Universal Coverage, Redistributive Mandatory, Insurance
Public Public Private
Countries Resource
Tested
Basic Minimum Type Type
Australia DC
Austria DB
Belgium DB
Canada DB
Czech Republic DB
Denmark DC
Finland DB
France DB + Points
Germany Points
Greece DB
Hungary DB DC
Iceland DB
Ireland
Italy NDC
Japan DB
Korea DB
Luxembourg DB
Mexico DC
Netherlands DB
New Zealand
Norway Points DC
Poland NDC DC
Portugal DB
Slovak Republic Points DC
Spain DB
Sweden NDC DB+DC
Switzerland DB DB
Turkey DB
United Kingdom DB
USA DB
India DB+DC
Sources: OECD Countries, Pensions at a Glance, 2007.
India, Pensions at a Glance: Asia/Pacific Edition, OECD, 2009.

14
Table 2: Gross Replacement Rates by Individual Earnings Level
Men Women
Individual Gross Earnings*
(% average)
0.5(L) 1(A) 1.5(H) 0.5(L) 1(A) 1.5(H)
Country
Australia 67.0 41.6 33.1 67.0 41.6 33.1
Austria 80.1 80.1 76.4 80.1 80.1 76.4
Belgium 58.1 42.0 32.5 58.1 42.0 32.5
Canada 76.5 44.5 29.7 76.5 44.5 29.7
Czech Republic 79.2 49.7 36.4 79.2 49.7 36.4
Denmark 124 80.3 67.5 124 80.3 67.5
Finland 66.5 56.2 56.2 66.5 56.2 56.2
France 61.7 53.3 48.5 61.7 53.3 48.5
Germany 43.0 43.0 42.6 43.0 43.0 42.6
Greece 95.7 95.7 95.7 95.7 95.7 95.7
Hungary 76.9 76.9 76.9 76.9 76.9 76.9
Iceland 108.3 90.2 87.5 108.3 90.2 87.5
Ireland 68.4 34.2 22.8 68.4 34.2 22.8
Italy 67.9 67.9 67.9 52.8 52.8 52.8
Japan 47.1 33.9 29.4 47.1 33.9 29.4
Korea 64.1 42.1 33.6 64.1 42.1 33.6
Luxembourg 99.4 88.1 84.3 99.4 88.1 84.3
Mexico 55.3 36.1 34.5 55.3 29.9 28.6
Netherlands 93.4 88.3 86.6 93.4 88.3 86.6
New Zealand 77.5 38.7 25.8 77.5 38.7 25.8
Norway 66.2 59.3 49.8 66.2 59.3 49.8
Poland 61.2 61.2 61.2 49 44.5 44.5
Portugal 63.0 53.9 53.1 63.0 53.9 53.1
Slovak Republic 56.4 56.4 56.4 56.4 56.4 56.4
Spain 81.2 81.2 81.2 81.2 81.2 81.2
Sweden 76.6 61.5 75.6 76.6 61.5 75.6
Switzerland 62.5 58.3 40.5 62.8 59 41
Turkey 86.9 86.9 86.9 86.9 86.9 86.9
United Kingdom 51.0 30.8 21.3 51.0 30.8 21.3
United States 50.3 38.7 34.1 50.3 38.7 34.1
India 67.1 40.4 31.3 65.6 39.0 30.0
OECD 72.2 59.03 54.26 71.3 57.79 53.02
∗ L stands for Low Income Group, A stands for Average Income Group and H stands for High Income Group.
All values are in percentage.
Sources: Pensions at a Glance, 2009; Pensions at a Glance, 2009, Asia/Pacific Edition.

15
Table 3: Net Replacement Rates by Individual Earnings Level Men
Women
Individual Net Earnings*
(% average)
0.5(L) 1(A) 1.5(H) 0.5(L) 1(A) 1.5(H)
Country
Australia 80.2 53.1 41.8 80.2 53.1 41.8
Austria 90.5 90.3 86.3 90.5 90.3 86.3
Belgium 78.7 63.7 51.7 78.7 63.7 51.7
Canada 89.1 57.9 40.0 89.1 57.9 40.0
Czech Republic 95.3 64.1 49.4 95.3 64.1 49.4
Denmark 137.0 91.3 82.7 137.0 91.3 82.7
Finland 73.2 62.4 63.8 73.2 62.4 63.8
France 76.2 65.7 60.2 76.2 65.7 60.2
Germany 59.2 61.3 60.3 59.2 61.3 60.3
Greece 113.6 110.8 106.7 113.6 110.8 106.7
Hungary 94.3 105.5 99.2 94.3 105.5 99.2
Iceland 110.1 95.1 92.1 110.1 95.1 92.1
Ireland 68.4 40.1 30.3 68.4 40.1 30.3
Italy 74.8 74.8 77.1 76.6 58.1 59.9
Japan 51.4 38.7 33.9 51.4 38.7 33.9
Korea 68.8 46.6 38.7 68.8 46.6 38.7
Luxembourg 107.1 96.5 93.5 107.1 96.5 93.5
Mexico 56.0 38.0 39.6 56 31.5 32.8
Netherlands 105.0 103.2 98.6 105.0 103.2 98.6
New Zealand 79.3 41.1 29.0 79.3 41.1 29.0
Norway 76.7 69.3 60.6 76.7 69.3 60.6
Poland 74.4 74.9 75.0 60.6 55.2 55
Portugal 73.2 69.6 72.0 73.2 69.6 72.0
Slovak Republic 66.3 72.7 74.9 66.3 72.7 74.9
Spain 82.1 84.7 85.3 82.1 84.7 85.3
Sweden 79.3 64.1 81.2 79.3 64.1 81.2
Switzerland 68.8 64.5 44.3 69.1 65.3 44.9
Turkey 121.2 124.7 127.1 121.2 124.7 127.1
United Kingdom 63.8 40.9 29.2 63.8 40.9 29.2
United States 57.9 44.8 39.5 57.9 44.8 39.5
India 76.3 46.4 38.8 74.5 44.4 35.8
OECD 82.4 70.3 65.5 82.0 68.9 64.0
∗ L stands for Low Income Group, A stands for Average Income Group and H stands for High Income Group.
All values are in percentage.
Sources: Pensions at a Glance, 2009; Pensions at a Glance, Asia/Pacific Edition, 2009.

16
Table 4: Gross Pension Wealth
Men
Women
Multiple of Average
Gross Earnings*
0.5(L) 1(A) 1.5(H) 0.5(L) 1(A) 1.5(H)
Country
Australia 11.7 6.9 5.3 13.7 8.1 6.2
Austria 12.2 11.6 10.5 14.2 13.5 12.1
Belgium 8.9 6.4 5.0 10.3 7.5 5.8
Canada 11.7 6.8 4.5 13.6 7.9 5.3
Czech Republic 12.1 7.6 5.6 14.3 9.0 6.6
Denmark 18.5 11.6 9.6 21.3 13.3 11.0
Finland 10.4 8.8 8.8 12.3 10.5 10.5
France 10.8 9.3 8.5 12.5 10.8 9.8
Germany 7.2 7.2 7.1 8.5 8.5 8.4
Greece 14.3 14.3 14.3 16.6 16.6 16.6
Hungary 12.4 12.4 12.4 15.4 15.4 15.4
Iceland 17.0 13.7 13.2 19.1 15.4 14.8
Ireland 12.1 6.1 4.0 14.5 7.2 4.8
Italy 10.0 10.0 9.9 10.7 10.7 10.7
Japan 7.8 5.6 4.9 8.8 6.3 5.5
Korea 8.9 5.9 4.7 10.7 7.0 5.6
Luxembourg 21.7 19.2 18.4 26.5 23.5 22.5
Mexico 7.3 4.8 4.6 8.9 4.8 4.6
Netherlands 17.2 16.3 16.0 20.1 19.1 18.7
New Zealand 14.3 7.2 4.8 16.8 8.4 5.6
Norway 11.4 10.2 8.5 13.4 11.9 9.9
Poland 8.4 8.4 8.4 9.5 8.6 8.6
Portugal 9.2 8.1 8.0 10.7 9.5 9.3
Slovak Republic 8.8 8.8 8.8 10.6 10.6 10.6
Spain 12.2 12.2 12.2 14.3 14.3 14.3
Sweden 12.2 9.9 12.0 14.0 11.3 13.7
Switzerland 10.7 9.8 6.8 13.1 12.0 8.3
Turkey 11.0 11.0 11.0 12.9 12.9 12.9
United Kingdom 6.8 4.1 2.9 7.8 4.7 3.3
United States 7.2 5.5 4.9 8.3 6.4 5.7
India 10.2 6.2 4.8 10.9 6.6 5.1
OECD 11.5 9.3 8.5 13.4 10.9 9.9
∗ L stands for Low Income Group, A stands for Average Income Group and H stands for High Income Group.
Sources: Pensions at a Glance, 2009; Pensions at a Glance, Asia/Pacific Edition, 2009.

17
Table 5: Net Pension Wealth
Men
Women
Multiple of Average
Net Earnings*
0.5(L) 1(A) 1.5(H) 0.5(L) 1(A) 1.5(H)
Country
Australia 11.7 6.7 4.8 13.7 7.8 5.5
Austria 10.9 8.8 7.4 12.6 10.1 8.5
Belgium 8.9 5.7 4.1 10.3 6.6 4.8
Canada 11.7 6.7 4.5 13.6 7.8 5.2
Czech Republic 12.1 7.6 5.6 14.3 9 6.6
Denmark 12.7 7.8 6.1 14.6 8.9 7
Finland 9 6.6 6.2 10.6 7.9 7.3
France 10.2 8.2 7.1 11.7 9.4 8.2
Germany 6.6 5.8 5.3 7.8 6.8 6.3
Greece 14.3 12.3 11.1 16.5 14.3 12.9
Hungary 12.4 11 9.5 15.3 13.6 11.7
Iceland 13.9 10.2 9.3 15.6 11.4 10.5
Ireland 12.1 6.1 4 14.5 7.2 4.8
Italy 7.6 7.6 7.5 10.7 8.1 8.1
Japan 7.1 5.2 4.4 7.9 5.8 4.9
Korea 8.9 5.8 4.6 10.6 6.9 5.5
Luxembourg 19.2 15.2 13.3 23.5 18.5 16.3
Mexico 7.3 4.8 4.6 8.9 4.8 4.6
Netherlands 14.2 12.1 11 16.6 14.2 12.8
New Zealand 11.8 5.9 3.9 13.9 6.9 4.6
Norway 10.3 8.4 6.8 12.1 9.9 7.9
Poland 7.2 7 6.9 8.3 7.2 7.1
Portugal 9.2 8.1 7.8 10.7 9.5 9.1
Slovak Republic 8.8 8.8 8.8 10.6 10.6 10.6
Spain 10.9 10.1 9.7 12.8 11.8 11.3
Sweden 9.3 7.1 8 10.6 8.1 9.1
Switzerland 10.4 7.9 5.5 12.7 9.6 6.7
Turkey 11 11 11 12.9 12.9 12.9
United Kingdom 6.8 4 2.8 7.8 4.6 3.2
United States 7.2 5.5 4.9 8.3 6.4 5.7
India 10.2 6.2 4.8 10.9 6.6 5.1
OECD 10.5 7.9 6.9 12.3 9.2 8.0
∗ L stands for Low Income Group, A stands for Average Income Group and H stands for High Income Group.
Sources: Pensions at a Glance, 2009; Pensions at a Glance, Asia/Pacific Edition, 2009.

18
Endnotes i See, the Life-Cycle Hypothesis (LCH) of consumption behavior in Dornbusch et al. (2005), Ch.13. ii The potential support ratio is the number of people in the age group of 15-64 per one older person aged 65 and
above. This ratio describes the burden placed on the working population by the non-working old population. iii Among the developed countries, PSR of the Netherlands is still high even though its life expectancy at birth and
life expectancy at 60 is significantly high. iv See, for details World Population Prospects: The 2008 Revision and AARP International, 2008. v See, Barro (1974), Deaton (1991), Carroll (1997) and Banks et al. (1998), among many others.
vi See, Feldstien (1977). vii Weil (ibid.) while examining both micro and macro level data on young households that have either received or
expected bequests, confirms that bequests are an important factor in determining the magnitude of the savings by
young.
viii The World Bank Three Pillar approach advocates that the first pillar pension system should have non
contributory, publicly managed and tax financed social insurance (popularly known as basic pension). The second
pillar pension system should be contributory and privately managed (popularly known as mandatory pension).
Finally, the third pillar pension system should be of voluntary saving nature.
ix A more segregated classification can be found in Asher (2006).
x The pension schemes prior to this were Defined Benefit (DB) system indexed with inflation.
xi Resource-tested programs grant a higher benefit to poorer pensioners and lower benefit to the better offs. The
benefit depends upon income from other resources and acquired as well as inherited assets. Basic pension schemes
are independent of income and the amount is paid either at a flat rate or it depends on the number of years of
contribution. Minimum pensions provide higher benefit on the income of particular pension entitlement.
xii In DB, the pensioner’s amount depends on the number of contributions made throughout the working life. In DC,
contributions flow into an individual account and the accumulation of contributions and investment returns is
usually converted into a pension income stream at retirement. xiii
Notional Accounts (or Notional Defined Contribution) are the schemes which record each worker’s contributions
in an individual account and apply a rate of return to the account. The accounts are ‘notional’ because in that both
the incoming contributions and the interest accrued to them exist only on the books of the managing institution. See,
OECD Pensions at a Glance, 2007 for details. xiv Workers earn their Pension Points based on their individual earnings for each year of contributions.
xv Gross Replacement Rate is the ratio of pension over final earnings before retirement. The indicator shows the
pension benefit as a share of individuals’ lifetime average earnings. The Net Replacement Rate is defined as the
individuals’ net pension entitlement divided by net pre-retirement earnings, taking account of personal income taxes
and social security contributions paid by workers and pensioners. xvi The personal tax system plays an important role in old-age support. Pensioners often do not pay social security
contributions and, as personal income taxes are progressive and pension entitlements are usually lower than earnings
before retirement, the average tax rate on pension income is typically less than that on earned income. Moreover,
most of the times income tax systems give preferential treatment either to the pensioners by giving additional
allowances or credits to older people. Therefore, net replacement rates are usually higher than gross replacement
rates. See, for details Pensions at a Glance, Special Edition: Asia-Pacific, 2009, p.32.
19
REFERENCES
Aaron, H. (1967), ‘Social Security: International Comparisons, in Studies in the Economics of
Income Maintenance’, Otto Eckstein (ed.), The Brookings Institution (Washington), 13-48.
Ando, A. and F. Modigliani (1963), ‘The Life Cycle Hypothesis of Saving: Aggregate
Implications and Tests’, The American Economic Review, Vol. 53 (1), 55-84.
Asher, M. G. (2006), ‘Pension Issue and Challenges Facing India’, Economic and Political
Weekly, Vol. 41 (45), 4638-4641.
Ashraf, N., Gons, N., Karlan, D. S. and W. Yin (2003), ‘A Review of Commitment Savings
Products in Developing Countries’, http://people.hbs.edu/nashraf/commitmentreview.pdf
Banks, J., Blundell, R., and S. Tanner (1998), ‘Is there a retirement-savings puzzle?’, American
Economic Review, Vol. 88 (4), 769–88.
Barro, R. J. (1974), ‘Are government bonds net wealth?’, Journal of Political Economy, Vol. 82
(6), 1095–1117.
Cagan, P. (1965), ‘The Effect of Pension Plans on Aggregate Savings: Evidence from a Sample
Survey’, Occasional Paper No. 95, NBER.
Deaton, A. (1991), ‘Saving and Liquidity Constraints’, Econometrica, Vol. 59 (5), 1221–48.
Denton, F. T. and B. G. Spencer (1981), ‘A Macro-Economic Analysis of the Effects of a Public
Pension Plan’, The Canadian Journal of Economics, Vol. 14 (4), 609-634.
Dornbusch R., Fisher S. and R. Startz (2005), Macroeconomics, New Delhi. Tata Mc-GrawHill
Publishing Co. Ltd.
Eisner, R. (1983), ‘Social Security, Saving and Macroeconomics’, Journal of Macroeconomics,
Vol. 5 (1), 1-19.
Feldstein, M. (1974), ‘Social Security, Induced Retirement, and Aggregate Capital
Accumulation’, The Journal of Political Economy, Vol. 82 (5), 905-926.
Feldstein, M. (1977), ‘Social Security and Private Savings: International Evidence in an
Extended Life-Cycle Model’, in The Economics of Public Services, Martin Feldstein and Robert
Inman (ed.), London, 174 –205.
Jha, R. K. (2009), ‘Social Security System in India: A Comparative Analysis in The International
Context’, unpublished M.Phil Thesis, Indian Institute of Technology Bombay, Mumbai.
Kopits, G. and P. Gotur (1980), ‘The Influence of Social Security on Household Savings: A
Cross-Country Investigation’, IMF Staff Papers, Vol. 27 (1), 161-190.
Laibson, D. (1997), ‘Golden Eggs and Hyperbolic Discounting’, Quarterly Journal of
Economics, Vol. 112 (2), 443-77.

20
Harris, C. and D. Laibson (2001), ‘Dynamic Choices of Hyperbolic Consumers’, Econometrica,
Vol. 69 (4), 935–57.
Leimer, D. R. and S. D. Lesnoy (1982), ‘Social Security and Private Saving: New Time-Series
Evidence’, Journal of Political Economy, Vol. 90 (3), 606-29.
Modigliani, F. and R. H. Brumberg (1954), ‘Utility analysis and the consumption function: an
interpretation of cross-section data’, in Kenneth K. Kurihara (ed.), Post-Keynesian Economics,
Rutgers University Press. New Brunswick, NJ.
Poirson, H. K. (2007), ‘Financial Market Implications of India's Pension Reform’, IMF Working
Paper No. 85, 1-21.
Vaidyanathan, R. (2006), ‘Declining Joint Families: Looming Crisis in Social Security’, The
Icfai Journal of Risk & Insurance, Vol. 3 (4), 7-28.
Weil, D. N. (1994), ‘The Saving of the Elderly in Micro and Macro Data’, Quarterly Journal of
Economics, Vol. 109 (1), 55-81.
Reports and Publications
Averting the Old Age Crisis, A World Bank Policy Research Report, 1994.
Employees ‘Pension Scheme, 1995; Ministry of Labour, Government of India
Employees’ Provident Fund Organization (EPFO): Annual Report 2006-07 Employees Provident
Fund Organisation, Ministry of Labour, Government of India.
Investment regulations for the New Pension System for the informal sector, PFRDA, 2009.
OECD, Pensions at a Glance, 2007 & 2009.
Pension Fund Regulatory and Development Authority, Press Release, 2009.
Report of High Level Expert Group on New Pension System, Government of India, 2002.
Senior Citizens Saving Scheme, Ministry of Finance, Gazette of India, 2004.