SOCIAL SECURITY · PDF fileSOCIAL SECURITY MEMORANDUM Date: ... and E1) would result in the...
31
SOCIAL SECURITY MEMORANDUM Date: August 10, 2005 Refer To: TCC To: Stephen C. Goss, Chief Actuary From: Chris Chaplain, Actuary Alice H. Wade, Deputy Chief Actuary Subject: Estimated OASDI Long-Range Financial Effects of Several Provisions Requested by the Social Security Advisory Board--INFORMATION This memorandum provides long-range estimates of the effects on trust fund solvency and operations of several provisions that would change the current-law OASDI (combined Old-Age and Survivors and Disability Insurance) program. The Advisory Board has requested estimates for these provisions. Estimates for the provisions in this memorandum are based on the intermediate assumptions of the 2005 Trustees Report. This memorandum contains updated estimates of the provisions in our earlier February 7, 2005 memorandum (then based on the intermediate assumptions of the 2004 Trustees Report), in addition to estimates of several other provisions requested by the Advisory Board. Each of the provisions would increase (improve) the long-range OASDI actuarial balance. Most would reduce the size of the annual deficits at the end of the long-range period, thus contributing toward attaining sustainable solvency. The provisions are grouped into the following categories: • Reducing the cost-of-living adjustment, • Revising the benefit formula, • Changing the normal retirement age, • Increasing the payroll tax rate or the taxation of Social Security benefits, • Revising the benefit and contribution base, • Extending OASDI program coverage, and • Changing the investment requirements for the combined Old-Age and Survivors Insurance (OASI) and Disability Insurance (DI) Trust Funds. Table I contains a brief description of each of the provisions and the associated estimated effect on the long-range OASDI actuarial balance, as well as on the 75 th year annual balance. For each of the proposed provisions in table I, a separate detailed table is provided (tables A1 through G3). These separate tables are numbered corresponding to the provision number in table I. It is very important to note that effects are shown for each provision separately, that is, as if each provision were enacted alone. Combining several provisions involves complex interactions among provisions which can make the combined effect quite different from simply summing the individual effects.
Transcript of SOCIAL SECURITY · PDF fileSOCIAL SECURITY MEMORANDUM Date: ... and E1) would result in the...

SOCIAL SECURITY
MEMORANDUM
Date: August 10, 2005 Refer To: TCC
To: Stephen C. Goss, Chief Actuary
From: Chris Chaplain, Actuary
Alice H. Wade, Deputy Chief Actuary
Subject: Estimated OASDI Long-Range Financial Effects of Several Provisions Requested by the Social Security Advisory Board--INFORMATION This memorandum provides long-range estimates of the effects on trust fund solvency and operations of several provisions that would change the current-law OASDI (combined Old-Age and Survivors and Disability Insurance) program. The Advisory Board has requested estimates for these provisions. Estimates for the provisions in this memorandum are based on the intermediate assumptions of the 2005 Trustees Report. This memorandum contains updated estimates of the provisions in our earlier February 7, 2005 memorandum (then based on the intermediate assumptions of the 2004 Trustees Report), in addition to estimates of several other provisions requested by the Advisory Board. Each of the provisions would increase (improve) the long-range OASDI actuarial balance. Most would reduce the size of the annual deficits at the end of the long-range period, thus contributing toward attaining sustainable solvency. The provisions are grouped into the following categories:
• Reducing the cost-of-living adjustment, • Revising the benefit formula, • Changing the normal retirement age, • Increasing the payroll tax rate or the taxation of Social Security benefits, • Revising the benefit and contribution base, • Extending OASDI program coverage, and • Changing the investment requirements for the combined Old-Age and Survivors
Insurance (OASI) and Disability Insurance (DI) Trust Funds. Table I contains a brief description of each of the provisions and the associated estimated effect on the long-range OASDI actuarial balance, as well as on the 75th year annual balance. For each of the proposed provisions in table I, a separate detailed table is provided (tables A1 through G3). These separate tables are numbered corresponding to the provision number in table I. It is very important to note that effects are shown for each provision separately, that is, as if each provision were enacted alone. Combining several provisions involves complex interactions among provisions which can make the combined effect quite different from simply summing the individual effects.

2
The numbered tables for individual provisions include annual and 75-year-summarized cost rates, income rates, and balances for the OASDI program assuming enactment of each of the provisions. In addition, the numbered tables also provide the projected trust fund ratio (TFR) for each year until the combined OASI and DI Trust Funds are projected to be exhausted. The TFR is defined as the amount of assets in the combined OASI and DI Trust Funds as of the beginning of the year, expressed as a percentage of the cost of the OASDI program during the year. Under present law, the combined OASI and DI Trust Funds are projected to be exhausted in 2041. Under each proposed provision, the year of exhaustion would be extended beyond the projected exhaustion year of 2041 under current law. Four of the proposed provisions (provisions B6, D1, D2, and E1) would result in the combined OASI and DI Trust Funds remaining solvent through the end of the 75-year period. However, as the corresponding numbered tables show, sustainable solvency would be achieved under only one of these proposed provisions (provision B6, which reduces all PIA formula factors for real wage growth). Sustainable solvency is indicated if the TFR is projected to be:
1. Positive throughout the 75-year projection period, and 2. Either stable or rising at the end of the 75-year period.
Tables G1, G2, and G3 provide financial estimates for a provision to invest 40 percent of the combined OASI and DI Trust Funds in equities. Estimates between the tables differ because different real rates of return on equities are assumed. Estimates in table G1 assume an “expected” long-term average of 6.5-percent real rate of return on equities (our standard assumption for the future). Table G2 provides a sensitivity illustration by assuming an “expected” long-term average 5.5-percent real rate of return for equities. The annual income rates, cost rates, and balances are identical between the two tables because non-interest income and projected cost are the same. However, the amount of interest earned by the combined OASI and DI Trust Funds differs between the two tables, resulting in differing TFRs and a later projected exhaustion year in table G1. Table G3 illustrates the effect of investing 40 percent of the Trust Funds in equities assuming that equities in fact have a yield in the future no higher than the expected yield on Treasury bonds. This is equivalent to assuming a “risk-adjusted” yield. This estimate shows no change from the present-law estimates under the intermediate assumptions of the 2005 Trustees Report as a result of investing a portion of Trust Fund assets in equities.
Chris Chaplain
Alice H. Wade
Attachments: 27

Table I—Estimated Long-Range OASDI Financial Effects of Several Individual Provisions1 Using the
Intermediate Assumptions of the 2005 Trustees Report
Number Provision
Estimated Change in Long-Range OASDI Actuarial Balance2
(as a percent of payroll)
Estimated Change inAnnual Balance in
75th year3 (as a percent of payroll)
A. Reducing the cost-of-living adjustment
A1 Reduce the COLA for OASDI benefits by 0.5 percentage points beginning December 2006 ................................................................ 0.76 1.20
A2
Reduce the COLA for OASDI benefits by 1 percentage point beginning December 2006 ................................................................ 1.49 2.30
A3
Use the “superlative” (or “chained”) CPI for COLAs beginning December 2006, estimated to reduce the COLA by 0.22 percentage point................................................................................ 0.34 0.54
B. Revising the benefit formula
B1 Increase the number of years used to calculate benefits for retirees and survivors (but not for disabled workers) from 35 to 38 (phased in 2006-2010); i.e., 36 for 2006-07, 37 for 2008-09, and 38 for 2010 and later .................................................................. 0.28 0.43
B2
Increase the number of years used to calculate benefits for retirees and survivors (but not for disabled workers) from 35 to 40 (phased in 2006-2014); i.e., 36 for 2006-07, 37 for 2008-09, 38 for 2010-11, 39 for 2012-13, and 40 for 2014 and later .............. 0.46 0.73
B3
For each year from 2006-2036, multiply the 32 and 15 percent benefit formula factors by 0.987, reducing the factors to 21 and 10 percent respectively, for new eligibles in 2036 and later............. 1.60 3.29
B4
Reduce benefits across the board by 3 percent for those newly eligible for benefits in 2006 and later ............................................... 0.37 0.54
B5
Reduce benefits across the board by 5 percent for those newly eligible for benefits in 2006 and later ............................................... 0.61 0.90
B6
Starting for those newly eligible for OASDI benefits in 2012 and later, reduce the PIA formula factors by real wage growth (i.e., “CPI-index” the formula factors) ..................................................... 2.38 7.85
B7
Create a new bend point at the level of the career-average earnings at the 30th percentile of those becoming newly eligible for OASDI benefits in 2012 and later (estimated to be 28.6% of the way between the present law first and second bend points). Maintain the lower two formula factors of 90% and 32%. Reduce the upper two formula factors (32% and 15%) such that the maximum worker benefit grows from one generation to the next by inflation, rather than by the growth in average wages ......... 1.43 4.62

Table I—Estimated Long-Range OASDI Financial Effects of Several Individual Provisions1 Using the Intermediate Assumptions of the 2005 Trustees Report
Number Provision
Estimated Change in Long-Range OASDI Actuarial Balance2
(as a percent of payroll)
Estimated Change inAnnual Balance in
75th year3 (as a percent of payroll)
B8
Create a new bend point at the level of the career-average earnings at the 40th percentile of those becoming newly eligible for OASDI benefits in 2012 and later (estimated to be 44.7% of the way between the present law first and second bend points). Maintain the lower two formula factors of 90% and 32%. Reduce the upper two formula factors (32% and 15%) such that the maximum worker benefit grows from one generation to the next by inflation, rather than by the growth in average wages ......... 1.21 3.89
B9
Create a new bend point at the level of the career-average earnings at the 50th percentile of those becoming newly eligible for OASDI benefits in 2012 and later (estimated to be 61.5% of the way between the present law first and second bend points). Maintain the lower two formula factors of 90% and 32%. Reduce the upper two formula factors (32% and 15%) such that the maximum worker benefit grows from one generation to the next by inflation, rather than by the growth in average wages ......... 0.97 2.92
B10
Create a new bend point at the level of the career-average earnings at the 60th percentile of those becoming newly eligible for OASDI benefits in 2012 and later (estimated to be 78.8% of the way between the present law first and second bend points). Maintain the lower two formula factors of 90% and 32%. Reduce the upper two formula factors (32% and 15%) such that the maximum worker benefit grows from one generation to the next by inflation, rather than by the growth in average wages ......... 0.68 1.82
C. Changing the normal retirement age
C1 Eliminate the hiatus in the normal retirement age (speed up the increase to age 67) ............................................................................ 0.14 0.00
C2
Eliminate the hiatus in the normal retirement age (speed up the increase to age 67) and then index the normal retirement age (by 1 month every 2 years) until the NRA reaches age 68 ............... 0.52 0.76
C3
Eliminate the hiatus in the normal retirement age (speed up the increase to age 67) and then index the normal retirement age (by 1 month every 2 years) until the NRA reaches age 70 ............... 0.69 1.61
D. Increasing the payroll tax rate or taxation of Social Security benefits
D1 Raise payroll tax rates (for employees and employers combined) by 2.0 percentage points in 2006 and later........................................ 1.96 2.00
D2
Raise payroll tax rates (for employees and employers combined) by 2.1 percentage points in 2020-2049 and by an additional 2.1 percentage points in 2050 ................................................................. 1.98 4.21

Table I—Estimated Long-Range OASDI Financial Effects of Several Individual Provisions1 Using the Intermediate Assumptions of the 2005 Trustees Report
Number Provision
Estimated Change in Long-Range OASDI Actuarial Balance2
(as a percent of payroll)
Estimated Change inAnnual Balance in
75th year3 (as a percent of payroll)
D3
Tax Social Security benefits in a manner similar to private pension income beginning in 2006. Phase out the lower-income thresholds during 2006-2015. ........................................................... 0.33 0.27
E. Revising the benefit and contribution base
E1 Make all earnings subject to the payroll tax (but retain the cap for benefit calculations) beginning in 2006 ...................................... 2.21 2.89
E2
Make all earnings subject to the payroll tax and credit them for benefit purposes beginning in 2006 .................................................. 1.82 2.06
E3
Make 90% of the earnings subject to the payroll tax and credit them for benefit purposes (phased in 2006-2015)4 ........................... 0.83 0.96
F. Extending program coverage
F1 Cover newly hired State and local government employees beginning in 2006 ............................................................................. 0.22 0.01
G. Changing the investment requirements for the combined OASI and DI Trust Funds
G1 Invest 40% of the Trust Funds in equities (phased in 2006-2020), assuming a 6.5-percent real rate of return on equities (standard assumption)....................................................................................... 0.88 0.00
G2
Invest 40% of the Trust Funds in equities (phased in 2006-2020), assuming a 5.5-percent real rate of return on equities ...................... 0.64 0.00
G3
Invest 40% of the Trust Funds in equities (phased in 2006-2020), assuming an ultimate 3 percent real rate of return on equities, the same as the expected yield on Treasury bonds ................................. 0.00 0.00
1All estimates are for individual provisions, as if each were enacted alone. The combined effect of several provisions together would involve complex interactions that can result in quite different effects from those implied by simply adding the effect of the individual provisions.
2Under the intermediate assumptions of the 2005 Trustees Report, the 75-year actuarial balance is -1.92 percent of taxable payroll.
3Under the intermediate assumptions of the 2005 Trustees Report, the annual balance in the 75th year of the projection period is -5.70 percent of the taxable payroll for that year.
4This estimate reflects a revised calculation of the taxable ratio (i.e., the percentage of earnings subject to payroll tax). Refer to forthcoming OCACT memorandum for a full explanation.
Social Security Administration Office of the Chief Actuary August xx, 2005

Table A1 Financial Estimates for the OASDI Trust Fund Program
Year Cost RateIncome
RateAnnual
Balance
2005 11.13 12.72 1.59 3202006 11.00 12.73 1.73 3372007 10.90 12.74 1.84 3572008 10.89 12.78 1.89 3742009 10.98 12.77 1.78 3892010 11.06 12.79 1.72 4032011 11.19 12.83 1.64 4162012 11.39 12.86 1.47 4262013 11.62 12.89 1.27 4342014 11.85 12.90 1.05 4402015 12.09 12.92 0.83 4452016 12.35 12.94 0.59 4472017 12.62 12.96 0.34 4472018 12.89 12.97 0.08 4462019 13.16 12.99 -0.17 4432020 13.45 13.01 -0.44 4392021 13.73 13.02 -0.70 4342022 14.00 13.04 -0.96 4272023 14.27 13.06 -1.21 4192024 14.53 13.07 -1.46 4102025 14.79 13.09 -1.71 3992026 15.05 13.10 -1.95 3882027 15.28 13.12 -2.16 3752028 15.49 13.13 -2.36 3622029 15.67 13.14 -2.53 3492030 15.84 13.15 -2.68 3352031 15.99 13.17 -2.83 3212032 16.13 13.18 -2.95 3062033 16.23 13.18 -3.04 2912034 16.30 13.19 -3.11 2752035 16.36 13.19 -3.17 2602036 16.41 13.20 -3.21 2442037 16.43 13.20 -3.23 2282038 16.45 13.21 -3.24 2122039 16.45 13.21 -3.24 1962040 16.44 13.21 -3.23 1792041 16.44 13.21 -3.23 1632042 16.44 13.21 -3.23 1462043 16.44 13.21 -3.23 1292044 16.44 13.21 -3.23 1112045 16.45 13.21 -3.23 942046 16.46 13.22 -3.24 762047 16.47 13.22 -3.25 572048 16.48 13.22 -3.26 392049 16.50 13.22 -3.28 192050 16.53 13.22 -3.30 02051 16.56 13.23 -3.33 ----2052 16.59 13.23 -3.36 ----2053 16.63 13.23 -3.40 ----2054 16.67 13.23 -3.43 ----2055 16.71 13.24 -3.47 ----2056 16.76 13.24 -3.52 ----2057 16.81 13.24 -3.56 ----2058 16.86 13.25 -3.61 ----2059 16.90 13.25 -3.65 ----2060 16.95 13.25 -3.70 ----2061 17.00 13.26 -3.74 ----2062 17.05 13.26 -3.79 ----2063 17.10 13.26 -3.84 ----2064 17.16 13.27 -3.89 ----2065 17.21 13.27 -3.94 ----2066 17.26 13.27 -3.99 ----2067 17.32 13.28 -4.04 ----2068 17.37 13.28 -4.09 ----2069 17.41 13.28 -4.13 ----2070 17.45 13.29 -4.17 ----2071 17.49 13.29 -4.21 ----2072 17.54 13.29 -4.24 ----2073 17.57 13.29 -4.28 ----2074 17.61 13.30 -4.31 ----2075 17.65 13.30 -4.35 ----2076 17.69 13.30 -4.39 ----2077 17.73 13.30 -4.42 ----2078 17.77 13.31 -4.46 ----2079 17.81 13.31 -4.50 ----2080 17.85 13.31 -4.54 ----
Summarized Rates: OASDI
2005 Cost RateIncome
RateActuarial Balance
-2079 14.99% 13.83% -1.16% 0.76%Office of the Chief Actuary
Based on Intermediate Assumptions of the 2005 Trustees Report. Social Security AdministrationAugust 8, 2005
Change in Actuarial Balance
Reduce the COLA for OASDI Benefits by 0.5 percentage points beginning December 2006
Expressed as a percentage of taxable payrollTrust Fund
Ratio 1-1-year

Table A2 Financial Estimates for the OASDI Trust Fund Program
Year Cost RateIncome
RateAnnual
Balance
2005 11.13 12.72 1.59 3202006 11.00 12.73 1.73 3372007 10.85 12.74 1.89 3582008 10.73 12.78 2.05 3802009 10.77 12.76 1.98 3982010 10.81 12.78 1.96 4162011 10.90 12.82 1.92 4332012 11.07 12.85 1.78 4472013 11.25 12.87 1.62 4592014 11.46 12.89 1.43 4692015 11.66 12.90 1.24 4782016 11.89 12.92 1.03 4842017 12.13 12.93 0.81 4892018 12.37 12.95 0.58 4922019 12.61 12.96 0.35 4942020 12.86 12.98 0.12 4942021 13.11 13.00 -0.12 4932022 13.36 13.01 -0.35 4902023 13.60 13.02 -0.57 4872024 13.83 13.04 -0.80 4822025 14.07 13.05 -1.01 4762026 14.30 13.07 -1.23 4692027 14.50 13.08 -1.42 4622028 14.68 13.09 -1.59 4542029 14.84 13.10 -1.74 4462030 14.99 13.11 -1.88 4372031 15.12 13.12 -2.00 4282032 15.24 13.13 -2.10 4182033 15.32 13.14 -2.18 4092034 15.38 13.14 -2.23 4002035 15.42 13.15 -2.27 3912036 15.45 13.15 -2.30 3812037 15.47 13.15 -2.32 3722038 15.47 13.16 -2.32 3632039 15.46 13.16 -2.31 3542040 15.45 13.16 -2.30 3452041 15.45 13.16 -2.29 3362042 15.44 13.16 -2.28 3272043 15.44 13.16 -2.28 3172044 15.43 13.16 -2.27 3082045 15.44 13.16 -2.27 2982046 15.45 13.16 -2.28 2882047 15.46 13.17 -2.29 2782048 15.47 13.17 -2.30 2672049 15.48 13.17 -2.32 2572050 15.51 13.17 -2.34 2462051 15.53 13.17 -2.36 2342052 15.57 13.18 -2.39 2232053 15.60 13.18 -2.43 2112054 15.64 13.18 -2.46 1982055 15.68 13.18 -2.50 1862056 15.72 13.19 -2.54 1722057 15.77 13.19 -2.58 1592058 15.81 13.19 -2.62 1452059 15.86 13.20 -2.66 1302060 15.90 13.20 -2.70 1162061 15.94 13.20 -2.74 1002062 15.99 13.21 -2.78 852063 16.04 13.21 -2.83 692064 16.09 13.21 -2.87 522065 16.13 13.21 -2.92 352066 16.18 13.22 -2.96 182067 16.23 13.22 -3.01 02068 16.27 13.22 -3.05 ----2069 16.31 13.23 -3.08 ----2070 16.35 13.23 -3.12 ----2071 16.38 13.23 -3.15 ----2072 16.42 13.23 -3.18 ----2073 16.45 13.24 -3.21 ----2074 16.48 13.24 -3.24 ----2075 16.51 13.24 -3.28 ----2076 16.55 13.24 -3.31 ----2077 16.58 13.24 -3.34 ----2078 16.62 13.25 -3.37 ----2079 16.66 13.25 -3.41 ----2080 16.69 13.25 -3.44 ----
Summarized Rates: OASDI
2005 Cost RateIncome
RateActuarial Balance
-2079 14.23% 13.79% -0.44% 1.49%Office of the Chief Actuary
Based on Intermediate Assumptions of the 2005 Trustees Report. Social Security AdministrationAugust 8, 2005
Change in Actuarial Balance
Reduce the COLA for OASDI Benefits by 1 percentage point beginning December 2006
Expressed as a percentage of taxable payrollTrust Fund
Ratio 1-1-year

Table A3 Financial Estimates for the OASDI Trust Fund Program
Year Cost RateIncome
RateAnnual
Balance
2005 11.13 12.72 1.59 3202006 11.00 12.73 1.73 3372007 10.93 12.74 1.82 3562008 10.95 12.78 1.84 3722009 11.06 12.77 1.71 3852010 11.17 12.79 1.62 3982011 11.32 12.84 1.52 4092012 11.55 12.87 1.32 4172013 11.79 12.90 1.11 4232014 12.05 12.91 0.86 4272015 12.31 12.93 0.62 4292016 12.59 12.95 0.36 4292017 12.88 12.97 0.09 4272018 13.17 12.98 -0.19 4242019 13.46 13.00 -0.46 4192020 13.77 13.02 -0.75 4132021 14.07 13.04 -1.03 4052022 14.36 13.06 -1.30 3962023 14.65 13.07 -1.57 3852024 14.93 13.09 -1.84 3742025 15.21 13.11 -2.10 3612026 15.48 13.12 -2.36 3472027 15.73 13.14 -2.59 3322028 15.96 13.15 -2.80 3172029 16.15 13.17 -2.99 3012030 16.34 13.18 -3.16 2842031 16.51 13.19 -3.31 2672032 16.65 13.20 -3.45 2492033 16.76 13.21 -3.55 2312034 16.85 13.22 -3.63 2122035 16.92 13.22 -3.70 1932036 16.97 13.23 -3.74 1742037 17.01 13.23 -3.78 1552038 17.03 13.23 -3.79 1352039 17.03 13.24 -3.79 1152040 17.03 13.24 -3.80 952041 17.04 13.24 -3.80 742042 17.04 13.24 -3.80 532043 17.04 13.24 -3.80 322044 17.04 13.24 -3.80 112045 17.05 13.24 -3.81 ----2046 17.06 13.25 -3.82 ----2047 17.08 13.25 -3.83 ----2048 17.09 13.25 -3.84 ----2049 17.11 13.25 -3.86 ----2050 17.14 13.25 -3.88 ----2051 17.17 13.26 -3.91 ----2052 17.21 13.26 -3.95 ----2053 17.25 13.26 -3.98 ----2054 17.29 13.27 -4.02 ----2055 17.33 13.27 -4.06 ----2056 17.38 13.27 -4.11 ----2057 17.43 13.28 -4.16 ----2058 17.48 13.28 -4.20 ----2059 17.53 13.28 -4.25 ----2060 17.58 13.29 -4.30 ----2061 17.64 13.29 -4.34 ----2062 17.69 13.29 -4.40 ----2063 17.75 13.30 -4.45 ----2064 17.81 13.30 -4.51 ----2065 17.86 13.30 -4.56 ----2066 17.92 13.31 -4.61 ----2067 17.98 13.31 -4.66 ----2068 18.03 13.32 -4.71 ----2069 18.08 13.32 -4.76 ----2070 18.12 13.32 -4.80 ----2071 18.17 13.32 -4.84 ----2072 18.21 13.33 -4.88 ----2073 18.25 13.33 -4.92 ----2074 18.29 13.33 -4.96 ----2075 18.33 13.33 -5.00 ----2076 18.38 13.34 -5.04 ----2077 18.42 13.34 -5.08 ----2078 18.46 13.34 -5.12 ----2079 18.50 13.34 -5.16 ----2080 18.55 13.35 -5.20 ----
Summarized Rates: OASDI
2005 Cost RateIncome
RateActuarial Balance
-2079 15.43% 13.85% -1.58% 0.34%Office of the Chief Actuary
Based on Intermediate Assumptions of the 2005 Trustees Report. Social Security AdministrationAugust 8, 2005
Change in Actuarial Balance
Beginning December 2006, use the "superlative" (or "chained") CPI for COLAs, estimated to reduce the COLA by 0.22 percentage points
Expressed as a percentage of taxable payrollTrust Fund
Ratio 1-1-year

Table B1 Financial Estimates for the OASDI Trust Fund Program
Year Cost RateIncome
RateAnnual
Balance
2005 11.13 12.72 1.59 3202006 11.00 12.73 1.73 3382007 10.94 12.74 1.80 3552008 10.98 12.78 1.81 3712009 11.11 12.77 1.66 3832010 11.22 12.79 1.57 3962011 11.37 12.84 1.47 4062012 11.60 12.87 1.27 4142013 11.85 12.90 1.05 4192014 12.11 12.91 0.81 4232015 12.36 12.93 0.57 4252016 12.64 12.95 0.31 4252017 12.93 12.97 0.04 4232018 13.21 12.99 -0.23 4192019 13.51 13.00 -0.50 4142020 13.81 13.02 -0.79 4072021 14.11 13.04 -1.07 3992022 14.40 13.06 -1.34 3902023 14.69 13.07 -1.61 3792024 14.97 13.09 -1.88 3672025 15.25 13.11 -2.14 3542026 15.52 13.12 -2.40 3402027 15.78 13.14 -2.64 3252028 16.00 13.16 -2.85 3092029 16.20 13.17 -3.04 2932030 16.39 13.18 -3.21 2762031 16.56 13.19 -3.37 2592032 16.71 13.20 -3.50 2402033 16.82 13.21 -3.61 2222034 16.91 13.22 -3.69 2032035 16.98 13.22 -3.76 1842036 17.04 13.23 -3.81 1642037 17.08 13.23 -3.85 1442038 17.10 13.24 -3.86 1242039 17.11 13.24 -3.87 1042040 17.11 13.24 -3.87 832041 17.12 13.24 -3.87 622042 17.12 13.24 -3.88 402043 17.12 13.25 -3.88 192044 17.13 13.25 -3.88 ----2045 17.13 13.25 -3.89 ----2046 17.15 13.25 -3.90 ----2047 17.16 13.25 -3.91 ----2048 17.18 13.25 -3.92 ----2049 17.20 13.26 -3.94 ----2050 17.22 13.26 -3.96 ----2051 17.25 13.26 -3.99 ----2052 17.29 13.26 -4.03 ----2053 17.33 13.27 -4.06 ----2054 17.37 13.27 -4.10 ----2055 17.42 13.27 -4.14 ----2056 17.47 13.28 -4.19 ----2057 17.52 13.28 -4.24 ----2058 17.57 13.28 -4.29 ----2059 17.62 13.29 -4.33 ----2060 17.67 13.29 -4.38 ----2061 17.72 13.29 -4.43 ----2062 17.78 13.30 -4.48 ----2063 17.84 13.30 -4.54 ----2064 17.90 13.30 -4.59 ----2065 17.96 13.31 -4.65 ----2066 18.02 13.31 -4.70 ----2067 18.08 13.32 -4.76 ----2068 18.13 13.32 -4.81 ----2069 18.18 13.32 -4.86 ----2070 18.23 13.33 -4.90 ----2071 18.27 13.33 -4.94 ----2072 18.32 13.33 -4.99 ----2073 18.36 13.33 -5.03 ----2074 18.40 13.34 -5.07 ----2075 18.45 13.34 -5.11 ----2076 18.49 13.34 -5.15 ----2077 18.54 13.34 -5.19 ----2078 18.58 13.35 -5.23 ----2079 18.62 13.35 -5.27 ----2080 18.67 13.35 -5.32 ----
Summarized Rates: OASDI
2005 Cost RateIncome
RateActuarial Balance
-2079 15.50% 13.85% -1.64% 0.28%Office of the Chief Actuary
Based on Intermediate Assumptions of the 2005 Trustees Report. Social Security AdministrationAugust 8, 2005
Change inActuarialBalance
Increase the number of years used to calculate benefits for retirees and survivors (but not for disabled workers) from 35 to 38 phased in 2006-2010
Expressed as a percentage of taxable payrollTrust Fund
Ratio 1-1-year

Table B2 Financial Estimates for the OASDI Trust Fund Program
Year Cost RateIncome
RateAnnual
Balance
2005 11.13 12.72 1.59 3202006 11.00 12.73 1.73 3382007 10.94 12.74 1.80 3552008 10.98 12.78 1.81 3712009 11.11 12.77 1.66 3832010 11.22 12.79 1.57 3962011 11.37 12.84 1.47 4062012 11.60 12.87 1.27 4142013 11.84 12.90 1.06 4202014 12.09 12.91 0.82 4232015 12.34 12.93 0.59 4262016 12.60 12.95 0.35 4262017 12.87 12.97 0.09 4252018 13.14 12.98 -0.16 4222019 13.42 13.00 -0.42 4182020 13.71 13.02 -0.69 4122021 13.99 13.03 -0.95 4052022 14.27 13.05 -1.22 3972023 14.54 13.07 -1.47 3872024 14.81 13.08 -1.73 3772025 15.08 13.10 -1.98 3652026 15.34 13.12 -2.23 3522027 15.58 13.13 -2.45 3382028 15.80 13.14 -2.65 3232029 15.99 13.16 -2.83 3082030 16.17 13.17 -3.00 2922031 16.33 13.18 -3.15 2762032 16.47 13.19 -3.28 2592033 16.58 13.20 -3.38 2412034 16.66 13.21 -3.45 2242035 16.72 13.21 -3.51 2062036 16.78 13.22 -3.56 1882037 16.81 13.22 -3.59 1702038 16.83 13.22 -3.61 1512039 16.83 13.22 -3.61 1322040 16.83 13.23 -3.61 1132041 16.83 13.23 -3.61 932042 16.84 13.23 -3.61 742043 16.84 13.23 -3.61 542044 16.84 13.23 -3.61 332045 16.84 13.23 -3.61 132046 16.86 13.23 -3.62 ----2047 16.87 13.24 -3.63 ----2048 16.88 13.24 -3.65 ----2049 16.90 13.24 -3.66 ----2050 16.93 13.24 -3.68 ----2051 16.96 13.24 -3.71 ----2052 16.99 13.25 -3.75 ----2053 17.03 13.25 -3.78 ----2054 17.07 13.25 -3.82 ----2055 17.11 13.26 -3.86 ----2056 17.16 13.26 -3.90 ----2057 17.21 13.26 -3.95 ----2058 17.27 13.27 -4.00 ----2059 17.31 13.27 -4.04 ----2060 17.36 13.27 -4.09 ----2061 17.42 13.28 -4.14 ----2062 17.47 13.28 -4.19 ----2063 17.53 13.28 -4.25 ----2064 17.59 13.29 -4.30 ----2065 17.65 13.29 -4.35 ----2066 17.70 13.30 -4.41 ----2067 17.76 13.30 -4.46 ----2068 17.82 13.30 -4.51 ----2069 17.87 13.31 -4.56 ----2070 17.91 13.31 -4.60 ----2071 17.96 13.31 -4.65 ----2072 18.00 13.31 -4.69 ----2073 18.05 13.32 -4.73 ----2074 18.09 13.32 -4.77 ----2075 18.13 13.32 -4.81 ----2076 18.17 13.32 -4.85 ----2077 18.22 13.33 -4.89 ----2078 18.26 13.33 -4.93 ----2079 18.30 13.33 -4.97 ----2080 18.35 13.34 -5.01 ----
Summarized Rates: OASDI
2005 Cost RateIncome
RateActuarial Balance
-2079 15.31% 13.84% -1.46% 0.46%Office of the Chief Actuary
Based on Intermediate Assumptions of the 2005 Trustees Report. Social Security AdministrationAugust 8, 2005
Change inActuarialBalance
Increase the number of years used to calculate benefits for retirees and survivors (but not for disabled workers) from 35 to 40 phased in 2006-2014
Expressed as a percentage of taxable payrollTrust Fund
Ratio 1-1-year

Table B3 Financial Estimates for the OASDI Trust Fund Program
Year Cost RateIncome
RateAnnual
Balance
2005 11.13 12.72 1.59 3202006 11.00 12.73 1.73 3382007 10.94 12.74 1.80 3552008 10.97 12.78 1.81 3712009 11.10 12.77 1.67 3842010 11.21 12.79 1.59 3962011 11.35 12.84 1.49 4072012 11.57 12.87 1.30 4152013 11.79 12.90 1.10 4222014 12.03 12.91 0.88 4272015 12.26 12.93 0.67 4302016 12.50 12.94 0.45 4322017 12.74 12.96 0.22 4322018 12.98 12.98 -0.01 4312019 13.22 12.99 -0.23 4292020 13.47 13.01 -0.46 4262021 13.70 13.02 -0.68 4222022 13.93 13.04 -0.89 4172023 14.15 13.05 -1.09 4102024 14.36 13.06 -1.29 4032025 14.56 13.08 -1.48 3952026 14.76 13.09 -1.67 3872027 14.93 13.10 -1.82 3772028 15.07 13.11 -1.96 3682029 15.19 13.12 -2.07 3582030 15.29 13.13 -2.16 3482031 15.37 13.14 -2.24 3382032 15.43 13.14 -2.29 3282033 15.46 13.15 -2.32 3182034 15.47 13.15 -2.32 3082035 15.45 13.15 -2.30 2982036 15.43 13.15 -2.27 2882037 15.38 13.15 -2.23 2792038 15.33 13.15 -2.18 2702039 15.26 13.15 -2.11 2612040 15.19 13.15 -2.04 2532041 15.12 13.15 -1.98 2442042 15.06 13.14 -1.92 2362043 15.00 13.14 -1.86 2282044 14.95 13.14 -1.81 2202045 14.90 13.14 -1.76 2122046 14.86 13.14 -1.72 2052047 14.82 13.14 -1.68 1972048 14.79 13.13 -1.65 1892049 14.76 13.13 -1.63 1822050 14.75 13.13 -1.61 1742051 14.74 13.13 -1.60 1662052 14.74 13.14 -1.60 1582053 14.74 13.14 -1.60 1502054 14.75 13.14 -1.61 1412055 14.76 13.14 -1.62 1332056 14.78 13.14 -1.64 1242057 14.81 13.14 -1.66 1152058 14.83 13.14 -1.69 1052059 14.86 13.15 -1.71 952060 14.89 13.15 -1.74 852061 14.92 13.15 -1.77 752062 14.96 13.15 -1.80 642063 15.00 13.16 -1.84 532064 15.04 13.16 -1.88 422065 15.08 13.16 -1.92 302066 15.13 13.16 -1.96 182067 15.17 13.17 -2.01 52068 15.21 13.17 -2.04 ----2069 15.25 13.17 -2.08 ----2070 15.29 13.18 -2.11 ----2071 15.33 13.18 -2.15 ----2072 15.36 13.18 -2.18 ----2073 15.40 13.18 -2.21 ----2074 15.43 13.18 -2.24 ----2075 15.46 13.19 -2.28 ----2076 15.50 13.19 -2.31 ----2077 15.53 13.19 -2.34 ----2078 15.57 13.19 -2.38 ----2079 15.61 13.20 -2.41 ----2080 15.64 13.20 -2.45 ----
Summarized Rates: OASDI
2005 Cost RateIncome
RateActuarial Balance
-2079 14.11% 13.79% -0.32% 1.60%Office of the Chief Actuary
Based on Intermediate Assumptions of the 2005 Trustees Report. Social Security AdministrationAugust 8, 2005
Change inActuarialBalance
From 2006-2036, multiply the 32 and 15 percent formula factors by 0.987, reducing the factors to 21 percent and 10 percent, respectively, for new eligibles in 2035 and later
Expressed as a percentage of taxable payrollTrust Fund
Ratio 1-1-year

Table B4 Financial Estimates for the OASDI Trust Fund Program
Year Cost RateIncome
RateAnnual
Balance
2005 11.13 12.72 1.59 3202006 10.99 12.73 1.74 3382007 10.93 12.74 1.81 3562008 10.96 12.78 1.83 3712009 11.08 12.77 1.69 3852010 11.18 12.79 1.61 3982011 11.33 12.84 1.51 4092012 11.55 12.87 1.32 4172013 11.79 12.90 1.11 4232014 12.04 12.91 0.87 4272015 12.30 12.93 0.63 4302016 12.57 12.95 0.38 4302017 12.85 12.97 0.11 4282018 13.14 12.98 -0.15 4252019 13.43 13.00 -0.42 4212020 13.73 13.02 -0.71 4152021 14.02 13.04 -0.98 4072022 14.31 13.06 -1.26 3982023 14.59 13.07 -1.52 3882024 14.88 13.09 -1.79 3772025 15.15 13.10 -2.05 3652026 15.42 13.12 -2.30 3512027 15.67 13.14 -2.54 3362028 15.90 13.15 -2.75 3212029 16.10 13.16 -2.93 3052030 16.28 13.18 -3.10 2892031 16.45 13.19 -3.26 2722032 16.60 13.20 -3.40 2542033 16.71 13.21 -3.51 2372034 16.80 13.21 -3.59 2182035 16.87 13.22 -3.65 2002036 16.93 13.23 -3.70 1812037 16.97 13.23 -3.74 1622038 16.99 13.23 -3.76 1422039 17.00 13.24 -3.76 1232040 17.00 13.24 -3.77 1022041 17.01 13.24 -3.77 822042 17.01 13.24 -3.77 612043 17.02 13.24 -3.77 402044 17.02 13.24 -3.78 192045 17.03 13.24 -3.78 ----2046 17.04 13.25 -3.79 ----2047 17.06 13.25 -3.81 ----2048 17.07 13.25 -3.82 ----2049 17.09 13.25 -3.84 ----2050 17.12 13.25 -3.86 ----2051 17.15 13.26 -3.89 ----2052 17.18 13.26 -3.93 ----2053 17.22 13.26 -3.96 ----2054 17.27 13.27 -4.00 ----2055 17.31 13.27 -4.04 ----2056 17.36 13.27 -4.09 ----2057 17.41 13.28 -4.14 ----2058 17.46 13.28 -4.18 ----2059 17.51 13.28 -4.23 ----2060 17.56 13.29 -4.28 ----2061 17.62 13.29 -4.33 ----2062 17.67 13.29 -4.38 ----2063 17.73 13.30 -4.43 ----2064 17.79 13.30 -4.49 ----2065 17.85 13.30 -4.54 ----2066 17.91 13.31 -4.60 ----2067 17.96 13.31 -4.65 ----2068 18.02 13.32 -4.70 ----2069 18.07 13.32 -4.75 ----2070 18.12 13.32 -4.79 ----2071 18.16 13.32 -4.84 ----2072 18.21 13.33 -4.88 ----2073 18.25 13.33 -4.92 ----2074 18.29 13.33 -4.96 ----2075 18.33 13.34 -5.00 ----2076 18.38 13.34 -5.04 ----2077 18.42 13.34 -5.08 ----2078 18.46 13.34 -5.12 ----2079 18.51 13.35 -5.16 ----2080 18.55 13.35 -5.20 ----
Summarized Rates: OASDI
2005 Cost RateIncome
RateActuarial Balance
-2079 15.41% 13.85% -1.56% 0.37%Office of the Chief Actuary
Based on Intermediate Assumptions of the 2005 Trustees Report. Social Security AdministrationAugust 8, 2005
Change inActuarialBalance
Reduce benefits across the board by 3 percent for those newly eligible for benefits in 2006 and later
Expressed as a percentage of taxable payrollTrust Fund
Ratio 1-1-year

Table B5 Financial Estimates for the OASDI Trust Fund Program
Year Cost RateIncome
RateAnnual
Balance
2005 11.13 12.72 1.59 3202006 10.99 12.73 1.74 3382007 10.92 12.74 1.82 3562008 10.93 12.78 1.85 3722009 11.04 12.77 1.73 3862010 11.13 12.79 1.66 4002011 11.26 12.84 1.57 4122012 11.47 12.87 1.40 4212013 11.69 12.89 1.20 4292014 11.93 12.91 0.98 4342015 12.17 12.92 0.76 4382016 12.43 12.94 0.52 4402017 12.69 12.96 0.27 4402018 12.96 12.98 0.01 4382019 13.24 12.99 -0.25 4352020 13.53 13.01 -0.51 4302021 13.81 13.03 -0.78 4242022 14.08 13.04 -1.04 4172023 14.36 13.06 -1.29 4082024 14.62 13.08 -1.55 3982025 14.89 13.09 -1.80 3872026 15.15 13.11 -2.04 3752027 15.39 13.12 -2.27 3622028 15.61 13.14 -2.47 3492029 15.80 13.15 -2.65 3352030 15.97 13.16 -2.81 3202031 16.14 13.17 -2.96 3052032 16.28 13.18 -3.09 2892033 16.39 13.19 -3.19 2732034 16.47 13.20 -3.27 2562035 16.54 13.20 -3.33 2402036 16.59 13.21 -3.38 2232037 16.63 13.21 -3.42 2062038 16.65 13.22 -3.43 1882039 16.65 13.22 -3.44 1712040 16.66 13.22 -3.44 1532041 16.66 13.22 -3.44 1352042 16.67 13.22 -3.44 1162043 16.67 13.22 -3.45 982044 16.67 13.23 -3.45 792045 16.68 13.23 -3.45 602046 16.69 13.23 -3.46 402047 16.71 13.23 -3.48 202048 16.72 13.23 -3.49 ----2049 16.74 13.23 -3.51 ----2050 16.77 13.24 -3.53 ----2051 16.80 13.24 -3.56 ----2052 16.83 13.24 -3.59 ----2053 16.87 13.24 -3.63 ----2054 16.91 13.25 -3.66 ----2055 16.95 13.25 -3.70 ----2056 17.00 13.25 -3.75 ----2057 17.05 13.26 -3.80 ----2058 17.10 13.26 -3.84 ----2059 17.15 13.26 -3.89 ----2060 17.20 13.27 -3.93 ----2061 17.25 13.27 -3.98 ----2062 17.31 13.28 -4.03 ----2063 17.37 13.28 -4.09 ----2064 17.42 13.28 -4.14 ----2065 17.48 13.29 -4.19 ----2066 17.54 13.29 -4.25 ----2067 17.59 13.29 -4.30 ----2068 17.65 13.30 -4.35 ----2069 17.70 13.30 -4.40 ----2070 17.74 13.30 -4.44 ----2071 17.79 13.31 -4.48 ----2072 17.83 13.31 -4.52 ----2073 17.87 13.31 -4.56 ----2074 17.91 13.31 -4.60 ----2075 17.95 13.32 -4.64 ----2076 18.00 13.32 -4.68 ----2077 18.04 13.32 -4.72 ----2078 18.08 13.32 -4.76 ----2079 18.13 13.33 -4.80 ----2080 18.17 13.33 -4.84 ----
Summarized Rates: OASDI
2005 Cost RateIncome
RateActuarial Balance
-2079 15.15% 13.84% -1.31% 0.61%Office of the Chief Actuary
Based on Intermediate Assumptions of the 2005 Trustees Report. Social Security AdministrationAugust 8, 2005
Change inActuarialBalance
Reduce benefits across the board by 5 percent for those newly eligible for benefits in 2006 and later
Expressed as a percentage of taxable payrollTrust Fund
Ratio 1-1-year

Table B6 Financial Estimates for the OASDI Trust Fund Program
Year Cost RateIncome
RateAnnual
Balance
2005 11.13 12.72 1.59 3202006 11.00 12.73 1.73 3372007 10.95 12.74 1.79 3552008 10.99 12.78 1.80 3702009 11.13 12.77 1.65 3832010 11.25 12.79 1.54 3942011 11.42 12.84 1.42 4042012 11.67 12.87 1.21 4102013 11.92 12.90 0.98 4152014 12.19 12.92 0.73 4182015 12.44 12.94 0.50 4192016 12.70 12.95 0.25 4192017 12.97 12.97 0.00 4182018 13.22 12.99 -0.23 4152019 13.47 13.00 -0.47 4112020 13.72 13.02 -0.70 4062021 13.96 13.04 -0.92 4002022 14.18 13.05 -1.13 3942023 14.39 13.06 -1.33 3862024 14.59 13.08 -1.52 3782025 14.79 13.09 -1.70 3692026 14.96 13.10 -1.86 3602027 15.11 13.11 -2.00 3502028 15.23 13.12 -2.11 3392029 15.32 13.13 -2.19 3292030 15.40 13.14 -2.26 3192031 15.45 13.14 -2.30 3092032 15.47 13.15 -2.33 2982033 15.46 13.15 -2.32 2882034 15.43 13.15 -2.28 2782035 15.37 13.15 -2.22 2692036 15.30 13.15 -2.15 2602037 15.21 13.15 -2.07 2522038 15.10 13.14 -1.96 2442039 14.98 13.14 -1.84 2372040 14.85 13.13 -1.72 2302041 14.72 13.13 -1.59 2252042 14.59 13.12 -1.46 2192043 14.45 13.12 -1.33 2152044 14.31 13.11 -1.20 2112045 14.18 13.11 -1.07 2082046 14.04 13.10 -0.94 2062047 13.91 13.09 -0.82 2042048 13.78 13.09 -0.69 2042049 13.66 13.08 -0.57 2042050 13.53 13.08 -0.46 2052051 13.42 13.07 -0.34 2072052 13.30 13.07 -0.23 2092053 13.19 13.06 -0.13 2132054 13.08 13.06 -0.02 2172055 12.98 13.05 0.08 2222056 12.88 13.05 0.17 2282057 12.78 13.04 0.27 2352058 12.68 13.04 0.36 2432059 12.58 13.04 0.45 2512060 12.49 13.03 0.54 2612061 12.40 13.03 0.63 2722062 12.31 13.02 0.72 2832063 12.22 13.02 0.80 2962064 12.13 13.02 0.88 3092065 12.05 13.01 0.97 3242066 11.96 13.01 1.05 3402067 11.88 13.00 1.13 3562068 11.79 13.00 1.21 3742069 11.70 13.00 1.29 3942070 11.61 12.99 1.38 4142071 11.52 12.99 1.47 4362072 11.43 12.98 1.55 4602073 11.34 12.98 1.64 4842074 11.25 12.98 1.72 5112075 11.16 12.97 1.81 5392076 11.07 12.97 1.89 5682077 10.99 12.96 1.98 6002078 10.90 12.96 2.06 6332079 10.81 12.95 2.14 6672080 10.72 12.95 2.23 704
Summarized Rates: OASDI
2005 Cost RateIncome
RateActuarial Balance
-2079 13.29% 13.75% 0.45% 2.38%Office of the Chief Actuary
Based on Intermediate Assumptions of the 2005 Trustees Report. Social Security AdministrationAugust 8, 2005
Change inActuarialBalance
Reduce PIA formula factors by real wage growth (i.e., "CPI-index" the formula factors), for those newly eligible for OASDI benefits in 2012 and later
Expressed as a percentage of taxable payrollTrust Fund
Ratio 1-1-year

Table B7 Financial Estimates for the OASDI Trust Fund Program
Year Cost RateIncome
RateAnnual
Balance
2005 11.13 12.72 1.59 3202006 11.00 12.73 1.73 3372007 10.95 12.74 1.79 3552008 10.99 12.78 1.80 3702009 11.13 12.77 1.65 3832010 11.25 12.79 1.54 3942011 11.42 12.84 1.42 4042012 11.67 12.87 1.21 4102013 11.93 12.90 0.98 4152014 12.20 12.92 0.72 4182015 12.46 12.94 0.48 4192016 12.73 12.95 0.22 4182017 13.01 12.97 -0.04 4162018 13.29 12.99 -0.30 4122019 13.56 13.01 -0.55 4072020 13.83 13.02 -0.81 4012021 14.10 13.04 -1.05 3942022 14.35 13.06 -1.29 3862023 14.59 13.07 -1.52 3772024 14.83 13.09 -1.74 3662025 15.06 13.10 -1.96 3552026 15.28 13.11 -2.17 3432027 15.47 13.13 -2.35 3312028 15.64 13.14 -2.50 3172029 15.78 13.15 -2.63 3042030 15.90 13.16 -2.74 2902031 16.00 13.17 -2.83 2762032 16.07 13.17 -2.90 2622033 16.12 13.18 -2.94 2472034 16.13 13.18 -2.95 2332035 16.13 13.18 -2.95 2192036 16.11 13.19 -2.93 2042037 16.08 13.19 -2.89 1902038 16.02 13.18 -2.84 1762039 15.96 13.18 -2.77 1612040 15.88 13.18 -2.70 1472041 15.81 13.18 -2.63 1332042 15.73 13.18 -2.56 1202043 15.66 13.17 -2.48 1062044 15.58 13.17 -2.41 922045 15.51 13.17 -2.34 792046 15.44 13.16 -2.27 652047 15.37 13.16 -2.20 522048 15.30 13.16 -2.14 392049 15.23 13.16 -2.08 262050 15.18 13.16 -2.02 132051 15.12 13.15 -1.97 ----2052 15.07 13.15 -1.92 ----2053 15.03 13.15 -1.88 ----2054 14.98 13.15 -1.83 ----2055 14.94 13.15 -1.79 ----2056 14.90 13.15 -1.76 ----2057 14.87 13.15 -1.73 ----2058 14.84 13.14 -1.69 ----2059 14.80 13.14 -1.66 ----2060 14.77 13.14 -1.63 ----2061 14.74 13.14 -1.60 ----2062 14.71 13.14 -1.57 ----2063 14.69 13.14 -1.55 ----2064 14.66 13.14 -1.52 ----2065 14.64 13.14 -1.50 ----2066 14.61 13.14 -1.48 ----2067 14.59 13.14 -1.45 ----2068 14.56 13.14 -1.43 ----2069 14.53 13.14 -1.40 ----2070 14.50 13.13 -1.37 ----2071 14.47 13.13 -1.34 ----2072 14.44 13.13 -1.31 ----2073 14.40 13.13 -1.27 ----2074 14.37 13.13 -1.24 ----2075 14.33 13.13 -1.21 ----2076 14.30 13.13 -1.18 ----2077 14.27 13.12 -1.15 ----2078 14.24 13.12 -1.12 ----2079 14.21 13.12 -1.09 ----2080 14.18 13.12 -1.06 ----
Summarized Rates: OASDI
2005 Cost RateIncome
RateActuarial Balance
-2079 14.29% 13.80% -0.50% 1.43%Office of the Chief Actuary
Based on Intermediate Assumptions of the 2005 Trustees Report. Social Security AdministrationAugust 8, 2005
Change in ActuarialBalance
Progressive price indexing of PIA formula factors beginning with individuals newly eligible for OASDI benefits in 2012. Create new bend point at the 30th percentile of earners. Maintain current-law benefits for earners at the
30th percentile and below and reduce upper 2 formula factors (32% and 15%) such that maximum worker benefit grows by inflation rather than the growth in average wages.
Expressed as a percentage of taxable payrollTrust Fund
Ratio 1-1-year

Table B8 Financial Estimates for the OASDI Trust Fund Program
Year Cost RateIncome
RateAnnual
Balance
2005 11.13 12.72 1.59 3202006 11.00 12.73 1.73 3372007 10.95 12.74 1.79 3552008 10.99 12.78 1.80 3702009 11.13 12.77 1.65 3832010 11.25 12.79 1.54 3942011 11.42 12.84 1.42 4042012 11.67 12.87 1.21 4102013 11.93 12.90 0.98 4152014 12.20 12.92 0.72 4182015 12.46 12.94 0.47 4192016 12.74 12.96 0.21 4182017 13.02 12.97 -0.05 4152018 13.30 12.99 -0.31 4112019 13.58 13.01 -0.57 4062020 13.86 13.03 -0.83 4002021 14.13 13.04 -1.09 3932022 14.39 13.06 -1.33 3842023 14.64 13.07 -1.57 3742024 14.89 13.09 -1.80 3642025 15.13 13.10 -2.02 3522026 15.36 13.12 -2.24 3392027 15.56 13.13 -2.43 3262028 15.74 13.14 -2.59 3122029 15.89 13.15 -2.73 2982030 16.02 13.16 -2.85 2842031 16.13 13.17 -2.96 2692032 16.22 13.18 -3.04 2542033 16.28 13.19 -3.09 2382034 16.30 13.19 -3.11 2232035 16.31 13.19 -3.12 2072036 16.31 13.19 -3.11 1922037 16.28 13.20 -3.09 1762038 16.24 13.20 -3.05 1602039 16.19 13.19 -2.99 1452040 16.13 13.19 -2.93 1292041 16.06 13.19 -2.87 1142042 16.00 13.19 -2.81 982043 15.94 13.19 -2.75 822044 15.87 13.18 -2.69 672045 15.81 13.18 -2.63 512046 15.76 13.18 -2.58 362047 15.70 13.18 -2.52 202048 15.65 13.18 -2.47 52049 15.60 13.18 -2.42 ----2050 15.55 13.17 -2.38 ----2051 15.51 13.17 -2.34 ----2052 15.48 13.17 -2.31 ----2053 15.45 13.17 -2.28 ----2054 15.42 13.17 -2.25 ----2055 15.39 13.17 -2.22 ----2056 15.37 13.17 -2.20 ----2057 15.35 13.17 -2.18 ----2058 15.33 13.17 -2.16 ----2059 15.31 13.17 -2.14 ----2060 15.29 13.17 -2.12 ----2061 15.27 13.17 -2.10 ----2062 15.26 13.17 -2.09 ----2063 15.25 13.17 -2.08 ----2064 15.24 13.17 -2.07 ----2065 15.22 13.17 -2.06 ----2066 15.21 13.17 -2.05 ----2067 15.20 13.17 -2.04 ----2068 15.19 13.17 -2.02 ----2069 15.17 13.17 -2.01 ----2070 15.15 13.17 -1.99 ----2071 15.13 13.17 -1.97 ----2072 15.11 13.17 -1.95 ----2073 15.09 13.16 -1.93 ----2074 15.07 13.16 -1.91 ----2075 15.05 13.16 -1.89 ----2076 15.03 13.16 -1.87 ----2077 15.01 13.16 -1.85 ----2078 14.99 13.16 -1.83 ----2079 14.98 13.16 -1.81 ----2080 14.96 13.16 -1.80 ----
Summarized Rates: OASDI
2005 Cost RateIncome
RateActuarial Balance
-2079 14.52% 13.81% -0.72% 1.21%Office of the Chief Actuary
Based on Intermediate Assumptions of the 2005 Trustees Report. Social Security AdministrationAugust 8, 2005
Change in ActuarialBalance
Progressive price indexing of PIA formula factors beginning with individuals newly eligible for OASDI benefits in 2012. Create new bend point at the 40th percentile of earners. Maintain current-law benefits for earners at the
40th percentile and below and reduce upper 2 formula factors (32% and 15%) such that maximum worker benefit grows by inflation rather than the growth in average wages.
Expressed as a percentage of taxable payrollTrust Fund
Ratio 1-1-year

Table B9 Financial Estimates for the OASDI Trust Fund Program
Year Cost RateIncome
RateAnnual
Balance
2005 11.13 12.72 1.59 3202006 11.00 12.73 1.73 3372007 10.95 12.74 1.79 3552008 10.99 12.78 1.80 3702009 11.13 12.77 1.65 3832010 11.25 12.79 1.54 3942011 11.42 12.84 1.42 4042012 11.67 12.87 1.21 4102013 11.93 12.90 0.98 4152014 12.20 12.92 0.72 4182015 12.47 12.94 0.47 4182016 12.75 12.96 0.21 4172017 13.03 12.97 -0.06 4152018 13.32 12.99 -0.33 4112019 13.60 13.01 -0.59 4052020 13.89 13.03 -0.86 3992021 14.16 13.04 -1.12 3912022 14.44 13.06 -1.38 3822023 14.70 13.08 -1.62 3722024 14.95 13.09 -1.86 3612025 15.20 13.11 -2.09 3482026 15.44 13.12 -2.32 3352027 15.66 13.14 -2.52 3212028 15.84 13.15 -2.69 3072029 16.00 13.16 -2.84 2922030 16.15 13.17 -2.98 2772031 16.27 13.18 -3.09 2612032 16.37 13.19 -3.19 2452033 16.44 13.19 -3.25 2282034 16.48 13.20 -3.29 2122035 16.51 13.20 -3.30 1952036 16.51 13.20 -3.31 1782037 16.50 13.21 -3.30 1612038 16.47 13.21 -3.27 1442039 16.43 13.21 -3.22 1272040 16.38 13.21 -3.18 1102041 16.34 13.20 -3.13 932042 16.29 13.20 -3.09 762043 16.24 13.20 -3.04 582044 16.19 13.20 -2.99 412045 16.14 13.20 -2.94 232046 16.10 13.20 -2.90 52047 16.06 13.20 -2.86 ----2048 16.02 13.20 -2.82 ----2049 15.98 13.19 -2.79 ----2050 15.95 13.19 -2.76 ----2051 15.93 13.19 -2.73 ----2052 15.91 13.19 -2.71 ----2053 15.89 13.19 -2.70 ----2054 15.87 13.19 -2.68 ----2055 15.86 13.19 -2.67 ----2056 15.85 13.19 -2.66 ----2057 15.85 13.19 -2.65 ----2058 15.84 13.19 -2.65 ----2059 15.84 13.20 -2.64 ----2060 15.83 13.20 -2.64 ----2061 15.83 13.20 -2.63 ----2062 15.83 13.20 -2.63 ----2063 15.83 13.20 -2.63 ----2064 15.84 13.20 -2.64 ----2065 15.84 13.20 -2.64 ----2066 15.85 13.20 -2.65 ----2067 15.86 13.20 -2.66 ----2068 15.87 13.20 -2.66 ----2069 15.87 13.20 -2.67 ----2070 15.88 13.20 -2.67 ----2071 15.88 13.20 -2.68 ----2072 15.89 13.21 -2.69 ----2073 15.90 13.21 -2.70 ----2074 15.91 13.21 -2.70 ----2075 15.92 13.21 -2.72 ----2076 15.94 13.21 -2.73 ----2077 15.95 13.21 -2.74 ----2078 15.97 13.21 -2.76 ----2079 15.99 13.21 -2.78 ----2080 16.01 13.21 -2.80 ----
Summarized Rates: OASDI
2005 Cost RateIncome
RateActuarial Balance
-2079 14.77% 13.82% -0.96% 0.97%Office of the Chief Actuary
Based on Intermediate Assumptions of the 2005 Trustees Report. Social Security AdministrationAugust 8, 2005
Change in ActuarialBalance
Progressive price indexing of PIA formula factors beginning with individuals newly eligible for OASDI benefits in 2012. Create new bend point at the 50th percentile of earners. Maintain current-law benefits for earners at the
50th percentile and below and reduce upper 2 formula factors (32% and 15%) such that maximum worker benefit grows by inflation rather than the growth in average wages.
Expressed as a percentage of taxable payrollTrust Fund
Ratio 1-1-year

Table B10 Financial Estimates for the OASDI Trust Fund Program
Year Cost RateIncome
RateAnnual
Balance
2005 11.13 12.72 1.59 3202006 11.00 12.73 1.73 3372007 10.95 12.74 1.79 3552008 10.99 12.78 1.80 3702009 11.13 12.77 1.65 3832010 11.25 12.79 1.54 3942011 11.42 12.84 1.42 4042012 11.67 12.87 1.21 4102013 11.93 12.90 0.97 4152014 12.20 12.92 0.72 4172015 12.47 12.94 0.47 4182016 12.76 12.96 0.20 4172017 13.05 12.97 -0.07 4142018 13.34 12.99 -0.34 4102019 13.62 13.01 -0.61 4042020 13.92 13.03 -0.89 3972021 14.21 13.05 -1.16 3892022 14.48 13.06 -1.42 3802023 14.75 13.08 -1.68 3692024 15.02 13.09 -1.93 3572025 15.28 13.11 -2.17 3452026 15.53 13.13 -2.41 3312027 15.76 13.14 -2.62 3162028 15.96 13.15 -2.81 3012029 16.13 13.17 -2.97 2852030 16.29 13.18 -3.11 2692031 16.43 13.19 -3.24 2522032 16.54 13.20 -3.35 2352033 16.63 13.20 -3.42 2182034 16.68 13.21 -3.47 2002035 16.72 13.21 -3.50 1822036 16.74 13.22 -3.52 1642037 16.74 13.22 -3.52 1462038 16.73 13.22 -3.51 1272039 16.70 13.22 -3.48 1092040 16.66 13.22 -3.44 902041 16.63 13.22 -3.41 712042 16.60 13.22 -3.38 522043 16.56 13.22 -3.34 332044 16.52 13.22 -3.31 132045 16.49 13.22 -3.28 ----2046 16.46 13.22 -3.25 ----2047 16.44 13.22 -3.22 ----2048 16.41 13.22 -3.20 ----2049 16.39 13.22 -3.18 ----2050 16.38 13.22 -3.16 ----2051 16.37 13.22 -3.15 ----2052 16.37 13.22 -3.15 ----2053 16.37 13.22 -3.15 ----2054 16.37 13.22 -3.15 ----2055 16.38 13.22 -3.16 ----2056 16.40 13.22 -3.17 ----2057 16.41 13.22 -3.19 ----2058 16.44 13.22 -3.21 ----2059 16.46 13.23 -3.23 ----2060 16.48 13.23 -3.25 ----2061 16.51 13.23 -3.28 ----2062 16.54 13.23 -3.31 ----2063 16.58 13.24 -3.34 ----2064 16.62 13.24 -3.38 ----2065 16.65 13.24 -3.41 ----2066 16.70 13.24 -3.45 ----2067 16.74 13.25 -3.49 ----2068 16.77 13.25 -3.53 ----2069 16.81 13.25 -3.56 ----2070 16.84 13.25 -3.59 ----2071 16.88 13.26 -3.62 ----2072 16.91 13.26 -3.65 ----2073 16.94 13.26 -3.68 ----2074 16.98 13.26 -3.71 ----2075 17.01 13.26 -3.75 ----2076 17.05 13.27 -3.78 ----2077 17.08 13.27 -3.81 ----2078 17.12 13.27 -3.85 ----2079 17.16 13.27 -3.88 ----2080 17.20 13.28 -3.92 ----
Summarized Rates: OASDI
2005 Cost RateIncome
RateActuarial Balance
-2079 15.07% 13.83% -1.24% 0.68%Office of the Chief Actuary
Based on Intermediate Assumptions of the 2005 Trustees Report. Social Security AdministrationAugust 8, 2005
Change in ActuarialBalance
Progressive price indexing of PIA formula factors beginning with individuals newly eligible for OASDI benefits in 2012. Create new bend point at the 60th percentile of earners. Maintain current-law benefits for earners at the
60th percentile and below and reduce upper 2 formula factors (32% and 15%) such that maximum worker benefit grows by inflation rather than the growth in average wages.
Expressed as a percentage of taxable payrollTrust Fund
Ratio 1-1-year

Table C1 Financial Estimates for the OASDI Trust Fund Program
Year Cost RateIncome
RateAnnual
Balance Proposed Plan Present Law
2005 11.13 12.72 1.59 320 4,730 4,730 0.0%2006 11.00 12.73 1.73 338 4,985 4,985 0.0%2007 10.94 12.74 1.80 355 5,244 5,244 0.0%2008 10.95 12.78 1.83 371 5,512 5,511 0.0%2009 11.06 12.77 1.71 385 5,785 5,784 0.0%2010 11.14 12.79 1.65 399 6,068 6,065 0.0%2011 11.27 12.84 1.57 411 6,358 6,354 0.1%2012 11.47 12.86 1.39 420 6,650 6,646 0.1%2013 11.69 12.89 1.20 428 6,951 6,946 0.1%2014 11.93 12.90 0.97 433 7,264 7,258 0.1%2015 12.18 12.92 0.75 437 7,590 7,583 0.1%2016 12.42 12.94 0.52 439 7,927 7,919 0.1%2017 12.70 12.95 0.26 438 8,276 8,268 0.1%2018 12.99 12.97 -0.02 436 8,638 8,630 0.1%2019 13.29 12.99 -0.30 432 9,013 9,005 0.1%2020 13.60 13.01 -0.59 426 9,399 9,391 0.1%2021 13.93 13.03 -0.90 418 9,800 9,794 0.1%2022 14.25 13.05 -1.20 409 10,214 10,209 0.1%2023 14.57 13.07 -1.50 398 10,644 10,640 0.0%2024 14.89 13.09 -1.80 386 11,088 11,085 0.0%2025 15.20 13.11 -2.10 373 11,547 11,545 0.0%2026 15.52 13.12 -2.39 358 12,025 12,024 0.0%2027 15.81 13.14 -2.67 342 12,528 12,527 0.0%2028 16.07 13.16 -2.91 325 13,054 13,054 0.0%2029 16.30 13.17 -3.12 308 13,599 13,599 0.0%2030 16.51 13.19 -3.32 291 14,166 14,166 0.0%2031 16.70 13.20 -3.50 272 14,758 14,758 0.0%2032 16.87 13.21 -3.66 253 15,381 15,381 0.0%2033 17.01 13.22 -3.78 234 16,033 16,033 0.0%2034 17.11 13.23 -3.88 214 16,714 16,714 0.0%2035 17.20 13.24 -3.97 194 17,418 17,418 0.0%2036 17.28 13.24 -4.03 174 18,153 18,153 0.0%2037 17.33 13.25 -4.08 153 18,923 18,923 0.0%2038 17.37 13.25 -4.12 131 19,728 19,728 0.0%2039 17.39 13.25 -4.14 110 20,569 20,569 0.0%2040 17.41 13.26 -4.15 88 21,442 21,442 0.0%2041 17.43 13.26 -4.17 66 22,353 22,353 0.0%2042 17.44 13.26 -4.18 43 23,302 23,302 0.0%2043 17.46 13.26 -4.20 20 24,292 24,292 0.0%2044 17.47 13.26 -4.21 ---- 25,321 25,321 0.0%2045 17.49 13.27 -4.23 ---- 26,386 26,386 0.0%2046 17.52 13.27 -4.25 ---- 27,491 27,491 0.0%2047 17.54 13.27 -4.27 ---- 28,642 28,642 0.0%2048 17.57 13.27 -4.29 ---- 29,842 29,842 0.0%2049 17.59 13.28 -4.32 ---- 31,085 31,085 0.0%2050 17.62 13.28 -4.35 ---- 32,374 32,374 0.0%2051 17.66 13.28 -4.38 ---- 33,719 33,719 0.0%2052 17.70 13.29 -4.42 ---- 35,120 35,120 0.0%2053 17.75 13.29 -4.46 ---- 36,579 36,579 0.0%2054 17.79 13.29 -4.50 ---- 38,101 38,101 0.0%2055 17.84 13.29 -4.54 ---- 39,682 39,682 0.0%2056 17.89 13.30 -4.59 ---- 41,324 41,324 0.0%2057 17.95 13.30 -4.64 ---- 43,036 43,036 0.0%2058 18.00 13.31 -4.69 ---- 44,817 44,817 0.0%2059 18.05 13.31 -4.74 ---- 46,670 46,670 0.0%2060 18.10 13.31 -4.79 ---- 48,600 48,600 0.0%2061 18.16 13.32 -4.84 ---- 50,605 50,605 0.0%2062 18.22 13.32 -4.90 ---- 52,699 52,699 0.0%2063 18.28 13.32 -4.95 ---- 54,883 54,883 0.0%2064 18.34 13.33 -5.01 ---- 57,155 57,155 0.0%2065 18.40 13.33 -5.07 ---- 59,520 59,520 0.0%2066 18.46 13.34 -5.12 ---- 61,964 61,964 0.0%2067 18.52 13.34 -5.18 ---- 64,511 64,511 0.0%2068 18.57 13.34 -5.23 ---- 67,183 67,183 0.0%2069 18.63 13.35 -5.28 ---- 69,970 69,970 0.0%2070 18.67 13.35 -5.32 ---- 72,868 72,868 0.0%2071 18.72 13.35 -5.37 ---- 75,881 75,881 0.0%2072 18.77 13.36 -5.41 ---- 79,015 79,015 0.0%2073 18.81 13.36 -5.45 ---- 82,282 82,282 0.0%2074 18.85 13.36 -5.49 ---- 85,685 85,685 0.0%2075 18.90 13.36 -5.53 ---- 89,221 89,221 0.0%2076 18.94 13.37 -5.58 ---- 92,900 92,900 0.0%2077 18.99 13.37 -5.62 ---- 96,727 96,727 0.0%2078 19.03 13.37 -5.66 ---- 100,711 100,711 0.0%2079 19.08 13.37 -5.70 ---- 104,859 104,859 0.0%2080 19.12 13.38 -5.75 ---- 109,174 109,174 0.0%
Summarized Rates: OASDI
2005 Cost RateIncome
RateActuarial Balance
-2079 15.64% 13.86% -1.78% 0.14%Office of the Chief Actuary
Based on Intermediate Assumptions of the 2005 Trustees Report. Social Security AdministrationAugust 8, 2005
Change inActuarialBalance
Eliminate the hiatus in the normal retirement age (speed up the increase to age 67)OASDI Taxable Payroll
(in billions of dollars) Increase in Taxable
Payroll over Present Law
Expressed as a percentage of taxable payrollTrust Fund
Ratio 1-1-year

Table C2 Financial Estimates for the OASDI Trust Fund Program
Year Cost RateIncome
RateAnnual
Balance Proposed Plan Present Law
2005 11.13 12.72 1.59 320 4,730 4,730 0.0%2006 11.00 12.73 1.73 337 4,985 4,985 0.0%2007 10.93 12.74 1.81 355 5,244 5,244 0.0%2008 10.95 12.78 1.84 372 5,512 5,511 0.0%2009 11.05 12.77 1.72 386 5,785 5,784 0.0%2010 11.14 12.79 1.65 399 6,068 6,065 0.0%2011 11.27 12.84 1.57 411 6,358 6,354 0.1%2012 11.48 12.86 1.39 420 6,650 6,646 0.1%2013 11.69 12.89 1.20 428 6,952 6,946 0.1%2014 11.93 12.90 0.98 433 7,265 7,258 0.1%2015 12.15 12.92 0.77 437 7,591 7,583 0.1%2016 12.38 12.94 0.56 440 7,927 7,919 0.1%2017 12.63 12.95 0.32 441 8,277 8,268 0.1%2018 12.91 12.97 0.06 440 8,639 8,630 0.1%2019 13.19 12.99 -0.20 437 9,015 9,005 0.1%2020 13.49 13.00 -0.48 432 9,401 9,391 0.1%2021 13.80 13.02 -0.77 425 9,803 9,794 0.1%2022 14.10 13.04 -1.06 417 10,217 10,209 0.1%2023 14.40 13.06 -1.34 408 10,648 10,640 0.1%2024 14.70 13.08 -1.62 397 11,093 11,085 0.1%2025 14.99 13.09 -1.89 385 11,553 11,545 0.1%2026 15.28 13.11 -2.17 372 12,032 12,024 0.1%2027 15.54 13.13 -2.41 357 12,536 12,527 0.1%2028 15.77 13.14 -2.63 343 13,063 13,054 0.1%2029 15.98 13.16 -2.82 327 13,609 13,599 0.1%2030 16.16 13.17 -2.99 312 14,176 14,166 0.1%2031 16.33 13.18 -3.15 295 14,770 14,758 0.1%2032 16.47 13.19 -3.28 279 15,393 15,381 0.1%2033 16.58 13.20 -3.38 262 16,047 16,033 0.1%2034 16.66 13.20 -3.45 244 16,728 16,714 0.1%2035 16.72 13.21 -3.52 227 17,434 17,418 0.1%2036 16.78 13.21 -3.57 209 18,170 18,153 0.1%2037 16.82 13.22 -3.60 191 18,941 18,923 0.1%2038 16.83 13.22 -3.61 172 19,747 19,728 0.1%2039 16.83 13.22 -3.61 154 20,588 20,569 0.1%2040 16.83 13.22 -3.61 135 21,463 21,442 0.1%2041 16.83 13.22 -3.60 116 22,374 22,353 0.1%2042 16.83 13.23 -3.60 96 23,325 23,302 0.1%2043 16.83 13.23 -3.60 77 24,316 24,292 0.1%2044 16.83 13.23 -3.60 57 25,346 25,321 0.1%2045 16.83 13.23 -3.60 36 26,412 26,386 0.1%2046 16.84 13.23 -3.61 16 27,519 27,491 0.1%2047 16.86 13.23 -3.62 ---- 28,672 28,642 0.1%2048 16.87 13.23 -3.63 ---- 29,872 29,842 0.1%2049 16.88 13.24 -3.65 ---- 31,117 31,085 0.1%2050 16.91 13.24 -3.67 ---- 32,408 32,374 0.1%2051 16.93 13.24 -3.69 ---- 33,754 33,719 0.1%2052 16.96 13.24 -3.72 ---- 35,157 35,120 0.1%2053 17.00 13.24 -3.75 ---- 36,617 36,579 0.1%2054 17.03 13.25 -3.79 ---- 38,141 38,101 0.1%2055 17.08 13.25 -3.83 ---- 39,724 39,682 0.1%2056 17.12 13.25 -3.87 ---- 41,368 41,324 0.1%2057 17.17 13.26 -3.91 ---- 43,082 43,036 0.1%2058 17.22 13.26 -3.96 ---- 44,865 44,817 0.1%2059 17.27 13.26 -4.00 ---- 46,720 46,670 0.1%2060 17.32 13.27 -4.05 ---- 48,652 48,600 0.1%2061 17.37 13.27 -4.10 ---- 50,659 50,605 0.1%2062 17.42 13.27 -4.15 ---- 52,755 52,699 0.1%2063 17.48 13.28 -4.20 ---- 54,941 54,883 0.1%2064 17.54 13.28 -4.26 ---- 57,216 57,155 0.1%2065 17.59 13.28 -4.31 ---- 59,582 59,520 0.1%2066 17.65 13.29 -4.36 ---- 62,031 61,964 0.1%2067 17.70 13.29 -4.41 ---- 64,580 64,511 0.1%2068 17.75 13.30 -4.46 ---- 67,256 67,183 0.1%2069 17.80 13.30 -4.50 ---- 70,045 69,970 0.1%2070 17.85 13.30 -4.55 ---- 72,945 72,868 0.1%2071 17.90 13.30 -4.59 ---- 75,962 75,881 0.1%2072 17.94 13.31 -4.64 ---- 79,099 79,015 0.1%2073 17.99 13.31 -4.68 ---- 82,369 82,282 0.1%2074 18.03 13.31 -4.72 ---- 85,775 85,685 0.1%2075 18.07 13.31 -4.76 ---- 89,314 89,221 0.1%2076 18.13 13.32 -4.81 ---- 92,997 92,900 0.1%2077 18.18 13.32 -4.86 ---- 96,829 96,727 0.1%2078 18.22 13.32 -4.90 ---- 100,817 100,711 0.1%2079 18.27 13.33 -4.94 ---- 104,969 104,859 0.1%2080 18.29 13.33 -4.96 ---- 109,291 109,174 0.1%
Summarized Rates: OASDI
2005 Cost RateIncome
RateActuarial Balance
-2079 15.24% 13.84% -1.40% 0.52%Office of the Chief Actuary
Based on Intermediate Assumptions of the 2005 Trustees Report. Social Security AdministrationAugust 8, 2005
Change inActuarialBalance
Eliminate the hiatus in the normal retirement age (speed up the increase to age 67) and index the NRA by 1 month every 2 years until the NRA reaches age 68
OASDI Taxable Payroll (in billions of dollars) Increase in
Taxable Payroll over Present Law
Expressed as a percentage of taxable payrollTrust Fund
Ratio 1-1-year
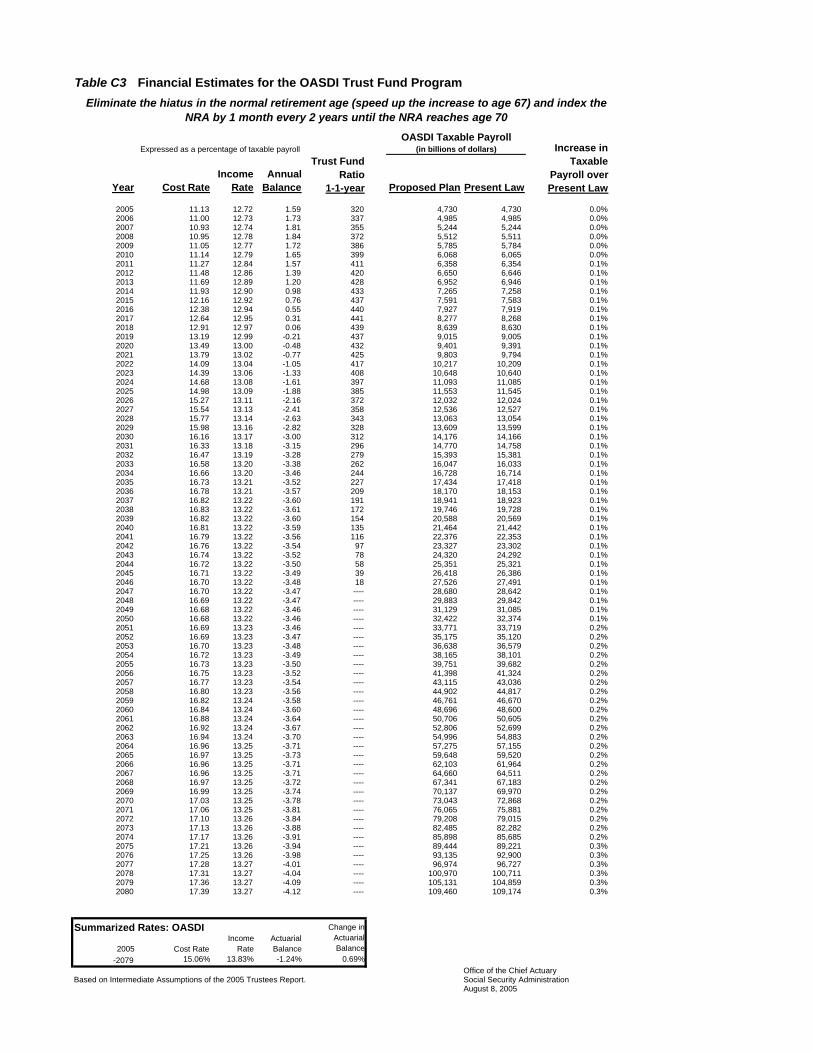
Table C3 Financial Estimates for the OASDI Trust Fund Program
Year Cost RateIncome
RateAnnual
Balance Proposed Plan Present Law
2005 11.13 12.72 1.59 320 4,730 4,730 0.0%2006 11.00 12.73 1.73 337 4,985 4,985 0.0%2007 10.93 12.74 1.81 355 5,244 5,244 0.0%2008 10.95 12.78 1.84 372 5,512 5,511 0.0%2009 11.05 12.77 1.72 386 5,785 5,784 0.0%2010 11.14 12.79 1.65 399 6,068 6,065 0.0%2011 11.27 12.84 1.57 411 6,358 6,354 0.1%2012 11.48 12.86 1.39 420 6,650 6,646 0.1%2013 11.69 12.89 1.20 428 6,952 6,946 0.1%2014 11.93 12.90 0.98 433 7,265 7,258 0.1%2015 12.16 12.92 0.76 437 7,591 7,583 0.1%2016 12.38 12.94 0.55 440 7,927 7,919 0.1%2017 12.64 12.95 0.31 441 8,277 8,268 0.1%2018 12.91 12.97 0.06 439 8,639 8,630 0.1%2019 13.19 12.99 -0.21 437 9,015 9,005 0.1%2020 13.49 13.00 -0.48 432 9,401 9,391 0.1%2021 13.79 13.02 -0.77 425 9,803 9,794 0.1%2022 14.09 13.04 -1.05 417 10,217 10,209 0.1%2023 14.39 13.06 -1.33 408 10,648 10,640 0.1%2024 14.68 13.08 -1.61 397 11,093 11,085 0.1%2025 14.98 13.09 -1.88 385 11,553 11,545 0.1%2026 15.27 13.11 -2.16 372 12,032 12,024 0.1%2027 15.54 13.13 -2.41 358 12,536 12,527 0.1%2028 15.77 13.14 -2.63 343 13,063 13,054 0.1%2029 15.98 13.16 -2.82 328 13,609 13,599 0.1%2030 16.16 13.17 -3.00 312 14,176 14,166 0.1%2031 16.33 13.18 -3.15 296 14,770 14,758 0.1%2032 16.47 13.19 -3.28 279 15,393 15,381 0.1%2033 16.58 13.20 -3.38 262 16,047 16,033 0.1%2034 16.66 13.20 -3.46 244 16,728 16,714 0.1%2035 16.73 13.21 -3.52 227 17,434 17,418 0.1%2036 16.78 13.21 -3.57 209 18,170 18,153 0.1%2037 16.82 13.22 -3.60 191 18,941 18,923 0.1%2038 16.83 13.22 -3.61 172 19,746 19,728 0.1%2039 16.82 13.22 -3.60 154 20,588 20,569 0.1%2040 16.81 13.22 -3.59 135 21,464 21,442 0.1%2041 16.79 13.22 -3.56 116 22,376 22,353 0.1%2042 16.76 13.22 -3.54 97 23,327 23,302 0.1%2043 16.74 13.22 -3.52 78 24,320 24,292 0.1%2044 16.72 13.22 -3.50 58 25,351 25,321 0.1%2045 16.71 13.22 -3.49 39 26,418 26,386 0.1%2046 16.70 13.22 -3.48 18 27,526 27,491 0.1%2047 16.70 13.22 -3.47 ---- 28,680 28,642 0.1%2048 16.69 13.22 -3.47 ---- 29,883 29,842 0.1%2049 16.68 13.22 -3.46 ---- 31,129 31,085 0.1%2050 16.68 13.22 -3.46 ---- 32,422 32,374 0.1%2051 16.69 13.23 -3.46 ---- 33,771 33,719 0.2%2052 16.69 13.23 -3.47 ---- 35,175 35,120 0.2%2053 16.70 13.23 -3.48 ---- 36,638 36,579 0.2%2054 16.72 13.23 -3.49 ---- 38,165 38,101 0.2%2055 16.73 13.23 -3.50 ---- 39,751 39,682 0.2%2056 16.75 13.23 -3.52 ---- 41,398 41,324 0.2%2057 16.77 13.23 -3.54 ---- 43,115 43,036 0.2%2058 16.80 13.23 -3.56 ---- 44,902 44,817 0.2%2059 16.82 13.24 -3.58 ---- 46,761 46,670 0.2%2060 16.84 13.24 -3.60 ---- 48,696 48,600 0.2%2061 16.88 13.24 -3.64 ---- 50,706 50,605 0.2%2062 16.92 13.24 -3.67 ---- 52,806 52,699 0.2%2063 16.94 13.24 -3.70 ---- 54,996 54,883 0.2%2064 16.96 13.25 -3.71 ---- 57,275 57,155 0.2%2065 16.97 13.25 -3.73 ---- 59,648 59,520 0.2%2066 16.96 13.25 -3.71 ---- 62,103 61,964 0.2%2067 16.96 13.25 -3.71 ---- 64,660 64,511 0.2%2068 16.97 13.25 -3.72 ---- 67,341 67,183 0.2%2069 16.99 13.25 -3.74 ---- 70,137 69,970 0.2%2070 17.03 13.25 -3.78 ---- 73,043 72,868 0.2%2071 17.06 13.25 -3.81 ---- 76,065 75,881 0.2%2072 17.10 13.26 -3.84 ---- 79,208 79,015 0.2%2073 17.13 13.26 -3.88 ---- 82,485 82,282 0.2%2074 17.17 13.26 -3.91 ---- 85,898 85,685 0.2%2075 17.21 13.26 -3.94 ---- 89,444 89,221 0.3%2076 17.25 13.26 -3.98 ---- 93,135 92,900 0.3%2077 17.28 13.27 -4.01 ---- 96,974 96,727 0.3%2078 17.31 13.27 -4.04 ---- 100,970 100,711 0.3%2079 17.36 13.27 -4.09 ---- 105,131 104,859 0.3%2080 17.39 13.27 -4.12 ---- 109,460 109,174 0.3%
Summarized Rates: OASDI
2005 Cost RateIncome
RateActuarial Balance
-2079 15.06% 13.83% -1.24% 0.69%Office of the Chief Actuary
Based on Intermediate Assumptions of the 2005 Trustees Report. Social Security AdministrationAugust 8, 2005
Change inActuarialBalance
Eliminate the hiatus in the normal retirement age (speed up the increase to age 67) and index the NRA by 1 month every 2 years until the NRA reaches age 70
OASDI Taxable Payroll (in billions of dollars) Increase in
Taxable Payroll over Present Law
Expressed as a percentage of taxable payrollTrust Fund
Ratio 1-1-year

Table D1 Financial Estimates for the OASDI Trust Fund Program
Year Cost RateIncome
RateAnnual
Balance
2005 11.13 12.72 1.59 3202006 11.00 14.73 3.73 3372007 10.94 14.74 3.80 3722008 10.98 14.78 3.80 4052009 11.12 14.77 3.65 4352010 11.25 14.79 3.55 4632011 11.42 14.84 3.43 4902012 11.66 14.87 3.21 5122013 11.93 14.90 2.98 5322014 12.21 14.92 2.71 5482015 12.48 14.94 2.45 5632016 12.78 14.96 2.18 5752017 13.09 14.98 1.89 5852018 13.39 15.00 1.60 5932019 13.70 15.01 1.31 5992020 14.02 15.03 1.01 6032021 14.34 15.05 0.71 6062022 14.65 15.07 0.42 6072023 14.95 15.09 0.14 6072024 15.25 15.11 -0.14 6062025 15.54 15.12 -0.42 6032026 15.83 15.14 -0.69 5992027 16.09 15.16 -0.94 5952028 16.33 15.17 -1.16 5902029 16.54 15.19 -1.36 5852030 16.74 15.20 -1.54 5802031 16.92 15.21 -1.71 5742032 17.07 15.22 -1.85 5682033 17.20 15.23 -1.97 5622034 17.29 15.24 -2.05 5562035 17.37 15.24 -2.12 5512036 17.43 15.25 -2.18 5452037 17.47 15.25 -2.22 5402038 17.50 15.26 -2.24 5352039 17.51 15.26 -2.25 5312040 17.51 15.26 -2.25 5262041 17.52 15.26 -2.26 5212042 17.53 15.27 -2.26 5172043 17.53 15.27 -2.26 5122044 17.54 15.27 -2.27 5072045 17.54 15.27 -2.27 5022046 17.56 15.27 -2.29 4972047 17.57 15.27 -2.30 4912048 17.59 15.28 -2.32 4862049 17.61 15.28 -2.33 4802050 17.64 15.28 -2.36 4742051 17.67 15.28 -2.39 4682052 17.71 15.29 -2.42 4622053 17.75 15.29 -2.46 4552054 17.79 15.29 -2.50 4472055 17.84 15.30 -2.54 4402056 17.89 15.30 -2.59 4312057 17.94 15.30 -2.64 4232058 18.00 15.31 -2.69 4142059 18.05 15.31 -2.74 4052060 18.10 15.31 -2.79 3962061 18.15 15.32 -2.84 3862062 18.21 15.32 -2.89 3762063 18.27 15.32 -2.95 3652064 18.33 15.33 -3.01 3542065 18.39 15.33 -3.06 3432066 18.45 15.34 -3.12 3312067 18.51 15.34 -3.17 3192068 18.57 15.34 -3.23 3062069 18.62 15.35 -3.27 2932070 18.67 15.35 -3.32 2802071 18.72 15.35 -3.36 2662072 18.76 15.36 -3.41 2522073 18.81 15.36 -3.45 2382074 18.85 15.36 -3.49 2232075 18.89 15.36 -3.53 2082076 18.94 15.37 -3.57 1932077 18.98 15.37 -3.61 1772078 19.03 15.37 -3.66 1602079 19.07 15.37 -3.70 1442080 19.12 15.38 -3.74 127
Summarized Rates: OASDI
2005 Cost RateIncome
RateActuarial Balance
-2079 15.79% 15.82% 0.04% 1.96%Office of the Chief Actuary
Based on Intermediate Assumptions of the 2005 Trustees Report. Social Security AdministrationAugust 8, 2005
Change inActuarialBalance
Raise the combined employer/employee tax rate by 2.0 percentage points in 2006 and later
Expressed as a percentage of taxable payrollTrust Fund
Ratio 1-1-year
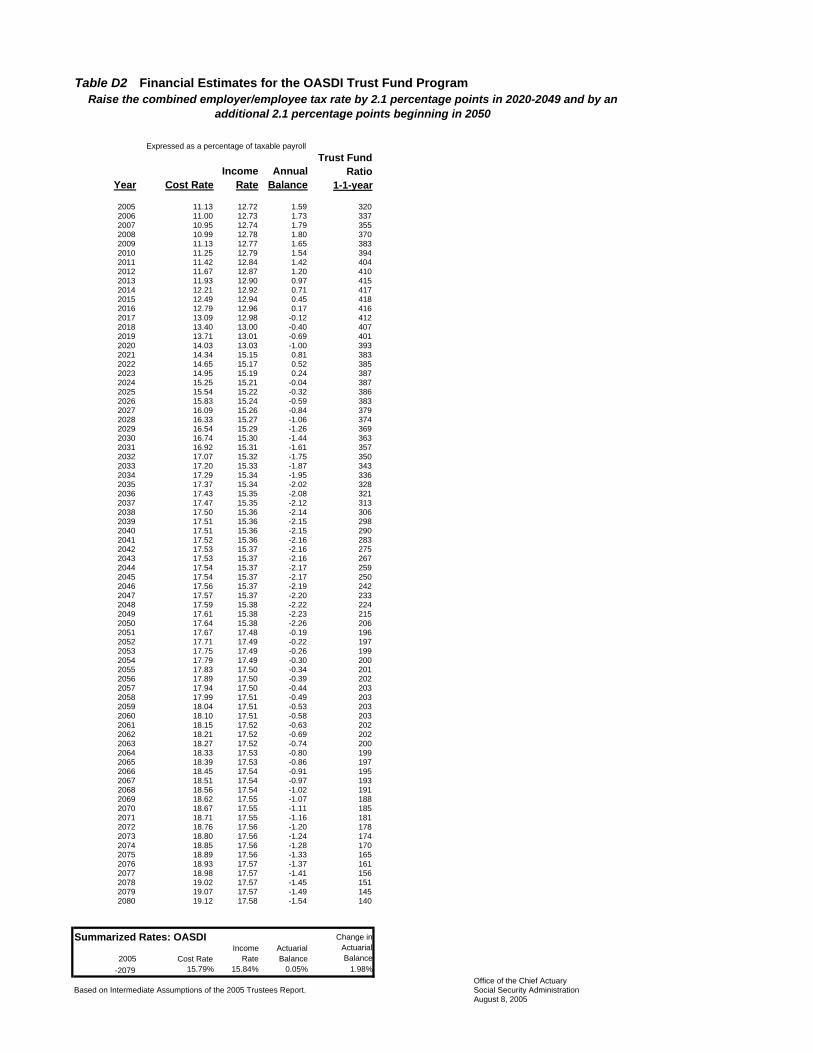
Table D2 Financial Estimates for the OASDI Trust Fund Program
Year Cost RateIncome
RateAnnual
Balance
2005 11.13 12.72 1.59 3202006 11.00 12.73 1.73 3372007 10.95 12.74 1.79 3552008 10.99 12.78 1.80 3702009 11.13 12.77 1.65 3832010 11.25 12.79 1.54 3942011 11.42 12.84 1.42 4042012 11.67 12.87 1.20 4102013 11.93 12.90 0.97 4152014 12.21 12.92 0.71 4172015 12.49 12.94 0.45 4182016 12.79 12.96 0.17 4162017 13.09 12.98 -0.12 4122018 13.40 13.00 -0.40 4072019 13.71 13.01 -0.69 4012020 14.03 13.03 -1.00 3932021 14.34 15.15 0.81 3832022 14.65 15.17 0.52 3852023 14.95 15.19 0.24 3872024 15.25 15.21 -0.04 3872025 15.54 15.22 -0.32 3862026 15.83 15.24 -0.59 3832027 16.09 15.26 -0.84 3792028 16.33 15.27 -1.06 3742029 16.54 15.29 -1.26 3692030 16.74 15.30 -1.44 3632031 16.92 15.31 -1.61 3572032 17.07 15.32 -1.75 3502033 17.20 15.33 -1.87 3432034 17.29 15.34 -1.95 3362035 17.37 15.34 -2.02 3282036 17.43 15.35 -2.08 3212037 17.47 15.35 -2.12 3132038 17.50 15.36 -2.14 3062039 17.51 15.36 -2.15 2982040 17.51 15.36 -2.15 2902041 17.52 15.36 -2.16 2832042 17.53 15.37 -2.16 2752043 17.53 15.37 -2.16 2672044 17.54 15.37 -2.17 2592045 17.54 15.37 -2.17 2502046 17.56 15.37 -2.19 2422047 17.57 15.37 -2.20 2332048 17.59 15.38 -2.22 2242049 17.61 15.38 -2.23 2152050 17.64 15.38 -2.26 2062051 17.67 17.48 -0.19 1962052 17.71 17.49 -0.22 1972053 17.75 17.49 -0.26 1992054 17.79 17.49 -0.30 2002055 17.83 17.50 -0.34 2012056 17.89 17.50 -0.39 2022057 17.94 17.50 -0.44 2032058 17.99 17.51 -0.49 2032059 18.04 17.51 -0.53 2032060 18.10 17.51 -0.58 2032061 18.15 17.52 -0.63 2022062 18.21 17.52 -0.69 2022063 18.27 17.52 -0.74 2002064 18.33 17.53 -0.80 1992065 18.39 17.53 -0.86 1972066 18.45 17.54 -0.91 1952067 18.51 17.54 -0.97 1932068 18.56 17.54 -1.02 1912069 18.62 17.55 -1.07 1882070 18.67 17.55 -1.11 1852071 18.71 17.55 -1.16 1812072 18.76 17.56 -1.20 1782073 18.80 17.56 -1.24 1742074 18.85 17.56 -1.28 1702075 18.89 17.56 -1.33 1652076 18.93 17.57 -1.37 1612077 18.98 17.57 -1.41 1562078 19.02 17.57 -1.45 1512079 19.07 17.57 -1.49 1452080 19.12 17.58 -1.54 140
Summarized Rates: OASDI
2005 Cost RateIncome
RateActuarial Balance
-2079 15.79% 15.84% 0.05% 1.98%Office of the Chief Actuary
Based on Intermediate Assumptions of the 2005 Trustees Report. Social Security AdministrationAugust 8, 2005
Change inActuarialBalance
Raise the combined employer/employee tax rate by 2.1 percentage points in 2020-2049 and by an additional 2.1 percentage points beginning in 2050
Expressed as a percentage of taxable payrollTrust Fund
Ratio 1-1-year

Table D3 Financial Estimates for the OASDI Trust Fund Program
Year Cost RateIncome
RateAnnual
Balance
2005 11.13 12.72 1.59 3202006 11.00 12.81 1.81 3372007 10.95 12.86 1.91 3562008 10.99 12.94 1.96 3722009 11.12 12.97 1.85 3862010 11.25 13.04 1.79 3992011 11.42 13.19 1.77 4112012 11.67 13.27 1.60 4202013 11.93 13.34 1.41 4282014 12.21 13.38 1.17 4342015 12.49 13.41 0.93 4382016 12.78 13.43 0.65 4392017 13.09 13.45 0.36 4392018 13.40 13.46 0.07 4372019 13.71 13.48 -0.23 4342020 14.03 13.49 -0.53 4292021 14.34 13.51 -0.83 4222022 14.65 13.52 -1.13 4142023 14.95 13.53 -1.42 4042024 15.25 13.54 -1.70 3942025 15.54 13.56 -1.99 3822026 15.83 13.57 -2.27 3692027 16.10 13.58 -2.52 3542028 16.33 13.58 -2.75 3402029 16.55 13.59 -2.96 3242030 16.74 13.59 -3.15 3082031 16.92 13.59 -3.33 2912032 17.08 13.59 -3.48 2742033 17.20 13.59 -3.61 2562034 17.30 13.59 -3.70 2382035 17.37 13.59 -3.79 2202036 17.43 13.58 -3.85 2012037 17.48 13.58 -3.90 1822038 17.50 13.57 -3.93 1622039 17.51 13.56 -3.95 1432040 17.52 13.56 -3.96 1232041 17.52 13.55 -3.97 1022042 17.53 13.55 -3.98 812043 17.53 13.55 -3.98 602044 17.54 13.55 -3.99 382045 17.55 13.55 -3.99 162046 17.56 13.56 -4.00 ----2047 17.58 13.56 -4.02 ----2048 17.60 13.56 -4.03 ----2049 17.62 13.57 -4.05 ----2050 17.64 13.57 -4.07 ----2051 17.68 13.57 -4.11 ----2052 17.71 13.57 -4.14 ----2053 17.75 13.58 -4.18 ----2054 17.80 13.58 -4.22 ----2055 17.84 13.58 -4.26 ----2056 17.89 13.59 -4.31 ----2057 17.95 13.59 -4.36 ----2058 18.00 13.59 -4.41 ----2059 18.05 13.59 -4.46 ----2060 18.10 13.60 -4.51 ----2061 18.16 13.60 -4.56 ----2062 18.22 13.60 -4.62 ----2063 18.28 13.60 -4.68 ----2064 18.34 13.60 -4.74 ----2065 18.40 13.61 -4.79 ----2066 18.46 13.61 -4.85 ----2067 18.52 13.61 -4.91 ----2068 18.57 13.62 -4.96 ----2069 18.63 13.62 -5.01 ----2070 18.67 13.62 -5.06 ----2071 18.72 13.62 -5.10 ----2072 18.77 13.62 -5.15 ----2073 18.81 13.62 -5.19 ----2074 18.85 13.63 -5.23 ----2075 18.90 13.63 -5.27 ----2076 18.94 13.63 -5.31 ----2077 18.99 13.64 -5.35 ----2078 19.03 13.64 -5.39 ----2079 19.08 13.64 -5.43 ----2080 19.12 13.65 -5.48 ----
Summarized Rates: OASDI
2005 Cost RateIncome
RateActuarial Balance
-2079 15.79% 14.20% -1.60% 0.33%Office of the Chief Actuary
Based on Intermediate Assumptions of the 2005 Trustees Report. Social Security AdministrationAugust 8, 2005
Change inActuarialBalance
Tax Social Security benefits in a manner similar to private pension income beginning in 2006. Phase out the lower-income thresholds during 2006-2015
Expressed as a percentage of taxable payrollTrust Fund
Ratio 1-1-year

Table E1 Financial Estimates for the OASDI Trust Fund Program
Year Cost RateIncome
RateAnnual
Balance Proposed Plan Present Law
2005 11.13 12.72 1.59 320 4,730 4,730 0.0%2006 9.35 12.68 3.33 337 5,861 4,985 17.6%2007 9.29 12.69 3.40 373 6,177 5,244 17.8%2008 9.32 12.73 3.41 408 6,500 5,511 17.9%2009 9.42 12.71 3.29 440 6,828 5,784 18.1%2010 9.52 12.73 3.21 470 7,166 6,065 18.1%2011 9.66 12.77 3.12 499 7,515 6,354 18.3%2012 9.85 12.80 2.95 523 7,870 6,646 18.4%2013 10.07 12.82 2.76 545 8,233 6,946 18.5%2014 10.30 12.84 2.54 564 8,607 7,258 18.6%2015 10.53 12.85 2.32 581 8,994 7,583 18.6%2016 10.78 12.87 2.09 595 9,392 7,919 18.6%2017 11.04 12.89 1.85 607 9,807 8,268 18.6%2018 11.30 12.90 1.61 617 10,236 8,630 18.6%2019 11.56 12.92 1.36 625 10,682 9,005 18.6%2020 11.83 12.93 1.11 631 11,141 9,391 18.6%2021 12.09 12.95 0.86 635 11,619 9,794 18.6%2022 12.35 12.97 0.61 639 12,112 10,209 18.6%2023 12.60 12.98 0.38 640 12,624 10,640 18.7%2024 12.85 12.99 0.14 641 13,152 11,085 18.7%2025 13.10 13.01 -0.09 640 13,699 11,545 18.7%2026 13.34 13.02 -0.32 638 14,268 12,024 18.7%2027 13.57 13.04 -0.53 636 14,867 12,527 18.7%2028 13.76 13.05 -0.71 633 15,492 13,054 18.7%2029 13.94 13.06 -0.88 630 16,140 13,599 18.7%2030 14.11 13.07 -1.03 626 16,814 14,166 18.7%2031 14.26 13.08 -1.17 623 17,518 14,758 18.7%2032 14.39 13.09 -1.30 619 18,258 15,381 18.7%2033 14.49 13.10 -1.39 615 19,034 16,033 18.7%2034 14.57 13.11 -1.46 612 19,843 16,714 18.7%2035 14.63 13.11 -1.52 609 20,680 17,418 18.7%2036 14.68 13.12 -1.57 606 21,554 18,153 18.7%2037 14.72 13.12 -1.60 603 22,469 18,923 18.7%2038 14.74 13.12 -1.62 601 23,426 19,728 18.7%2039 14.75 13.12 -1.62 599 24,425 20,569 18.8%2040 14.75 13.13 -1.63 598 25,464 21,442 18.8%2041 14.76 13.13 -1.63 596 26,546 22,353 18.8%2042 14.76 13.13 -1.63 594 27,675 23,302 18.8%2043 14.76 13.13 -1.63 592 28,853 24,292 18.8%2044 14.77 13.13 -1.64 590 30,077 25,321 18.8%2045 14.77 13.13 -1.64 588 31,343 26,386 18.8%2046 14.78 13.13 -1.65 587 32,657 27,491 18.8%2047 14.80 13.14 -1.66 584 34,027 28,642 18.8%2048 14.81 13.14 -1.67 582 35,453 29,842 18.8%2049 14.83 13.14 -1.69 580 36,933 31,085 18.8%2050 14.85 13.14 -1.71 577 38,466 32,374 18.8%2051 14.88 13.14 -1.73 574 40,066 33,719 18.8%2052 14.91 13.15 -1.76 571 41,733 35,120 18.8%2053 14.94 13.15 -1.79 568 43,469 36,579 18.8%2054 14.97 13.15 -1.82 564 45,281 38,101 18.8%2055 15.01 13.15 -1.86 559 47,162 39,682 18.9%2056 15.06 13.16 -1.90 555 49,116 41,324 18.9%2057 15.10 13.16 -1.94 550 51,154 43,036 18.9%2058 15.14 13.16 -1.98 545 53,275 44,817 18.9%2059 15.19 13.17 -2.02 539 55,481 46,670 18.9%2060 15.23 13.17 -2.06 534 57,777 48,600 18.9%2061 15.27 13.17 -2.10 528 60,165 50,605 18.9%2062 15.32 13.17 -2.15 521 62,658 52,699 18.9%2063 15.37 13.18 -2.19 514 65,259 54,883 18.9%2064 15.42 13.18 -2.24 507 67,965 57,155 18.9%2065 15.47 13.18 -2.29 500 70,781 59,520 18.9%2066 15.52 13.19 -2.33 492 73,692 61,964 18.9%2067 15.57 13.19 -2.38 484 76,725 64,511 18.9%2068 15.62 13.19 -2.42 475 79,908 67,183 18.9%2069 15.66 13.20 -2.46 466 83,228 69,970 18.9%2070 15.70 13.20 -2.50 457 86,679 72,868 19.0%2071 15.74 13.20 -2.54 448 90,269 75,881 19.0%2072 15.78 13.20 -2.57 438 94,003 79,015 19.0%2073 15.81 13.21 -2.61 429 97,896 82,282 19.0%2074 15.85 13.21 -2.64 418 101,950 85,685 19.0%2075 15.88 13.21 -2.67 408 106,164 89,221 19.0%2076 15.92 13.21 -2.71 397 110,548 92,900 19.0%2077 15.96 13.21 -2.74 386 115,109 96,727 19.0%2078 15.99 13.22 -2.78 375 119,858 100,711 19.0%2079 16.03 13.22 -2.81 363 124,802 104,859 19.0%2080 16.07 13.22 -2.85 351 129,946 109,174 19.0%
Summarized Rates: OASDI
2005 Cost RateIncome
RateActuarial Balance
-2079 13.35% 13.64% 0.28% 2.21%Office of the Chief Actuary
Based on Intermediate Assumptions of the 2005 Trustees Report. Social Security AdministrationAugust 8, 2005
Change inActuarialBalance
Eliminate the taxable maximum, beginning in 2006, for payroll tax but retain the taxable maximum for benefit calculations
OASDI Taxable Payroll (in billions of dollars) Increase in
Taxable Payroll over Present Law
Expressed as a percentage of taxable payrollTrust Fund
Ratio 1-1-year

Table E2 Financial Estimates for the OASDI Trust Fund Program
Year Cost RateIncome
RateAnnual
Balance Proposed Plan Present Law
2005 11.13 12.72 1.59 320 4,730 4,730 0.0%2006 9.35 12.68 3.33 337 5,861 4,985 17.6%2007 9.29 12.69 3.40 373 6,177 5,244 17.8%2008 9.31 12.73 3.41 408 6,500 5,511 17.9%2009 9.43 12.72 3.29 440 6,828 5,784 18.1%2010 9.53 12.73 3.20 470 7,166 6,065 18.1%2011 9.67 12.78 3.10 498 7,515 6,354 18.3%2012 9.88 12.80 2.93 522 7,870 6,646 18.4%2013 10.10 12.83 2.73 543 8,233 6,946 18.5%2014 10.34 12.84 2.50 561 8,607 7,258 18.6%2015 10.59 12.86 2.27 576 8,994 7,583 18.6%2016 10.85 12.88 2.02 589 9,392 7,919 18.6%2017 11.13 12.90 1.77 600 9,807 8,268 18.6%2018 11.40 12.92 1.51 608 10,236 8,630 18.6%2019 11.68 12.93 1.25 614 10,682 9,005 18.6%2020 11.97 12.95 0.98 619 11,141 9,391 18.6%2021 12.26 12.97 0.71 622 11,619 9,794 18.6%2022 12.54 12.99 0.45 623 12,112 10,209 18.6%2023 12.81 13.01 0.19 622 12,624 10,640 18.7%2024 13.09 13.02 -0.06 621 13,152 11,085 18.7%2025 13.36 13.04 -0.32 618 13,699 11,545 18.7%2026 13.62 13.06 -0.56 613 14,268 12,024 18.7%2027 13.87 13.08 -0.79 608 14,867 12,527 18.7%2028 14.09 13.09 -1.00 602 15,492 13,054 18.7%2029 14.29 13.11 -1.19 597 16,140 13,599 18.7%2030 14.48 13.12 -1.36 590 16,814 14,166 18.7%2031 14.66 13.13 -1.52 584 17,518 14,758 18.7%2032 14.81 13.15 -1.66 576 18,258 15,381 18.7%2033 14.94 13.16 -1.78 569 19,034 16,033 18.7%2034 15.03 13.16 -1.87 563 19,843 16,714 18.7%2035 15.12 13.17 -1.95 556 20,680 17,418 18.7%2036 15.19 13.18 -2.01 550 21,554 18,153 18.7%2037 15.25 13.19 -2.06 543 22,469 18,923 18.7%2038 15.29 13.19 -2.10 537 23,426 19,728 18.7%2039 15.31 13.20 -2.12 531 24,425 20,569 18.8%2040 15.34 13.20 -2.14 524 25,464 21,442 18.8%2041 15.36 13.20 -2.16 518 26,546 22,353 18.8%2042 15.38 13.21 -2.18 511 27,675 23,302 18.8%2043 15.40 13.21 -2.19 505 28,853 24,292 18.8%2044 15.42 13.21 -2.21 498 30,077 25,321 18.8%2045 15.45 13.22 -2.23 491 31,343 26,386 18.8%2046 15.48 13.22 -2.26 483 32,657 27,491 18.8%2047 15.51 13.22 -2.28 476 34,027 28,642 18.8%2048 15.54 13.23 -2.31 468 35,453 29,842 18.8%2049 15.57 13.23 -2.34 460 36,933 31,085 18.8%2050 15.61 13.24 -2.37 452 38,466 32,374 18.8%2051 15.65 13.24 -2.41 443 40,066 33,719 18.8%2052 15.69 13.24 -2.45 434 41,733 35,120 18.8%2053 15.74 13.25 -2.49 424 43,469 36,579 18.8%2054 15.79 13.25 -2.53 414 45,281 38,101 18.8%2055 15.83 13.26 -2.58 404 47,162 39,682 18.9%2056 15.89 13.26 -2.63 393 49,116 41,324 18.9%2057 15.94 13.27 -2.68 382 51,154 43,036 18.9%2058 16.00 13.27 -2.73 370 53,275 44,817 18.9%2059 16.05 13.27 -2.77 359 55,481 46,670 18.9%2060 16.10 13.28 -2.82 346 57,777 48,600 18.9%2061 16.15 13.28 -2.87 334 60,165 50,605 18.9%2062 16.21 13.29 -2.92 321 62,658 52,699 18.9%2063 16.26 13.29 -2.97 307 65,259 54,883 18.9%2064 16.32 13.29 -3.02 293 67,965 57,155 18.9%2065 16.37 13.30 -3.07 278 70,781 59,520 18.9%2066 16.43 13.30 -3.13 264 73,692 61,964 18.9%2067 16.48 13.31 -3.18 248 76,725 64,511 18.9%2068 16.53 13.31 -3.23 233 79,908 67,183 18.9%2069 16.58 13.31 -3.27 217 83,228 69,970 18.9%2070 16.63 13.32 -3.31 200 86,679 72,868 19.0%2071 16.67 13.32 -3.35 183 90,269 75,881 19.0%2072 16.71 13.32 -3.39 166 94,003 79,015 19.0%2073 16.75 13.32 -3.42 148 97,896 82,282 19.0%2074 16.79 13.33 -3.46 130 101,950 85,685 19.0%2075 16.82 13.33 -3.50 112 106,164 89,221 19.0%2076 16.86 13.33 -3.53 93 110,548 92,900 19.0%2077 16.90 13.33 -3.57 73 115,109 96,727 19.0%2078 16.94 13.34 -3.61 54 119,858 100,711 19.0%2079 16.98 13.34 -3.64 33 124,802 104,859 19.0%2080 17.02 13.34 -3.68 13 129,946 109,174 19.0%
Summarized Rates: OASDI
2005 Cost RateIncome
RateActuarial Balance
-2079 13.80% 13.69% -0.10% 1.82%Office of the Chief Actuary
Based on Intermediate Assumptions of the 2005 Trustees Report. Social Security AdministrationAugust 8, 2005
Change in ActuarialBalance
Eliminate the taxable maximum for payroll tax and for benefit calculationsOASDI Taxable Payroll
(in billions of dollars) Increase in Taxable
Payroll over Present Law
Expressed as a percentage of taxable payrollTrust Fund
Ratio 1-1-year

Table E3 Financial Estimates for the OASDI Trust Fund Program
Year Cost RateIncome
RateAnnual
Balance Proposed Plan Present Law
2005 11.13 12.72 1.59 320 4,730 4,730 0.0%2006 10.87 12.72 1.86 337 5,045 4,985 1.2%2007 10.70 12.74 2.04 356 5,366 5,244 2.3%2008 10.63 12.77 2.14 374 5,695 5,511 3.3%2009 10.67 12.76 2.08 390 6,029 5,784 4.2%2010 10.71 12.77 2.07 406 6,373 6,065 5.1%2011 10.79 12.82 2.02 421 6,725 6,354 5.8%2012 10.95 12.85 1.89 433 7,082 6,646 6.6%2013 11.14 12.87 1.74 444 7,448 6,946 7.2%2014 11.33 12.88 1.55 453 7,828 7,258 7.8%2015 11.53 12.90 1.37 460 8,225 7,583 8.5%2016 11.80 12.92 1.11 466 8,592 7,919 8.5%2017 12.09 12.93 0.84 469 8,968 8,268 8.5%2018 12.38 12.95 0.57 471 9,365 8,630 8.5%2019 12.67 12.97 0.30 471 9,776 9,005 8.6%2020 12.97 12.99 0.02 469 10,197 9,391 8.6%2021 13.26 13.01 -0.26 466 10,635 9,794 8.6%2022 13.56 13.03 -0.53 461 11,085 10,209 8.6%2023 13.85 13.04 -0.80 454 11,552 10,640 8.6%2024 14.13 13.06 -1.07 447 12,037 11,085 8.6%2025 14.40 13.08 -1.33 438 12,543 11,545 8.6%2026 14.67 13.09 -1.58 428 13,069 12,024 8.7%2027 14.93 13.11 -1.82 417 13,618 12,527 8.7%2028 15.16 13.13 -2.03 405 14,188 13,054 8.7%2029 15.37 13.14 -2.23 393 14,778 13,599 8.7%2030 15.56 13.15 -2.40 380 15,397 14,166 8.7%2031 15.74 13.17 -2.57 367 16,044 14,758 8.7%2032 15.89 13.18 -2.71 353 16,720 15,381 8.7%2033 16.03 13.19 -2.84 339 17,420 16,033 8.7%2034 16.12 13.20 -2.93 325 18,160 16,714 8.7%2035 16.20 13.20 -3.00 311 18,932 17,418 8.7%2036 16.27 13.21 -3.06 296 19,734 18,153 8.7%2037 16.32 13.22 -3.10 281 20,572 18,923 8.7%2038 16.36 13.22 -3.14 266 21,440 19,728 8.7%2039 16.38 13.22 -3.15 251 22,356 20,569 8.7%2040 16.39 13.23 -3.16 235 23,311 21,442 8.7%2041 16.41 13.23 -3.18 220 24,306 22,353 8.7%2042 16.43 13.23 -3.19 204 25,338 23,302 8.7%2043 16.45 13.24 -3.21 187 26,406 24,292 8.7%2044 16.46 13.24 -3.22 171 27,525 25,321 8.7%2045 16.48 13.24 -3.24 154 28,691 26,386 8.7%2046 16.50 13.25 -3.26 137 29,899 27,491 8.8%2047 16.53 13.25 -3.28 119 31,154 28,642 8.8%2048 16.56 13.25 -3.30 101 32,458 29,842 8.8%2049 16.59 13.26 -3.33 83 33,811 31,085 8.8%2050 16.62 13.26 -3.36 64 35,221 32,374 8.8%2051 16.66 13.26 -3.40 45 36,690 33,719 8.8%2052 16.71 13.27 -3.44 26 38,212 35,120 8.8%2053 16.76 13.27 -3.49 6 39,793 36,579 8.8%2054 16.81 13.28 -3.53 ---- 41,446 38,101 8.8%2055 16.86 13.28 -3.58 ---- 43,170 39,682 8.8%2056 16.92 13.28 -3.63 ---- 44,961 41,324 8.8%2057 16.97 13.29 -3.68 ---- 46,824 43,036 8.8%2058 17.03 13.29 -3.74 ---- 48,757 44,817 8.8%2059 17.09 13.30 -3.79 ---- 50,768 46,670 8.8%2060 17.14 13.30 -3.84 ---- 52,873 48,600 8.8%2061 17.20 13.31 -3.89 ---- 55,055 50,605 8.8%2062 17.26 13.31 -3.95 ---- 57,334 52,699 8.8%2063 17.33 13.32 -4.01 ---- 59,703 54,883 8.8%2064 17.39 13.32 -4.07 ---- 62,171 57,155 8.8%2065 17.45 13.32 -4.12 ---- 64,746 59,520 8.8%2066 17.51 13.33 -4.18 ---- 67,406 61,964 8.8%2067 17.57 13.33 -4.24 ---- 70,176 64,511 8.8%2068 17.63 13.34 -4.29 ---- 73,080 67,183 8.8%2069 17.68 13.34 -4.34 ---- 76,111 69,970 8.8%2070 17.73 13.34 -4.38 ---- 79,266 72,868 8.8%2071 17.77 13.35 -4.42 ---- 82,547 75,881 8.8%2072 17.82 13.35 -4.47 ---- 85,961 79,015 8.8%2073 17.86 13.35 -4.51 ---- 89,521 82,282 8.8%2074 17.90 13.36 -4.54 ---- 93,224 85,685 8.8%2075 17.94 13.36 -4.58 ---- 97,073 89,221 8.8%2076 17.99 13.36 -4.62 ---- 101,080 92,900 8.8%2077 18.03 13.36 -4.66 ---- 105,250 96,727 8.8%2078 18.07 13.37 -4.70 ---- 109,591 100,711 8.8%2079 18.11 13.37 -4.74 ---- 114,111 104,859 8.8%2080 18.16 13.37 -4.78 ---- 118,814 109,174 8.8%
Summarized Rates: OASDI
2005 Cost RateIncome
RateActuarial Balance
-2079 14.88% 13.79% -1.09% 0.83%Office of the Chief Actuary
Based on Intermediate Assumptions of the 2005 Trustees Report. Social Security AdministrationAugust 8, 2005
Change inActuarialBalance
Make 90 percent of the earnings subject to payroll tax and credit them for benefit purposes, phased in 2006-2015
OASDI Taxable Payroll (in billions of dollars) Increase in
Taxable Payroll over Present Law
Expressed as a percentage of taxable payrollTrust Fund
Ratio 1-1-year

Table F1 Financial Estimates for the OASDI Trust Fund Program
Year Cost RateIncome
RateAnnual
Balance Proposed Plan Present Law
2005 11.13 12.72 1.59 320 4,730 4,730 0.0%2006 10.97 12.73 1.76 337 4,996 4,985 0.2%2007 10.89 12.74 1.85 355 5,271 5,244 0.5%2008 10.90 12.78 1.88 371 5,554 5,511 0.8%2009 11.01 12.77 1.75 384 5,842 5,784 1.0%2010 11.12 12.79 1.67 397 6,139 6,065 1.2%2011 11.26 12.84 1.57 408 6,444 6,354 1.4%2012 11.49 12.87 1.38 416 6,751 6,646 1.6%2013 11.73 12.90 1.16 422 7,067 6,946 1.7%2014 11.99 12.91 0.92 425 7,394 7,258 1.9%2015 12.25 12.93 0.68 428 7,736 7,583 2.0%2016 12.52 12.95 0.42 428 8,089 7,919 2.1%2017 12.81 12.96 0.15 426 8,455 8,268 2.3%2018 13.10 12.98 -0.12 422 8,834 8,630 2.4%2019 13.39 13.00 -0.39 418 9,228 9,005 2.5%2020 13.69 13.02 -0.67 411 9,633 9,391 2.6%2021 13.99 13.04 -0.95 404 10,055 9,794 2.7%2022 14.28 13.05 -1.23 395 10,491 10,209 2.8%2023 14.57 13.07 -1.50 384 10,943 10,640 2.9%2024 14.85 13.09 -1.76 373 11,411 11,085 2.9%2025 15.12 13.10 -2.02 360 11,895 11,545 3.0%2026 15.40 13.12 -2.28 346 12,399 12,024 3.1%2027 15.65 13.14 -2.51 332 12,929 12,527 3.2%2028 15.87 13.15 -2.72 316 13,483 13,054 3.3%2029 16.07 13.16 -2.90 300 14,058 13,599 3.4%2030 16.25 13.18 -3.07 284 14,656 14,166 3.5%2031 16.42 13.19 -3.23 267 15,281 14,758 3.5%2032 16.57 13.20 -3.37 249 15,939 15,381 3.6%2033 16.68 13.21 -3.48 231 16,628 16,033 3.7%2034 16.77 13.21 -3.56 213 17,348 16,714 3.8%2035 16.84 13.22 -3.62 194 18,094 17,418 3.9%2036 16.91 13.22 -3.68 175 18,863 18,153 3.9%2037 16.96 13.23 -3.73 156 19,669 18,923 3.9%2038 16.99 13.23 -3.76 136 20,513 19,728 4.0%2039 17.01 13.24 -3.77 116 21,394 20,569 4.0%2040 17.02 13.24 -3.78 96 22,310 21,442 4.0%2041 17.04 13.24 -3.80 75 23,257 22,353 4.0%2042 17.07 13.24 -3.83 54 24,244 23,302 4.0%2043 17.09 13.24 -3.85 33 25,274 24,292 4.0%2044 17.11 13.25 -3.87 11 26,345 25,321 4.0%2045 17.14 13.25 -3.89 ---- 27,452 26,386 4.0%2046 17.17 13.25 -3.92 ---- 28,602 27,491 4.0%2047 17.21 13.26 -3.96 ---- 29,800 28,642 4.0%2048 17.25 13.26 -3.99 ---- 31,047 29,842 4.0%2049 17.29 13.26 -4.03 ---- 32,340 31,085 4.0%2050 17.33 13.26 -4.07 ---- 33,682 32,374 4.0%2051 17.38 13.27 -4.11 ---- 35,080 33,719 4.0%2052 17.44 13.27 -4.17 ---- 36,538 35,120 4.0%2053 17.50 13.28 -4.22 ---- 38,055 36,579 4.0%2054 17.56 13.28 -4.28 ---- 39,638 38,101 4.0%2055 17.62 13.28 -4.33 ---- 41,283 39,682 4.0%2056 17.69 13.29 -4.40 ---- 42,991 41,324 4.0%2057 17.75 13.29 -4.46 ---- 44,771 43,036 4.0%2058 17.82 13.30 -4.52 ---- 46,624 44,817 4.0%2059 17.89 13.30 -4.59 ---- 48,552 46,670 4.0%2060 17.95 13.31 -4.65 ---- 50,559 48,600 4.0%2061 18.02 13.31 -4.71 ---- 52,645 50,605 4.0%2062 18.09 13.31 -4.78 ---- 54,823 52,699 4.0%2063 18.16 13.32 -4.84 ---- 57,095 54,883 4.0%2064 18.23 13.32 -4.91 ---- 59,458 57,155 4.0%2065 18.30 13.33 -4.98 ---- 61,918 59,520 4.0%2066 18.37 13.33 -5.04 ---- 64,460 61,964 4.0%2067 18.44 13.34 -5.11 ---- 67,109 64,511 4.0%2068 18.51 13.34 -5.17 ---- 69,888 67,183 4.0%2069 18.57 13.34 -5.22 ---- 72,787 69,970 4.0%2070 18.62 13.35 -5.28 ---- 75,801 72,868 4.0%2071 18.68 13.35 -5.33 ---- 78,935 75,881 4.0%2072 18.73 13.35 -5.37 ---- 82,195 79,015 4.0%2073 18.78 13.36 -5.42 ---- 85,594 82,282 4.0%2074 18.83 13.36 -5.47 ---- 89,133 85,685 4.0%2075 18.88 13.36 -5.51 ---- 92,810 89,221 4.0%2076 18.93 13.37 -5.56 ---- 96,637 92,900 4.0%2077 18.97 13.37 -5.60 ---- 100,618 96,727 4.0%2078 19.02 13.37 -5.65 ---- 104,762 100,711 4.0%2079 19.07 13.37 -5.70 ---- 109,076 104,859 4.0%2080 19.12 13.38 -5.74 ---- 113,564 109,174 4.0%
Summarized Rates: OASDI
2005 Cost RateIncome
RateActuarial Balance
-2079 15.54% 13.84% -1.71% 0.22%Office of the Chief Actuary
Based on Intermediate Assumptions of the 2005 Trustees Report. Social Security AdministrationAugust 8, 2005
Change inActuarialBalance
Cover newly hired state and local government employees beginning in 2006OASDI Taxable Payroll
(in billions of dollars) Increase in Taxable
Payroll over Present Law
Expressed as a percentage of taxable payrollTrust Fund
Ratio 1-1-year

Table G1 Financial Estimates for the OASDI Trust Fund Program
Year Cost RateIncome
RateAnnual
Balance
2005 11.13 12.72 1.59 3202006 11.00 12.73 1.73 3372007 10.95 12.74 1.79 3552008 10.99 12.78 1.80 3712009 11.13 12.77 1.65 3852010 11.25 12.79 1.54 3982011 11.42 12.84 1.42 4092012 11.67 12.87 1.20 4182013 11.93 12.90 0.97 4252014 12.21 12.92 0.71 4302015 12.49 12.94 0.45 4342016 12.79 12.96 0.17 4362017 13.09 12.98 -0.12 4362018 13.40 13.00 -0.40 4362019 13.71 13.01 -0.69 4342020 14.03 13.03 -1.00 4312021 14.34 13.05 -1.29 4272022 14.65 13.07 -1.58 4212023 14.95 13.09 -1.87 4152024 15.25 13.11 -2.15 4072025 15.55 13.12 -2.42 3972026 15.83 13.14 -2.69 3872027 16.10 13.16 -2.94 3752028 16.34 13.17 -3.16 3632029 16.55 13.19 -3.36 3502030 16.74 13.20 -3.54 3362031 16.92 13.21 -3.71 3222032 17.08 13.22 -3.86 3072033 17.20 13.23 -3.97 2912034 17.30 13.24 -4.06 2752035 17.37 13.24 -4.13 2592036 17.44 13.25 -4.18 2422037 17.48 13.25 -4.22 2252038 17.50 13.26 -4.24 2072039 17.51 13.26 -4.25 1892040 17.52 13.26 -4.26 1702041 17.52 13.26 -4.26 1512042 17.53 13.27 -4.27 1312043 17.54 13.27 -4.27 1102044 17.54 13.27 -4.27 892045 17.55 13.27 -4.28 682046 17.56 13.27 -4.29 462047 17.58 13.27 -4.31 232048 17.60 13.28 -4.32 ----2049 17.62 13.28 -4.34 ----2050 17.64 13.28 -4.36 ----2051 17.68 13.28 -4.39 ----2052 17.71 13.29 -4.43 ----2053 17.75 13.29 -4.47 ----2054 17.80 13.29 -4.50 ----2055 17.84 13.30 -4.55 ----2056 17.89 13.30 -4.60 ----2057 17.95 13.30 -4.65 ----2058 18.00 13.31 -4.69 ----2059 18.05 13.31 -4.74 ----2060 18.10 13.31 -4.79 ----2061 18.16 13.32 -4.84 ----2062 18.22 13.32 -4.90 ----2063 18.28 13.32 -4.95 ----2064 18.34 13.33 -5.01 ----2065 18.40 13.33 -5.07 ----2066 18.46 13.34 -5.12 ----2067 18.52 13.34 -5.18 ----2068 18.57 13.34 -5.23 ----2069 18.63 13.35 -5.28 ----2070 18.67 13.35 -5.32 ----2071 18.72 13.35 -5.37 ----2072 18.77 13.36 -5.41 ----2073 18.81 13.36 -5.45 ----2074 18.85 13.36 -5.49 ----2075 18.90 13.36 -5.53 ----2076 18.94 13.37 -5.58 ----2077 18.99 13.37 -5.62 ----2078 19.03 13.37 -5.66 ----2079 19.08 13.37 -5.70 ----2080 19.12 13.38 -5.75 ----
Summarized Rates: OASDI
2004 Cost RateIncome
RateActuarial Balance
-2078 15.11% 14.07% -1.04% 0.88%Office of the Chief Actuary
Based on Intermediate Assumptions of the 2005 Trustees Report. Social Security AdministrationAugust 8, 2005
Change inActuarialBalance
Invest 40 percent of the Trust Funds in equities (phased in 2006-2020) assuming a 6.5 percent real rate of return on equities
Expressed as a percentage of taxable payrollTrust Fund
Ratio 1-1-year

Table G2 Financial Estimates for the OASDI Trust Fund Program
Year Cost RateIncome
RateAnnual
Balance
2005 11.13 12.72 1.59 3202006 11.00 12.73 1.73 3372007 10.95 12.74 1.79 3552008 10.99 12.78 1.80 3712009 11.13 12.77 1.65 3842010 11.25 12.79 1.54 3972011 11.42 12.84 1.42 4072012 11.67 12.87 1.20 4162013 11.93 12.90 0.97 4222014 12.21 12.92 0.71 4262015 12.49 12.94 0.45 4292016 12.79 12.96 0.17 4302017 13.09 12.98 -0.12 4292018 13.40 13.00 -0.40 4282019 13.71 13.01 -0.69 4242020 14.03 13.03 -1.00 4202021 14.34 13.05 -1.29 4142022 14.65 13.07 -1.58 4072023 14.95 13.09 -1.87 3982024 15.25 13.11 -2.15 3882025 15.55 13.12 -2.42 3772026 15.83 13.14 -2.69 3652027 16.10 13.16 -2.94 3522028 16.34 13.17 -3.16 3382029 16.55 13.19 -3.36 3232030 16.74 13.20 -3.54 3082031 16.92 13.21 -3.71 2922032 17.08 13.22 -3.86 2752033 17.20 13.23 -3.97 2582034 17.30 13.24 -4.06 2402035 17.37 13.24 -4.13 2222036 17.44 13.25 -4.18 2032037 17.48 13.25 -4.22 1842038 17.50 13.26 -4.24 1642039 17.51 13.26 -4.25 1442040 17.52 13.26 -4.26 1242041 17.52 13.26 -4.26 1032042 17.53 13.27 -4.27 812043 17.54 13.27 -4.27 592044 17.54 13.27 -4.27 362045 17.55 13.27 -4.28 132046 17.56 13.27 -4.29 ----2047 17.58 13.27 -4.31 ----2048 17.60 13.28 -4.32 ----2049 17.62 13.28 -4.34 ----2050 17.64 13.28 -4.36 ----2051 17.68 13.28 -4.39 ----2052 17.71 13.29 -4.43 ----2053 17.75 13.29 -4.47 ----2054 17.80 13.29 -4.50 ----2055 17.84 13.30 -4.55 ----2056 17.89 13.30 -4.60 ----2057 17.95 13.30 -4.65 ----2058 18.00 13.31 -4.69 ----2059 18.05 13.31 -4.74 ----2060 18.10 13.31 -4.79 ----2061 18.16 13.32 -4.84 ----2062 18.22 13.32 -4.90 ----2063 18.28 13.32 -4.95 ----2064 18.34 13.33 -5.01 ----2065 18.40 13.33 -5.07 ----2066 18.46 13.34 -5.12 ----2067 18.52 13.34 -5.18 ----2068 18.57 13.34 -5.23 ----2069 18.63 13.35 -5.28 ----2070 18.67 13.35 -5.32 ----2071 18.72 13.35 -5.37 ----2072 18.77 13.36 -5.41 ----2073 18.81 13.36 -5.45 ----2074 18.85 13.36 -5.49 ----2075 18.90 13.36 -5.53 ----2076 18.94 13.37 -5.58 ----2077 18.99 13.37 -5.62 ----2078 19.03 13.37 -5.66 ----2079 19.08 13.37 -5.70 ----2080 19.12 13.38 -5.75 ----
Summarized Rates: OASDI
2004 Cost RateIncome
RateActuarial Balance
-2078 15.30% 14.01% -1.29% 0.64%Office of the Chief Actuary
Based on Intermediate Assumptions of the 2005 Trustees Report. Social Security AdministrationAugust 8, 2005
Change inActuarialBalance
Invest 40 percent of the Trust Funds in equities (phased in 2006-2020) assuming a 5.5 percent real rate of return on equities
Expressed as a percentage of taxable payrollTrust Fund
Ratio 1-1-year

Table G3 Financial Estimates for the OASDI Trust Fund Program
Year Cost RateIncome
RateAnnual
Balance
2005 11.13 12.72 1.59 3202006 11.00 12.73 1.73 3372007 10.95 12.74 1.79 3552008 10.99 12.78 1.80 3702009 11.13 12.77 1.65 3832010 11.25 12.79 1.54 3942011 11.42 12.84 1.42 4042012 11.67 12.87 1.20 4102013 11.93 12.90 0.97 4152014 12.21 12.92 0.71 4172015 12.49 12.94 0.45 4182016 12.79 12.96 0.17 4162017 13.09 12.98 -0.12 4122018 13.40 13.00 -0.40 4072019 13.71 13.01 -0.69 4012020 14.03 13.03 -1.00 3932021 14.34 13.05 -1.29 3832022 14.65 13.07 -1.58 3722023 14.95 13.09 -1.87 3602024 15.25 13.11 -2.15 3462025 15.55 13.12 -2.42 3322026 15.83 13.14 -2.69 3162027 16.10 13.16 -2.94 2992028 16.34 13.17 -3.16 2822029 16.55 13.19 -3.36 2642030 16.74 13.20 -3.54 2452031 16.92 13.21 -3.71 2252032 17.08 13.22 -3.86 2052033 17.20 13.23 -3.97 1852034 17.30 13.24 -4.06 1642035 17.37 13.24 -4.13 1432036 17.44 13.25 -4.18 1212037 17.48 13.25 -4.22 992038 17.50 13.26 -4.24 772039 17.51 13.26 -4.25 542040 17.52 13.26 -4.26 312041 17.52 13.26 -4.26 72042 17.53 13.27 -4.27 ----2043 17.54 13.27 -4.27 ----2044 17.54 13.27 -4.27 ----2045 17.55 13.27 -4.28 ----2046 17.56 13.27 -4.29 ----2047 17.58 13.27 -4.31 ----2048 17.60 13.28 -4.32 ----2049 17.62 13.28 -4.34 ----2050 17.64 13.28 -4.36 ----2051 17.68 13.28 -4.39 ----2052 17.71 13.29 -4.43 ----2053 17.75 13.29 -4.47 ----2054 17.80 13.29 -4.51 ----2055 17.84 13.30 -4.55 ----2056 17.89 13.30 -4.60 ----2057 17.95 13.30 -4.65 ----2058 18.00 13.31 -4.69 ----2059 18.05 13.31 -4.74 ----2060 18.10 13.31 -4.79 ----2061 18.16 13.32 -4.84 ----2062 18.22 13.32 -4.90 ----2063 18.28 13.32 -4.95 ----2064 18.34 13.33 -5.01 ----2065 18.40 13.33 -5.07 ----2066 18.46 13.34 -5.12 ----2067 18.52 13.34 -5.18 ----2068 18.57 13.34 -5.23 ----2069 18.63 13.35 -5.28 ----2070 18.67 13.35 -5.32 ----2071 18.72 13.35 -5.37 ----2072 18.77 13.36 -5.41 ----2073 18.81 13.36 -5.45 ----2074 18.85 13.36 -5.49 ----2075 18.90 13.36 -5.53 ----2076 18.94 13.37 -5.58 ----2077 18.99 13.37 -5.62 ----2078 19.03 13.37 -5.66 ----2079 19.08 13.37 -5.70 ----2080 19.12 13.38 -5.75 ----
Summarized Rates: OASDI
2005 Cost RateIncome
RateActuarial Balance
-2079 15.79% 13.87% -1.92% 0.00%Office of the Chief Actuary
Based on Intermediate Assumptions of the 2005 Trustees Report. Social Security AdministrationAugust 8, 2005
Change in ActuarialBalance
Invest 40 percent of the Trust Funds in equities (phased in 2006-2020) assuming an ultimate 3 percent real rate of return on equities
Expressed as a percentage of taxable payrollTrust Fund
Ratio 1-1-year