Social Reproduction, Gender Equality and Economic Growth
43
1 Social Reproduction, Gender Equality and Economic Growth December 2017 Elissa Braunstein, Colorado State University Rachid Bouhia, United Nations Conference on Trade and Development Stephanie Seguino, University of Vermont Abstract This article presents a conceputal macroeconomic model and principal component analysis that link structures of economic growth and development with those of social reproduction (SR) and gender inequality. SR, defined as the time and money it takes to produce, maintain and invest in the labor force influences current aggregate demand and long-run productivity growth. SR regimes can be characterized by the extent to which reproduction takes place in the household, public or market sectors, and the gender distribution of the labor in each. The analysis illustrates how the distributions of production and reproduction among women, men, the state and capital structure the dynamics of economic growth and development, and how gender inequality is both cause and consequence of these relationships. Key words: Structuralist models; care economy; social reproduction; gender inequality; economic growth; structural change JEL classification codes: 04 Economic Growth and Aggregate Productivity, 011 Macro analyses of economic development, E1 General Aggregative Models, J22 Time allocation and labor supply,
Transcript of Social Reproduction, Gender Equality and Economic Growth

1
Social Reproduction, Gender Equality and Economic Growth
December 2017
Elissa Braunstein, Colorado State University
Rachid Bouhia, United Nations Conference on Trade and Development
Stephanie Seguino, University of Vermont
Abstract This article presents a conceputal macroeconomic model and principal component analysis that link structures of economic growth and development with those of social reproduction (SR) and gender inequality. SR, defined as the time and money it takes to produce, maintain and invest in the labor force influences current aggregate demand and long-run productivity growth. SR regimes can be characterized by the extent to which reproduction takes place in the household, public or market sectors, and the gender distribution of the labor in each. The analysis illustrates how the distributions of production and reproduction among women, men, the state and capital structure the dynamics of economic growth and development, and how gender inequality is both cause and consequence of these relationships.
Key words: Structuralist models; care economy; social reproduction; gender inequality; economic growth; structural change
JEL classification codes: 04 Economic Growth and Aggregate Productivity, 011 Macro analyses of economic development, E1 General Aggregative Models, J22 Time allocation and labor supply,

2
Social Reproduction, Gender Equality and Economic Growth
1. Introduction
In recent years, a plethora of macro models have emerged that integrate the role of gender in
influencing economy-wide well-being.1 One strand focuses on the supply-side effects of gender
equality in education and labor force participation, emphasizing the resulting benefits for
productivity and economic growth. A second approach is one that incorporates those supply-side
considerations but also addresses the role of aggregate demand and economic structure in
influencing the relationship between gender relations and macro-level outcomes. Missing from much
of this work is an explicit exploration of the role of care and more generally, social reproduction—
fundamental to the production of human capacities but also a driver of employment and other
macro-level outcomes.
Braunstein, et al. (2011) filled that lacuna, with a structuralist macro model that incorporates
the role of social reproduction as well as gender. This paper furthers that model. It uses principal
component analysis to quantify a set of regimes linking structures of economic growth and
development with those of social reproduction. Social reproduction is defined in terms of the time
and money it takes to produce, maintain, and invest in the labor force. Our approach differs from
previous supply-side models in that social reproduction takes place not only within the household
but also in the public and market sectors of the economy. Regimes can be characterized by the
extent to which social reproduction takes place in any of these three domains and the gender
distribution of the labor in each. More broadly, the analytical emphasis is on understanding how the
distributions of production and reproduction among women, men, the state, and capital structure
1 For surveys of this literature, see, for example, Stotsky (2006), Seguino (2010), Nallari and Griffith (2011), Elborgh, et
al., (2013), Kabeer and Natali (2013), Cuberes and Teignier (2014), Onaran (2015), and Seguino (2017).
3
the dynamics of economic growth, and how gender inequality is both cause and consequence of
these relationships.
We begin by developing a conceptual macroeconomic model of growth and social
reproduction that allows us to define a set of stylized set of regimes for how the two interrelate. We
then use principal components analysis to empirically estimate these regimes for a wide cross-section
of both developing and developed countries over the period 1991-2015, though data choices are
primarily geared towards capturing developing country structures. The goal is to evaluate the
contradictions and complementarities embedded in systems of growth and social reproduction, as
well as how these systems change over time. The resulting portrait identifies how accounting for
care better specifies the economic consequences of increasing gender equality in the labor market by
closing gender gaps in wages or employment participation.
2. A macroeconomic framework for social reproduction
This section develops a conceptual framework connecting economic growth in with
processes of social reproduction and the dynamics of gender inequality. This conceptual model
reflects the formal theoretical model presented in Braunstein et al. (2011) and builds on the
discussion in Braunstein (2014).
The macroeconomic approach is “structuralist” in the sense that the distribution of income
by class and gender plays a central role in consumption, investment and growth, and the structure of
the economy is an important determinant of how these interactions play out (Taylor 2004). A central
feature of this model is that the macroeconomy is demand-constrained. This is because firms
operate with excess capacity, and changes in the short-run level of output change the degree of
capacity utilization of the economy.2 Wages, rather than being set by the marginal product of labor,
2 This demand-side approach differs from some models in which macroeconomic disequilibria (and thus unemployment,
inflation, or slow growth) are assumed to be due to a deficiency of savings (Elson 2004).

4
as in neoclassical models, are the result of a social bargaining process that reflects the extent of
unemployment or under-employment in the economy.
Before presenting the model, we introduce how we portray the economic dimensions of care
and social reproduction. We define care in both labor-process and output terms. In terms of labor
process, care is a work activity that involves close personal or emotional interaction with those being
cared for (Folbre 2006). In terms of output, care refers to either direct or indirect care services that
are inputs into the production and maintenance of the labor force. Gender norms around care are
also important. Unpaid work and care have been understood as highly gendered activities with
gendered meanings, asymmetrically distributed between men and women in both the paid and
unpaid sectors, and a key contributor to gender inequality in both the market and the home (Badgett
and Folbre 1999; Nelson and England 2002). More specifically, time use data indicate that women
carry the greatest burden of performing care work, whether construed as direct care or indirect care
activities, such as fetching water or fuel wood (Connelly and Kongar 2017).
As both an output and an input, labor has two facets--quantity (time) and quality (the
productivity of that time)—though we refer to both by using the term human capacities.3 We
conceptualize capacities in the widest sense of the term and include a broad array of features that
make human beings more economically effective, such as emotional maturity and self-confidence, as
well as standard human capital measures, such as education and skills.
Human capacities are produced in the household sector using unpaid labor time and
commodities. In the short-run, changes in human capacities production impact labor productivity,
reflecting the extent to which one is being supported and replenished at home. In the long term,
spending time or money on the production of labor, whether it results in higher fertility or improved
labor productivity, is treated as investment rather than daily maintenance. Investments in human
3 To some extent, quantity and quality can be traded off with one another (Becker and Lewis 1973), but declines in
fertility can be so large that increased quality cannot compensate.
5
capacities raise future productive capacity (i.e., generate economic growth) in ways similar to
building more factories and equipment, though investing in the future labor force is almost never
treated as investment in macroeconomic models. In this way, we differ from any other macro
models that fail to treat spending in support of developing the future labor force as investment. As
with conventional treatments of investment, however, we model investment in human capacities as a
factor that stimulates current aggregate demand while also contributing to long-term economic
prospects.
At its core, then, the model is about treating labor as a produced means of production.
Primarily women (but also men) carry out this reproduction process by doing both paid and unpaid
work. A key goal of this paper is to differentiate between societies that care more and/or better than
societies that invest less in care. Reasons some societies might invest more in care could be social
norms around intergenerational obligation that induce altruistic preferences; strong social welfare
sectors that create highly skilled and well-paid jobs in the care sector; or, more likely, gendered ideals
that encourage women to provide high-quality care for little or no pay. These social production
characteristics interact with the structure of the macroeconomy to influence outcomes. To set up
this framework, we begin with the demand side of the macroeconomy.
2.1 Demand, caring spirits and growth
The demand side of the economy is driven by investment demand, which, in the short-run,
raises demand for current output and, in the long run, raises economic growth by increasing
productive capacity. In our model, investment is of two types: physical (or business) investment
undertaken by firms, and human capacities investment undertaken by individuals and households.
Funds for both types of investment are drawn from national income, which depends on the
functional distribution of income—that is, the split between the profit and wage shares of income.

6
The extent of business investment depends partly on expectations about the profitability of
those investments, or, in the words of Keynes, “animal spirits.”4 In addition to expectations,
business investment is a function of sales, which in turn depend on the level of aggregate demand.
The latter is influenced by the distribution of income because workers spend a larger share of their
income than capitalists. A redistribution to workers in the form of higher wages will stimulate
demand and, as a result, increase this component of investment (dubbed the “accelerator effect”).
On the other hand, higher wages also lower the profit share of income, which dampens the
incentive to invest (the “profitability effect”). These effects move in opposite directions. The net
impact of higher wages on business spending and thus aggregate demand depends on which of these
two effects is stronger. Economies in which increases in the wage share of income stimulate output,
employment, and growth are termed “wage-led.” Their converse, where increases in the wage share
are associated with lower output and growth are termed “profit-led.”5
Turning to investment in human capacities, rather than center their decisions on expected
profit rates, individuals finance investments in themselves and others based on expectations about
future economic opportunities. Higher wage shares of income boost expectations about future
economic returns to labor, as does more current economic activity as measured by output. The
pathway from expectations about future opportunities to actual investments in human capacities is
governed by what we term “caring spirits”: the tendency, whether determined by social norms,
individual motivation, or public preferences as reflected in the structure of the social welfare state, to
provide care (or support for care) for one’s self and others in ways that add to current aggregate
demand and future productivity.
4 The notion of “animal spirits” reflects the psychological element in business decision-making regarding profitability, built on the widely acknowledged but poorly understood waves of market confidence and panic. For more on this point, see Braunstein et al. (2011). 5 Strictly speaking, to get to this point we need to say something about savings. On the demand side, macroeconomic equilibrium means that the investment desired by investors equals that supplied by savers (both domestic and foreign). Because investment is both the binding constraint and the mechanism for social reproduction on the demand side in our framework, we do not give further detail on savings dynamics.

7
Although the extent of caring spirits takes place along a continuum, for simplicity we
differentiate between two stylized types of caring spirit regimes: those with “strong” caring spirits
versus those with “weak” ones; we also alternatively refer to the strong/weak dichotomy as
altruistic/individualistic to emphasize the difference between other-directed and self-oriented
preferences. Because of these differences in preferences, economic growth or higher wage shares
will have a stronger positive impact on investment in human capacities in altruistic societies than in
individualistic ones. And the stronger the caring spirits, the more likely that economic growth is
wage-led. The reason is that higher wages now increase not only consumer demand, but also
demand for investment in human capacities.
In addition to caring spirits, the wage- versus profit-led dichotomy also partly depends on
the type and extent of globalization, especially in a developing country context. The greater the
dependency on external sources of demand, the less likely that wage increases boost aggregate
demand enough to compensate for the decline in profits. Monetary and fiscal policy stances
exclusively focused on maintaining price stability in the context of free flows of capital and trade, as
opposed to those more actively and directly supportive of growth and development, tend to
coincide with profit-led or individualistic regimes (Blecker 2016). Such policy stances may seem an
essential part of macro management in the current era of globalization, but their deflationary effects
make for poor employment growth and tend to depress investments in human capacities. Table 1
summarizes and compares these demand-side dynamics for both wage- and profit-led economies.
<Table 1 here.>
2.2 Supply, gender and the distribution of social reproduction
The supply side of the model is constituted by interaction among three different spheres: the
labor market, the product market, and the production of human capacities in the household sector.

8
Labor and product markets are characterized by a division of labor between women and
men. In general, we link female labor supply with the provision of direct and indirect care services in
the market, but the significance of this sector as a source of employment for women and a
determinant of human capacities production will ultimately vary based on economic structure.6
Wages are determined by labor’s bargaining power, which rises along with output – as output rises,
unemployment falls, giving workers more ability to bargain over wages. Women’s collective
bargaining power is presumably lower than men’s, a point consistent with the prevalence and
persistence of the gender wage gap across all sorts of economies.7
The wages that emerge from conditions in the labor market, combined with labor
productivity as determined by the state of human capacities, specify the costs of production. Profit
shares are then determined by how much price is marked up over cost, an outcome constrained by
demand conditions and the firm’s degree of monopoly power. We can begin to see some of the
contradictory forces at work in the system: higher wages for women are desirable from the
perspective of gender inequality, but they also may raise the price of care and put pressure on
reproduction. At the same time, buoyant demand for paid care from either the private or public
sectors is key to supporting higher wages for care workers.
Turning now to the production of human capacities in the household sector, inputs into the
social reproduction are of three types: time, commodities, and infrastructure. In terms of time inputs,
women, men, children, and networks of kin or community may all be important contributors of
unremunerated time into social reproduction, but women perform the bulk of unpaid household
work, whether or not they also participate in paid work (Budlender 2008; Charmes 2006; Folbre
6 It is worth noting that nothing intrinsically makes women more suited for such work. Rather, gender norms and
stereotypes shape the gender division of labor, and macro-level policies can assist in this process, as for example, policies in Nordic countries on sharing parental leave. 7 Women’s relatively weaker bargaining power is a function of how they are inserted into the paid economy as workers.
Insofar as women tend to be more likely to be employed in part-time work, the informal sector, and in mobile labor-intensive manufacturing firms, they are in a weaker bargaining position vis-à-vis employers than men on average. Thus the gender wage gap is at least partly related to economic structure as well as a country’s labor market policies.
9
2006). If women (or men) spend less time at home, human capacities production may suffer. Just
how much depends on the structure and productivity of that unpaid labor time, involving factors
like skill, motivation, the availability of care-related commodities and, of course, the state of one’s
own human capacities (tired caregivers are usually less effective ones).
The second set of inputs, commodities, is financed by income from work or public and
private transfers. They include direct and indirect care services and capital goods, such as stoves,
refrigerators, and washing machines. The impact of income on human capacities depends not only
on how much is earned and spent, but on what is purchased, and whether these commodities
provide good substitutes or complements for unpaid care time. Think of professionalized and well-
paid versus informal and underpaid care sector workers, purchasing a refrigerator versus a television
set, or devoting public funds to the provision of childcare services versus expanding national
defense. All of these arguably contribute to social reproduction, but in varying degrees.
The last input, public infrastructure, refers to goods like roads, electricity, sanitation, and
water that decrease the opportunity cost of market work, mostly by lowering the time intensity of
care work by women, but also by lowering the price and increasing the availability of care
commodities (Agénor and Agénor 2009). Infrastructure is an often-neglected aspect of the
relationships between social reproduction, gender inequality and growth, but a key determinant and
outcome of the gender system.
Taken together, the production of human capacities in the household sector, combined with
the determination of wages, prices and profit shares in the labor and product markets, constitute the
supply side of our conceptual model. We differentiate between two stylized supply regimes that
reflect the gender distribution of social reproduction: low road versus high road. The key difference
between the two is that in the low-road regime, higher female labor force participation is associated
with a decline in human capacities production, while in the high-road regime, increased female labor
force participation also increases human capacities production.

10
In the low-road regime, the negative association between human capacities production and
female labor force participation is driven by low wages and poor working conditions for women in
general and care sector workers in particular, set against a backdrop of little public support for social
reproduction.8 Low wages for women mean, on the one hand, that they can ill afford to purchase
care commodities to compensate for the decline in the nonmarket work time that market
participation induces (we will discuss male contributions in a moment). It also suggests that the care
commodities they do purchase are likely to be inferior substitutes for unpaid time, as the quality of
these commodities reflects the poor labor market conditions in which they are produced. Weak
demand for care services, both from workers who can ill afford them and as well as paltry public
provision, keep their prices – and the wages of these workers – low. The net result from an
aggregate supply perspective is that expanding market production and increasing women’s labor
force participation threaten profits because the potentially higher profit share spurred by more
economic activity is outweighed by the decline in human capacities production. In the short run, this
decline manifests as lower labor productivity, and in the longer term, as decreased investment in
human capacities. It is worth noting here that it is this element that has been strikingly absent in
many gendered macro models.
Conversely, the high-road regime is characterized by the opposite: higher female labor force
participation is associated with increases in human capacities production. Strong care sectors,
occasioned by good wages for care workers and high levels of public and private demand for care
services underlie a sort of virtuous cycle. Commodities serve as effective substitutes and
complements for declines in women’s unpaid labor time with marketization, perhaps also making it
possible for women to reorganize their unpaid labor time in ways that actually raise its efficiency.
Less time taken up by indirect care services frees up time for work and direct care, potentially
increasing human capacities production and investment. Good infrastructure for reproductive work
8 Indeed, low wages for care workers and weak public provision are empirically correlated with one another across a variety of countries (Budig and Misra 2010).
11
reinforces these positive relationships. While it is true that the higher wages and taxes that pay for
the high road do press on the profit share, the higher prices supported by strong demand and
increases in labor productivity more than compensate.
So far we have focused on female labor force participation and the fortunes of (primarily
female) care sector workers. But both women and men contribute time and money to social
reproduction, either directly or indirectly through taxes and charitable contributions. How they split
these responsibilities is correlated with whether the high- or low-road regime prevails. The more that
women and men share the time and financial costs of care, the more likely that increases in female
labor force participation and output will increase the production of human capacities by more than it
will cut into profits—and therefore, the more likely the high-road case will be. This is the gender
egalitarian (GE) case. This is in part because women’s movement into paid labor is not so costly in
terms of investments in human capacities due to men taking on some of this role. Note that gender
egalitarianism is also reflected in a number of factors associated with the high road: smaller gender
wage gaps (to the extent they stem from good wages for women as opposed to low wages for men),
an extensive and high quality market care sector, far-reaching public provision of care services, and
good reproductive infrastructure.
By contrast, in cases where men contribute very little to social reproduction in terms of
either time or financing (directly or via payments to the state or other organizations), the more likely
the low-road case prevails, and women’s market participation will be associated with decreases in
social reproduction and profit share (because pressures on care brought about by women’s
increasing market participation lower labor productivity and raise unit labor costs). We call this the
feminization of responsibility and obligation (FRO) case, borrowing a term developed by Sylvia
Chant (2006) to replace the notion of the feminization of poverty. Parallel to the high-road regime,
the contributing factors to the low-road regime are associated with the type of gender system that
leads to a feminization of responsibility and obligation: low wages for women as reflected in a large

12
gender wage gap, little support from men or the state in carrying out social reproduction, and limited
markets for care commodities which, when they do exist, are characterized by low pay and poor
quality output. Table 2 summarizes the main features of the low- and high-road supply regimes.
<Table 2 here.>
2.3 Combining aggregate demand and supply: Growth and social reproduction
Table 3 shows how aggregate demand and supply interact in ways that draw out the causal
connections among growth, gender inequality, and social reproduction. The result is four stylized
regimes whereby we combine each potential demand regime with each supply regime, to create a 2x2
matrix. The styled regimes are labeled: 1) time squeeze, 2) mutual, 3) wage squeeze, and 4)
exploitation. To assess the differences among them, we consider the impact of a decline in gender-
based wage inequality and consequent increase in female labor force participation – together
amounting to an increase in gender equality in the labor market.
<Table 3 here.>
Starting in the upper left-hand corner, “time squeeze” combines wage-led/altruistic growth
with a low-road distribution of social reproduction. In this regime, more gender equality in the form
of higher wages for women in general or higher wages for care workers in particular supports
investment and growth because it raises human capacities production and domestic aggregate
demand by more than it cuts into profits. However, as female labor force participation increases, the
time devoted to human capacities production declines, and relationships in the wider economic
system – from the structure of the paid care sector to the lack of support from men for care to the
lack of reproductive infrastructure – mean that the care time decrease compromises labor
productivity and human capacities production. The more extensive the feminization of responsibility
and obligation, the stronger these negative effects. The term “time squeeze” emphasizes the trade-
offs between the marketization of women’s work and the consequent time pressures on human

13
capacities production. If these contradictions are substantial enough, the time squeeze effects of
higher wages completely counteract their positive growth effects, leading to stagnation or growth
path instabilities. Again, it is worth noting that this potential outcome is widely missing in most
gendered macro models, and yet is a possible result of increased female labor force participation
under certain conditions.
Moving to the upper right corner of Table 3, with a high-road distribution of social
reproduction and wage-led/altruistic growth, the regime is labeled “mutual” because production and
reproduction reinforce one another. In this case, more gender wage equality raises growth because it
raises human capacities investment and aggregate demand by more than it cuts into profits. Higher
market participation among women induced by higher wages does lower the time available for
human capacities production. But gender egalitarian relations of reproduction, buoyed by strong
public support for care and the availability of effective care commodities, not only protect against
time squeeze, they actually induce an increase in the production of human capacities (quantity
and/or quality) in the context of higher incomes. From a citizen-worker-carer perspective, this is the
win-win scenario.
The lower right corner of Table 3, which combines profit-led growth with a high-road
distribution of social reproduction, is termed “wage squeeze” because higher wages for women
enhance human capacities production, but not by enough to outweigh the negative impact that
higher wages have on profits, overall investment, and growth. One can think of relatively gender
egalitarian relations accompanied by a structure of production that makes long-term investments in
human capacities expensive or risky. The stronger the profit-led nature of the economy – for
instance, the more open to the global economy, or the more deflationary its macro policy – the more
pronounced these contradictions. The result is that policies promoting gender equality may be
anathema to growth, or make it unstable. Somewhat counter-intuitively, if the promotion of gender

14
equality via higher female labor participation actually lowers women’s wages because of higher labor
supply, growth, and human capacities production may increase.
The final regime, “exploitation,” combines the profit-led and low-road cases. In this scenario,
higher wages for women lower growth because they dampen profits and thus business investment
by more than they raise human capacities investment. At the same time, the higher market
participation brought about by higher wages for women actually lowers human capacities production
because of the time-squeeze type effects of the low road. These effects can be so pronounced that
human capacities investment plays no role in moderating profit-led growth. Thus the term
exploitation refers to how production and growth are predicated on exploiting women’s
reproductive labor and human resources in general. As the polar opposite of the mutual regime, it is
the lose-lose scenario.
3. Estimating social reproduction regimes
This section uses principal component analysis (PCA) to empirically estimate and rank the
supply and demand factors that promote growth for a set of developed and developing economies,
based on the social reproduction model described above. This PCA analysis includes four steps: (1)
selection of variables (described above); (2) application of the PCA; and (3) interpretation and
illustration of results, including the classification of countries into groups based on their demand and
supply regimes. The goal, more generally, is to characterize the comparative cross-sectional and
time-path values of the social reproduction regimes.
3.1 Data
The PCA scores for demand (growth and investments in human capacities) and supply (the
distribution of social reproduction) are derived from analysis of data that reflect the driving elements
listed in Tables 1 and 2 respectively. The overall time period is 1991-2015, largely because of the
15
availability of gender-disaggregated employment data. The period is subdivided into three sub-
periods over which variables are averaged for the PCA analysis: 1991-2001, 2002-2007, and 2008-
2015; these spans optimize data coverage as well as mark economic cycles. Because the primary
focus is on developing countries, the data has to be meaningful from a development perspective, as
well as widely available both cross-sectionally and longitudinally. Tables 4 and 5 list each element,
the corresponding variable(s) used to measure it, and summary statistics for each time period.
Appendix A lists further details on sources.
Table 4 describes the data included in the demand score, which is positively associated with
wage-led/altruistic growth and negatively associated with profit-led/individualistic growth. Caring
spirits are captured by relative achievements in the non-income (education and health) and income
components of the Human Development Index (HDI), with changes taken over five-year periods.9
That is, we measure caring spirits by their impact on a country’s expected years of schooling and life
expectancy at birth, both of which should be positively and strongly correlated with investments in
human capacities, relative to the income component of the HDI. The basic argument is that
countries with strong caring spirits, where investments in well-being are a central cause and
consequence of economic activities, would also be top performers in terms of positive changes in
their non-income HDIs relative to changes in income. That is, the stronger the caring spirits, the
higher the “yield” in non-income HDI for a given level of economic activity. In that sense, it is
important to emphasize that this methodology evaluates relative performance – there is no external
absolute value for strong caring spirits against which country performance is evaluated. On average,
achievements in non-income HDI have outweighed changes in the income component, but the
positive gap has narrowed over time.
<Table 4 here.>
9 Achievements in education are measured by mean years of schooling for adults older than 25 and expected years of
schooling for children entering school; achievements in health are measured by life expectancy at birth (UNDP 2013).

16
Global orientation is gauged by two measures, manufacturing exports as a share of GDP, and
inward foreign direct investment (FDI) as a share of gross fixed capital formation. Both are intended
to reflect the extent to which domestic wage growth might be constrained by global competition,
particularly among developing countries. Global manufacturing export markets have become
extremely competitive, partly due to sluggish aggregate demand growth in the global North, but also
to the increasing number of developing countries trying to pursue an export-led growth path. Both
factors are reflected in slow price growth for the sorts of manufactures that developing countries
export, which also constrains wage growth in these industries (UNCTAD 2016). In terms of FDI,
the higher the share of FDI in domestic investment, the more globally mobile is overall investment,
which can constrain productivity and wage growth as firms become more likely to respond to
increasing wage pressures by relocating or outsourcing rather than raising productivity (Seguino
2007). Both measures increase over the three time periods listed, which raises the probability of
profit-led or individualistic growth regimes in later relative to earlier periods.
The last element on the demand side is macro policy. There were a number of choices for
proxy variables here, and public investment and tariffs are particularly good representatives of the
development-oriented activism that we wanted to emphasize.10 Public investment as a share of GDP
proxies how active governments are in building up the infrastructure necessary for growth and
development. There is variation over the periods listed, with growth in the latter period reflecting
both the declines in GDP associated with the Great Recession, and the variety of counter-cyclical
fiscal policies applied in response (the standard deviation increased substantially as well). Weighted
average tariff rates applied, which uses data on imports by product group (harmonized system codes
at the two-digit level) to weight tariff rates, reflects more than the extent to which the domestic
economy is shielded from import competition. It signals how active governments are in managing
10 Other macro policy variables we tried introduced more noise than signal into the system, potentially because of the
mix of causal factors – beyond the policy sentiments we are trying to reflect – associated with these variables (e.g., real exchange rates or inflation). In future work, we will consider including measures of financial liberalization.

17
trade, and the extent to which they conform (either by philosophy or via trade agreement
commitments) to reigning global policy sentiments around trade liberalization. As reflected by the
model, we expect both public investment and tariff rates to be positively associated with wage-led
growth.
Table 5 lists summary statistics for the elements and associated variables on the supply side.
The greater the resulting score, the more high-road/gender egalitarian is the distribution of social
reproduction; the lower it is, the closer to the low-road/feminization of responsibility and obligation
course.
<Table 5 here.>
The first element, men’s relative contribution to social reproduction, is about the gender distribution
of both the time and financial costs of social reproduction, but in practical terms the immediate aim
is to capture gender differentials in unpaid care time (though the prospect of mining expenditure
surveys by gender to produce an aggregate measure of gender differences in financial contributions
to care is an interesting one). There is increasing availability of time use studies, but not nearly
enough to populate a panel data analysis. The UN’s Statistical Division (UNSD) has an excellent
cross-national, with some time series, dataset on the average hours per day women and men spend
on unpaid domestic work; that source, however, does not offer enough data coverage to make this
data source a practical option. Given available proxies, we chose the female-to-male ratio of mean
age at first marriage based on the logic that the greater the gap, the greater the gender inequality
embodied in intra-household gender relations, and therefore, the more unequal the distribution of
unpaid care time. The data that we do have bears out this hypothesis: taking average values over the
time period (1991-2015) for both the female-to-male mean age at first marriage and the female-to-
male ratio of hours spent on domestic work from UNSD, the correlation coefficient is -0.52 (with
observations for 80 countries), a substantial association in the expected direction, particularly given

18
it is an average spanning over 20 years (if we limit the sample to observations taken after 2005, the
correlation increases to -0.64).
The gender wage gap presents similar challenges for adequate proxying. We elected to use the
female-to-male ratio of the share of wage and salaried employment in total employment to capture
the relative quality and productivity of employment.11 The balance of the categories of work include
self-employed, contributing family workers, and employers. For developing countries in particular,
where self-employment and contributing to family work is often an indicator of residual
unemployment, using relative access to wage employment was deemed a reasonable proxy for
gender-based wage inequality in the labor market. And even with average values that far exceed
estimates of gender wage gaps around the world, the variable makes a significant positive
contribution to the supply-side score (see discussion below).
Public provisioning for care is represented by public social protection and health expenditure as a
share of GDP, which includes public benefits for unemployment, employment injury, disability,
maternity, and general social assistance as well as health. These shares have been increasing on
average over time, with higher levels in developed than developing countries (and a period mean of
20.9 versus 5.2 percent respectively). Averaging data on the percent of the population with access to
electricity, non-solid fuel, improved sanitation and water sources gives a proxy for reproductive
infrastructure, a measure with more variance among developing than developed countries. Both
variables are positively associated with a gender egalitarian distribution of social reproduction.
The last element included in the supply side score is the extent and quality of the market care
sector. Because women’s service sector work tends to be concentrated in the caring professions, we
use women’s services employment as a share of total employment (men plus women) to proxy for
the extent of the market care sector. To get at the question of quality, we effectively discount this
11 We tested additional variables, including women’s education and labor force participation rates relative to men. These
were not used because they did not add to the PCA, likely because they are much more highly correlated with a multitude of gender inequality dynamics than the gender wage gap, and hence did not group well with the other supply side elements.

19
measure by the extent of income inequality in the economy (by raising it to the power of the inverse
of the income inequality measure) on the argument that the more inequality, the lower the quality
(and pay) of care sector work. The so-called “Palma” ratio, which is the share of income going to the
richest 10 percent of the population divided by the share of income going to the poorest 40 percent
of the population, is used for income inequality (Palma 2014).12 The higher the value of this variable,
the more gender egalitarian the distribution of social reproduction.
3.2 Methodology
The objective of this analysis is to create two country-level scores that reflect demand and
supply regimes and allow for cross-country and longitudinal comparisons. The technique of
principal component analysis (PCA) is particularly suitable in this regard. PCA is a statistical method
that provides a condensed representation of the information brought by a large number of
interdependent factors, as those that shape different social reproduction regimes. More specifically,
it is a multidimensional scaling tool for a set of variables, simultaneously describing both the
connections among the variables and the similarities among the observed units. The resulting
principal components retain as much information as possible about the original variables, with the
first principal component accounting for maximal variance, as does each succeeding principal
component while being orthogonal to preceding components. However, regular PCAs become
problematic when there are a large number of missing values. To address this issue, we used a
regularized iterative PCA algorithm (Josse and Husson, 2013) based on a “shrinkage” approach in
order to impute missing values without overfitting the data, a problem for some variables in the
analysis such as mcare (see Tables 4 and 5 for information on missing values).13
12 Using the Palma ratio emphasizes the importance of what is happening in the tails as opposed to characterizing
income distribution overall. 13 Overfitting occurs when the model describes random error or noise instead of the underlying relationships between
variables.

20
To generate the two PCA scores, we first implemented three distinct PCAs over the three
time periods (1990-2001, 2002-2007 and 2008-2015), and found cross-time consistency on both the
component estimates and the relative contributions of the underlying data (all of which was first
standardized). Then we imputed missing values following the regularized PCA algorithm for each of
the three periods. And finally we implemented a “general” PCA on the dataset, including imputed
values, but using only data from 2008-2015 to compute the components. Final scores for each
country and time period, however, utilize these estimates as well as the underlying data for that time
period. This method allows for a longitudinal comparison, taking the latter period as the reference
point.
Table 6 gives the coordinates and relative contributions of variables on the first component
of the PCA, and the percentage of variance captured for both demand and supply. The three time
periods are listed for comparative illustration; it is only the components in the last time period that
are used for scoring in the next section.
<Table 6 here.>
Looking at the coordinate results on the first component, we can see that the signs of the
variables all conform to those predicted by the conceptual model. For demand and growth, variables
associated with more altruism and wage-led growth have positive values (HDI2, pub, and TFF), while
those associated with profit-led or individualistic regimes have negative values (mfgX and FDI).
Similarly, on the supply side, all of the variables are positive, and thus greater values are associated
with a more gender egalitarian distribution of social reproduction. The percentage of variance
accounted for by the first component is about 40 percent on the demand side and 73 percent on the
supply side. In general, the supply-side estimates appear more robust and stable across time than the
demand side.14
14 Improving our measure of caring spirits, and extending those for both macro policy and global orientation will be
priorities for the next stage of work.

21
3.3 Results
Figures 1 and 2 illustrate the distribution of countries across the four social reproduction
regimes based on their PCA scores for the period 2008-2015; Appendix B lists each country
individually and their respective regime as illustrated in Figures 1 and 2.
<Figure 1 here.>
<Figure 2 here.>
Figure 1 includes developing and transition countries, and Figure 2 developed countries
only.15 Note that the axes for the two groups differ. This is because the classification of countries
across regime categories is based on the within-group average to which that country belongs – either
developing and transition or developed countries. This brings out the point that there is no absolute,
context-independent value to which country scores are being compared.
Starting with Figure 1, a majority of developing and transition countries are in either time or
wage squeeze quadrants (quadrants II and IV respectively), exhibiting contradictory relations
between growth dynamics, on the one hand, and high- versus low-road systems of social
reproduction, on the other. On the face of it, the growth potential of more countries is limited by
wage squeeze (48) than time squeeze (40), but this result is driven by the preponderance of transition
economies that fall into the wage-squeeze category (14).
Combining Figure 1 with the regional details in Table 7, most of developing Asia is
classified as wage squeeze (quadrant IV), which likely reflects the contradictions of globally-oriented
production coupled with developmental states that provide generous public supports for care. That
the results for Asia are driven by countries in East and Southeast Asia is consistent with this
observation. Most countries in developing America are also in wage squeeze, a result driven
15 The classification of countries across development groups and regions conforms to those used by the UN.
22
primarily by countries in Central America and the Caribbean, which, like parts of East and Southeast
Asia, tend to be more dependent on external sources of demand.
<Table 7 here.>
Adding up the developing regions detailed in Table 7, the largest group of developing
countries, about 40 percent, is classified in the time-squeeze regime (quadrant II of Figure 1),
indicating that despite wage-led structures of growth, which could bode well for the growth-
enhancing effects of gender equality and associated investments in human capacities, growth
potential is limited by prevailing low-road structures of social reproduction. As more women enter
the labor market, the consequent strain on women’s time limit human capacities development and
the growth of labor productivity. The policy implication of this combination is clear: increasing
women’s paid employment must be accompanied by more support for care to sustainably deliver
growth. Most African countries fall into the time-squeeze category (33), as do a number of South
Asian countries.
South American countries are most likely to be classified as mutual (quadrant I of Figure 1),
a somewhat surprising result given the level of inequality and informality that prevails in the region.
These challenges seem to have been compensated for to an important extent by recent increases in
social protection spending (a hypothesis confirmed by the time paths illustrated in Figure 3). This
outcome is instructive, both because it demonstrates the importance of policy, but also because it
reminds us that a mutual regime does not automatically or inherently induce economic growth.
Rather, it describes relationships between gender equality in the labor market and economic growth
– given the constraints and supports posed by prevailing systems of care and social reproduction. In
the South American case, closing the gender wage gap by raising women’s wages is good for growth
and social reproduction, and could induce a virtuous cycle for development.
The exploitation quadrant (lower left in Figure 1), which pairs profit-led/individualistic
structures of growth with a low-road distribution of social reproduction, is populated primarily by

23
countries in Southeast Asia and Africa (Appendix B). In this scenario, although the two sides of the
social reproduction regime reinforce one another, improving gender equality in the labor market
may threaten growth, both on the demand and supply sides. Intervening on one side of the regime –
demand or supply – will induce movement towards either time or wage squeeze, depending on the
nature of the policy intervention.
Figure 2 gives the distribution of developed countries, with country labels (owing to the
smaller number of data points). As one would expect, most developed countries are wage-led, with
their domestic economies providing significant sources of aggregate demand, and greater relative
investments in human capacities given their already-high levels of development. The Nordic
countries, well-known for their generous social welfare systems and commitment to gender equality,
are firmly in the mutual category. Weaker commitments to a gender egalitarian distribution of social
reproduction put many of the more liberal economies in the time squeeze regime, suggesting that
the contributions of women’s increasing participation and wages in the labor market are weighed
down by insufficient supports for social reproduction. For profit-led growth countries, most tend
towards a more gender egalitarian distribution of social reproduction and thus the wage squeeze case,
though when countries are very close to the origin (as in the case of Germany) or a particular axis,
they are weaker manifestations of the regime.
Figure 3 illustrates the time paths of regimes for the world and broad country group,
averaging PCA scores for the group in question. It is merely illustrative in the sense that what
matters is the movement of individual country scores rather than the relative size of absolute values,
but considering these average time paths can nonetheless give readers a sense of the longitudinal
nature of the estimates.
<Figure 3 here.>
The world as a whole is clearly progressing towards more profit-led/individualistic growth
regimes, particularly between the first two periods; it is also moving towards a more gender

24
egalitarian distribution of social reproduction. Developed countries, as a group, are moving towards
more profit-led demand as well, though the pace has slowed down relative to achievements in
gender egalitarianism on the supply side over the last decade or so. Transition economies shifted
dramatically towards more profit-led growth over the 1990s, in line with the nature of their
economic reforms. There has been a modest turnaround in those countries since then, which has
also included more movement towards gender equality in the distribution of social reproduction, but
the average is still squarely in the wage squeeze quadrant.
On average, developing Africa has likewise become more profit-led, and progress towards
gender egalitarianism was reversed between the last two periods. However, the region as a whole is
still squarely situated in the time squeeze quadrant, indicating that more vigorous supports for social
reproduction could induce the virtuous cycle of a mutual regime. Developing Asia has also gotten
more gender egalitarian in the distribution of social reproduction over time (despite a small shift
towards less egalitarianism since the early 2000s). At the same time, it has also become much more
profit-led, leading to a shift from the mutually reinforcing regime to the contradictions of wage
squeeze over the course of the 1990s, though it is still close to the axis. Developing America shifts
towards more profit-led growth over the 1990s, in line with the more neoliberal economic policies
and global integration pursed by many countries in the region during that period, with a more recent
shift towards more gender egalitarianism.
These dynamics indicate how various policy interventions and structural changes have
coalesced to move the structures of growth and social reproduction over time, and could be used to
measure the relative effectiveness of social or economic development policies. They also provide a
global portrait of gendered structures of growth and care, with important implications for the
relationship between gender equality in the labor market and economic growth. That the world is
universally moving towards more profit-led demand regimes is consistent with the current era of
globalization, where a form of hyper-integration has made competitive pressures particularly sharp

25
for developing countries, while at the same time offering new opportunities for development and
structural change.
The increasing gender egalitariansim in the distribution of social reproduction that has
accompanied this movement alights on a troubling contradiction emergent in the global system, and
indicates that interventions focusing solely on the supply side risk being can be undermined by
dynamics on the demand side. As women’s labor force participation increases, the lower wages
required to sustain growth undermine longer-term investments in human capacities. Supply-side
policy interventions aimed at enhancing gender equality in the labor market, for instance efforts to
raise women’s education or skills, or provide better infrastructural supports for unpaid care work,
can certainly improve the conditions for care and social reproduction. However, as illustrated by the
time paths in Figure 3, when demand and investment are driven by more profit-led structures and
relations, such interventions move economies into the contradictions of wage squeeze (where
structures of demand and growth work undermine those of the distribution of social reproduction),
rather than the complemetarities of the mutual regime.
4. Concluding discussion
Though the question of care has yet to make it very far into macroeconomic models of
growth, the inefficiency of gender inequality in capabilities or employment has become a stylized
fact among both academic empiricists and international development institutions. When care takes
on a macro dimension, it tends to get treated as a constraint on female labor force participation, and
therefore women’s disproportionate responsibility for care one of the ways that gender inequality
inhibits growth. This point is an important one, but it misses the economic value of care—and thus,
the effects of policies that reduce investments in care. By proposing that we treat labor as a resource
that is produced, the model and estimates presented illustrate how care and social reproduction can
have macroeconomic consequences independent of their effects on women’s work participation,

26
and that the gendered structures of care provisioning are elemental to paths for development and
growth.
More specifically, for a majority of developing countries we find that prospects for growth
with increased gender equality in the labor market are limited by the contradictions between the
positive growth effects of higher wages and/or more market participation by women on the one
hand, and the pressures such increases in market work will bring to bear in the care economy on the
other. For a large subset of developing countries more dependent on external sources of demand,
many of them with developmental-type states that make substantial human capital investments,
paths for growth with more gender equality are limited by what is essentially the loss in
competitiveness that higher wages for women would bring. A third, much smaller group of
countries with more mutual or complementary relations between growth, social reproduction, and
gender equality in the labor market, illustrate how having the potential to spark a virtuous cycle does
not automatically produce one. In future work, we will explore this last point further, using the
estimates presented in this paper to conduct a panel data analysis of growth determinants,
investigating when and how the structures of social reproduction interact with other more standard
determinants of growth.

27
References
Agénor, Pierre-Richard and Madina Agénor. 2009. Infrastructure, Women’s Time Allocation, and Economic Development. Centre for Growth & Business Cycle Research Discussion Paper Series No. 116. The University of Manchester, Manchester.
Badgett, M.V. Lee and Nancy Folbre. 1999. “Assigning Care: Gender Norms and Economic Outcomes.” International Labour Review 138(3): 81–103.
Becker, Gary and H. Gregg Lewis. 1973. “On the Interaction between the Quantity and Quality of Children.” The Journal of Political Economy 81: S279-S288.
Blecker, Robert. 2016. “Wage-led Versus Profit-led Demand Regimes: The Long and the Short of
It.” Review of Keynesian Economics 4(4): 373–390
Budig, Michelle and Joya Misra. 2010. “How care-work Employment Shapes Earnings in Cross-
national Perspective.” International Labour Review 149(4): 441-460.
Braunstein, Elissa. 2014. Economic Growth and Social Reproduction: Gender Inequality as Cause and Consequence. UN Women Discussion Paper.
Braunstein, Elissa, Irene Van Staveren and Daniele Tavani. 2011. “Embedding care and unpaid work
in macroeconomic modeling: A structuralist approach.” Feminist Economics 17(4): 5-31. Budlender, Debbie. 2008. “The Statistical Evidence on Care and Non-Care Work across Six
Countries.” Gender and Development Programme Paper No. 4, UNRISD. Chant, Sylvia. 2006. “Re-thinking the ‘feminization of poverty’ in relation to aggregate gender
indices.” Journal of Human Development 7(2): 201-220. Charmes, Jacques. 2006. “A Review of Empirical Evidence on Time use in Africa from UN-
Sponsored Surveys,” in C. Mark Blackden and Quentin Wodon (eds.) Gender, Time Use, and Poverty in Sub-Saharan Africa. World Bank Working Paper No. 73.
Connelly, Rachel and Ebru Kongar (Eds.). 2017. Gender and Time Use in a Global Context: The
Economics of Employment and Unpaid Labor. Palgrave MacMillan. Cuberes, David. and Marc. Teignier. 2014. “Gender Inequality and Economic Growth: A Critical
Review.” Journal of International Development 26(2): 260-276.
Elborgh-Woytek, Katrin, Monique Newiak, Kalpana Kochhar, Stefania Fabrizio, Kangni Kpodar, Philippe Wingender, Benedict Clements, and Gerg Schwartz. 2013. “Women, Work, and the Economy: Macroeconomic Gains from Gender Equity.” IMF Staff Discussion Note SDN/13/10.
Elson, Diane. 2004. “Social Policy and Macroeconomic Performance: Integrating ‘the Economic’ and ‘the Social,” in Thandika Mkandawire (Ed.) Social Policy in a Development Context. Hampshire, England and New York: Palgrave Macmillan for UNRISD, pp. 63-79.
28
Folbre, Nancy. 1994. Who Pays for the Kids? Gender and the Structures of Constraint. London: Routledge.
———. 2006. “Measuring Care: Gender, Empowerment, and the Care Economy.” Journal of Human Development 7(2): 183–99.
International Labour Organization (ILO). 2014. 2014/15 World Social Protection Report. Building economic recovery, inclusive development and social justice. Geneva: International Labour Office.
Josse, J & Husson, F. 2013. “Handling Missing Values in Exploratory Multivariate Data Analysis Methods.” Journal de la Société Francaise de Statistique 153(2): 79-99.
Kabeer, Naila and Luisa Natali. 2013. “Gender Equality and Economic Growth: Is There a Win-Win?” IDS Working Paper, Volume 2013, No. 417.
Nallari, Raj and Breda Griffith. 2011. Gender and Macroeconomic Policy. Washington, D.C.: The World Bank.
Nelson, Julie A. and Paula England. 2002. “Feminist Philosophies of Love and Work.” Hypatia 17(2): 1–18.
Onaran, Özlem. 2015. “The Role of Gender Equality in an Equality-Led Sustainable Development Strategy.” In H. Bargawi, G. Cozzi, and S. Himmelweit (eds), After Austerity: Gendered Impacts and Sustainable Alternatives for Europe. Routledge.
Palma, Gabriel. 2014. “Has the Income Share of the Middle and Upper-Middle Been Stable Around the ‘50/50 Rule’, or has it Converged Towards That Level? The “Palma Ratio’ Revisited.” Development and Change 45(6): 1416–48.
Picchio, Antonella. 1991. Social Reproduction: The Political economy of the Labour Market. Cambridge, England: Cambridge University Press.
Razavi, Shahra. 2007. “The Political and Social Economy of Care in a Development Context: Conceptual Issues, Research Questions and Policy Options.” Gender and Development Programme Paper No. 3. Geneva: UNRISD.
Seguino, Stephanie. 2007. “Is More Mobility Good? Firm Mobility and the Low-wage Low-Productivity Trap.” Structural Change and Economic Dynamics 18(1): 27-51.
Seguino, Stephanie. 2010. “Gender, Distribution, and Balance of Payments Constrained Growth in Developing Countries.” Review of Political Economy 22(3): 373–404.
Seguino, Stephanie. 2017. “Engendering Macroeconomic Theory and Policy.” University of Vermont.
Stotsky, Janet. 2006. “Gender and its Relevance to Macroeconomic Policy: A Survey.” IMF Working Paper 06/233.
Taylor, Lance. 2004. Reconstructing Macroeconomics: Structuralist Proposals and Critiques of the Mainstream.
Harvard University Press.

29
United Nations Conference on Trade and Development (UNCTAD). 2016. Trade and Development Report, 2016: Structural Transformation for Inclusive and Sustained Growth. New York and Geneva: United Nations.
United Nations Development Programme (UNDP). 2013. “Technical Notes,” Human Development Report 2013. New York: UNDP.

Figure 1. Developing countries

Figure 2. Developed countries
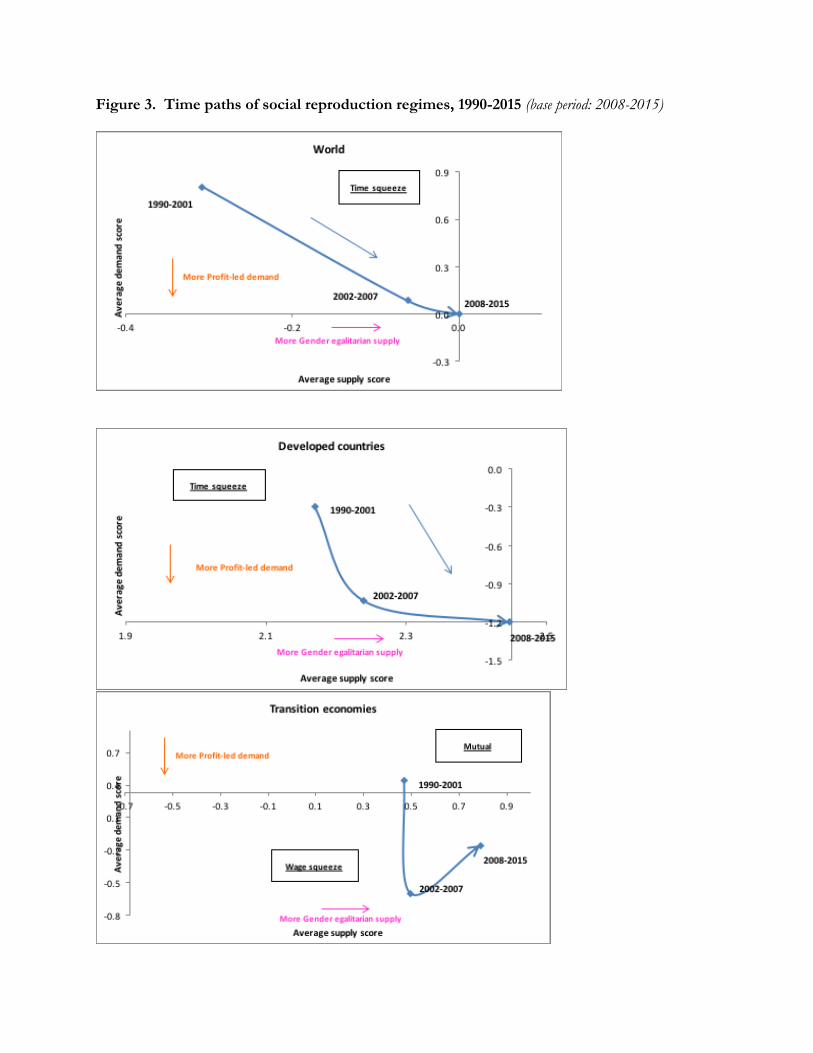
Figure 3. Time paths of social reproduction regimes, 1990-2015 (base period: 2008-2015)


Table 1. Demand and Growth
Wage-led/Altruistic Profit-led/Individualistic
Explanation
Higher wage share is expansionary: The positive impact of increased consumer demand, combined with increased investments in human capacities, outweigh the contractionary impact of the decline in the profit share.
Higher profit share is expansionary: The positive impact of increased capitalist investment demand outweighs the negative impact of lower wages on consumer demand and human capacities investment.
Factors that make each scenario more likely
Strong caring spirits Weak caring spirits Domestically-oriented economy Globally-oriented economy Developmental macro policy1 Openness-oriented macro policy
1 Developmental macro policy emphasizes the objectives of fostering employment creation and other measures of
broadly shared well-being, in part by policies that promote structural change, as compared to a focus on price stability alone.

Table 2. Supply and the Distribution of Social Reproduction
Low Road: High Road: Feminization of
responsibility & obligation Gender egalitarian
Explanation
Increasing output and female labor force participation is associated with declines in human capacities production, ultimately lowering profits.
Increasing output and female labor force participation is associated with increases in human capacities production and higher profits.
Factors that make each scenario more likely
Low male contributions to social reproduction Large gender wage gaps
Significant contributions to social reproduction by both women and men
Small gender wage gaps Limited and/or low quality market care sector Little public provision of care Poor reproductive infrastructure
Extensive and high quality market care sector Strong public provision of care Good reproductive infrastructure

Table 3. Growth and social reproduction
Supply: The distribution of social reproduction
Demand: Growth
Low road Feminization of
responsibility & obligation (FRO)
High road Gender egalitarian (GE)
Wage-led/altruistic
Time squeeze Higher wages for women are good for growth, but more market participation squeezes time and lowers human capacities production. Growth is elusive or unstable.
Mutual Higher wages for women are good for growth, and more market participation increases human capacities production. Growth and social reproduction reinforce one another.
Profit-led/individualistic
Exploitation Higher wages for women lower growth, and more market participation squeezes time and lowers human capacities production. Growth is partly based on exploiting women’s labor and human resources.
Wage squeeze Higher wages for women lower growth, but more market participation enhances human capacities production. Growth is elusive or unstable.

Table 4. Summary statistics: Demand
Element Variable Short name
Period Mean Median Standard deviation
Missing values
(%)
5-year percentage point change in non-income HDI less 5-year percentage point change in income index
HDI2
Caring spirits
1990-2001 0.02 0.02 0.02 14.74
2002-2007 0.01 0.01 0.03 9.62
2008-2015 0.01 0.01 0.02 3.21
mfgX
Global orientation
Manufacturing exports as a share of GDP (%)
1990-2001 11.63 6.00 15.90 9.62
2002-2007 14.66 7.10 20.39 9.62
2008-2015 14.88 7.96 20.00 10.90
Inward FDI as a share of gross fixed capital formation (%)
FDI 1990-2001 13.23 9.82 12.53 7.05
2002-2007 21.67 16.72 20.86 5.77
2008-2015 22.54 14.12 31.11 3.85
Macro policy
pub
Public investment as a share of GDP (%)
1990-2001 5.77 4.88 3.67 20.51
2002-2007 5.20 4.64 2.67 20.51
2008-2015 6.46 4.82 5.14 23.08
Weighted average tariff rates applied
TFF 1990-2001 10.86 10.00 6.36 16.67 2002-2007 8.32 7.58 5.06 7.05 2008-2015 7.05 6.69 3.95 7.69

Table 5. Summary statistics: Supply
Element Variable Short name
Period Mean Median Standard deviation
Missing values
(%)
Ratio of female age of first marriage to male age of first marriage
afmr
Men’s relative contribution to social reproduction
1990-2001 0.86 0.88 0.06 8.33 2002-2007 0.87 0.88 0.06 30.77 2008-2015 0.87 0.88 0.06 21.15
Gender wage gap
Ratio of the share of wage and salaried workers in women’s employment to men’s employment
fmemp
1990-2001 0.92 1.03 0.27 30.77
2002-2007 0.93 1.03 0.26 25.00
2008-2015 0.94 1.03 0.24 21.15
Public provisioning of care
Public social protection and health expenditure as a share of GDP (%)
sph
1990-2001 8.67 4.37 7.71 10.90
2002-2007 9.63 6.37 7.74 10.26
2008-2015 10.77 7.37 8.39 6.41
Reproductive infrastructure
Average access to electricity, non-solid fuel, improved sanitation facilities and improved water source
repro
1990-2001 67.01 80.35 30.11 2.56
2002-2007 70.90 85.14 28.90 2.56
2008-2015 73.02 88.11 28.19 2.56
Extent and quality of the market care sector
Share of women’s service employment to total employment, raised to the power of the inverse of the Palma ratio1
mcare
1990-2001 10.38 2.58 17.05 37.18
2002-2007 8.39 2.62 12.41 30.13
2008-2015 9.32 3.11 13.07 31.41
1 The Palma ratio is the ratio of the richest 10 percent of the population’s share of gross national income divided by the
poorest 40 percent share (Palma 2014).
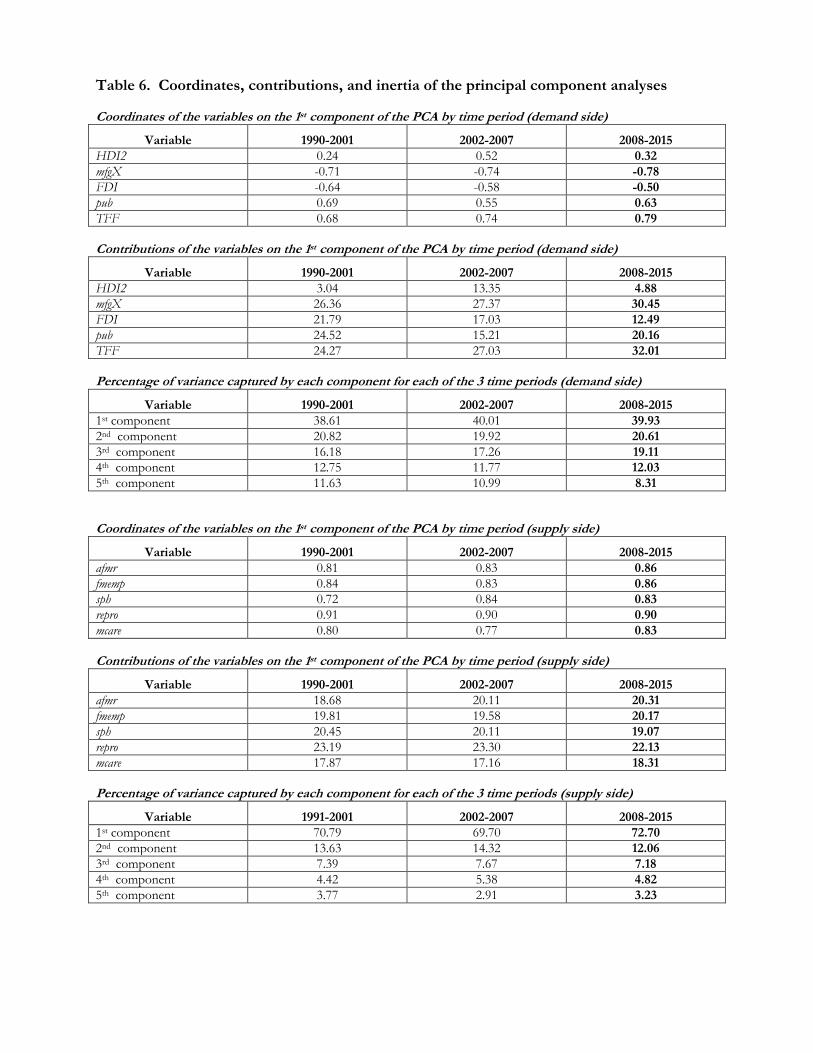
Table 6. Coordinates, contributions, and inertia of the principal component analyses Coordinates of the variables on the 1st component of the PCA by time period (demand side)
Variable 1990-2001 2002-2007 2008-2015
HDI2 0.24 0.52 0.32
mfgX -0.71 -0.74 -0.78
FDI -0.64 -0.58 -0.50
pub 0.69 0.55 0.63
TFF 0.68 0.74 0.79
Contributions of the variables on the 1st component of the PCA by time period (demand side)
Variable 1990-2001 2002-2007 2008-2015
HDI2 3.04 13.35 4.88
mfgX 26.36 27.37 30.45
FDI 21.79 17.03 12.49
pub 24.52 15.21 20.16
TFF 24.27 27.03 32.01
Percentage of variance captured by each component for each of the 3 time periods (demand side)
Variable 1990-2001 2002-2007 2008-2015
1st component 38.61 40.01 39.93
2nd component 20.82 19.92 20.61
3rd component 16.18 17.26 19.11
4th component 12.75 11.77 12.03
5th component 11.63 10.99 8.31
Coordinates of the variables on the 1st component of the PCA by time period (supply side)
Variable 1990-2001 2002-2007 2008-2015
afmr 0.81 0.83 0.86
fmemp 0.84 0.83 0.86
sph 0.72 0.84 0.83
repro 0.91 0.90 0.90
mcare 0.80 0.77 0.83
Contributions of the variables on the 1st component of the PCA by time period (supply side)
Variable 1990-2001 2002-2007 2008-2015
afmr 18.68 20.11 20.31
fmemp 19.81 19.58 20.17
sph 20.45 20.11 19.07
repro 23.19 23.30 22.13
mcare 17.87 17.16 18.31
Percentage of variance captured by each component for each of the 3 time periods (supply side)
Variable 1991-2001 2002-2007 2008-2015
1st component 70.79 69.70 72.70
2nd component 13.63 14.32 12.06
3rd component 7.39 7.67 7.18
4th component 4.42 5.38 4.82
5th component 3.77 2.91 3.23

Table 7. Distribution of social reproduction regimes by region, 2008-2015
Region Exploitation Mutual Time
squeeze Wage
squeeze Number of countries
Developed economies 15% 24% 38% 24% 34
Developing Africa 15% 13% 69% 4% 48
Developing America 5% 32% 5% 59% 22
Developing Asia 15% 12% 18% 56% 34
Developing Oceania 100% 0% 0% 0% 1
Transition economies 0% 18% 0% 82% 17
World 12% 18% 34% 36% 156 Note: The classification of country groups conforms to that used by the United Nations.

1
Appendix A. Data
Variable Short name
Source
5-year percentage point change in non-income HDI less 5-year percentage point change in income index
HDI2 Calculated based on disaggregating components of the Human Development Index (HDI), UNDP
Manufacturing exports as a share of GDP mfgX Manufacturing exports drawn from Comtrade database, GDP from World Development Indicators (WDI) database, both in US$.
Inward FDI as a share of GDP FDI Calculated from WDI database.
Public investment as a share of GDP pub Calculated from WDI database, based on reported shares of private investment in gross fixed capital formation.
Weighted average tariff rates applied TFF Calculated based on data drawn from TRAINS database, UNCTAD. Weights based on imports by product group at the HS 2-digit level.
Ratio of female age of first marriage to male age of first marriage
afmr Calculated based on UNDESA Population Division World Marriage Data.
Ratio of the share of wage and salaried workers in women’s to men’s employment
fmemp Calculated based on data drawn from WDI database.
Public social protection and health expenditure as a share of GDP
sph
Drawn from Table B.12 in the 2014/15 World Social Protection Report (ILO 2014). Public social protection expenditures include public benefits for the following: unemployment, employment injury, disability, maternity, and general social assistance.
Average access to electricity, non-solid fuel, improved sanitation facilities and improved water source
repro Calculated based on series drawn from WDI database.
Share of women’s service employment to total employment, raised to the power of the inverse of the Palma ratio
mcare Employment share calculated based on data from WDI database; Palma ratio drawn from Global Income and Consumption Project (GICP) database.

Appendix B. Social reproduction regime by region and country (2008-2015)
Developed countries Australia Time squeeze Austria Mutual Belgium Wage squeeze Bulgaria Time squeeze Canada Time squeeze Croatia Time squeeze Cyprus Exploitation Czech Republic Wage squeeze Denmark Mutual Estonia Exploitation Finland Mutual France Mutual Germany Wage squeeze Greece Time squeeze Hungary Wage squeeze Ireland Wage squeeze Israel Time squeeze Italy Time squeeze Japan Mutual Latvia Exploitation Lithuania Exploitation Netherlands Wage squeeze New Zealand Time squeeze Norway Mutual Poland Exploitation Portugal Time squeeze Romania Time squeeze Slovak Republic Wage squeeze Slovenia Wage squeeze Spain Time squeeze Sweden Mutual Switzerland Time squeeze United Kingdom Mutual United States Time squeeze Developing Africa Algeria Mutual Angola Time squeeze Benin Time squeeze Botswana Mutual Burkina Faso Time squeeze Burundi Time squeeze Cameroon Time squeeze Central African Republic Time squeeze Chad Time squeeze Congo, Dem. Rep. Time squeeze Congo, Rep. Time squeeze Cote d'Ivoire Exploitation Egypt, Arab Rep. Mutual Eritrea Time squeeze Ethiopia Time squeeze Gabon Mutual Gambia, The Time squeeze Ghana Time squeeze Guinea Time squeeze Guinea-Bissau Time squeeze Kenya Time squeeze Lesotho Time squeeze Liberia Exploitation Libya Time squeeze Madagascar Exploitation Malawi Time squeeze Mali Time squeeze Mauritania Time squeeze Mauritius Wage squeeze Morocco Mutual Mozambique Exploitation Namibia Exploitation Niger Time squeeze Nigeria Time squeeze
Rwanda Time squeeze Senegal Time squeeze Sierra Leone Exploitation Somalia Exploitation South Africa Wage squeeze South Sudan Time squeeze Sudan Time squeeze Swaziland Time squeeze Tanzania Time squeeze Togo Time squeeze Tunisia Mutual Uganda Time squeeze Zambia Time squeeze Zimbabwe Time squeeze Developing America Argentina Mutual Bolivia Mutual Brazil Mutual Chile Wage squeeze Colombia Mutual Costa Rica Wage squeeze Cuba Wage squeeze Dominican Republic Wage squeeze Ecuador Mutual El Salvador Wage squeeze Guatemala Exploitation Haiti Time squeeze Honduras Wage squeeze Jamaica Mutual Mexico Wage squeeze Nicaragua Wage squeeze Panama Wage squeeze Paraguay Wage squeeze Peru Wage squeeze Trinidad and Tobago Wage squeeze Uruguay Wage squeeze Venezuela, RB Mutual Developing Asia Afghanistan Time squeeze Bahrain Wage squeeze Bangladesh Time squeeze Cambodia Exploitation China Wage squeeze Hong Kong SAR, China Wage squeeze India Exploitation Indonesia Wage squeeze Iran, Islamic Rep. Mutual Iraq Mutual Jordan Wage squeeze Korea, Dem. People’s Rep. Wage squeeze Korea, Rep. Wage squeeze Kuwait Wage squeeze Lao PDR Time squeeze Lebanon Wage squeeze Malaysia Wage squeeze Mongolia Wage squeeze Myanmar Exploitation Nepal Time squeeze Oman Mutual Pakistan Time squeeze Philippines Wage squeeze Qatar Wage squeeze Saudi Arabia Wage squeeze Singapore Wage squeeze Sri Lanka Wage squeeze Syrian Arab Republic Mutual Thailand Wage squeeze Timor-Leste Time squeeze Turkey Wage squeeze

United Arab Emirates Wage squeeze Vietnam Exploitation Yemen, Rep. Exploitation Developing Oceania Papua New Guinea Exploitation Transition economies Albania Wage squeeze Armenia Wage squeeze Azerbaijan Wage squeeze Belarus Wage squeeze Bosnia and Herzegovina Wage squeeze Georgia Wage squeeze Kazakhstan Wage squeeze Kosovo Mutual Kyrgyz Republic Wage squeeze Macedonia, FYR Wage squeeze Moldova Wage squeeze Russian Federation Wage squeeze Serbia Wage squeeze Tajikistan Mutual Turkmenistan Mutual Ukraine Wage squeeze Uzbekistan Wage squeeze


![Gender Equality[1]](https://static.fdocuments.in/doc/165x107/55cf8541550346484b8c02d5/gender-equality1.jpg)