Social Protection for the Elderly and People with...
24
1 January 2019 Social Protection for the Elderly and People with Disability Office of The Vice President The Republic of Indonesia/ The National Team for the Acceleration of Poverty Reduction (TNP2K)
Transcript of Social Protection for the Elderly and People with...
1January 2019
Social Protection for
the Elderly and People with Disability
Office of The Vice President The Republic of Indonesia/
The National Team for the Acceleration of Poverty Reduction (TNP2K)

2
Economy, Social and Demographic Context of
the Elderly and People with Disability
1
3
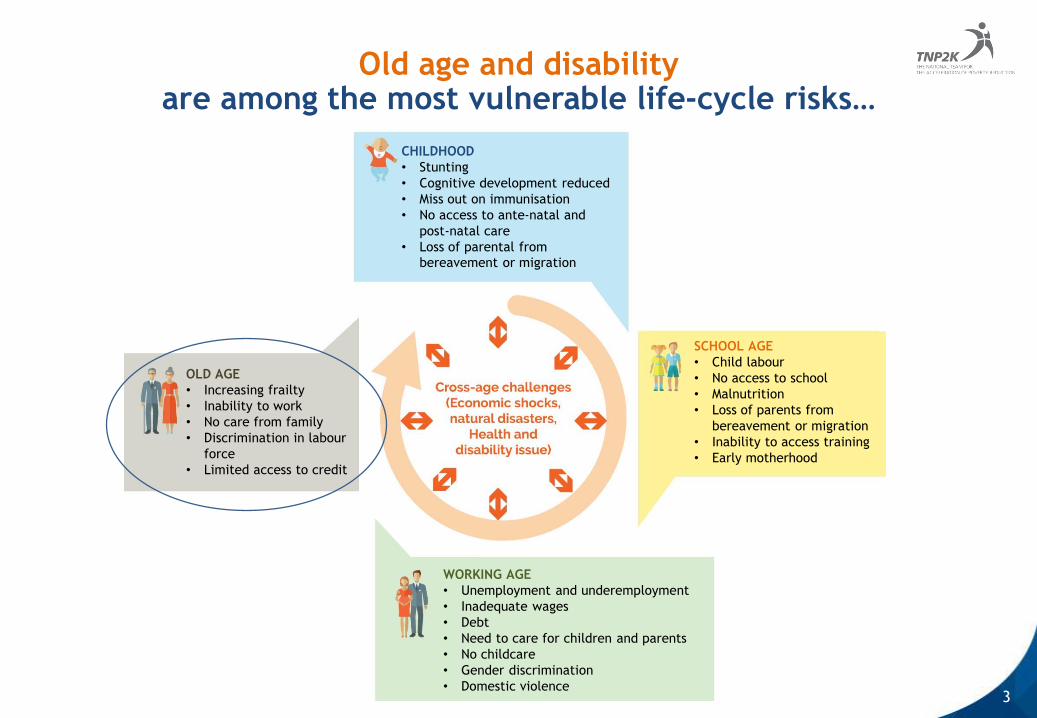
CHILDHOOD
• Stunting
• Cognitive development reduced
• Miss out on immunisation
• No access to ante-natal and
post-natal care
• Loss of parental from
bereavement or migration
OLD AGE
• Increasing frailty
• Inability to work
• No care from family
• Discrimination in labour
force
• Limited access to credit
SCHOOL AGE
• Child labour
• No access to school
• Malnutrition
• Loss of parents from
bereavement or migration
• Inability to access training
• Early motherhood
WORKING AGE
• Unemployment and underemployment
• Inadequate wages
• Debt
• Need to care for children and parents
• No childcare
• Gender discrimination
• Domestic violence
Old age and disabilityare among the most vulnerable life-cycle risks…

4
Indonesia is becoming an aging society…
8.5%9.9%
11.6%
13.6%
15.6%
17.6%
19.5%21.1%
1.0% 1.2% 1.4% 1.6% 2.0% 2.6% 3.3%4.1%
0.0%
5.0%
10.0%
15.0%
20.0%
25.0%
2015 2020 2025 2030 2035 2040 2045 2050
Perc
ent
of
tota
l popula
tion
60+
80+
Source: Susenas 2017
• Currently, Indonesia has more than 20 million elderly people.
• By 2020, around 10% of Indonesia’s population will be aged 60 years and above,
rising to 13.6% by 2030.
• by 2050, 21.1%, or more than one in five Indonesians, will be considered elderly.
Growth Projection of Indonesia Elderly Population
5
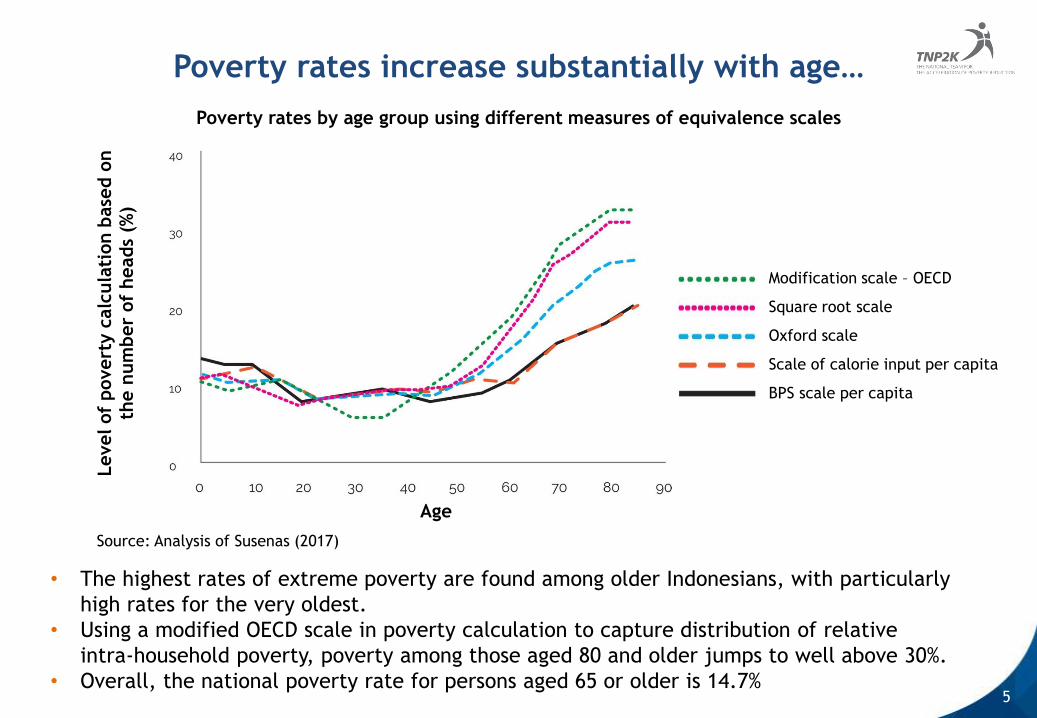
Poverty rates increase substantially with age…
• The highest rates of extreme poverty are found among older Indonesians, with particularly
high rates for the very oldest.
• Using a modified OECD scale in poverty calculation to capture distribution of relative
intra-household poverty, poverty among those aged 80 and older jumps to well above 30%.
• Overall, the national poverty rate for persons aged 65 or older is 14.7%
Poverty rates by age group using different measures of equivalence scales
Age
Level of
povert
y c
alc
ula
tion b
ase
d o
nth
e n
um
ber
of
heads
(%)
Modification scale – OECD
Square root scale
Oxford scale
Scale of calorie input per capita
BPS scale per capita
Source: Analysis of Susenas (2017)
6
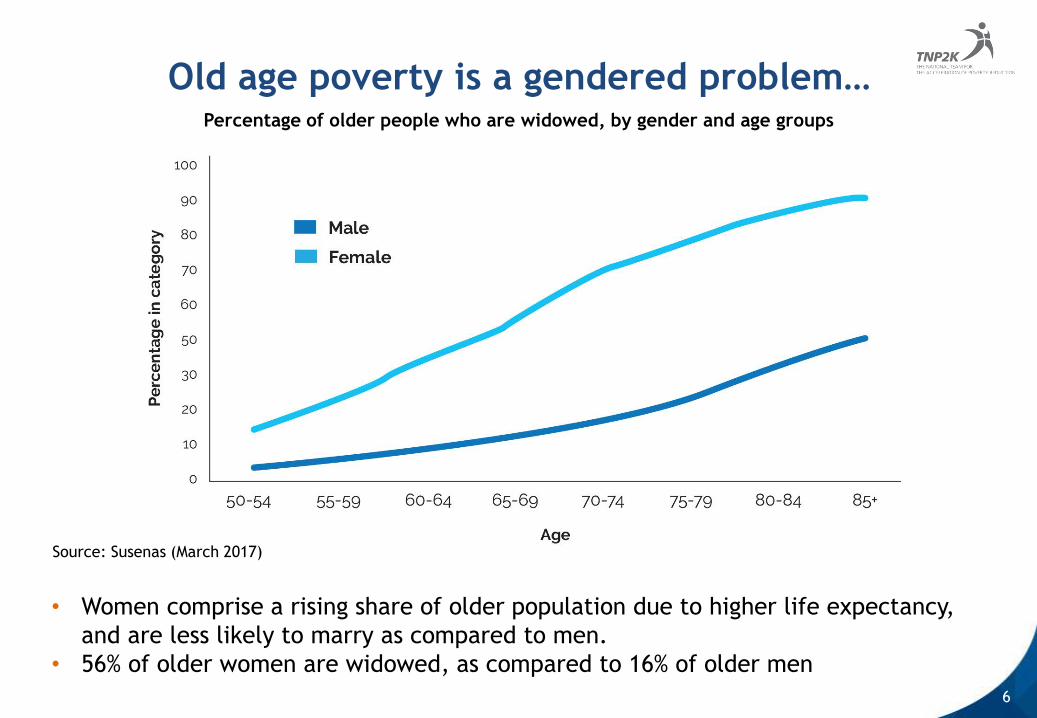
Old age poverty is a gendered problem…
• Women comprise a rising share of older population due to higher life expectancy,
and are less likely to marry as compared to men.
• 56% of older women are widowed, as compared to 16% of older men
Percentage of older people who are widowed, by gender and age groups
Source: Susenas (March 2017)

7
Proportion of older people, by living arrangements and gender
Family support matters, but is insufficient…
• Nearly 70% of elderly people live with their children. There is an assumption that the onus of old-age care
should fall on the family, but the reality is challenge.
• More than 60% of households live on less than 55,000 IDR a day. They have to make difficult choices about
their economic investments. Taking care of elderly parents means investing less in their current children, and
this will affect the labour productivity of the future.
• The elderly do not want to rely on their children for income. They want their own income,
to make economic decisions for themselves.
Older people = people over 60
Source: Susenas (March 2017)

8
• More than 55% of people over
65 years experience
moderate or severe
functional limitations
• Disability and ill health are
key reasons for reducing or
stopping work.
• Levels of employment start
dropping after age 50, but
many (have to) continue to
work to meet basic needs.
Source: Supas 2015
Capacity to work decreases significantly in old age…
Percentage of people experiencing difficultiesin undertaking basic activities, by age
0
20
40
60
80
0 20 40 60 80
Age (in years)
Pre
vale
nce
of
fun
ctio
nal l
imita
tion
s (%
)
moderate
severe
Pre
vale
nce o
f fu
ncti
onal lim
itati
ons
(%)
Age (in years)

9
Yet people continue to work into very old age,
despite these limitations…
Percentage of people working in the week before the survey
Source: Susenas (2017)
10
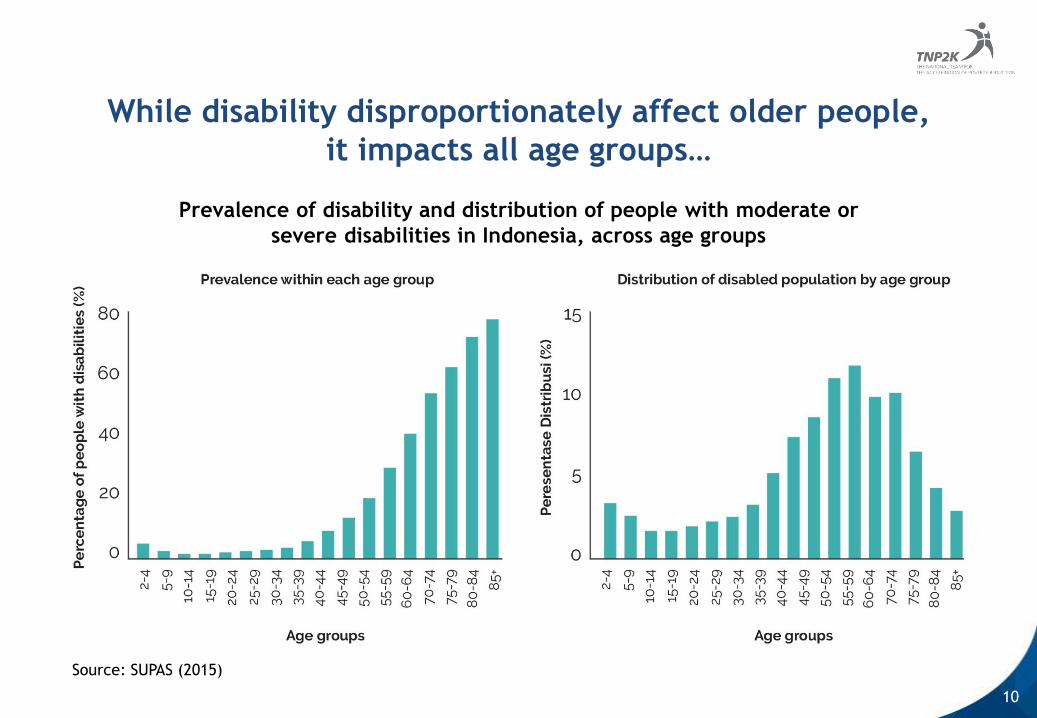
Prevalence of disability and distribution of people with moderate or
severe disabilities in Indonesia, across age groups
While disability disproportionately affect older people,
it impacts all age groups…
Source: SUPAS (2015)

11
Age Groups All population
PwD with Moderate or
Severe Disability
PwD with
Severe Disability
Number % Number %
Aged 0-6 yrs 24,063,555.00 1,047,703.00 4% 305,918.00 1%
Aged 7-18 yrs 38,230,392.00 622,106.00 2% 173,217.00 0%
Aged 19-59 yrs 162,732,512.00 9,549,485.00 6% 1,449,725.00 1%
Aged 60++ 21,609,716.00 9,888,281.00 46% 2,683,278.00 12%
Total 246,636,175.00 21,107,575.00 9% 4,612,138.00 2%
Approximately 9% of Indonesians experience
moderate or severe disability…
Source: TNP2K (2018)

12
... and, disability and poverty are inextricably linked…
Without limitation ADL
At least one severe
limitation
ADL = activities of daily living
Official BPS poverty line = IDR11,994 per person per day
Source: IFLS (2014)
Poverty rates in Indonesia according to disability status, by age group

13
If we took into account the extra costs of disability, we’d see that persons with disability are much poorer than
the numbers show…
Source: World Social Protection Report 2017–19: Universal social protection to achieve the Sustainable Development Goals; page 73
International Labour Office – Geneva: ILO, 2017
Note: The figure shows poverty headcount ratio of households including persons with disabilities, and adjusted ratio when taking
into account disability-related costs.
Sources: (1) Palmer, Williams and McPake, 2016; (2) Mont and Cuong, 2011; (3) and (4) Braithwaite and Mont, 2009.
Link: http://www.social-protection.org/gimi/gess/RessourceDownload.action?ressource.ressourceld=54652
17.9 17.616.4
21.1
34.3
22.320.1
30.8
0
5
10
15
20
25
30
35
40
Cambodia (1) Viet Nam (2) Viet Nam (3) Bosnia andHerzegovina (4)
Original Adjusted
Povert
y r
ate
(%
)

14
Existing Social Protection
for the Elderly and PwDs
2

15
Existing social protection for the elderly and
PwDs is extremely limited
Source: TNP2K 2018 Publication
ProgramNumber of
beneficiaries
Percentage of people with
disabilities with access to social
protection programs for people
with disabilities
PKH 47,087 1,24
ASPDB 22,500 0,59
Social security for
Employment
Programs
112,490 2,95
Taspen/Asabri N/A
TOTAL 182,077 4,78
Program
Number of contributing
members (BPJS and
Taspen-Asabri) and
number of social
assistance beneficiaries
(ASLUT and PKH)
Percentage of people
aged 60 and above
with access to social
protection programs
for the elderly
JHT and JP managed by
Social Security Agency
for Employment
249 (2015) 0,001%
Pension for civil servants
managed by PT Taspen2,500,000 (2017) 11,13%
Pension for
military/police managed
by PT Asabri
360,000 (2016) 1,5%
ASLUT 30,000 0,13%
PKH 150,000 0,64%
TOTAL 3,040,249 13,4%
Source: Social Security Agency for Employment (2015), PT Taspen (2017)
and PT Asabri (2016), ASLUT (2017), Susenas (2017)
Notes: The number of people with disability is simulated using SUPAS
2015 data, with a total of 3,810,094 people with disabilities. Using this
data, we can derive the distribution of disabled individuals across age
group and province and apply this to SUSENAS (2017).
Source: Bappenas (2016 and 2017) for ASPDB and PKH beneficiaries and
Social Security Agency for Employment (2017)
• Including civil service pensions and contributory benefits, we see that 5% of people with disabilities and 13% of
elderly are covered, respectively (Susenas, 2017)
• When focusing on non-contributory benefits, we see that less than 2% of people with disabilities and less than
1% of elderly are covered (2018 coverage numbers slightly higher now with PKH expansion)

16
Future Social Protection Recommendation
for the Elderly and PwDs
3
17
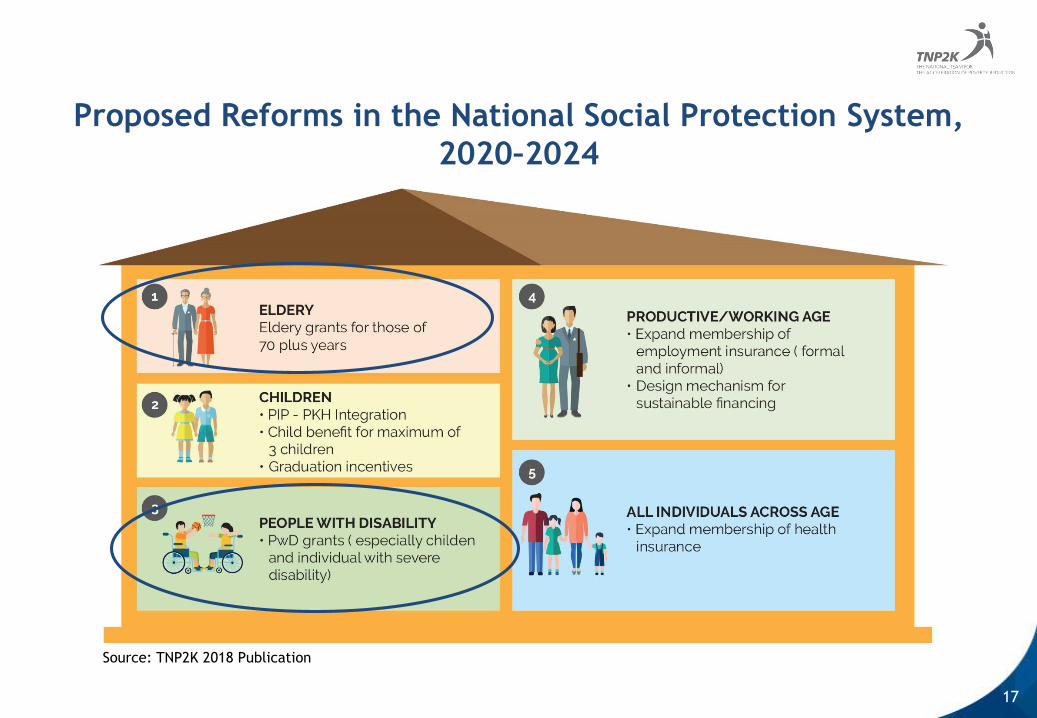
Proposed Reforms in the National Social Protection System,
2020–2024
Source: TNP2K 2018 Publication

18
A comprehensive social protection system for the elderly
Source: TNP2K-Mahkota 2018
Argentina, Brazil, Cabo Verde, China, Kyrgyzstan, Maldives, South Africa, Thailand, Trinidad and Tobago
have achieved 100% social protection coverage for the elderly through a non-contributory and
contributory hybrid (ILO, 2018)

19
Global Increase In Social Pensions Showing Wealth of Country
At Time Of Introduction, Selected Countries, 1890–2018
Source: Gapminder Data, retrieved from https://www.gapminder.org/data/documentation/

20
A comprehensive social protection system
for people with disability
Disability
adjusted
poverty line
Current PKH
eligibility
threshold
Top-up for
persons
with
disabilities
within PKH
familiesPKH for poor
households,
including
persons with
disabilities
Disability
allowance for
all children
and adults with
severe
disabilities
(non PKH
beneficiaries)
BPJS
employment
schemes
(JKK, JHT,
JKM) for
contributing
members
TIER 1:
PKH with disability ‘top-up’
TIER 2:
Disability allowance
TIER 3:
BPJS employment
schemes
FOR ALL TIERS
Disability specific
income tax
allowance and
employment
incentives
&
Significant
concessions
(transport BPJS
Health covering
assistive devices,
education,
housing)
• Nepal, Vietnam, Georgia, South Africa, Bangladesh, Kenya and Fiji have well-established
comprehensive systems for people with disabilities, including non-contributory, contributory, and
concession schemes
Source: TNP2K/MAHKOTA 2019
21
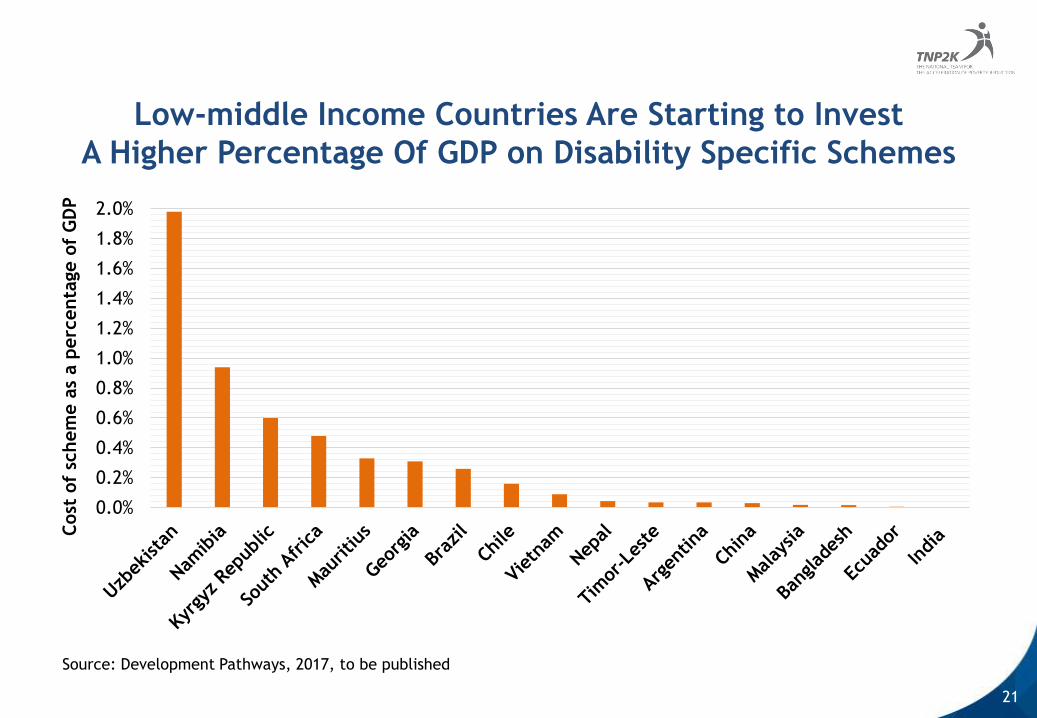
Low-middle Income Countries Are Starting to Invest
A Higher Percentage Of GDP on Disability Specific Schemes
0.0%
0.2%
0.4%
0.6%
0.8%
1.0%
1.2%
1.4%
1.6%
1.8%
2.0%
Cost
of
schem
e a
s a p
erc
enta
ge o
f G
DP
Source: Development Pathways, 2017, to be published

22
Proposed Elderly and Disability Grant Coverage
Source: TNP2K 2018 Publication
Program Target group Benefit size
Non-
contributory
elderly grant
Those above the age 70
who are not benefitting
from a contributory
pension
IDR300,000
per individual
per month
Program Target group Benefit size
Non-
contributory
severe
disability grant
All children and
adults with a
severe
disability
IDR300,000
per individual
per month
Overview of non-contributory schemes for the elderly
(2020-2024)
Overview of non-contributory schemes for people
with disabilities (2020-2024)
Program 2020 2021 2022 2023 2024
Child disability
benefit860,000 858,000 857,000 856,000 855,000
Adult disability
benefit1,596,000
1,618,00
01,639,000 1,659,000 1,679,000
Coverage of people with disabilities in proposed programs
(2020-2024)
Program 2020 2021 2022 2023 2024
Elderly grant
(70+)8,011,000 8,155,000 8,281,000 8,399,000 8,525,000
Coverage of the elderly in proposed programs (2020-2024)
• The elderly grant at this level would reduce poverty among those above the age of 70 by 59%, and the
poverty gap by 72%
• The disability benefit would reduce poverty among persons with severe disability by 44%, and the
poverty gap by 53%
23
Proposed Elderly and Disability Grant Coverage
• In Indonesia, the elderly and people with disability experience the highest rates
of poverty and vulnerability
• These two groups also receive the most limited social protection coverage.
Approximately 98% of people with severe disability and 99% of the elderly (who
are not part of the contributory system) are without basic income security
• A comprehensive social protection system means filling this gap through a
combination of non-contributory and contributory schemes.
• Non-contributory schemes for these groups, such as elderly grants, grants for
people with severe disability, and concessions would provide income security for
the elderly and people with disabilities NOW.
• At the same time, working age people should also be incentivized to contribute
to BPJS employment schemes so that they can be protected in THE FUTURE.

24
Thank You