Carter Moody Writing-Editing Sample--Annual Report, Ctr. for Refugees & Immigrants
Upload
dangkhuongCategory
view
216download
1
Social Outcomes of Immigrants and Refugees in Canada: Data Innovations, Knowledge and Gaps
International Forum on Migration Statistics – January 15-16, 2018Xiaoyi Yan (Ph. D.)Immigration, Refugees and Citizenship Canada
Purpose• To present on data innovation initiatives for measuring integration outcomes • To present on social and health outcomes of immigrants and refugees• To identify knowledge and data gaps and the way forward
Outline• Overview of strategic data development that enabled the understanding of
social and health outcomes of immigrants and refugees in Canada
• Knowledge of social and health outcomes of immigrants and refugees:
o The differences in social outcomes of recent immigrants, established immigrants and the Canadian-born in terms of: ➢ Social, physical and mental well-being➢ Perceptions of society and self➢ Social support and connections➢ Social, civic and political participation
o How are social outcomes associated with employment status and knowledge of official languages?
• Knowledge gaps and forward plans
Purpose and outline
Strategic data development initiatives
• Immigrants landing file (ILF): administrative data of permanent residents
• Oversampling of immigrants in Statistics Canada surveyso Oversampling of immigrants in General Social Survey (GSS) on Social Identityo Oversampling of immigrants in GSS on Victimization
• Administrative and survey data linkages:o ILF-tax file linkage (IMDB dating back to 1980)o Post survey record linkage of GSS with ILFo ILF-National Household Survey 2011 (NHS) linkage o ILF-2016 Census linkage and inclusion of immigration categories in Census releaseo IMDB-hospital discharge abstract database
• Social and economic record linkage environmento ILF-Canadian Community Health Survey (CCHS) 2000-2014 including modules on mental
healtho Canadian Employer-Employee Dynamics Database (CEEDD)
• In-house program data developmento Immigration Contribution Agreement Reporting Environment (iCARE)
3
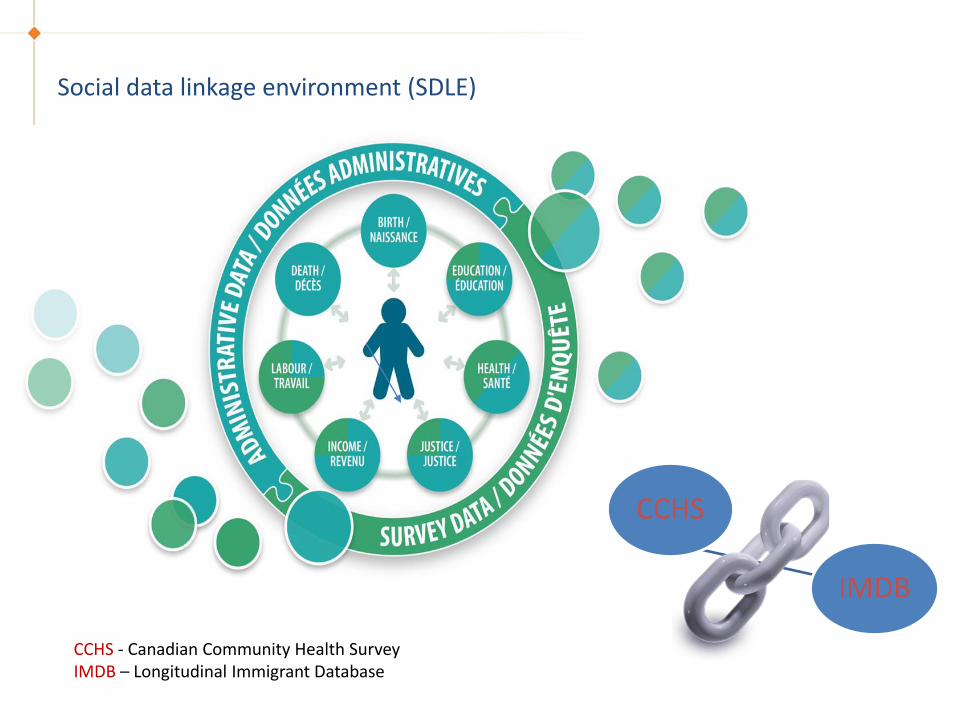
Social data linkage environment (SDLE)
CCHS
IMDB
CCHS - Canadian Community Health SurveyIMDB – Longitudinal Immigrant Database
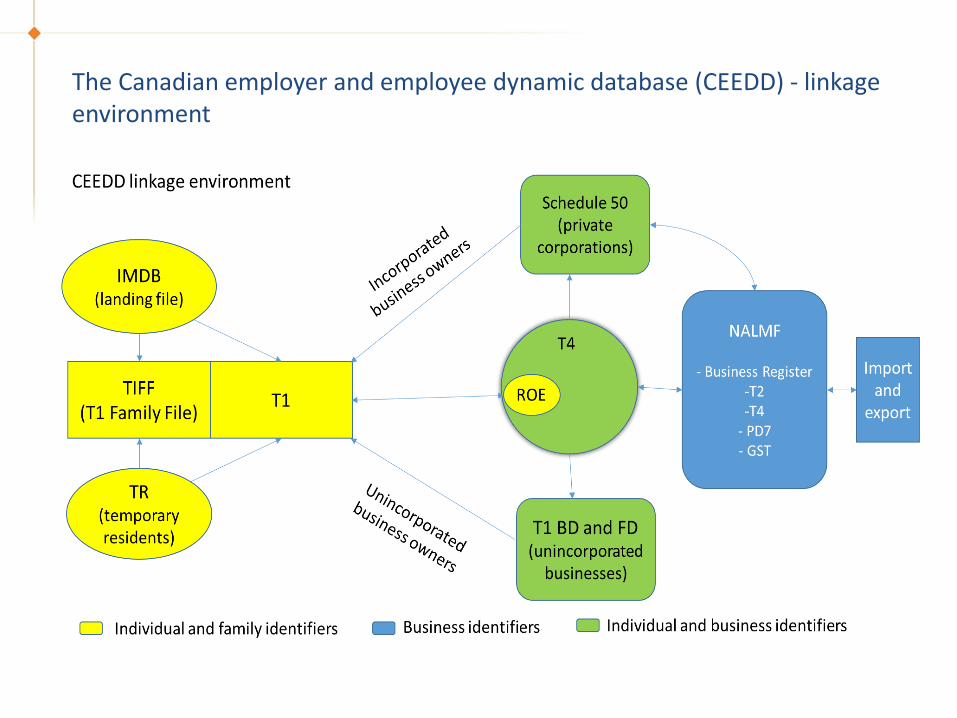
The Canadian employer and employee dynamic database (CEEDD) - linkage environment
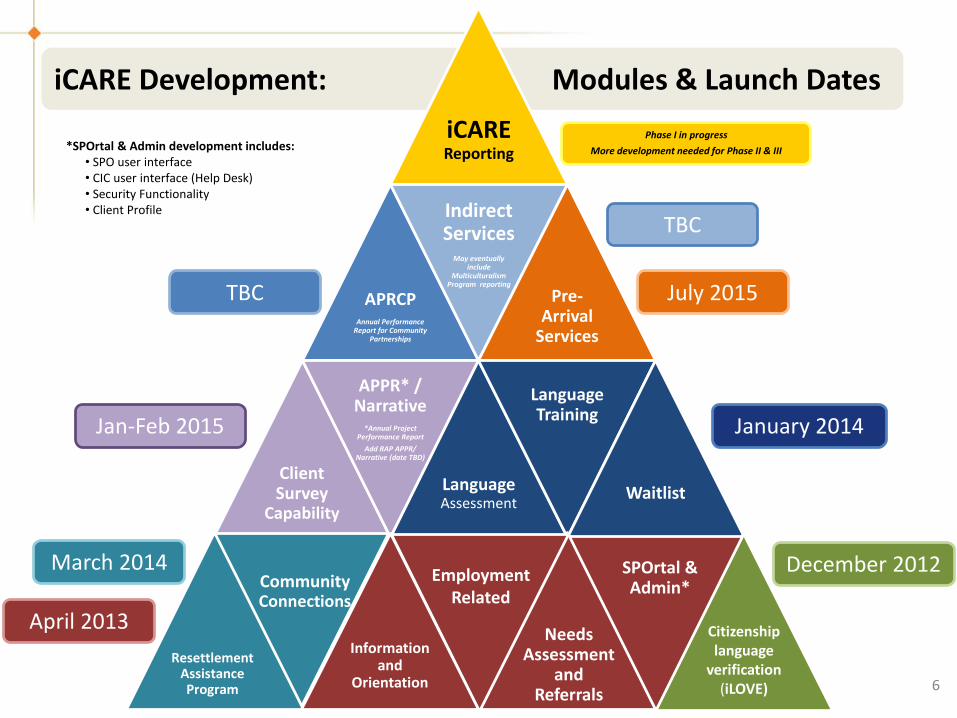
iCARE Development: Modules & Launch Dates
iCARE Reporting
APRCPAnnual Performance
Report for Community Partnerships
Indirect Services
May eventually include
Multiculturalism Program reporting
Pre-Arrival
Services
Client Survey
Capability
APPR* / Narrative
*Annual Project Performance Report
Add RAP APPR/ Narrative (date TBD)
LanguageAssessment
Language Training
Waitlist
April 2013
January 2014
December 2012March 2014
Jan-Feb 2015
July 2015
Citizenship language
verification (iLOVE)
SPOrtal & Admin*
Needs Assessment
and Referrals
Employment Related
Community Connections
Resettlement Assistance Program
Information and
Orientation
*SPOrtal & Admin development includes:• SPO user interface • CIC user interface (Help Desk)• Security Functionality• Client Profile
6
Phase I in progress
More development needed for Phase II & III
TBC
TBC
7
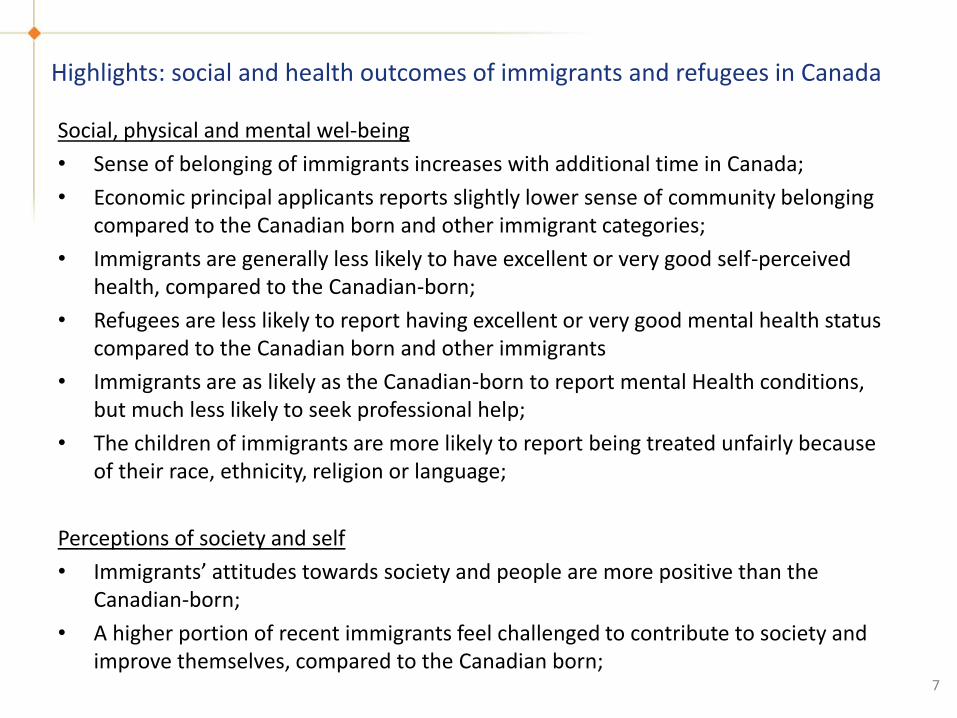
Highlights: social and health outcomes of immigrants and refugees in Canada
Social, physical and mental wel-being
• Sense of belonging of immigrants increases with additional time in Canada;
• Economic principal applicants reports slightly lower sense of community belonging compared to the Canadian born and other immigrant categories;
• Immigrants are generally less likely to have excellent or very good self-perceived health, compared to the Canadian-born;
• Refugees are less likely to report having excellent or very good mental health status compared to the Canadian born and other immigrants
• Immigrants are as likely as the Canadian-born to report mental Health conditions, but much less likely to seek professional help;
• The children of immigrants are more likely to report being treated unfairly because of their race, ethnicity, religion or language;
Perceptions of society and self
• Immigrants’ attitudes towards society and people are more positive than the Canadian-born;
• A higher portion of recent immigrants feel challenged to contribute to society and improve themselves, compared to the Canadian born;
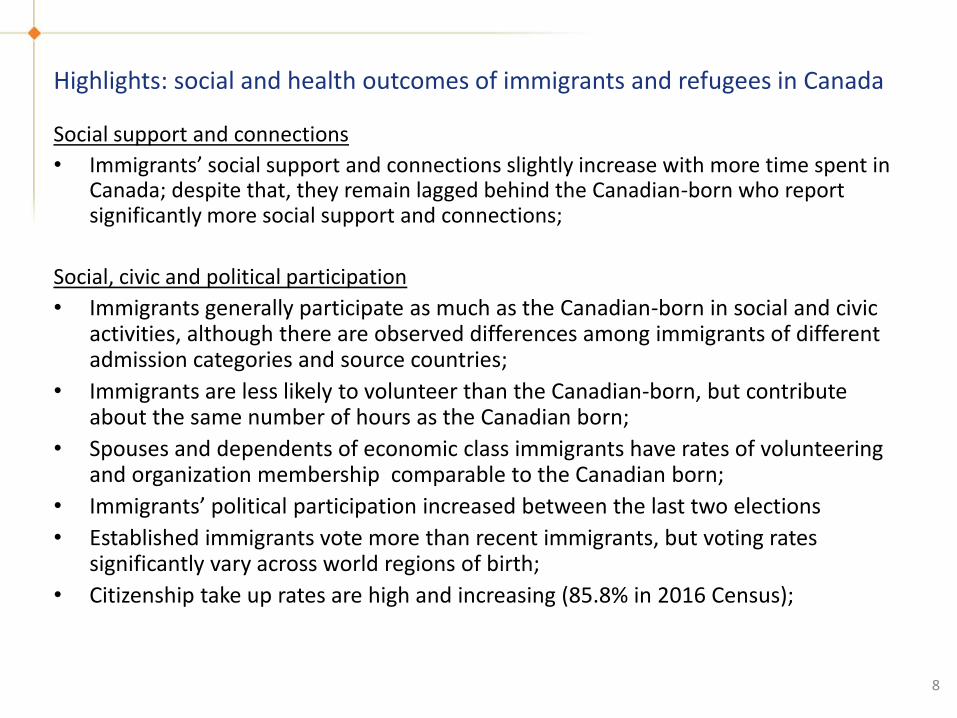
Highlights: social and health outcomes of immigrants and refugees in Canada
Social support and connections
• Immigrants’ social support and connections slightly increase with more time spent in Canada; despite that, they remain lagged behind the Canadian-born who report significantly more social support and connections;
Social, civic and political participation
• Immigrants generally participate as much as the Canadian-born in social and civic activities, although there are observed differences among immigrants of different admission categories and source countries;
• Immigrants are less likely to volunteer than the Canadian-born, but contribute about the same number of hours as the Canadian born;
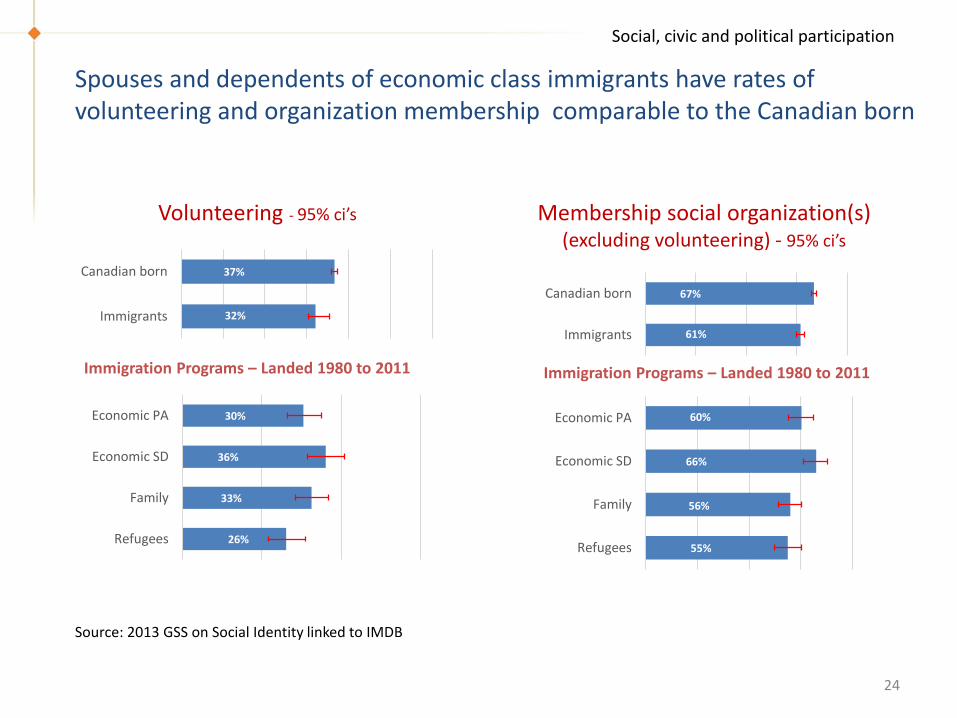
• Spouses and dependents of economic class immigrants have rates of volunteering and organization membership comparable to the Canadian born;
• Immigrants’ political participation increased between the last two elections
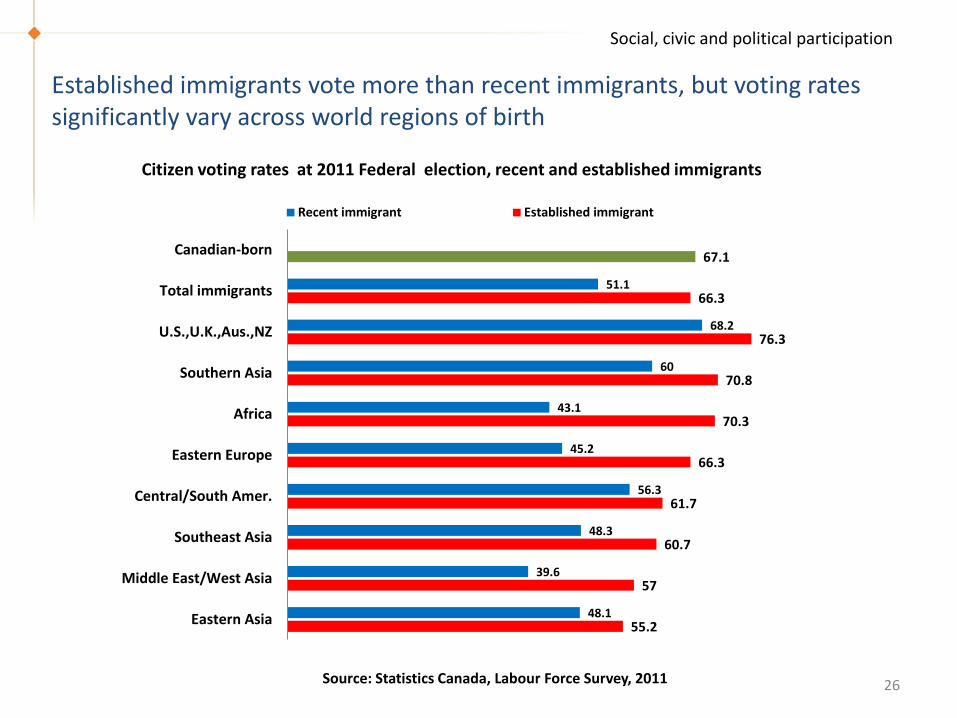
• Established immigrants vote more than recent immigrants, but voting rates significantly vary across world regions of birth;
• Citizenship take up rates are high and increasing (85.8% in 2016 Census);
8
Highlights: social and health outcomes of immigrants and refugees in Canada
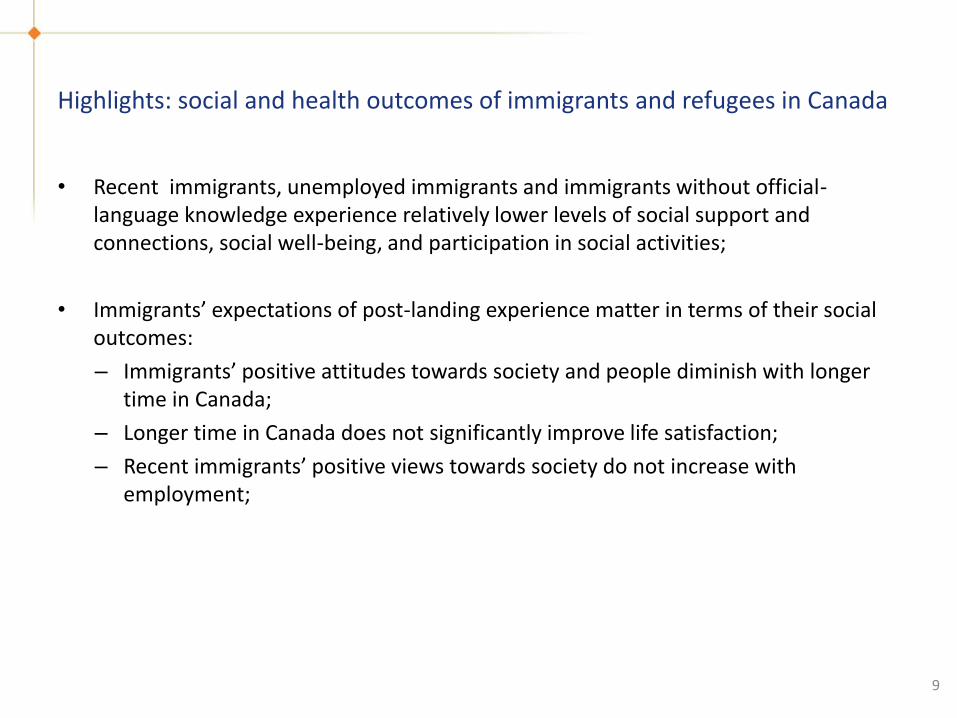
• Recent immigrants, unemployed immigrants and immigrants without official-language knowledge experience relatively lower levels of social support and connections, social well-being, and participation in social activities;
• Immigrants’ expectations of post-landing experience matter in terms of their social outcomes:
– Immigrants’ positive attitudes towards society and people diminish with longer time in Canada;
– Longer time in Canada does not significantly improve life satisfaction;
– Recent immigrants’ positive views towards society do not increase with employment;
9
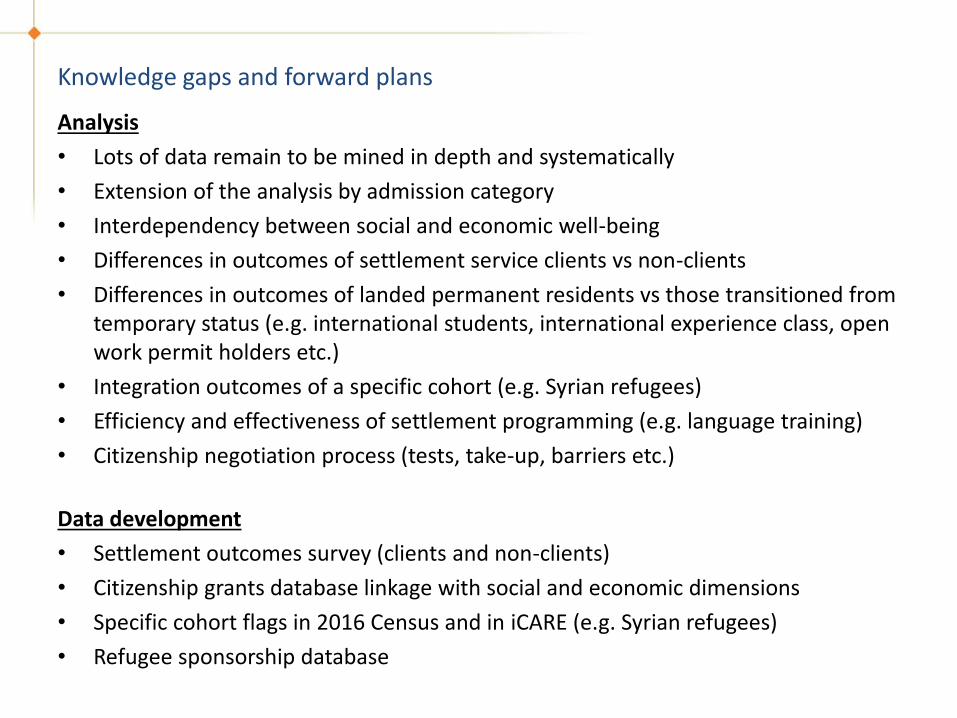
Knowledge gaps and forward plans
Analysis
• Lots of data remain to be mined in depth and systematically
• Extension of the analysis by admission category
• Interdependency between social and economic well-being
• Differences in outcomes of settlement service clients vs non-clients
• Differences in outcomes of landed permanent residents vs those transitioned from temporary status (e.g. international students, international experience class, open work permit holders etc.)
• Integration outcomes of a specific cohort (e.g. Syrian refugees)
• Efficiency and effectiveness of settlement programming (e.g. language training)
• Citizenship negotiation process (tests, take-up, barriers etc.)
Data development
• Settlement outcomes survey (clients and non-clients)
• Citizenship grants database linkage with social and economic dimensions
• Specific cohort flags in 2016 Census and in iCARE (e.g. Syrian refugees)
• Refugee sponsorship database

Tax Data Based on T1FF, converted to LAD structure (not held in GCMS)
Application for permanent residency
(e.g. language, age, education …)
Sponsorship Agreements
Pre-landing Canadian Experience
(study experience, refugee claim)
Citizenship Grants
IRCC
General Social Survey (GSS)
2011 National Household Survey
(NHS)/2016 Census
11
Confirmation of Permanent Residency
Landing years 1980 to 2010
Canadian Employer Employee Dynamic Database (CEEDD)
PR & TR
PT Health Data Linkages
Landing – Health Linkage (ICES ON)
Landing – Health Linkage (PopData BC)
STC (Statistics Canada )
IRCC’s Data Roadmap
Health Related Datasets
STC surveys linked to ILF/IMDB
IRCC administrative data at STCIRCC data linked to
provincial/territorial health data
Maintained at IRCC
Settlement services iCARE
Settlement Outcome Survey
Longitudinal Immigration Landing File
(IMDB)
Temporary Resident Database
Immigration Landing File (ILF)
Canadian Community Health
Survey (CCHS)
Landing – Health Linkage MB

APPENDIX 1
13
14
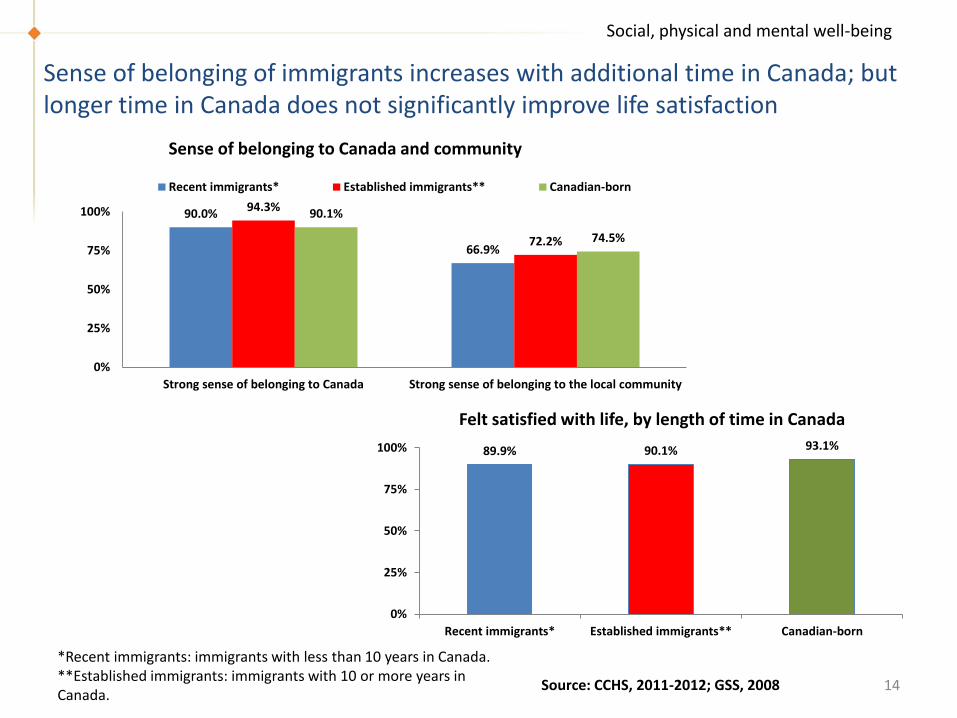
Sense of belonging of immigrants increases with additional time in Canada; but longer time in Canada does not significantly improve life satisfaction
Social, physical and mental well-being
89.9% 90.1% 93.1%
0%
25%
50%
75%
100%
Recent immigrants* Established immigrants** Canadian-born
Felt satisfied with life, by length of time in Canada
Source: CCHS, 2011-2012; GSS, 2008
90.0%
66.9%
94.3%
72.2%
90.1%
74.5%
0%
25%
50%
75%
100%
Strong sense of belonging to Canada Strong sense of belonging to the local community
Sense of belonging to Canada and community
Recent immigrants* Established immigrants** Canadian-born
*Recent immigrants: immigrants with less than 10 years in Canada. **Established immigrants: immigrants with 10 or more years in Canada.
15
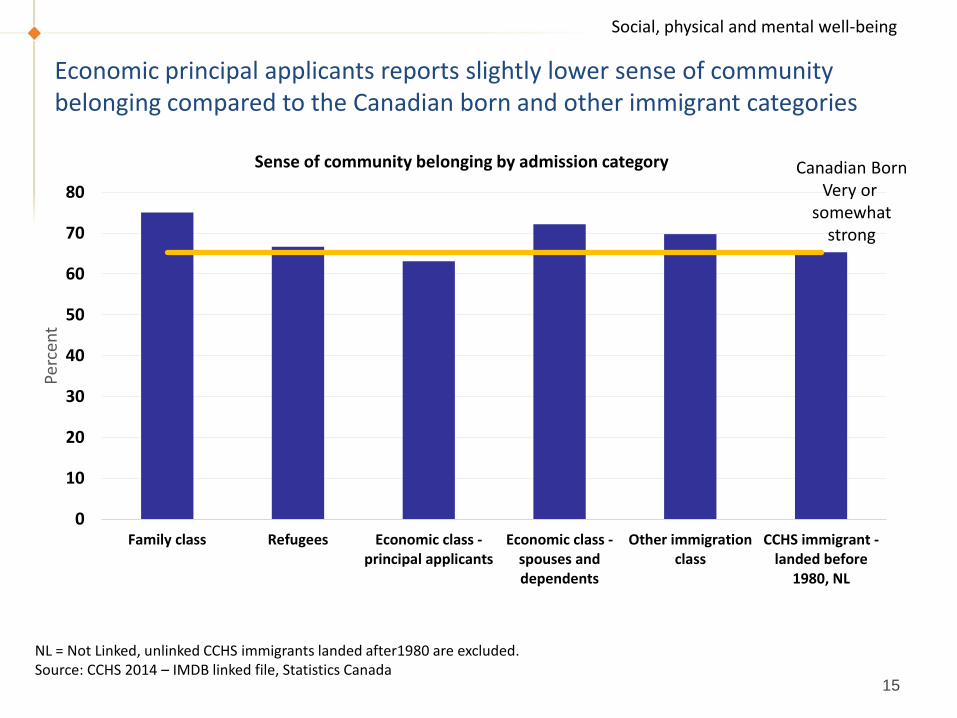
Economic principal applicants reports slightly lower sense of community belonging compared to the Canadian born and other immigrant categories
0
10
20
30
40
50
60
70
80
Family class Refugees Economic class -principal applicants
Economic class -spouses anddependents
Other immigrationclass
CCHS immigrant -landed before
1980, NL
Perc
ent
Sense of community belonging by admission category
NL = Not Linked, unlinked CCHS immigrants landed after1980 are excluded. Source: CCHS 2014 – IMDB linked file, Statistics Canada
Canadian BornVery or
somewhatstrong
Social, physical and mental well-being
16
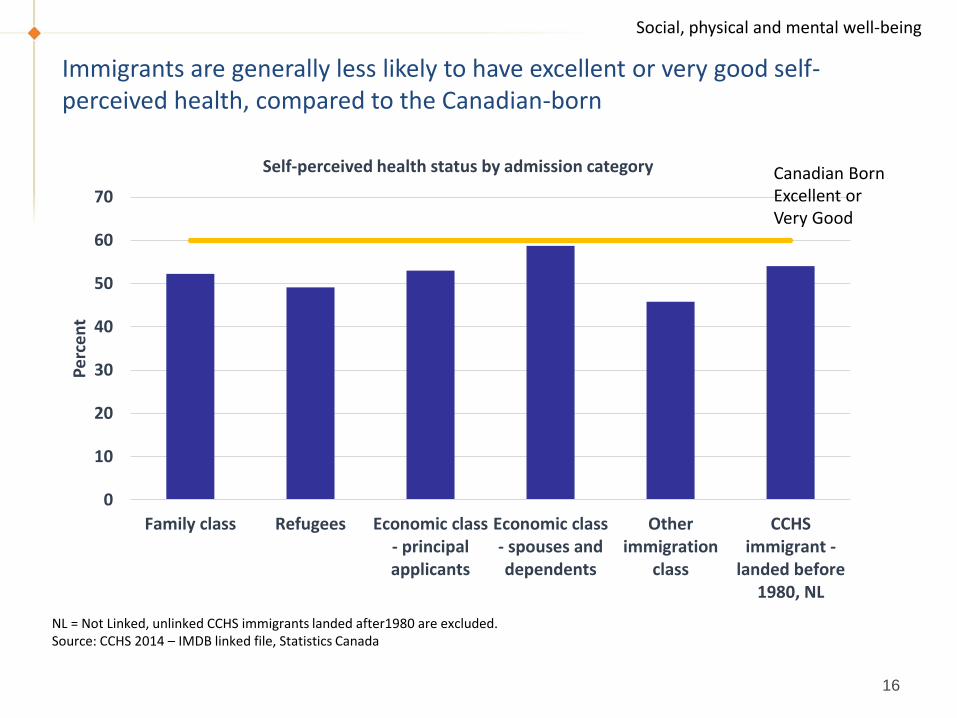
Immigrants are generally less likely to have excellent or very good self-perceived health, compared to the Canadian-born
NL = Not Linked, unlinked CCHS immigrants landed after1980 are excluded. Source: CCHS 2014 – IMDB linked file, Statistics Canada
0
10
20
30
40
50
60
70
Family class Refugees Economic class- principalapplicants
Economic class- spouses anddependents
Otherimmigration
class
CCHSimmigrant -
landed before1980, NL
Pe
rce
nt
Self-perceived health status by admission category Canadian BornExcellent or Very Good
Social, physical and mental well-being
17
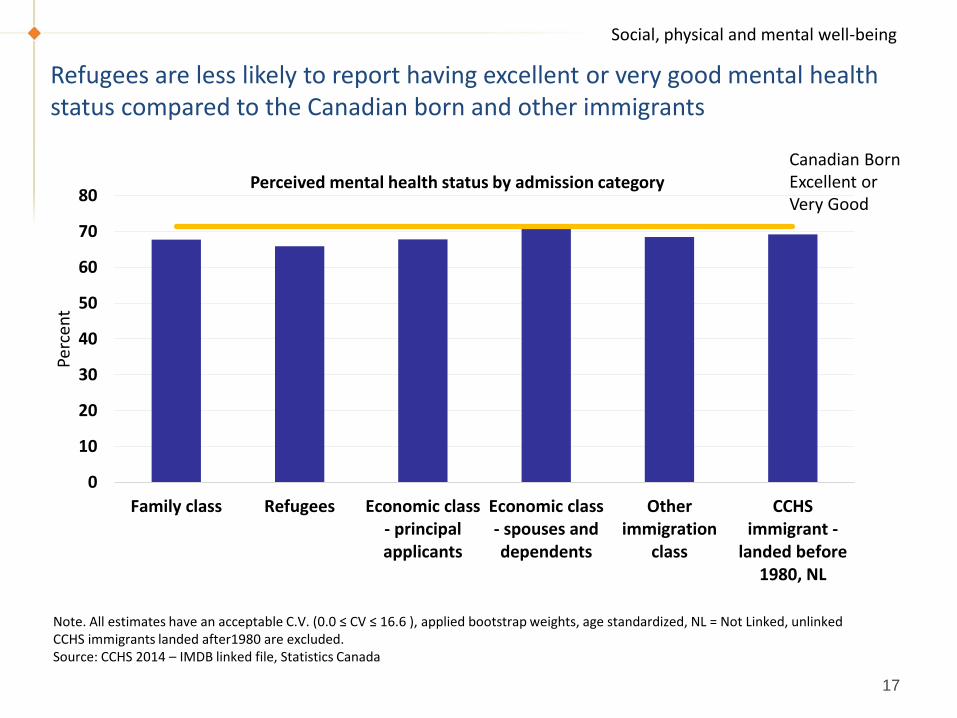
Refugees are less likely to report having excellent or very good mental health status compared to the Canadian born and other immigrants
0
10
20
30
40
50
60
70
80
Family class Refugees Economic class- principalapplicants
Economic class- spouses anddependents
Otherimmigration
class
CCHSimmigrant -
landed before1980, NL
Perc
ent
Perceived mental health status by admission categoryCanadian BornExcellent or Very Good
Note. All estimates have an acceptable C.V. (0.0 ≤ CV ≤ 16.6 ), applied bootstrap weights, age standardized, NL = Not Linked, unlinkedCCHS immigrants landed after1980 are excluded. Source: CCHS 2014 – IMDB linked file, Statistics Canada
Social, physical and mental well-being
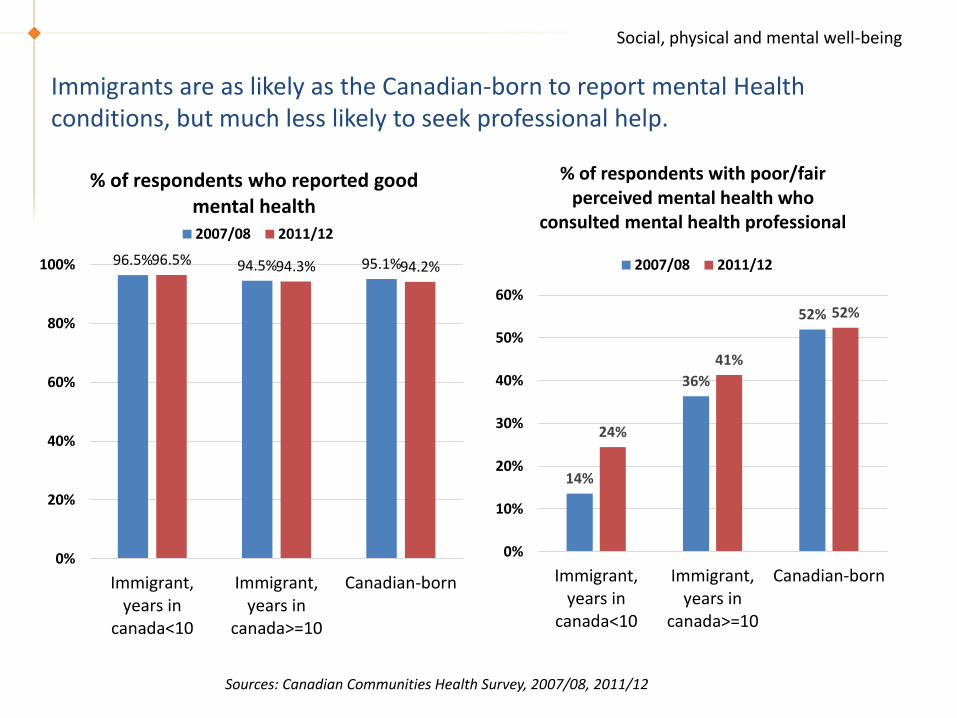
Immigrants are as likely as the Canadian-born to report mental Health conditions, but much less likely to seek professional help.
96.5% 94.5% 95.1%96.5% 94.3% 94.2%
0%
20%
40%
60%
80%
100%
Immigrant,years in
canada<10
Immigrant,years in
canada>=10
Canadian-born
% of respondents who reported good mental health2007/08 2011/12
14%
36%
52%
24%
41%
52%
0%
10%
20%
30%
40%
50%
60%
Immigrant,years in
canada<10
Immigrant,years in
canada>=10
Canadian-born
% of respondents with poor/fair perceived mental health who
consulted mental health professional
2007/08 2011/12
Sources: Canadian Communities Health Survey, 2007/08, 2011/12
Social, physical and mental well-being
0.00
0.10
0.20
0.30
0.40
0.50
Adult immigrant 1.5 generation 2nd generation 3rd+ generations
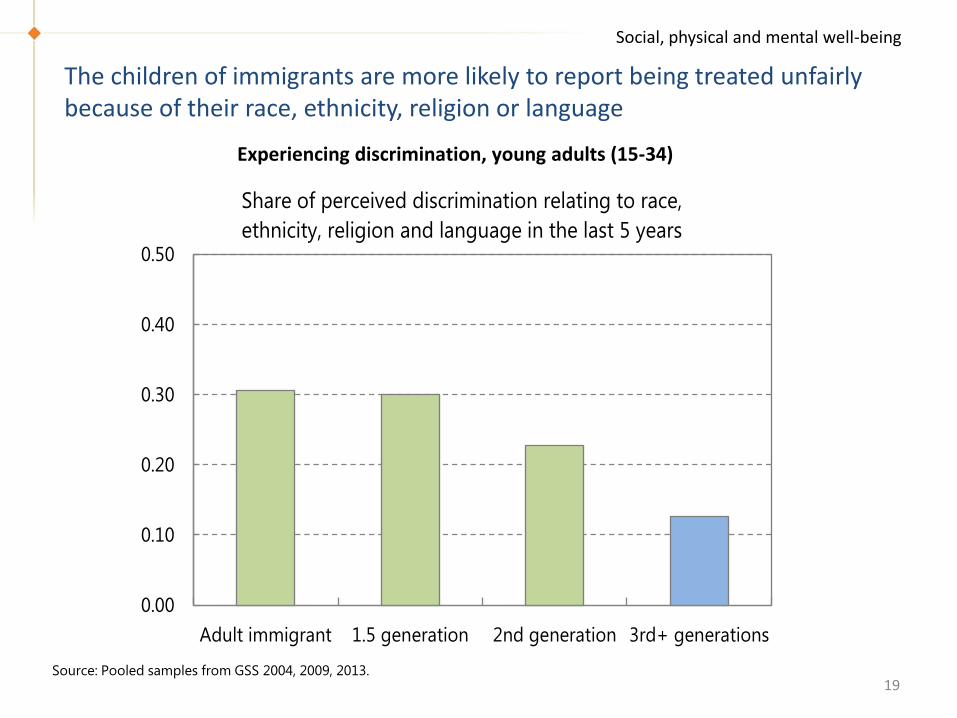
Share of perceived discrimination relating to race,
ethnicity, religion and language in the last 5 years
19Source: Pooled samples from GSS 2004, 2009, 2013.
Experiencing discrimination, young adults (15-34)
The children of immigrants are more likely to report being treated unfairly because of their race, ethnicity, religion or language
Social, physical and mental well-being
20
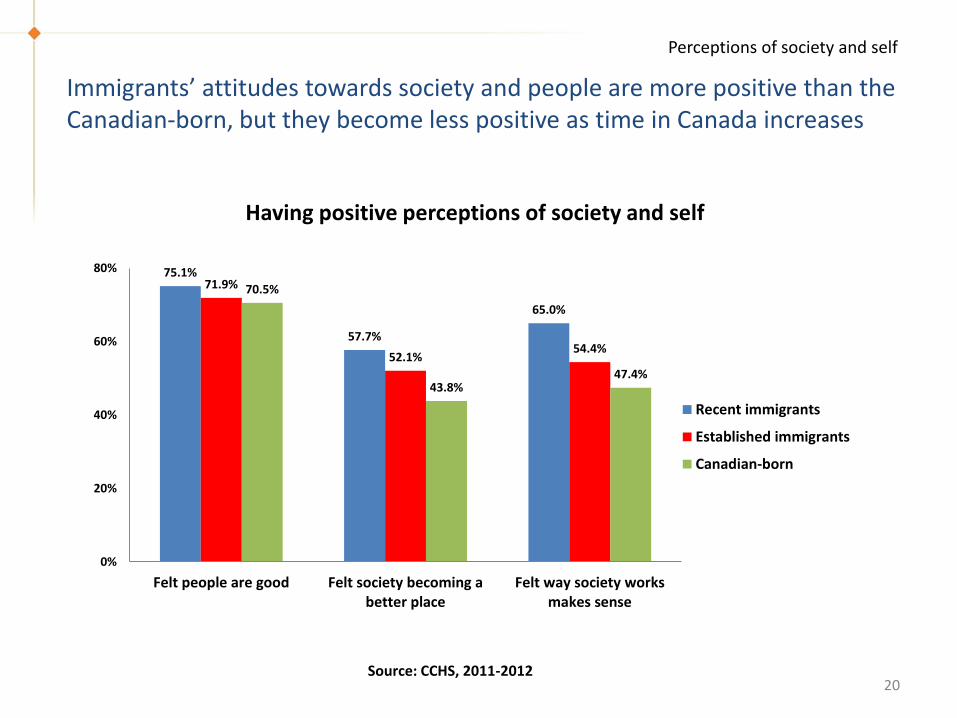
Immigrants’ attitudes towards society and people are more positive than the Canadian-born, but they become less positive as time in Canada increases
Perceptions of society and self
Source: CCHS, 2011-2012
75.1%
57.7%
65.0%
71.9%
52.1%54.4%
70.5%
43.8%47.4%
0%
20%
40%
60%
80%
Felt people are good Felt society becoming abetter place
Felt way society worksmakes sense
Having positive perceptions of society and self
Recent immigrants
Established immigrants
Canadian-born
21
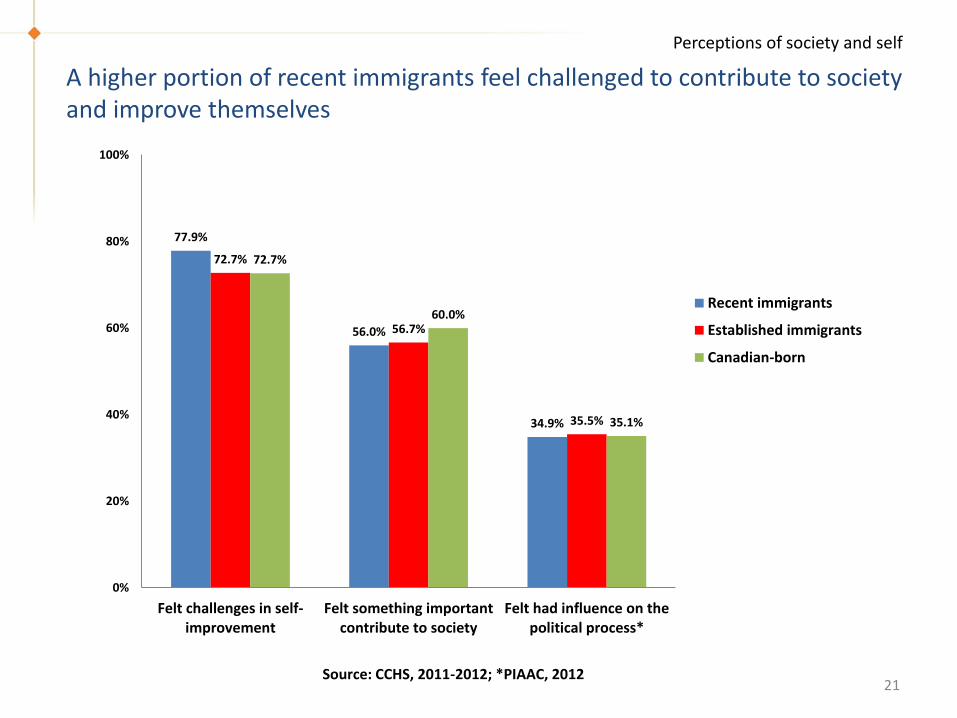
A higher portion of recent immigrants feel challenged to contribute to society and improve themselves
Source: CCHS, 2011-2012; *PIAAC, 2012
77.9%
56.0%
34.9%
72.7%
56.7%
35.5%
72.7%
60.0%
35.1%
0%
20%
40%
60%
80%
100%
Felt challenges in self-improvement
Felt something importantcontribute to society
Felt had influence on thepolitical process*
Recent immigrants
Established immigrants
Canadian-born
Perceptions of society and self
22
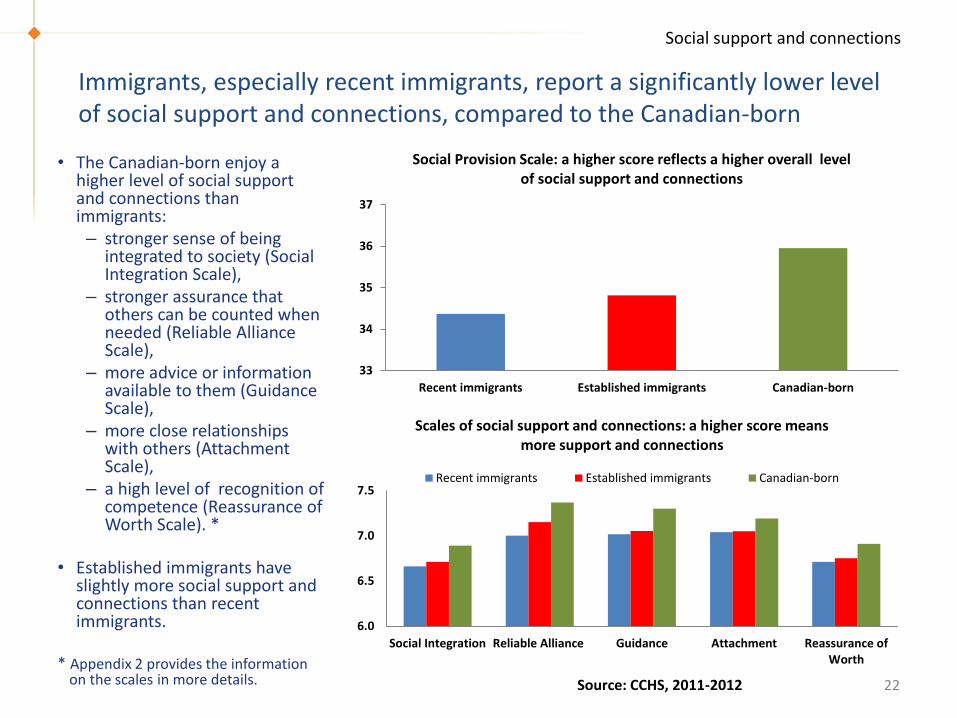
Immigrants, especially recent immigrants, report a significantly lower level of social support and connections, compared to the Canadian-born
Social support and connections
Source: CCHS, 2011-2012
• The Canadian-born enjoy a higher level of social support and connections than immigrants:– stronger sense of being
integrated to society (Social Integration Scale),
– stronger assurance that others can be counted when needed (Reliable Alliance Scale),
– more advice or information available to them (Guidance Scale),
– more close relationships with others (Attachment Scale),
– a high level of recognition of competence (Reassurance of Worth Scale). *
• Established immigrants have slightly more social support and connections than recent immigrants.
* Appendix 2 provides the information on the scales in more details.
6.0
6.5
7.0
7.5
Social Integration Reliable Alliance Guidance Attachment Reassurance ofWorth
Scales of social support and connections: a higher score means more support and connections
Recent immigrants Established immigrants Canadian-born
33
34
35
36
37
Recent immigrants Established immigrants Canadian-born
Social Provision Scale: a higher score reflects a higher overall level of social support and connections
23
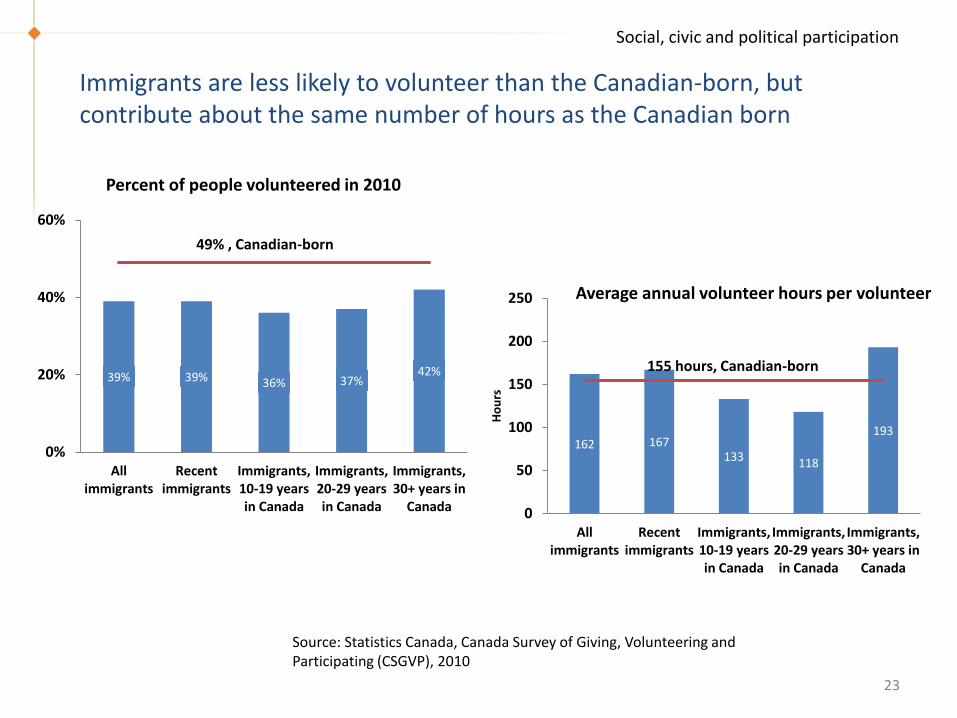
Immigrants are less likely to volunteer than the Canadian-born, but contribute about the same number of hours as the Canadian born
Source: Statistics Canada, Canada Survey of Giving, Volunteering and Participating (CSGVP), 2010
39% 39% 36% 37%42%
0%
20%
40%
60%
Allimmigrants
Recentimmigrants
Immigrants,10-19 yearsin Canada
Immigrants,20-29 yearsin Canada
Immigrants,30+ years in
Canada
49% , Canadian-born
Percent of people volunteered in 2010
162 167133 118
193
0
50
100
150
200
250
Allimmigrants
Recentimmigrants
Immigrants,10-19 yearsin Canada
Immigrants,20-29 yearsin Canada
Immigrants,30+ years in
Canada
Ho
urs
155 hours, Canadian-born
Average annual volunteer hours per volunteer
Social, civic and political participation
24
Spouses and dependents of economic class immigrants have rates of volunteering and organization membership comparable to the Canadian born
Source: 2013 GSS on Social Identity linked to IMDB
26%
33%
36%
30%
Refugees
Family
Economic SD
Economic PA
32%
37%
Immigrants
Canadian born
Volunteering - 95% ci’s
Immigration Programs – Landed 1980 to 2011
55%
56%
66%
60%
Refugees
Family
Economic SD
Economic PA
61%
67%
Immigrants
Canadian born
Membership social organization(s) (excluding volunteering) - 95% ci’s
Immigration Programs – Landed 1980 to 2011
Social, civic and political participation
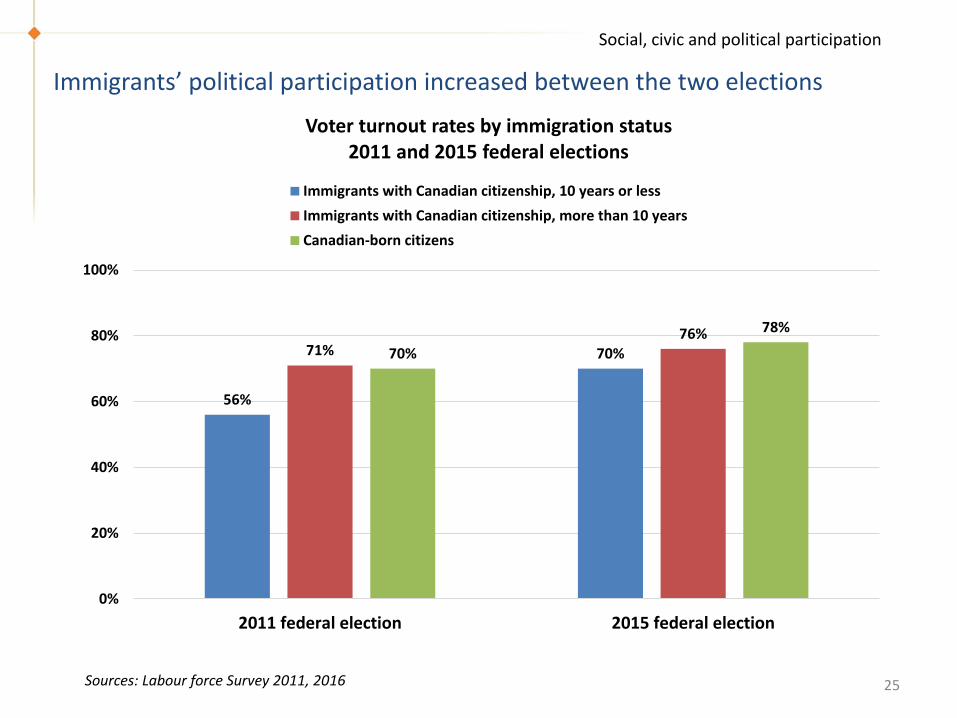
Immigrants’ political participation increased between the two elections
25
56%
70%71%76%
70%
78%
0%
20%
40%
60%
80%
100%
2011 federal election 2015 federal election
Voter turnout rates by immigration status2011 and 2015 federal elections
Immigrants with Canadian citizenship, 10 years or less
Immigrants with Canadian citizenship, more than 10 years
Canadian-born citizens
Sources: Labour force Survey 2011, 2016
Social, civic and political participation
26
Established immigrants vote more than recent immigrants, but voting rates significantly vary across world regions of birth
55.2
57
60.7
61.7
66.3
70.3
70.8
76.3
66.3
67.1
48.1
39.6
48.3
56.3
45.2
43.1
60
68.2
51.1
Eastern Asia
Middle East/West Asia
Southeast Asia
Central/South Amer.
Eastern Europe
Africa
Southern Asia
U.S.,U.K.,Aus.,NZ
Total immigrants
Canadian-born
Citizen voting rates at 2011 Federal election, recent and established immigrants
Recent immigrant Established immigrant
Source: Statistics Canada, Labour Force Survey, 2011
Social, civic and political participation
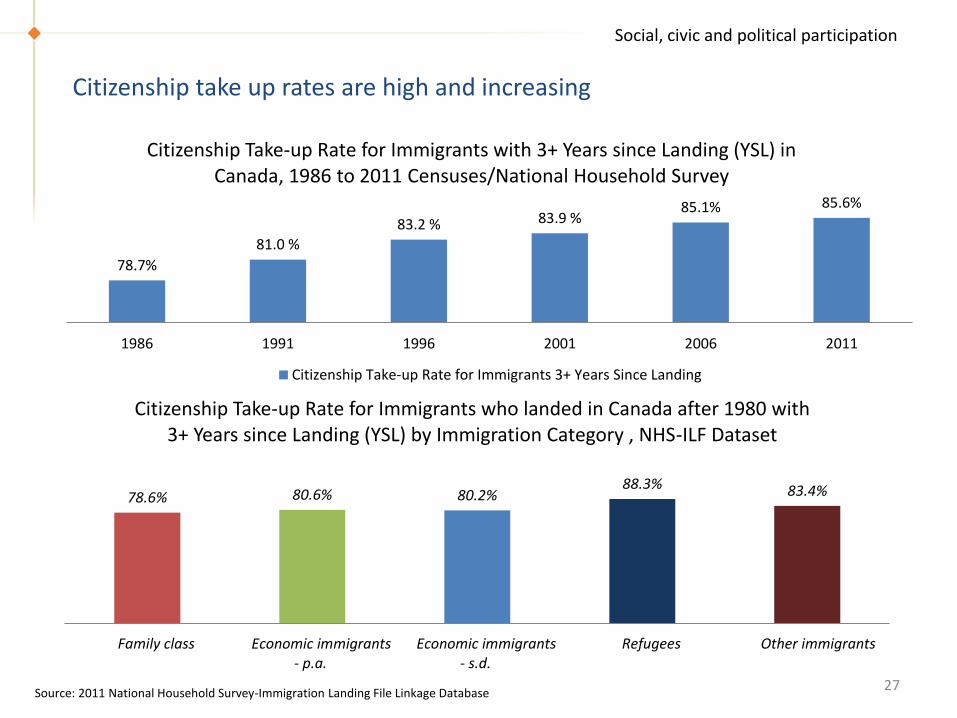
Citizenship take up rates are high and increasing
27
78.7%
81.0 % 83.2 % 83.9 %
85.1% 85.6%
1986 1991 1996 2001 2006 2011
Citizenship Take-up Rate for Immigrants with 3+ Years since Landing (YSL) in Canada, 1986 to 2011 Censuses/National Household Survey
Citizenship Take-up Rate for Immigrants 3+ Years Since Landing
78.6% 80.6% 80.2%88.3% 83.4%
Family class Economic immigrants- p.a.
Economic immigrants- s.d.
Refugees Other immigrants
Citizenship Take-up Rate for Immigrants who landed in Canada after 1980 with 3+ Years since Landing (YSL) by Immigration Category , NHS-ILF Dataset
Source: 2011 National Household Survey-Immigration Landing File Linkage Database
Social, civic and political participation
28
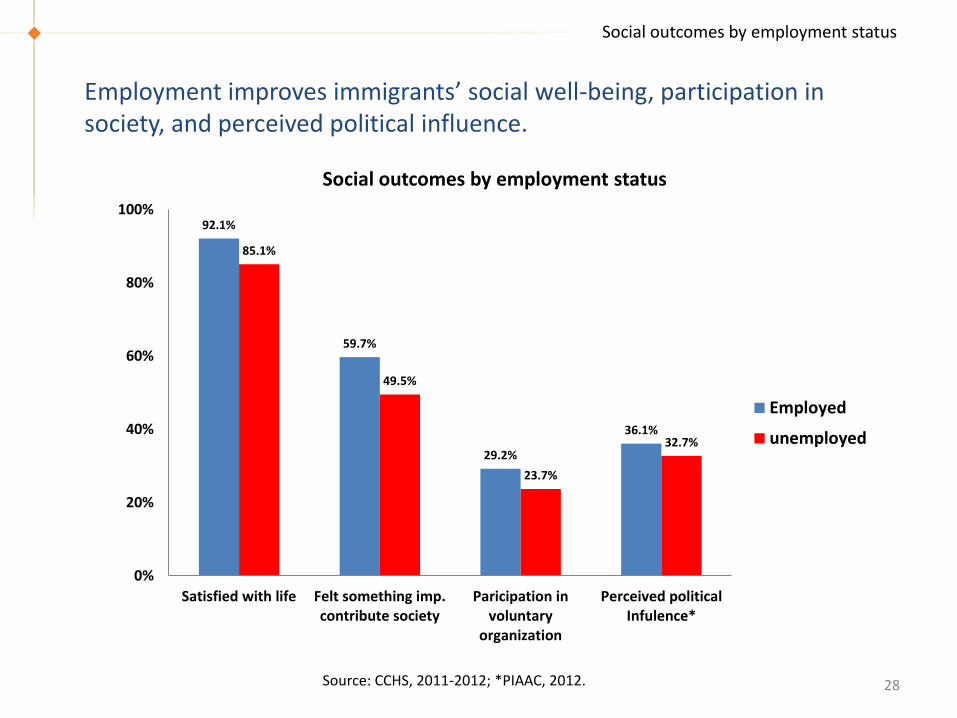
Employment improves immigrants’ social well-being, participation in society, and perceived political influence.
Social outcomes by employment status
Source: CCHS, 2011-2012; *PIAAC, 2012.
92.1%
59.7%
29.2%
36.1%
85.1%
49.5%
23.7%
32.7%
0%
20%
40%
60%
80%
100%
Satisfied with life Felt something imp.contribute society
Paricipation involuntary
organization
Perceived politicalInfulence*
Social outcomes by employment status
Employed
unemployed
29
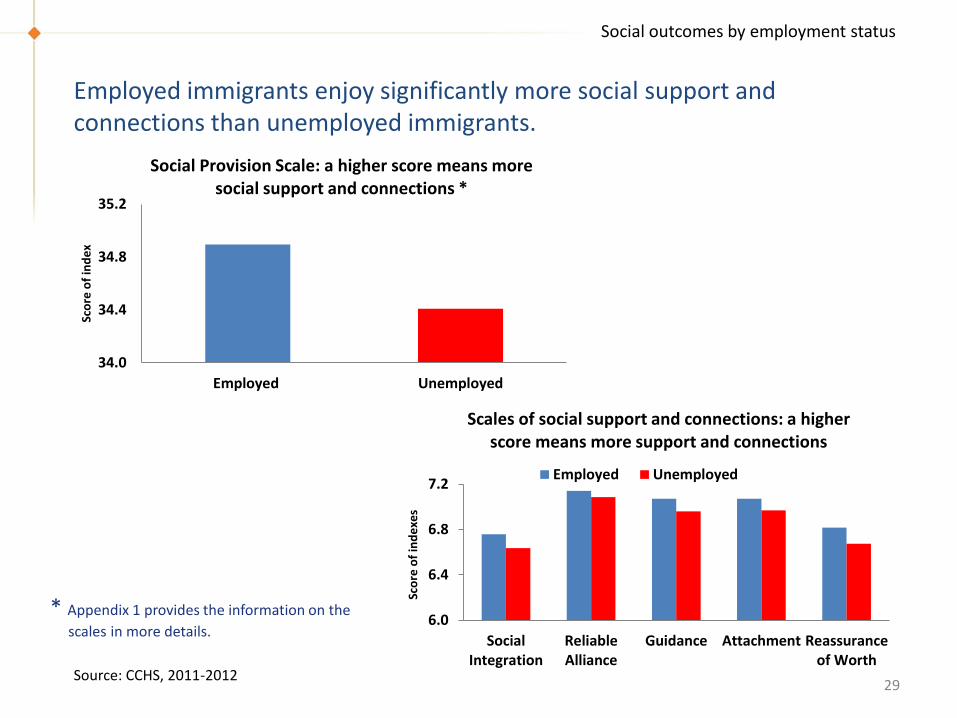
Employed immigrants enjoy significantly more social support and connections than unemployed immigrants.
Source: CCHS, 2011-2012
34.0
34.4
34.8
35.2
Employed Unemployed
Sco
re o
f in
de
x
Social Provision Scale: a higher score means more social support and connections *
6.0
6.4
6.8
7.2
SocialIntegration
ReliableAlliance
Guidance Attachment Reassuranceof Worth
Sco
re o
f in
de
xes
Scales of social support and connections: a higher score means more support and connections
Employed Unemployed
Social outcomes by employment status
* Appendix 1 provides the information on the
scales in more details.
30
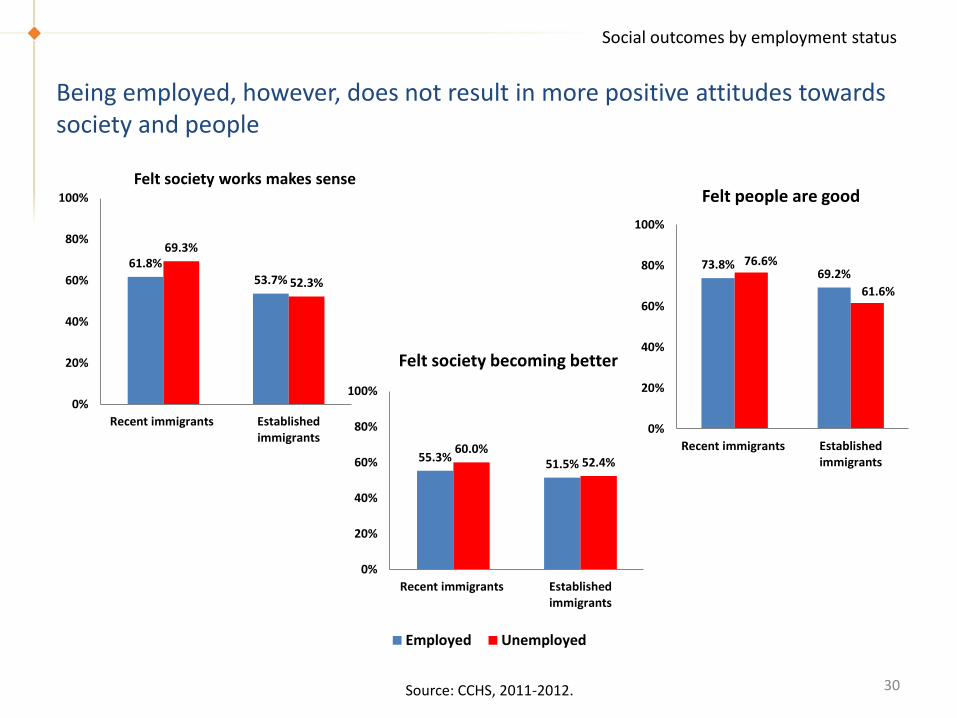
Being employed, however, does not result in more positive attitudes towards society and people
61.8%
53.7%
69.3%
52.3%
0%
20%
40%
60%
80%
100%
Recent immigrants Establishedimmigrants
Felt society works makes sense
55.3%51.5%
60.0%52.4%
0%
20%
40%
60%
80%
100%
Recent immigrants Establishedimmigrants
Felt society becoming better
Employed Unemployed
73.8%69.2%
76.6%
61.6%
0%
20%
40%
60%
80%
100%
Recent immigrants Establishedimmigrants
Felt people are good
Source: CCHS, 2011-2012.
Social outcomes by employment status
31
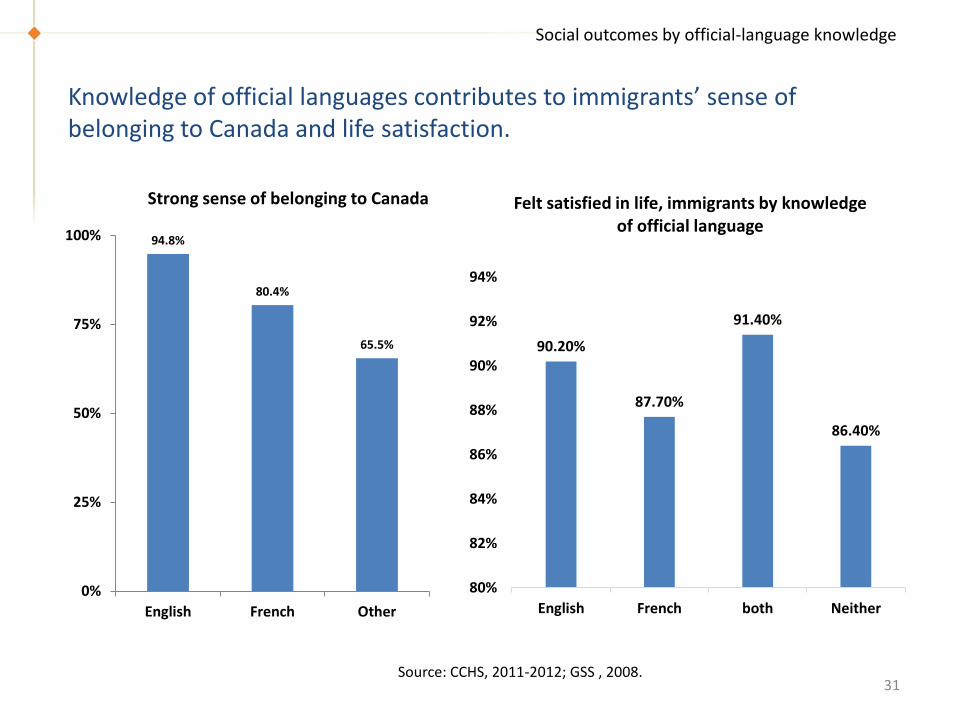
Knowledge of official languages contributes to immigrants’ sense of belonging to Canada and life satisfaction.
Social outcomes by official-language knowledge
Source: CCHS, 2011-2012; GSS , 2008.
94.8%
80.4%
65.5%
0%
25%
50%
75%
100%
English French Other
Strong sense of belonging to Canada
90.20%
87.70%
91.40%
86.40%
80%
82%
84%
86%
88%
90%
92%
94%
English French both Neither
Felt satisfied in life, immigrants by knowledge of official language
32
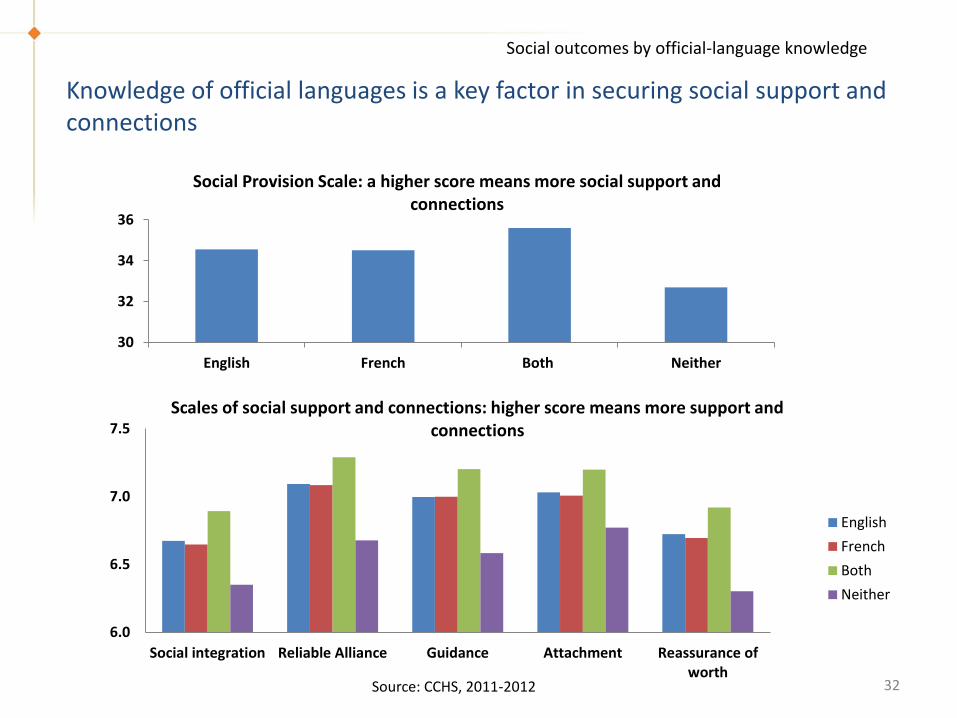
Knowledge of official languages is a key factor in securing social support and connections
Source: CCHS, 2011-2012
30
32
34
36
English French Both Neither
Social Provision Scale: a higher score means more social support and connections
6.0
6.5
7.0
7.5
Social integration Reliable Alliance Guidance Attachment Reassurance ofworth
Scales of social support and connections: higher score means more support and connections
English
French
Both
Neither
Social outcomes by official-language knowledge
APPENDIX 2
Classification (le cas échéant)
The CCHS is a cross-sectional survey that annually collects information related to health status, health care utilization, social capital (e.g. social activity, social support, etc.), other health determinants, and social-demographic characteristics for immigrants and the Canada-born. The CCHS relies upon a large sample of respondents and is designed to provide reliable estimates at the health region level. It produced an annual microdata file with about 1000 variables for a sample of around 65,000 respondents each year starting from 2007.
– Our analysis uses the Public Use Microdata File (PUMF) combining two years of data in 2011 and 2012. In total, there are 17,574 immigrants in this combined sample of 124,929 respondents.
The Social Provision Scale measures the level of social connections and support from others, groups as well as the community. The data is only available for Quebec, British Columbia, Yukon, Northwest Territories, and Nunavut.
– The CCHS also developed 5 sub-scales for five main social functions including Attachment, Guidance, Social Integration, Reliable Alliance, and Reassurance of Worth.
• Reliable Alliance Scale: assurance that others can be counted on when needed.
• Guidance Scale: advice or information available.
• Social Integration Scale: a sense of being integrated into a group that shares similar interests, concerns or recreational activities.
• Attachment Scale: a measure for emotional closeness to family, friends, and others
• Reassurance of Worth Scale: a measure for recognition of one’s competence.
– The rating system is based on the methodology developed by Cutrona and Russell (1987), and Caron (1996).
– The scales are based on the a list of 10 survey questions in the CCHS 2011-2012.
34
About Canadian Community Health Survey (CCHS)