Social Media Report - Top Fast Food Brands July 1st - Aug 31st
90
Top Fast Food Brands on Social Media Jul 1 st – Aug 31 st , 2016
-
Upload
unmetric -
Category
Social Media
-
view
331 -
download
0
Transcript of Social Media Report - Top Fast Food Brands July 1st - Aug 31st

Top Fast Food Brandson Social MediaJul 1st – Aug 31st, 2016

Fast Food Brands: Social Media Report
This Report looks at how
Fast Food Brands (US)performed on Social Media between
Jul 1st – Aug 31st, 2016

Comparison of
“Fast Food Brands (US)"Facebook Pages
Jul 01, 2016 - Aug 31, 2016

McDonald’s Corporation had the largest fan base of 66,836,522 while Domino's Pizza showed the highest fan growth of 29.44%.
-5.0%
0.0%
5.0%
10.0%
15.0%
20.0%
25.0%
30.0%
35.0%
0K 10,000K 20,000K 30,000K 40,000K 50,000K 60,000K 70,000K 80,000K
Gro
wth
%
Number of Fans
Taco Bell KFC Panera Bread Subway McDonald’s Corporation
Starbucks Coffee Domino's Pizza Arby's Wendy's Pizza Hut
Dunkin' Donuts Burger King Jack in the Box Chick-fil-A Sonic Drive-In
Fans

0%
10%
20%
30%
40%
50%
60%
70%
80%
90%
100%
Egypt United States Philippines Countries < 2% Pakistan Mexico Canada Malaysia Other Countries India
Fans - Geography

Arby's had the highest PTAT of 4.39% as a percentage of its average number of Fans during this time period.
0.0%
0.5%
1.0%
1.5%
2.0%
2.5%
3.0%
3.5%
4.0%
4.5%
5.0%
0K 10,000K 20,000K 30,000K 40,000K 50,000K 60,000K 70,000K
Pe
op
le t
alk
ing a
bo
ut
(as %
of
Fa
ns)
Average Number of Fans
Taco Bell KFC Panera Bread Subway McDonald’s Corporation
Starbucks Coffee Domino's Pizza Wendy's Arby's Pizza Hut
Dunkin' Donuts Burger King Jack in the Box Chick-fil-A Sonic Drive-In
Conversations

McDonald’s Corporation published the greatest number of posts (70). Arby's had the highest average engagement with a
score of 1,000.
0 10 20 30 40 50 60 70 80
0 200 400 600 800 1000 1200
Taco Bell
KFC
Panera Bread
Subway
McDonald’s …
Starbucks…
Domino's Pizza
Arby's
Wendy's
Dunkin' Donuts
Burger King
Jack in the Box
Chick-fil-A
Sonic Drive-In
Number of Posts
Engagement Score
Engagement Score Number of Posts
Engagement - Posts

Starbucks Coffee received the most number of Likes (3,070,463), Comments (184,180) and Shares (203,406).
0K 500K 1,000K 1,500K 2,000K 2,500K 3,000K 3,500K
Taco Bell
KFC
Panera Bread
Subway
McDonald’s Corporation
Starbucks Coffee
Domino's Pizza
Arby's
Wendy's
Pizza Hut
Dunkin' Donuts
Burger King
Jack in the Box
Chick-fil-A
Sonic Drive-InLikes Comments Shares
Engagement Breakdown

Most Engaging Brand PostsArby's
30-AUG-16, TUE 11:00AM
Just picking up the essentials for tonight
ENGMT LIKES COMMENTS SHARES
1,000 86,085 8,550 20,840
Arby's
29-AUG-16, MON 11:00AM
Our favorite neighbor
Arby's
26-AUG-16, FRI 11:00AM
It’s been confirmed?
ENGMT. LIKES COMMENTS SHARES
1,000 50,882 4,983 14,525
ENGMT. LIKES COMMENTS SHARES
1,000 33,016 5,787 12,322

Most Engaging Brand PostsArby's
19-AUG-16, FRI 11:00AM
The last Metroid is in captivity. The Galaxy is
at peace…
ENGMT. LIKES COMMENTS SHARES SENTIMENT
1,000 47,611 4,187 10,139 Positive
Burger King
16-AUG-16, TUE 4:16PM
Where there’s sun, there’s OREO Shakes.
Arby's
15-AUG-16, MON 11:00AM
Do not summon at all costs
ENGM. LIKES COMMENTS SHARES SENTIMENT
1,000 40,835 20,788 14,849 Positive
ENGMT. LIKES COMMENTS SHARES SENTIMENT
1,000 34,706 4,385 10,588 Positive

Starbucks Coffee's Facebook Page saw the highest number of Fan posts (5,791).
0 1000 2000 3000 4000 5000 6000 7000
Taco Bell
KFC
Panera Bread
Subway
McDonald’s Corporation
Starbucks Coffee
Domino's Pizza
Arby's
Wendy's
Dunkin' Donuts
Burger King
Jack in the Box
Chick-fil-A
Sonic Drive-In
Number of Fan Posts
Fan Posts

Chick-fil-A received the highest percentage of Positive Sentiment (37.00%).
0% 10% 20% 30% 40% 50% 60% 70% 80% 90% 100%
Dunkin' Donuts
Taco Bell
Jack in the Box
Chick-fil-A
Panera Bread
Subway
Starbucks Coffee
Domino's Pizza
Sonic Drive-In
Wendy's
Arby's
Negative Neutral Positive
Sentiment Analysis

Arby's responded to the highest percentage of Fan posts (68.17%).
0.0%
10.0%
20.0%
30.0%
40.0%
50.0%
60.0%
70.0%
80.0%
0 500 1000 1500 2000 2500 3000
% o
f F
an
Po
sts
Bra
nd
Re
sp
on
de
d t
o
Average Response Time (minutes)
Dunkin' Donuts Taco Bell Jack in the Box Chick-fil-A Panera Bread Subway Starbucks Coffee Domino's Pizza Sonic Drive-In Wendy's Arby's
Brand Responses

McDonald’s Corporation published the most with 70 posts.
3%6%
12%
3%0%
6%
1%5%
10%
6%7%
8%
4%
19%
10%
Subway Arby's Wendy's Taco Bell Pizza Hut
Chick-fil-A Dunkin' Donuts Starbucks Coffee KFC Panera Bread
Burger King Sonic Drive-In Jack in the Box McDonald’s Corporation Domino's Pizza
Share Of Voice – Volume of Posts

Starbucks Coffee received the largest volume of Likes (3,070,463).
1%
15%
9%
1%
0%
2%
0%
54%
4%
10%
1%
1%0%
1% 1%
Subway Arby's Wendy's Taco Bell Pizza Hut
Chick-fil-A Dunkin' Donuts Starbucks Coffee KFC Panera Bread
Burger King Sonic Drive-In Jack in the Box McDonald’s Corporation Domino's Pizza
Share Of Voice – Likes
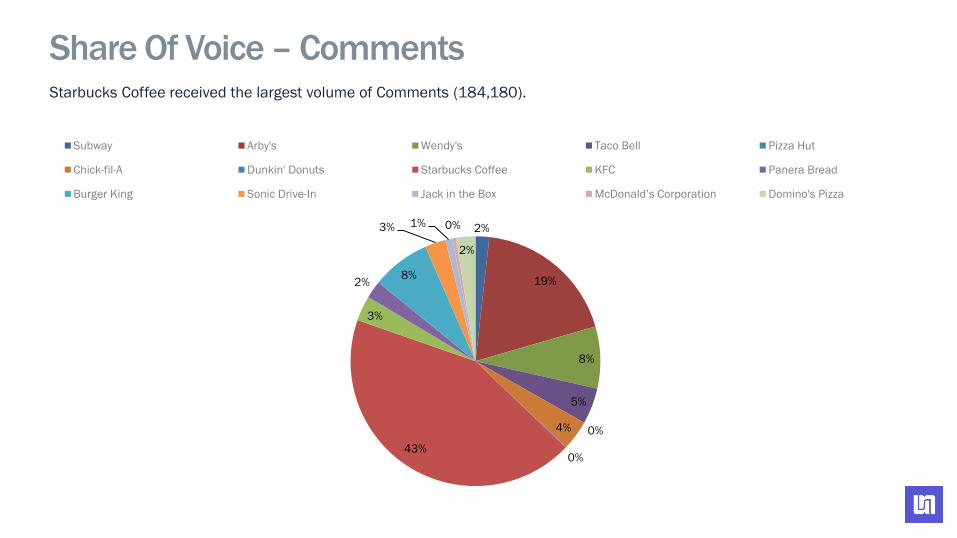
Starbucks Coffee received the largest volume of Comments (184,180).
2%
19%
8%
5%
0%4%
0%43%
3%
2%8%
3% 1% 0%
2%
Subway Arby's Wendy's Taco Bell Pizza Hut
Chick-fil-A Dunkin' Donuts Starbucks Coffee KFC Panera Bread
Burger King Sonic Drive-In Jack in the Box McDonald’s Corporation Domino's Pizza
Share Of Voice – Comments

Starbucks Coffee received the largest volume of Shares (203,406).
1%
33%
8%
2%0%
3%
0%
36%
3%
2%4%
5%
1%0%
2%
Subway Arby's Wendy's Taco Bell Pizza Hut
Chick-fil-A Dunkin' Donuts Starbucks Coffee KFC Panera Bread
Burger King Sonic Drive-In Jack in the Box McDonald’s Corporation Domino's Pizza
Share Of Voice – Shares

During this time period, TACO BELL® AND PLAYSTATION® GAME was the most engaging run by Taco Bell. Burger King
published the most (8) in its #McWhopperProposal campaign.
0 1 2 3 4 5 6 7 8 9
0 100 200 300 400 500 600 700 800 900 1000
TACO BELL® AND PLAYSTATION® GAME(Taco…
#Hanukkah(KFC)
#SoupReview(Panera Bread)
#SearchForBetter(Subway)
#StarbucksRewards(Starbucks Coffee)
#Pizzapayback(Domino's Pizza)
NEW LOADED CURLY FRIES(Arby's)
Chance to win Spotify Premium(Wendy's)
#McWhopperProposal(Burger King)
#NotThatCrazy(Chick-fil-A)
Number of Posts
Engagement Score
Engagement Score Number of Posts
Campaign Comparison

Generate Your Own Social Media Report
This report was generated entirely by the Unmetric
Reporting Engine.
It took minutes to create.
Create Your Free
Social Media Report Now

Analysis of
Chick-Fil-AFacebook Page
Jul 01, 2016 - Aug 31, 2016

Brand Overview
FANS NEW FANS FAN GROWTH COUNTRY
7,594,626 15,601 .21% United States
Chick-fil-A

Engagement Score Total Fan Posts
426 5,114
Total Posts Brand Response Rate
22 34.22%
Total Likes Avg. Reply Time
113,093 16 hrs, 8 mins
Total Comments General Sentiment
16,457 Neutral
Total Shares
19,420
Most Engaging Campaign
Chicken For Breakfast
Most Recent Campaign
Grand Opening
BRAND POSTS FAN POSTS
Brand Overview
CONTENT & CAMPAIGNS

7,570K
7,575K
7,580K
7,585K
7,590K
7,595K
7,600K
1-Jul 8-Jul 15-Jul 22-Jul 29-Jul 5-Aug 12-Aug 19-Aug 26-Aug
Fan Growth
Total Fans
7,594,626
New Fans
15,601

Engagement
0
250
500
750
1,000
1,250
1-Jul 5-Jul 9-Jul 13-Jul 17-Jul 21-Jul 25-Jul 29-Jul 2-Aug 6-Aug 10-Aug 14-Aug 18-Aug 22-Aug 26-Aug 30-Aug
Chick-fil-A had an average engagement score of 426 and a highest of 967.

Community AnalysisChick-fil-A fans are largely from United States followed by Mexico.
Distribution of Fans
0K 1,000K 2,000K 3,000K 4,000K 5,000K 6,000K 7,000K 8,000K
United States
Mexico
Canada
United Kingdom
Philippines
India
Germany
Pakistan
Puerto Rico

0
1
1
2
2
3
1-Jul 8-Jul 15-Jul 22-Jul 29-Jul 5-Aug 12-Aug 19-Aug 26-Aug
Brand Posts
Top keywords used Frequency
Chick-fil 5
CowAppreciationDay 5
breakfast 4
Chicken 3
Peach Milkshake season 2

41%
59%
Brand Participation Brand Non Participation
Brand Posts - Engagement
Chick-fil-A responded to 9 conversations generated by the 22 Posts they published.
Brand Responses

Most Engaging Brand Posts
01-AUG-16, MON 10:12AM
With 25g of protein, the new Egg White Grill
gives you another reason to start the day.
ENGMT. LIKES COMMENTS SHARES SENTIMENT
967 55,191 5,412 2,644 Positive
19-JUL-16, TUE 2:30PM
Turns out a straw isn’t the only way to enjoy
our seasonal Peach Milkshake. Turn it into a
summer ic ..
12-JUL-16, TUE 8:00AM
#CowAppreciationDay is finally here! Head
to your restaurant in any cow attire to get
your free Entr ..
ENGMT. LIKES COMMENTS SHARES SENTIMENT
881 8,456 1,142 5,365 Positive
ENGMT. LIKES COMMENTS SHARES SENTIMENT
791 6,441 2,233 3,237 Positive
NO IMAGE NO IMAGE NO IMAGE

Brand Posts - Analysis
Brand Post Types Days of the week
0 5 10 15 20
0 200 400 600 800 1,000
Links
Videos
Photos
Plain Text
Polls
Number of Posts
Engagement Score
Engagement Score Number of Posts
0 2 4 6 8 10
0 100 200 300 400 500 600
Monday
Tuesday
Wednesday
Thursday
Friday
Saturday
Sunday
Number of Posts
Engagement Score
Engagement Score Number of Posts

Top Keywords Used Frequency
Chick-fil 1812
BBQ sauce 1332
spicy chicken biscuit 593
one 557
good 433
User Posts
0
50
100
150
200
250
300
1-J
ul
3-J
ul
5-J
ul
7-J
ul
9-J
ul
11
-Ju
l
13
-Ju
l
15
-Ju
l
17
-Ju
l
19
-Ju
l
21
-Ju
l
23
-Ju
l
25
-Ju
l
27
-Ju
l
29
-Ju
l
31
-Ju
l
2-A
ug
4-A
ug
6-A
ug
8-A
ug
10
-Au
g
12
-Au
g
14
-Au
g
16
-Au
g
18
-Au
g
20
-Au
g
22
-Au
g
24
-Au
g
26
-Au
g
28
-Au
g
30
-Au
g
Positive Neutral Negative

Chick-fil-A responded to 1,750 conversations generated by
the 5,115 Posts fans published.
Chick-fil-A appears to participate more when Fan conversations
have greater positive vibes than negative.
User Posts - Engagement
Brand Responses Sentiment
34%
66%
Brand Participation Brand Non Participation
37%
15%
48%
Posititve Negative Neutral

Campaign Intel
Entire Campaign
0 1 2 3 4 5 6 7
0 50 100 150 200 250 300 350 400
#NotThatCrazy
#CowAppreciationDay 2016
#CFAOne
Number of Posts
Engagement Score
Engagement Score Number of Posts

Analysis of
Arby'sFacebook Page
Jul 01, 2016 - Aug 31, 2016

Brand Overview
FANS NEW FANS FAN GROWTH COUNTRY DEMOGRAPHICS
2,766,611 44,177 1.62% United States Mostly Older, Female and Attached.
Arby's

Engagement Score Total Fan Posts
1,000 999
Total Posts Brand Response Rate
21 68.17%
Total Likes Avg. Reply Time
858,699 1 day, 16 hrs
Total Comments General Sentiment
79,849 Neutral
Total Shares
186,274
Most Engaging Content Type
Question to fans
Least Engaging Content Type
Others
Most Prolific Content Type
Engagement Oriented Posts
Most Engaging Campaign
SAY #TRICKORMEAT ADD
FREEBACON
Most Recent Campaign
National Hat Day
BRAND POSTS FAN POSTS
Brand Overview
CONTENT & CAMPAIGNS

2,700K
2,710K
2,720K
2,730K
2,740K
2,750K
2,760K
2,770K
1-Jul 8-Jul 15-Jul 22-Jul 29-Jul 5-Aug 12-Aug 19-Aug 26-Aug
Fan Growth
Total Fans
2,766,611
New Fans
44,177

Engagement
0
250
500
750
1,000
1,250
1-Jul 5-Jul 9-Jul 13-Jul 17-Jul 21-Jul 25-Jul 29-Jul 2-Aug 6-Aug 10-Aug 14-Aug 18-Aug 22-Aug 26-Aug 30-Aug
Arby's had an average engagement score of 1000 and a highest of 1000.

Community Analysis
Arby's fans are mostly Older, Female and Attached. Arby's fans are largely from United States followed by Canada.
Fan Demographics Distribution of Fans
33%
67%
male female
0% 10% 20% 30% 40%
Below 21
21-30
31-40
41-50
51-60
Over 60
0% 10% 20% 30% 40%
Single
In a Relationship
Engaged
Married
UnKnown
0K 1,000K 2,000K 3,000K
United States
Canada
Mexico
Turkey
Puerto Rico
India
Pakistan
Philippines
United Kingdom
New Zealand

0
0
0
1
1
1
1
1-Jul 8-Jul 15-Jul 22-Jul 29-Jul 5-Aug 12-Aug 19-Aug 26-Aug
Brand Posts
Top keywords used Frequency
judgment 1
favorite neighbor 1
SKWAD 1
25 years 1
left side 1
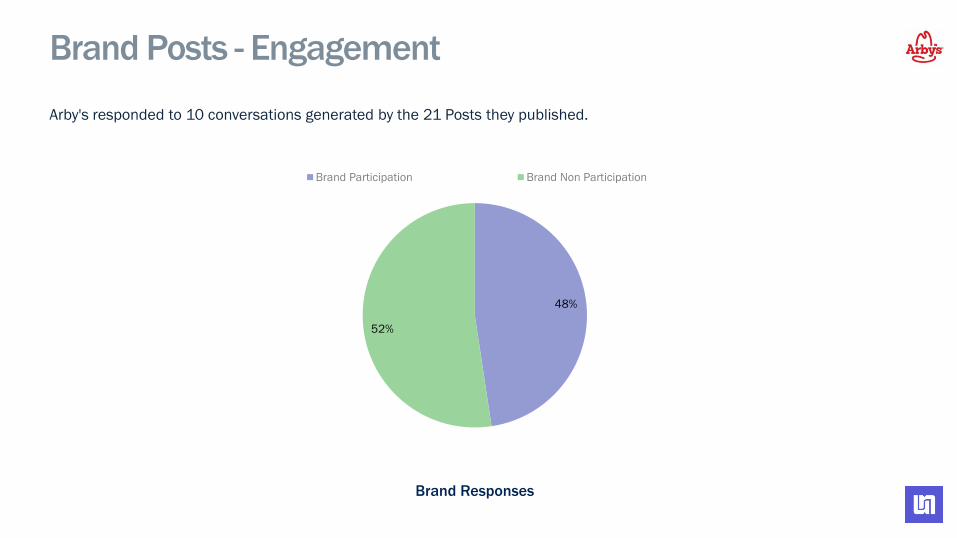
48%
52%
Brand Participation Brand Non Participation
Brand Posts - Engagement
Arby's responded to 10 conversations generated by the 21 Posts they published.
Brand Responses

Most Engaging Brand Posts
30-AUG-16, TUE 11:00AM
Just picking up the essentials for tonight
ENGMT. LIKES COMMENTS SHARES
1,000 86,085 8,550 20,840
29-AUG-16, MON 11:00AM
Our favorite neighbor
26-AUG-16, FRI 11:00AM
It’s been confirmed?
ENGMT. LIKES COMMENTS SHARES
1,000 50,882 4,983 14,525
ENGMT. LIKES COMMENTS SHARES
1,000 33,016 5,787 12,322
NO IMAGE NO IMAGE NO IMAGE

Brand Posts - Analysis
Brand Post Types Days of the week
0 5 10 15 20
0 200 400 600 800 1,000 1,200
Photos
Videos
Plain Text
Links
Polls
Number of Posts
Engagement Score
Engagement Score Number of Posts
0 2 4 6 8
0 200 400 600 800 1,000 1,200
Monday
Tuesday
Wednesday
Thursday
Friday
Saturday
Sunday
Number of Posts
Engagement Score
Engagement Score Number of Posts

Top Keywords Used Frequency
Arby 552
one 112
sandwich 112
food 100
time 84
User Posts
0
5
10
15
20
25
30
35
40
45
50
1-J
ul
3-J
ul
5-J
ul
7-J
ul
9-J
ul
11
-Ju
l
13
-Ju
l
15
-Ju
l
17
-Ju
l
19
-Ju
l
21
-Ju
l
23
-Ju
l
25
-Ju
l
27
-Ju
l
29
-Ju
l
31
-Ju
l
2-A
ug
4-A
ug
6-A
ug
8-A
ug
10
-Au
g
12
-Au
g
14
-Au
g
16
-Au
g
18
-Au
g
20
-Au
g
22
-Au
g
24
-Au
g
26
-Au
g
28
-Au
g
30
-Au
g
Positive Neutral Negative

Arby's responded to 681 conversations generated by the 999
Posts fans published.
Arby's appears to participate more when Fan conversations have
greater positive vibes than negative.
User Posts - Engagement
Brand Responses Sentiment
68%
32%
Brand Participation Brand Non Participation
33%
13%
54%
Posititve Negative Neutral
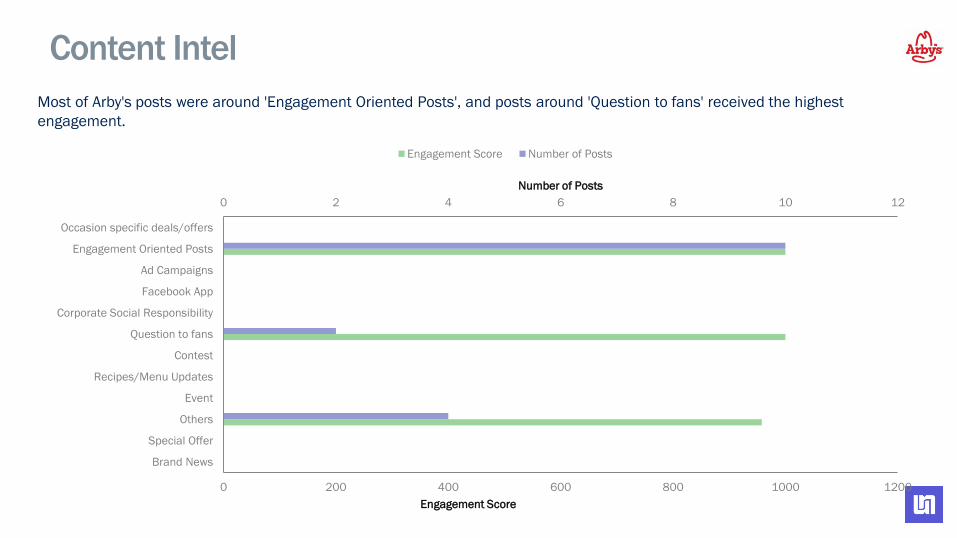
Most of Arby's posts were around 'Engagement Oriented Posts', and posts around 'Question to fans' received the highest
engagement.
Content Intel
0 2 4 6 8 10 12
0 200 400 600 800 1000 1200
Brand News
Special Offer
Others
Event
Recipes/Menu Updates
Contest
Question to fans
Corporate Social Responsibility
Facebook App
Ad Campaigns
Engagement Oriented Posts
Occasion specific deals/offers
Number of Posts
Engagement Score
Engagement Score Number of Posts

Campaign Intel
Entire Campaign
0 1 2 3 4 5 6
0 100 200 300 400 500 600 700 800 900 1000
NEW LOADED CURLY FRIES
#Sliders
#LoadedItalian
Engagement Score
Engagement Score Number of Posts

Analysis of
Starbucks CoffeeFacebook Page
Jul 01, 2016 - Aug 31, 2016
Brand Overview
FANS NEW FANS FAN GROWTH COUNTRY
36,434,491 140,965 .39% Worldwide
Starbucks Coffee

Engagement Score Total Fan Posts
941 5,741
Total Posts Brand Response Rate
19 8.59%
Total Likes Avg. Reply Time
3,070,464 12 hrs, 54 mins
Total Comments General Sentiment
184,180 Neutral
Total Shares
203,406
Most Engaging Content Type
Recipes/Menu Updates
Least Engaging Content Type
Contest
Most Prolific Content Type
Engagement Oriented Posts
Most Engaging Campaign
#Affogatostyle
Most Recent Campaign
Vanilla Spice Latte
BRAND POSTS FAN POSTS
Brand Overview
CONTENT & CAMPAIGNS

36,200K
36,250K
36,300K
36,350K
36,400K
36,450K
1-Jul 8-Jul 15-Jul 22-Jul 29-Jul 5-Aug 12-Aug 19-Aug 26-Aug
Fan Growth
Total Fans
36,434,491
New Fans
140,965

Engagement
0
250
500
750
1,000
1,250
1-Jul 5-Jul 9-Jul 13-Jul 17-Jul 21-Jul 25-Jul 29-Jul 2-Aug 6-Aug 10-Aug 14-Aug 18-Aug 22-Aug 26-Aug 30-Aug
Starbucks Coffee had an average engagement score of 941 and a highest of 1000.

Community Analysis
Starbucks Coffee fans are largely from United States followed by Mexico.
Distribution of Fans
0K 2,000K 4,000K 6,000K 8,000K 10,000K 12,000K 14,000K 16,000K 18,000K 20,000K
United States
Mexico
Philippines
United Kingdom
Germany
Canada
Malaysia
Taiwan
France
Bulgaria
0
1
1
2
2
3
1-Jul 8-Jul 15-Jul 22-Jul 29-Jul 5-Aug 12-Aug 19-Aug 26-Aug
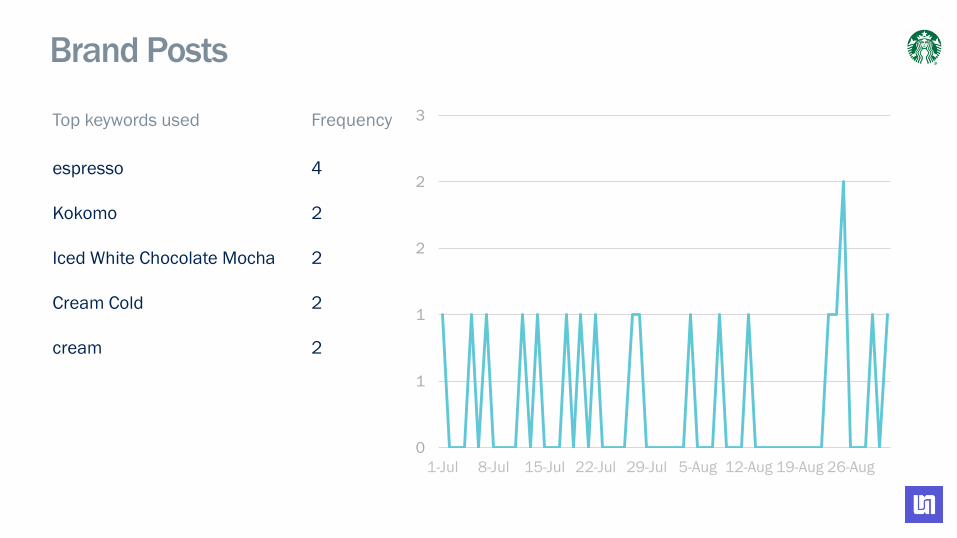
Brand Posts
Top keywords used Frequency
espresso 4
Kokomo 2
Iced White Chocolate Mocha 2
Cream Cold 2
cream 2

58%
42%
Brand Participation Brand Non Participation
Brand Posts - Engagement
Starbucks Coffee responded to 11 conversations generated by the 19 Posts they published.
Brand Responses
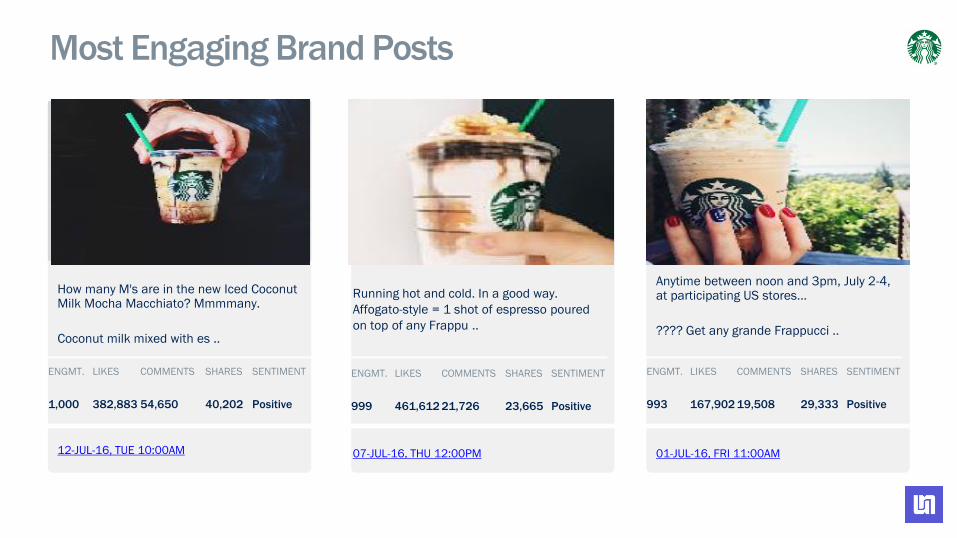
Most Engaging Brand Posts
12-JUL-16, TUE 10:00AM
How many M's are in the new Iced Coconut Milk Mocha Macchiato? Mmmmany.
Coconut milk mixed with es ..
ENGMT. LIKES COMMENTS SHARES SENTIMENT
1,000 382,883 54,650 40,202 Positive
07-JUL-16, THU 12:00PM
Running hot and cold. In a good way.
Affogato-style = 1 shot of espresso poured
on top of any Frappu ..
01-JUL-16, FRI 11:00AM
Anytime between noon and 3pm, July 2-4, at participating US stores...
???? Get any grande Frappucci ..
ENGMT. LIKES COMMENTS SHARES SENTIMENT
999 461,612 21,726 23,665 Positive
ENGMT. LIKES COMMENTS SHARES SENTIMENT
993 167,902 19,508 29,333 Positive
NO IMAGE NO IMAGE NO IMAGE

Brand Posts - Analysis
Brand Post Types Days of the week
0 2 4 6 8 10 12 14
0 200 400 600 800 1,000 1,200
Links
Photos
Plain Text
Videos
Polls
Number of Posts
Engagement Score
Engagement Score Number of Posts
0 2 4 6 8
0 200 400 600 800 1,000 1,200
Monday
Tuesday
Wednesday
Thursday
Friday
Saturday
Sunday
Number of Posts
Engagement Score
Engagement Score Number of Posts

Top Keywords Used Frequency
Starbucks 3222
coffee 917
drink 803
store 547
cup 471
User Posts
0
50
100
150
200
250
300
1-J
ul
3-J
ul
5-J
ul
7-J
ul
9-J
ul
11
-Ju
l
13
-Ju
l
15
-Ju
l
17
-Ju
l
19
-Ju
l
21
-Ju
l
23
-Ju
l
25
-Ju
l
27
-Ju
l
29
-Ju
l
31
-Ju
l
2-A
ug
4-A
ug
6-A
ug
8-A
ug
10
-Au
g
12
-Au
g
14
-Au
g
16
-Au
g
18
-Au
g
20
-Au
g
22
-Au
g
24
-Au
g
26
-Au
g
28
-Au
g
30
-Au
g
Positive Neutral Negative

Starbucks Coffee responded to 493 conversations generated
by the 5,791 Posts fans published.
Starbucks Coffee appears to participate more when Fan
conversations have greater positive vibes than negative.
User Posts - Engagement
Brand Responses Sentiment
9%
91%
Brand Participation Brand Non Participation
28%
18%
54%
Posititve Negative Neutral
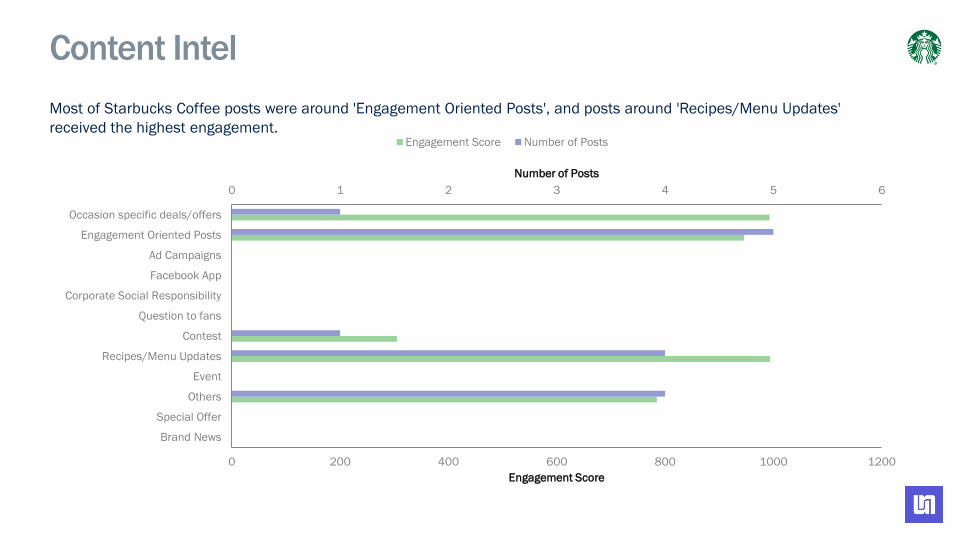
Most of Starbucks Coffee posts were around 'Engagement Oriented Posts', and posts around 'Recipes/Menu Updates'
received the highest engagement.
Content Intel
0 1 2 3 4 5 6
0 200 400 600 800 1000 1200
Brand News
Special Offer
Others
Event
Recipes/Menu Updates
Contest
Question to fans
Corporate Social Responsibility
Facebook App
Ad Campaigns
Engagement Oriented Posts
Occasion specific deals/offers
Number of Posts
Engagement Score
Engagement Score Number of Posts

Campaign Intel
Entire Campaign
0 1 2 3
0 100 200 300 400 500 600 700 800 900 1000
#StarbucksRewards
#IcedCoconutMilkMochaMacchiato
#Teavana
Number of Posts
Engagement Score
Engagement Score Number of Posts

Analysis of
Panera BreadFacebook Page
Jul 01, 2016 - Aug 31, 2016

Brand Overview
FANS NEW FANS FAN GROWTH COUNTRY
2,908,812 54,356 1.90% United States
Panera Bread

Engagement Score Total Fan Posts
897 1,246
Total Posts Brand Response Rate
22 34.11%
Total Likes Avg. Reply Time
591,445 6 hrs, 47 mins
Total Comments General Sentiment
9,688 Neutral
Total Shares
9,877
Most Engaging Content Type
Engagement Oriented Posts
Least Engaging Content Type
Brand News
Most Prolific Content Type
Engagement Oriented Posts
Most Engaging Campaign
Strawberry Poppyseed and
Chicken Salad
Most Recent Campaign
#LemonAidChicago
BRAND POSTS FAN POSTS
Brand Overview
CONTENT & CAMPAIGNS
2,820K
2,830K
2,840K
2,850K
2,860K
2,870K
2,880K
2,890K
2,900K
2,910K
2,920K
1-Jul 8-Jul 15-Jul 22-Jul 29-Jul 5-Aug 12-Aug 19-Aug 26-Aug
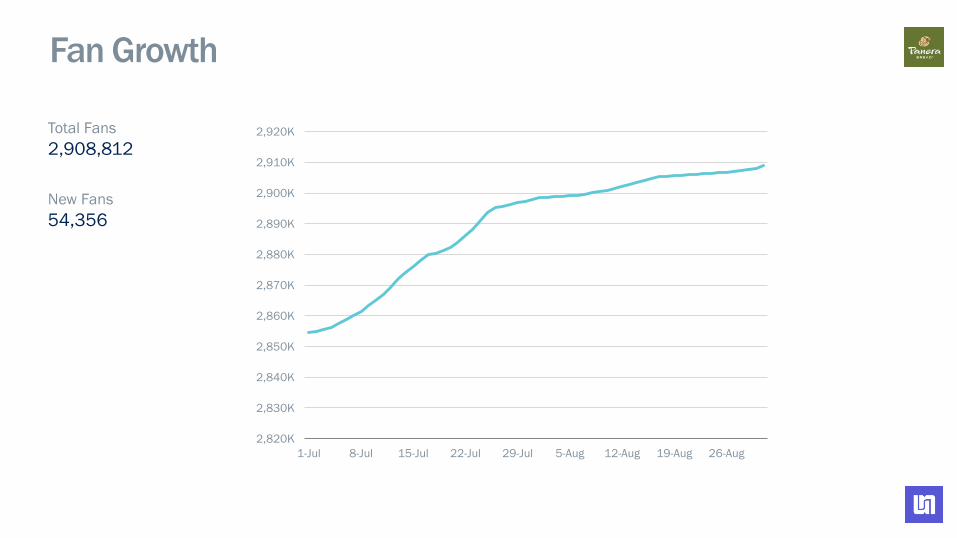
Fan Growth
Total Fans
2,908,812
New Fans
54,356

Engagement
0
250
500
750
1,000
1,250
1-Jul 5-Jul 9-Jul 13-Jul 17-Jul 21-Jul 25-Jul 29-Jul 2-Aug 6-Aug 10-Aug 14-Aug 18-Aug 22-Aug 26-Aug 30-Aug
Panera Bread had an average engagement score of 897 and a highest of 997.

Community AnalysisPanera Bread fans are largely from United States followed by Canada.
Distribution of Fans
0K 500K 1,000K 1,500K 2,000K 2,500K 3,000K
United States
Canada
Mexico
Puerto Rico
Germany
India
United Kingdom
Brazil
Philippines
New Zealand
0
0
0
1
1
1
1
1-Jul 8-Jul 15-Jul 22-Jul 29-Jul 5-Aug 12-Aug 19-Aug 26-Aug
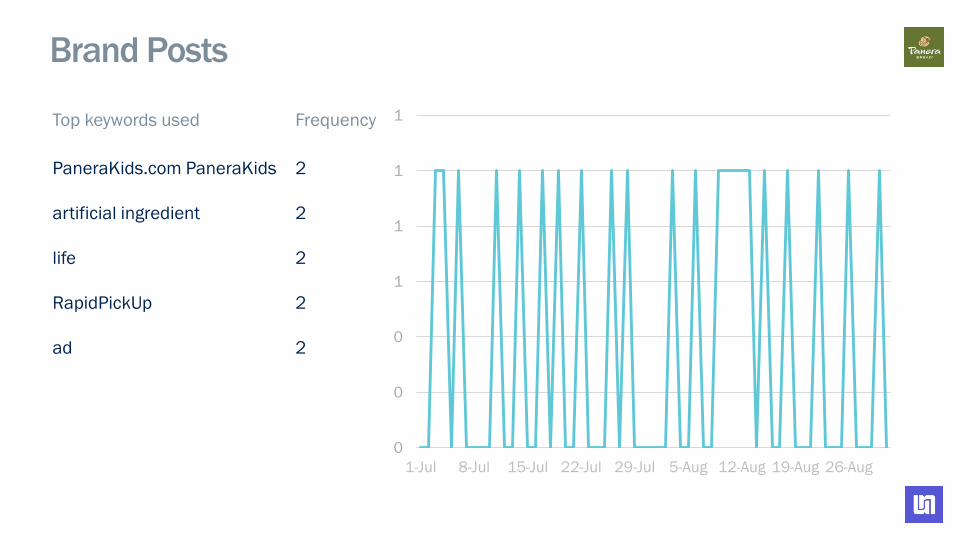
Brand Posts
Top keywords used Frequency
PaneraKids.com PaneraKids 2
artificial ingredient 2
life 2
RapidPickUp 2
ad 2

86%
14%
Brand Participation Brand Non Participation
Brand Posts - Engagement
Panera Bread responded to 19 conversations generated by the 22 Posts they published.
Brand Responses

Most Engaging Brand Posts
11-JUL-16, MON 10:00AM
When the sun hits your salad just right.
ENGMT. LIKES COMMENTS SHARES SENTIMENT
997 68,595 1,073 915 Positive
17-JUL-16, SUN 10:00AM
A light lunch with some heavy reading.
06-JUL-16, WED 10:00AM
A match made in summer.
ENGMT. LIKES COMMENTS SHARES SENTIMENT
995 65,096 633 1,118 Positive
ENGMT. LIKES COMMENTS SHARES SENTIMENT
993 62,400 457 885 Positive
NO IMAGE NO IMAGE NO IMAGE

Brand Posts - Analysis
Brand Post Types Days of the week
0 5 10 15 20
0 200 400 600 800 1000
Photos
Videos
Plain Text
Links
Polls
Number of Posts
Engagement Score
Engagement Score Number of Posts
0 1 2 3 4 5
0 200 400 600 800 1,000 1,200
Monday
Tuesday
Wednesday
Thursday
Friday
Saturday
Sunday
Number of Posts
Engagement Score
Engagement Score Number of Posts

Top Keywords Used Frequency
Panera Bread 330
Panera 324
time 184
food 180
location 147
User Posts
0
5
10
15
20
25
30
35
40
45
1-J
ul
3-J
ul
5-J
ul
7-J
ul
9-J
ul
11
-Ju
l
13
-Ju
l
15
-Ju
l
17
-Ju
l
19
-Ju
l
21
-Ju
l
23
-Ju
l
25
-Ju
l
27
-Ju
l
29
-Ju
l
31
-Ju
l
2-A
ug
4-A
ug
6-A
ug
8-A
ug
10
-Au
g
12
-Au
g
14
-Au
g
16
-Au
g
18
-Au
g
20
-Au
g
22
-Au
g
24
-Au
g
26
-Au
g
28
-Au
g
30
-Au
g
Positive Neutral Negative

Panera Bread responded to 425 conversations generated by
the 1,246 Posts fans published.
Panera Bread appears to participate more when Fan
conversations have greater positive vibes than negative.
User Posts - Engagement
Brand Responses Sentiment
34%
66%
Brand Participation Brand Non Participation
32%
19%
49%
Posititve Negative Neutral

Most of Panera Bread posts were around 'Engagement Oriented Posts‘.
Content Intel
0 1 2 3 4 5 6 7 8 9 10
0 200 400 600 800 1000 1200
Brand News
Special Offer
Others
Event
Recipes/Menu Updates
Contest
Question to fans
Corporate Social Responsibility
Facebook App
Ad Campaigns
Engagement Oriented Posts
Occasion specific deals/offers
Number of Posts
Engagement Score
Engagement Score Number of Posts

Campaign Intel
Entire Campaign
0 2 4 6 8 10 12
0 100 200 300 400 500 600 700 800 900 1000
#SoupReview
#SandwichAptitudeTest
#FoodForThought
Engagement Score
Engagement Score Number of Posts
Analysis of
Domino's PizzaFacebook Page
Jul 01, 2016 - Aug 31, 2016

Brand Overview
FANS NEW FANS FAN GROWTH COUNTRY DEMOGRAPHICS
13,965,044 3,176,534 29.44% Worldwide Mostly Young, Female and Attached.
Domino's Pizza

Engagement Score Total Fan Posts
112 2,595
Total Posts Brand Response Rate
38 41.08%
Total Likes Avg. Reply Time
74,651 1 hr, 48 mins
Total Comments General Sentiment
10,669 Neutral
Total Shares
8,733
Most Engaging Content Type
Special Offer
Least Engaging Content Type
Engagement Oriented Posts
Most Prolific Content Type
Others
Most Engaging Campaign
#Menu-priced pizzas
Most Recent Campaign
Order medium 2-topping
pizzas for $5.99 each deal
BRAND POSTS FAN POSTS
Brand Overview
CONTENT & CAMPAIGNS

0K
2,000K
4,000K
6,000K
8,000K
10,000K
12,000K
14,000K
16,000K
1-Jul 8-Jul 15-Jul 22-Jul 29-Jul 5-Aug 12-Aug 19-Aug 26-Aug
Fan Growth
Total Fans
13,965,044
New Fans
3,176,534

Engagement
0
250
500
750
1,000
1-Jul 5-Jul 9-Jul 13-Jul 17-Jul 21-Jul 25-Jul 29-Jul 2-Aug 6-Aug 10-Aug 14-Aug 18-Aug 22-Aug 26-Aug 30-Aug
Domino's Pizza had an average engagement score of 112 and a highest of 822.

Community Analysis
Domino's Pizza fans are mostly Young, Female and Attached. Domino's Pizza fans are largely from United States followed
by India.
Fan Demographics Distribution of Fans
45%
55%
male female
0% 20% 40% 60%
Below 21
21-30
31-40
41-50
51-60
Over 60
0% 10% 20% 30% 40%
Single
In a Relationship
Engaged
Married
UnKnown
0K 1,000K 2,000K 3,000K 4,000K 5,000K
United States
India
Mexico
Egypt
Pakistan
United Kingdom
Saudi Arabia
Canada
Malaysia

0
1
1
2
2
3
3
4
4
5
1-Jul 8-Jul 15-Jul 22-Jul 29-Jul 5-Aug 12-Aug 19-Aug 26-Aug
Brand Posts
Top keywords used Frequency
5.99 4
course 3
drive 3
delivery 3
Kick 3

39%
61%
Brand Participation Brand Non Participation
96%
4%
0%
Posititve Negative Neutral
Brand Posts - Engagement
Domino's Pizza responded to 15 conversations generated by
the 38 Posts they published.
Domino's Pizza receives more positive than negative vibes
from comments on their Posts.
Brand Responses Sentiment of Brand Posts
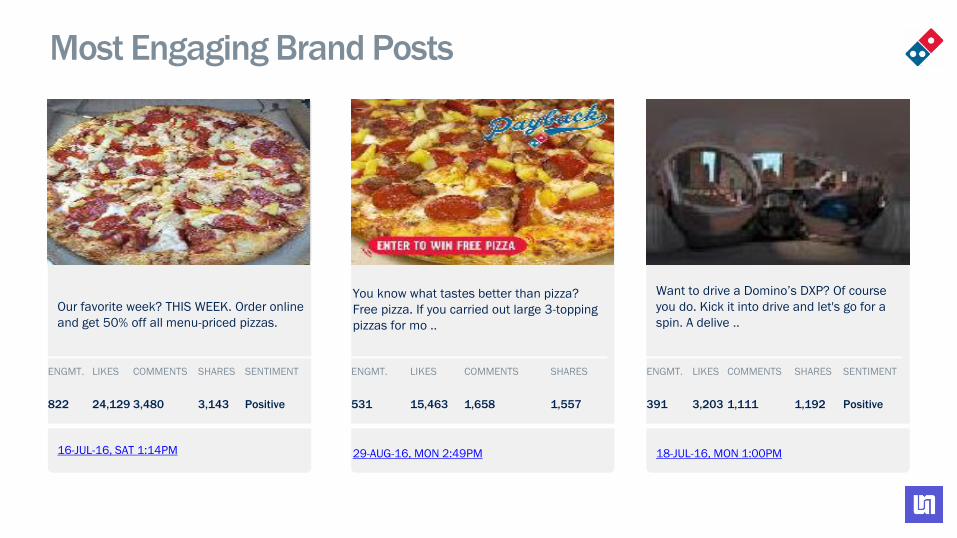
Most Engaging Brand Posts
16-JUL-16, SAT 1:14PM
Our favorite week? THIS WEEK. Order online
and get 50% off all menu-priced pizzas.
ENGMT. LIKES COMMENTS SHARES SENTIMENT
822 24,129 3,480 3,143 Positive
29-AUG-16, MON 2:49PM
You know what tastes better than pizza?
Free pizza. If you carried out large 3-topping
pizzas for mo ..
18-JUL-16, MON 1:00PM
Want to drive a Domino’s DXP? Of course
you do. Kick it into drive and let's go for a
spin. A delive ..
ENGMT. LIKES COMMENTS SHARES
531 15,463 1,658 1,557
ENGMT. LIKES COMMENTS SHARES SENTIMENT
391 3,203 1,111 1,192 Positive
NO IMAGE NO IMAGE NO IMAGE

Brand Posts - Analysis
Brand Post Types Days of the week
0 5 10 15 20 25 30
0 50 100 150 200
Videos
Photos
Links
Plain Text
Polls
Number of Posts
Engagement Score
Engagement Score Number of Posts
0 2 4 6 8
0 50 100 150 200 250 300
Monday
Tuesday
Wednesday
Thursday
Friday
Saturday
Sunday
Number of Posts
Engagement Score
Engagement Score Number of Posts
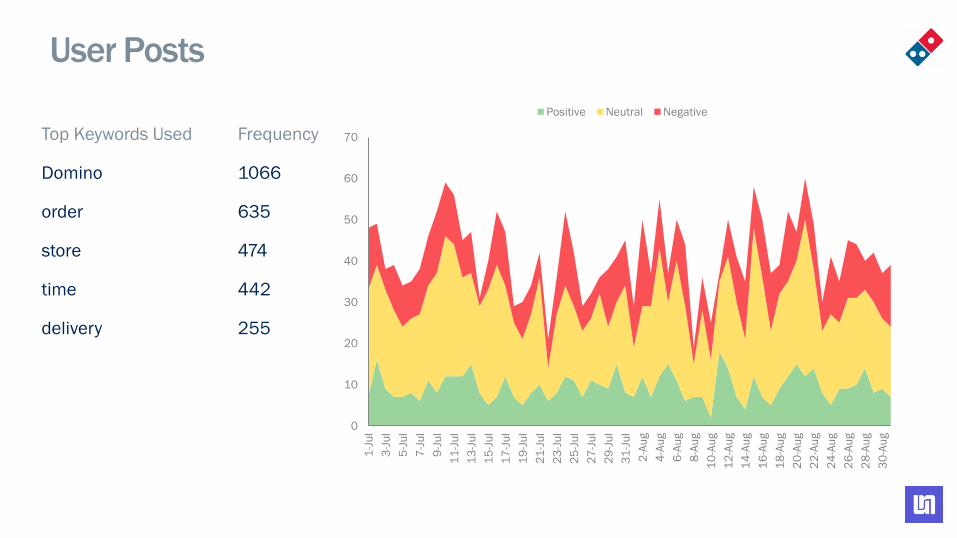
Top Keywords Used Frequency
Domino 1066
order 635
store 474
time 442
delivery 255
User Posts
0
10
20
30
40
50
60
70
1-J
ul
3-J
ul
5-J
ul
7-J
ul
9-J
ul
11
-Ju
l
13
-Ju
l
15
-Ju
l
17
-Ju
l
19
-Ju
l
21
-Ju
l
23
-Ju
l
25
-Ju
l
27
-Ju
l
29
-Ju
l
31
-Ju
l
2-A
ug
4-A
ug
6-A
ug
8-A
ug
10
-Au
g
12
-Au
g
14
-Au
g
16
-Au
g
18
-Au
g
20
-Au
g
22
-Au
g
24
-Au
g
26
-Au
g
28
-Au
g
30
-Au
g
Positive Neutral Negative

Domino's Pizza responded to 1,066 conversations generated
by the 2,595 Posts fans published.
Domino's Pizza appears to participate more when Fan
conversations have greater negative vibes than positive.
User Posts - Engagement
Brand Responses Sentiment
41%
59%
Brand Participation Brand Non Participation
23%
25%
52%
Posititve Negative Neutral
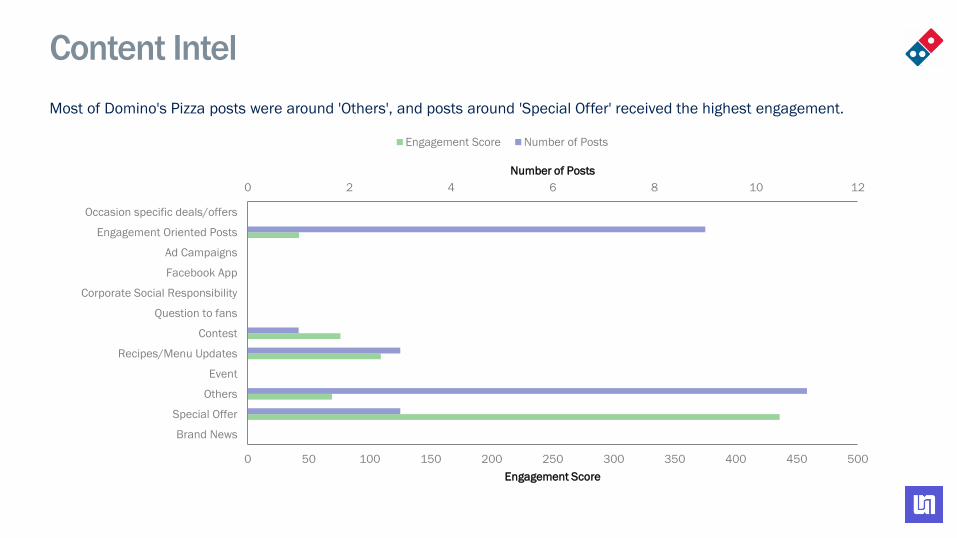
Most of Domino's Pizza posts were around 'Others', and posts around 'Special Offer' received the highest engagement.
Content Intel
0 2 4 6 8 10 12
0 50 100 150 200 250 300 350 400 450 500
Brand News
Special Offer
Others
Event
Recipes/Menu Updates
Contest
Question to fans
Corporate Social Responsibility
Facebook App
Ad Campaigns
Engagement Oriented Posts
Occasion specific deals/offers
Number of Posts
Engagement Score
Engagement Score Number of Posts

Campaign Intel
Entire Campaign
0 1 2 3 4
0 100 200 300 400 500 600
#Pizzapayback
#SaladShame
#pizzaslomo
Number of Posts
Engagement Score
Engagement Score Number of Posts
Generate Your Own Social Media Report
This report was generated entirely by the Unmetric
Reporting Engine.
It took minutes to create.
Create Your Free
Social Media Report Now