Social Media By The Numbers: 70+ Mind-Blowing Social Media Stats
82
SOCIAL MEDIA BY THE NUMBERS 70+ MIND-BLOWING SOCIAL MEDIA STATS © 2015 Fandom Marketing, Inc. in entirety Updated April 2015
-
Upload
fandom-marketing -
Category
Documents
-
view
2.265 -
download
0
Transcript of Social Media By The Numbers: 70+ Mind-Blowing Social Media Stats
SOCIAL MEDIA BY THE NUMBERS
70+ MIND-BLOWING SOCIAL MEDIA STATS
© 2015 Fandom Marketing, Inc. in entirety
Updated April 2015
how people use social media
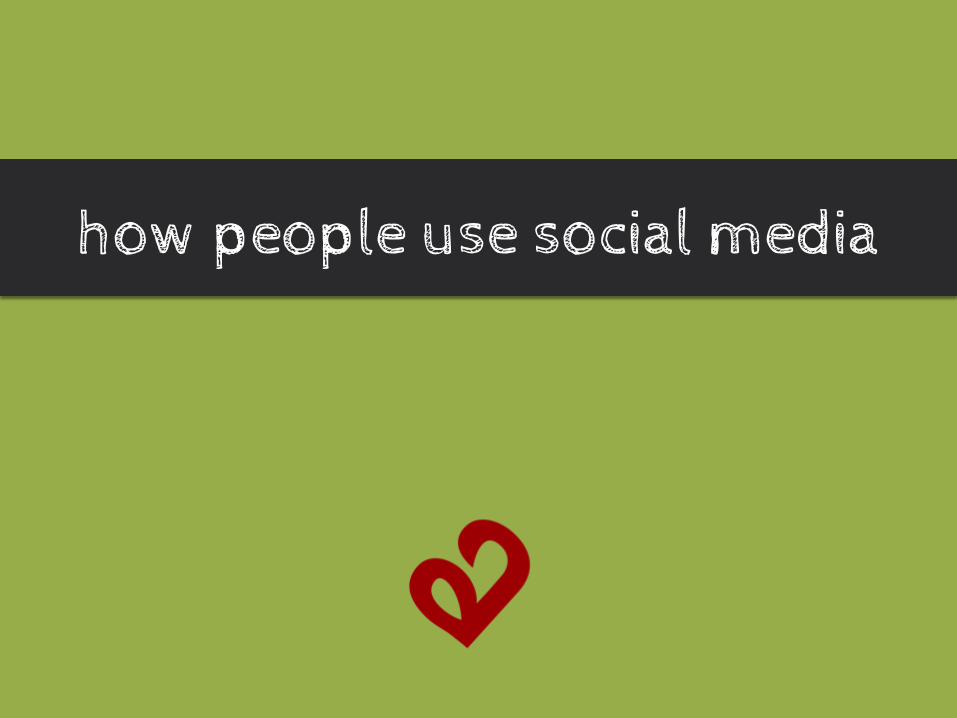
74% of adults online use social networking sites
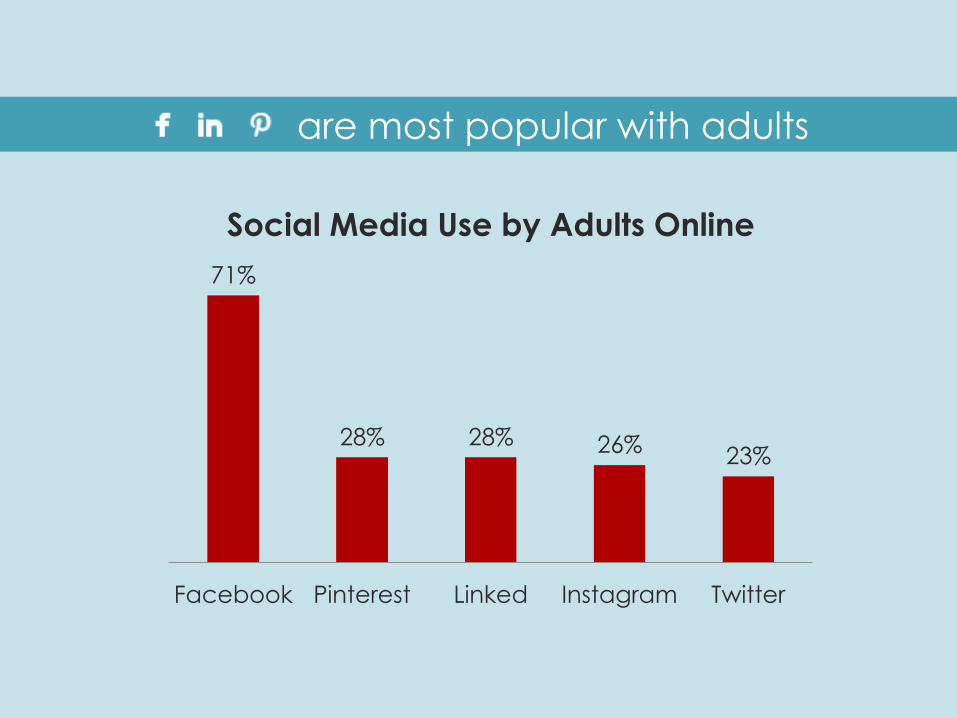
are most popular with adults
71%
28% 28% 26% 23%
Facebook Pinterest Linked Instagram Twitter
Social Media Use by Adults Online
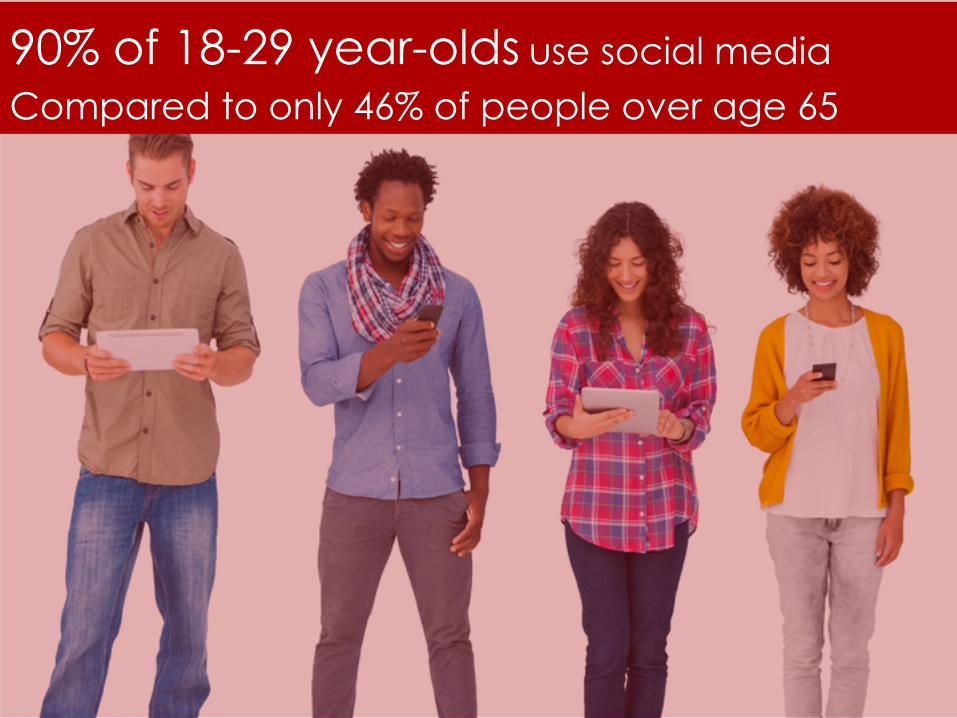
90% of 18-29 year-olds use social media
Compared to only 46% of people over age 65
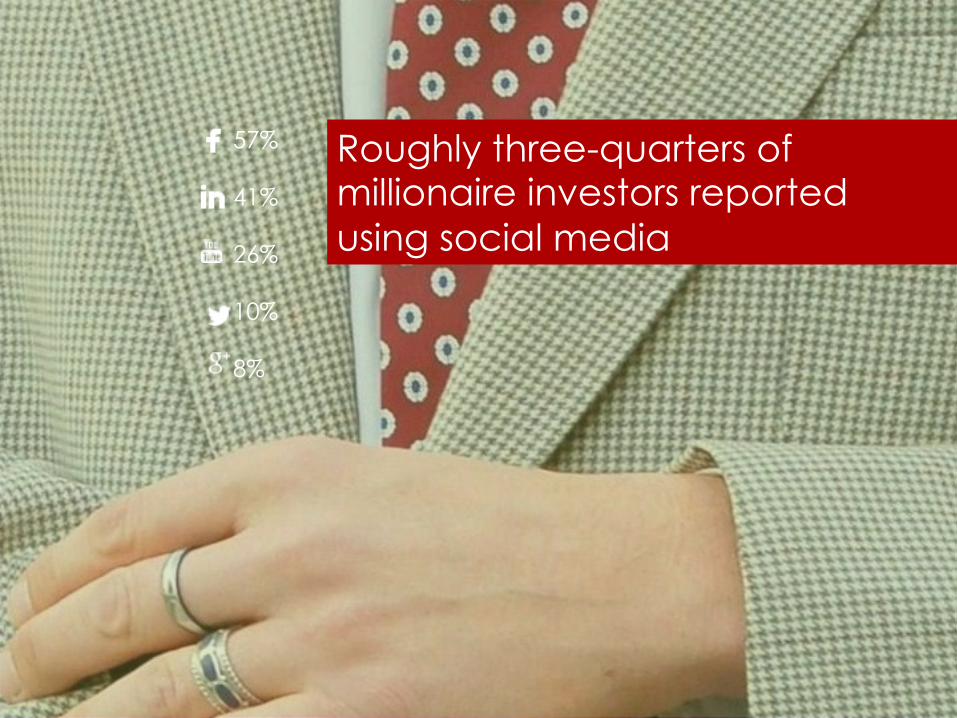
Roughly three-quarters of millionaire investors reported using social media
57% 41% 26% 10% 8%
how businesses use social media
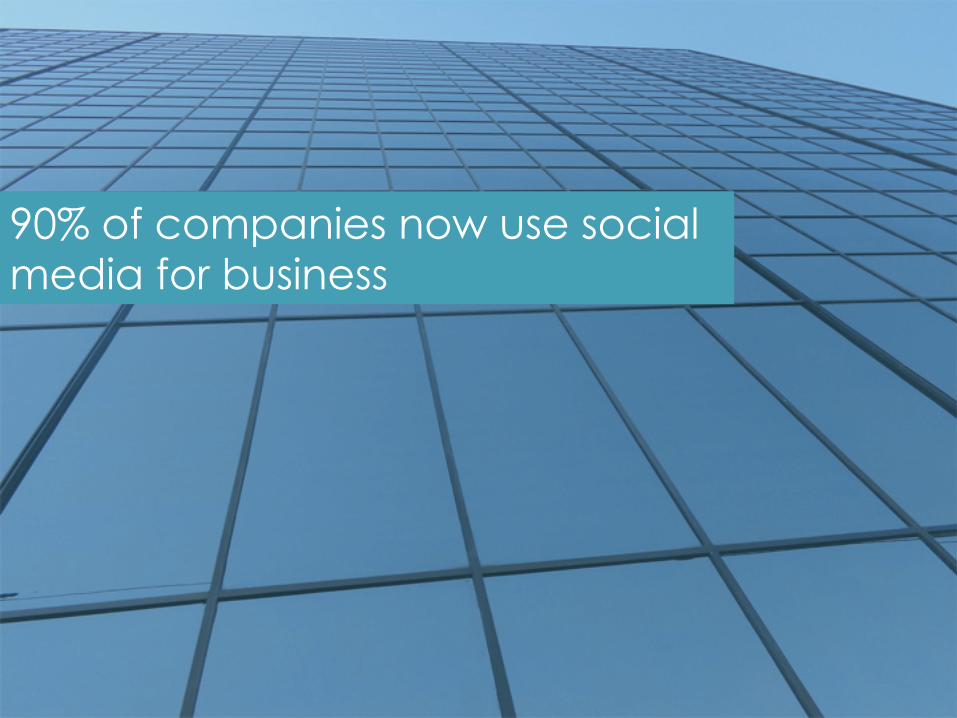
90% of companies now use social media for business
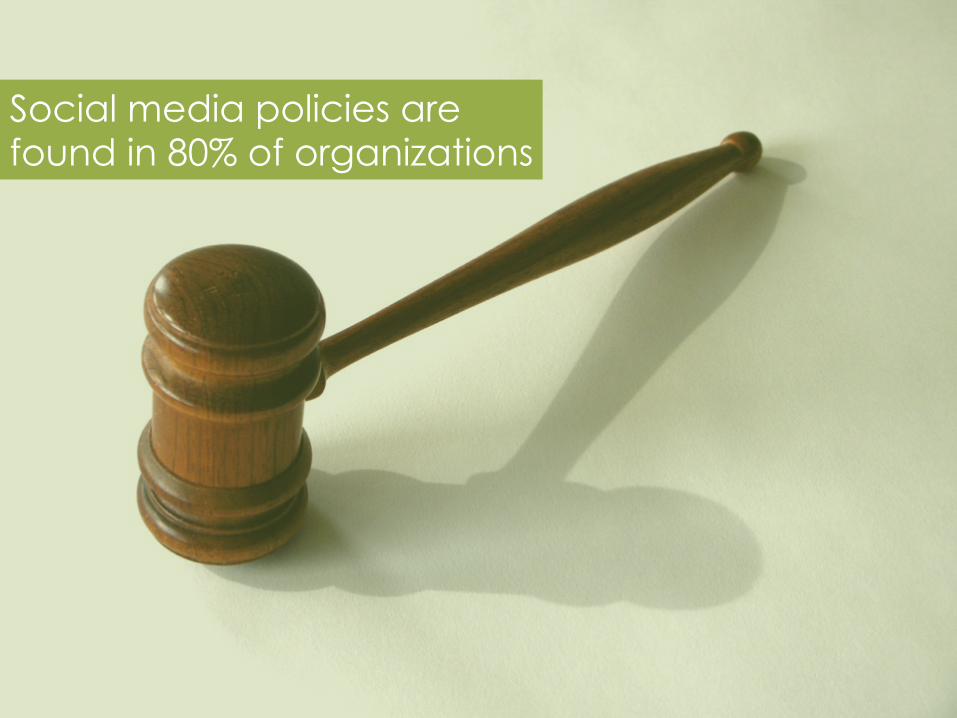
Social media policies are found in 80% of organizations

Only 17% of organizations have provisions that protect them against misuse of social media by ex-employees
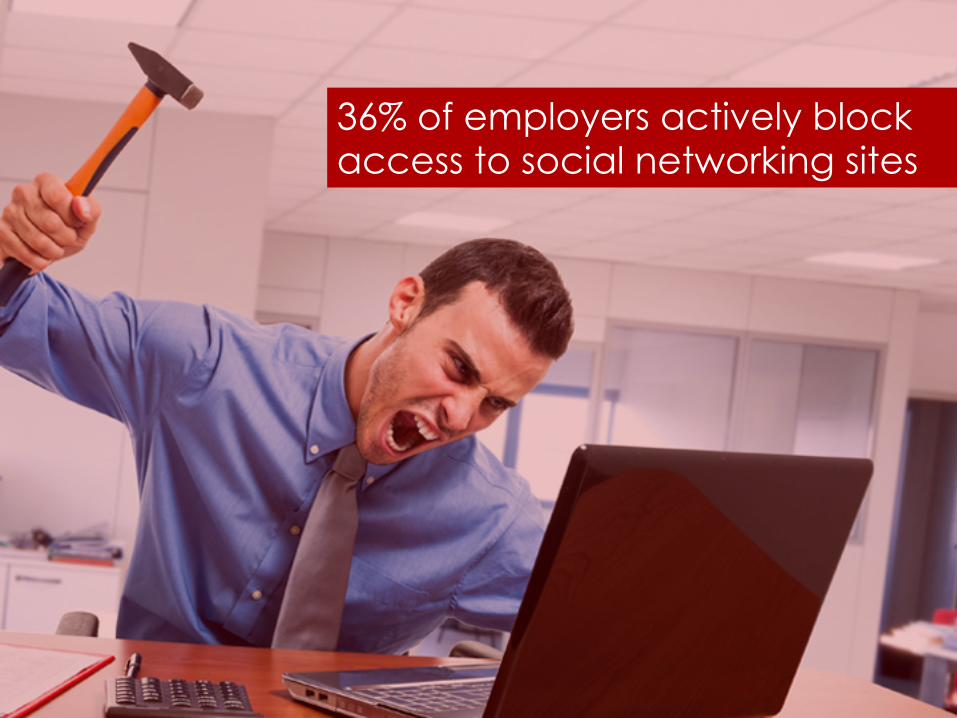
36% of employers actively block access to social networking sites
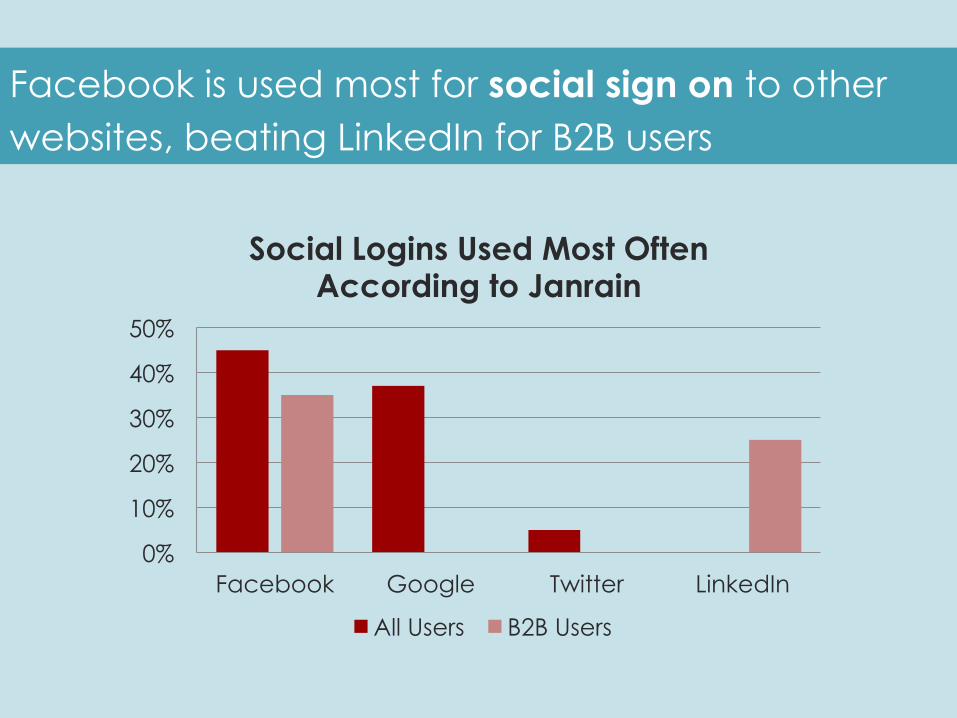
Facebook is used most for social sign on to other websites, beating LinkedIn for B2B users
0%
10%
20%
30%
40%
50%
Facebook Google Twitter LinkedIn
Social Logins Used Most Often According to Janrain
All Users B2B Users

Social network ad spending will hit $23.68 billion worldwide in 2015
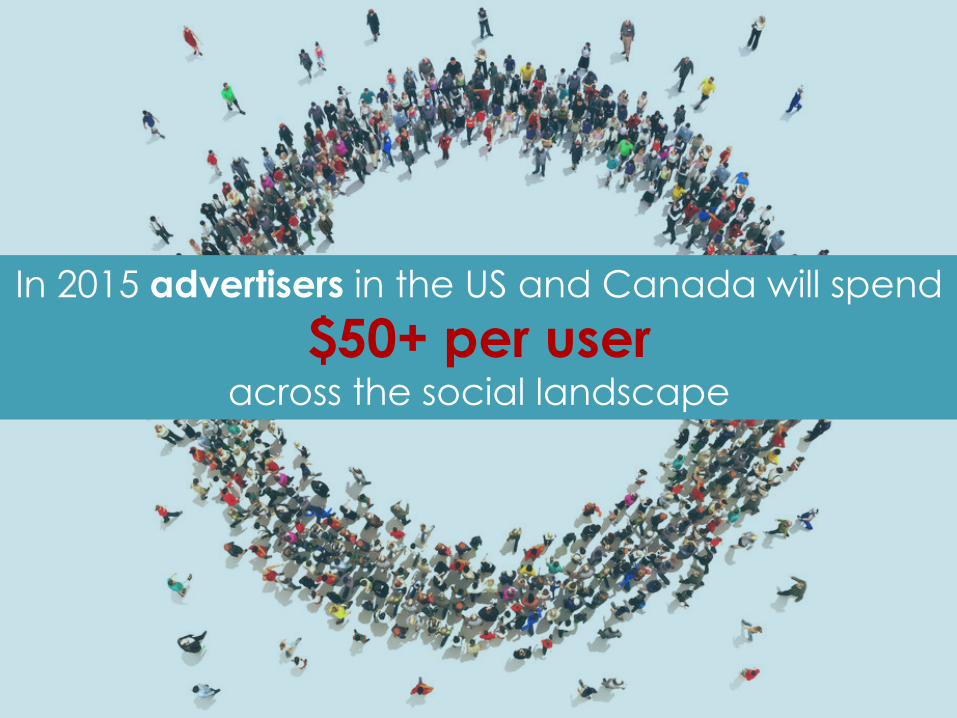
In 2015 advertisers in the US and Canada will spend
$50+ per user across the social landscape
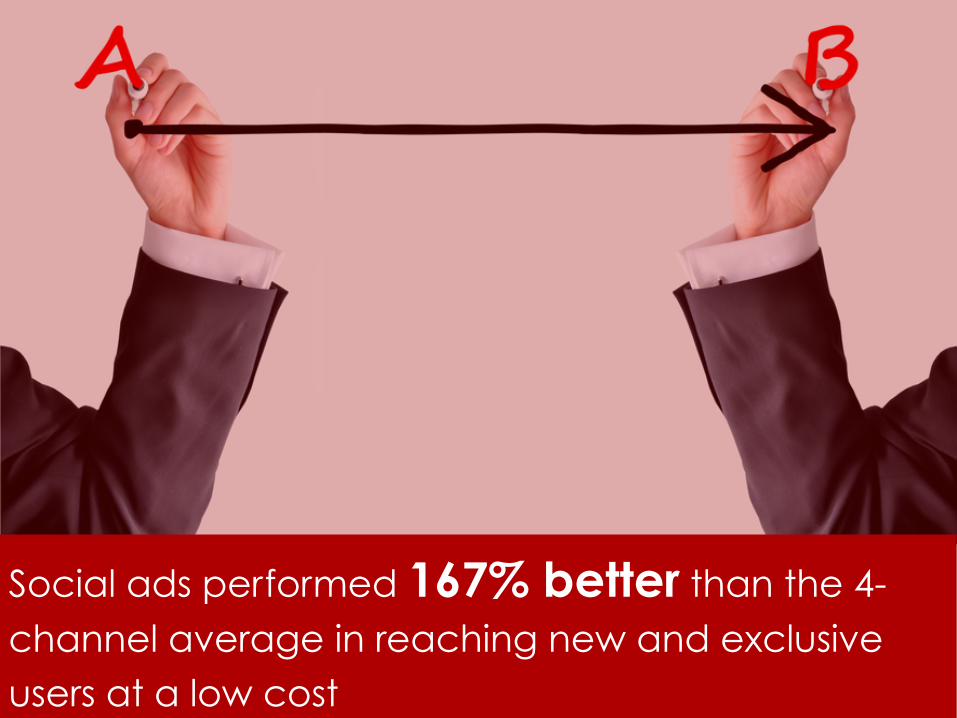
Social ads performed 167% better than the 4-channel average in reaching new and exclusive users at a low cost
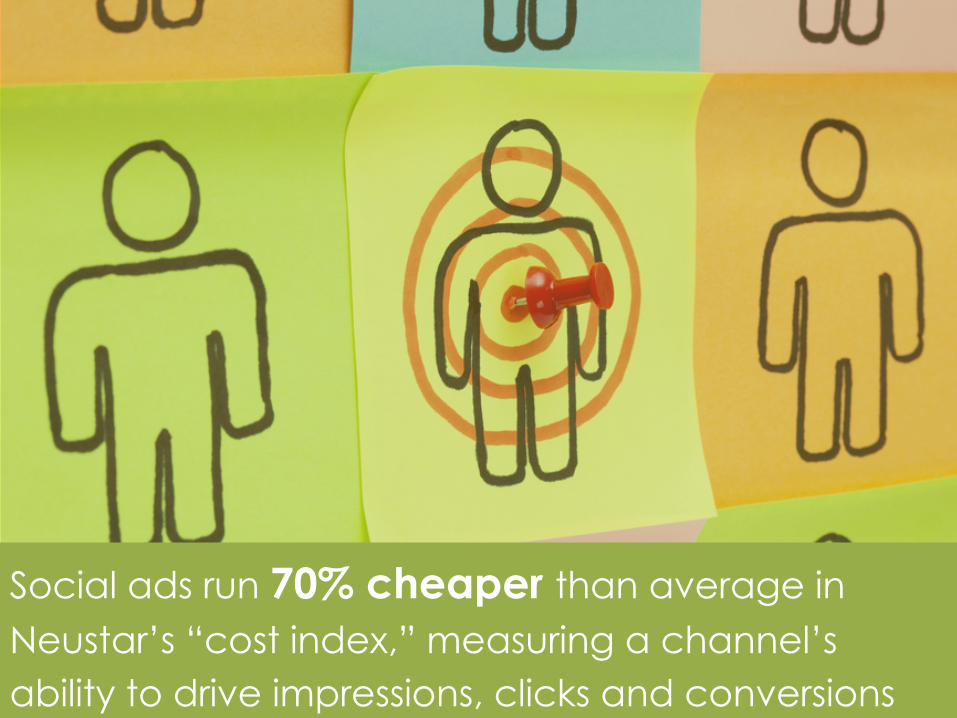
Social ads run 70% cheaper than average in Neustar’s “cost index,” measuring a channel’s ability to drive impressions, clicks and conversions
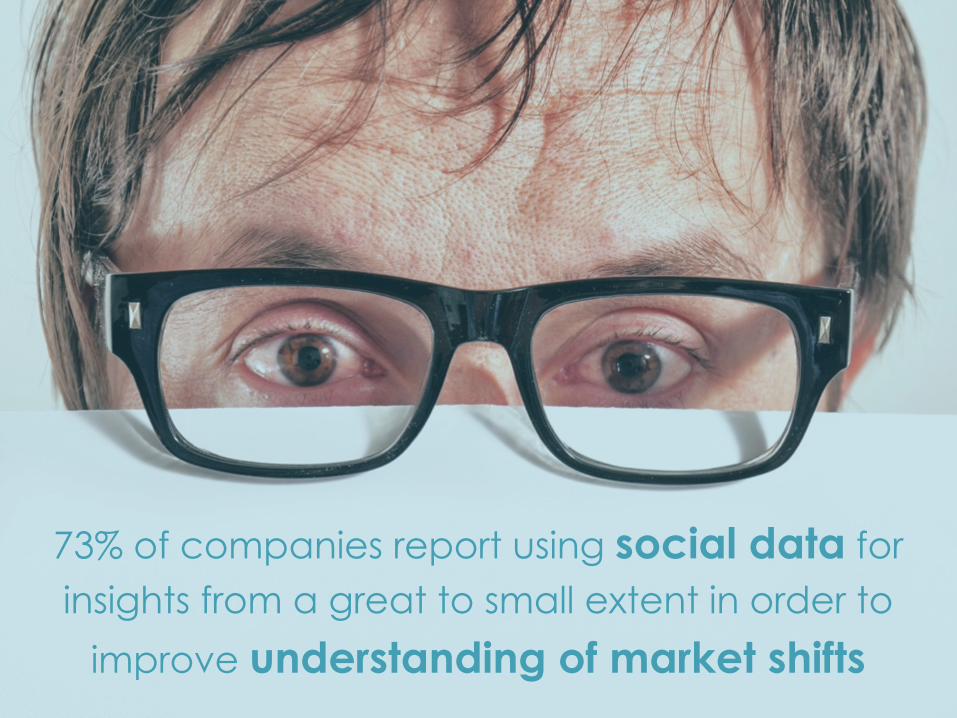
73% of companies report using social data for insights from a great to small extent in order to
improve understanding of market shifts

41% of all purchases start on one device and move to another… typically moving smaller to larger — phone to tablet or laptop

Improving the cross-channel experience and customer analytics are top priorities for businesses
how customers use social media

34% ask questions of other [social media] users about how to get better service
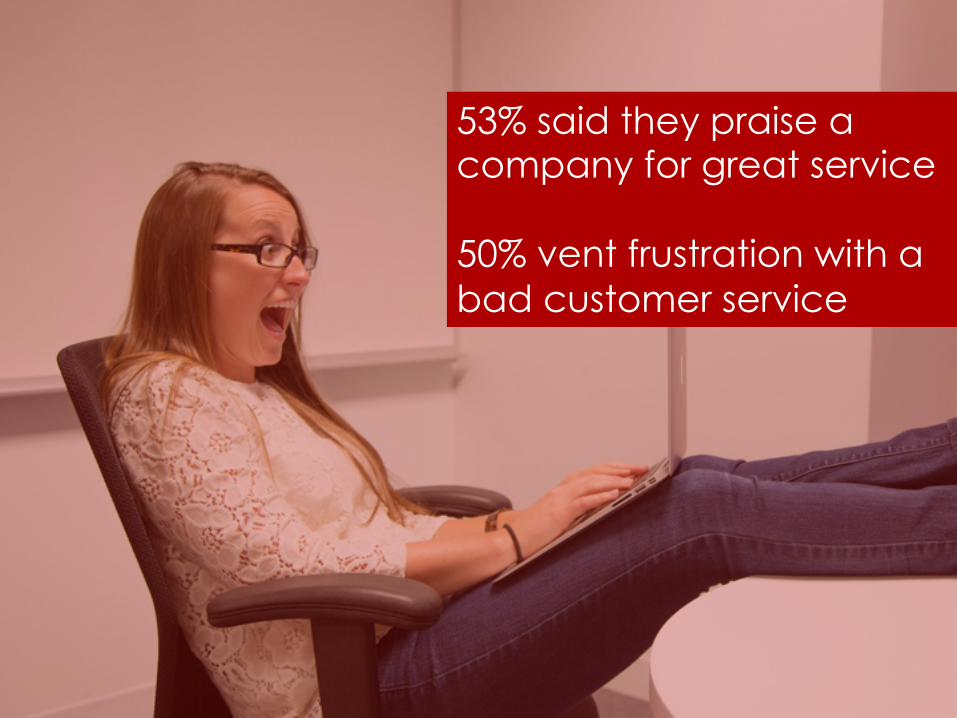
53% said they praise a company for great service 50% vent frustration with a bad customer service
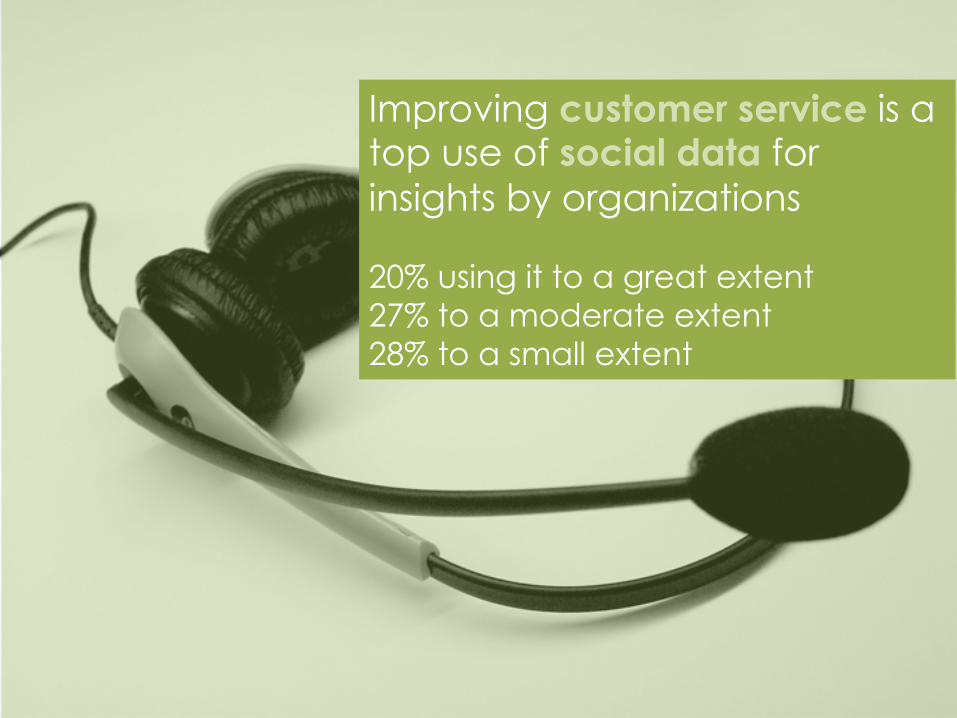
Improving customer service is a top use of social data for insights by organizations 20% using it to a great extent 27% to a moderate extent 28% to a small extent

how B2B marketers use social media
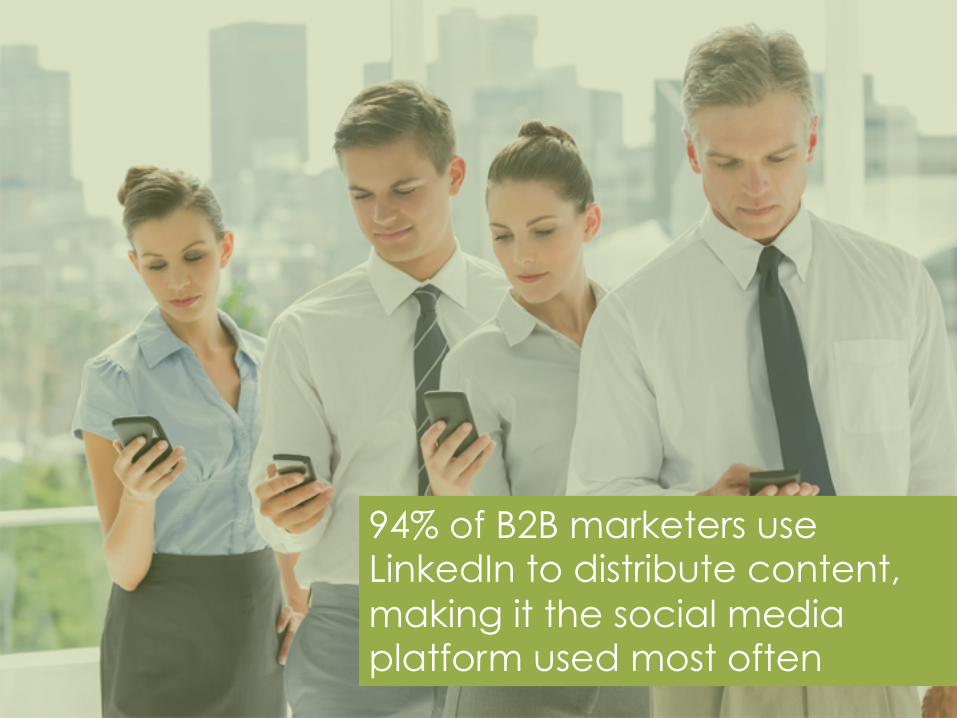
94% of B2B marketers use LinkedIn to distribute content, making it the social media platform used most often
Pinterest is being used by more than 25% of B2B marketers
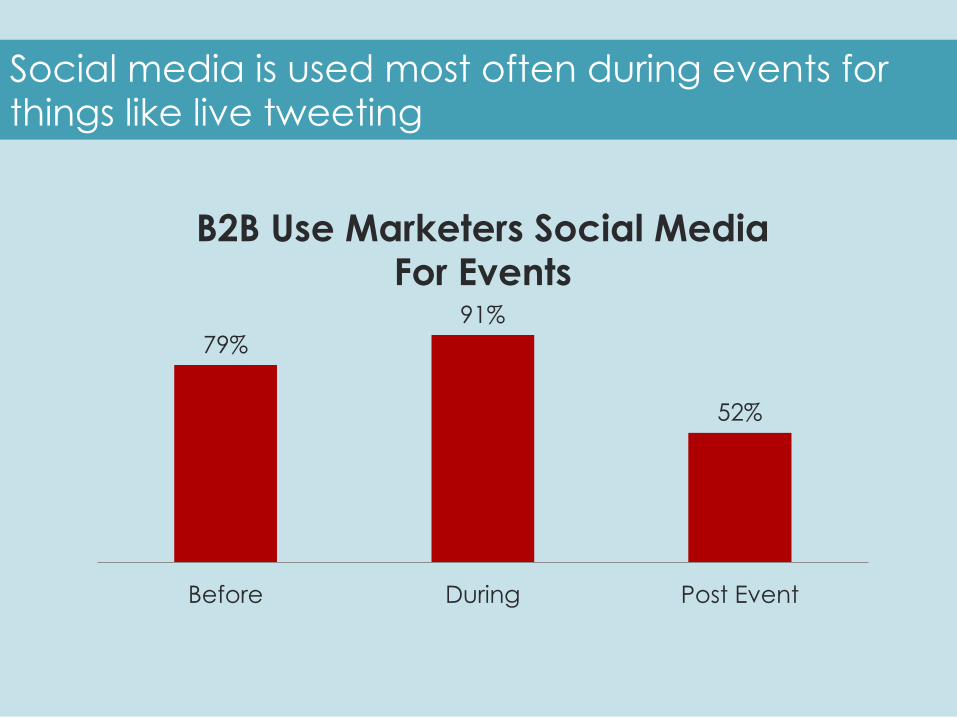
79% 91%
52%
Before During Post Event
B2B Use Marketers Social Media For Events
Social media is used most often during events for things like live tweeting
facebook trends
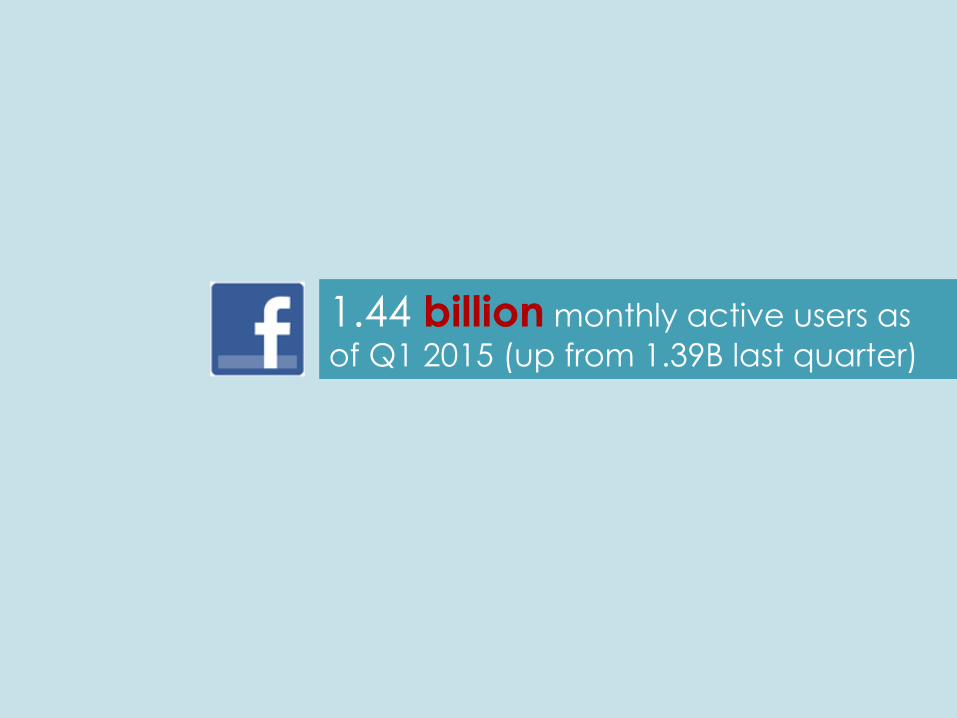
1.44 billion monthly active users as of Q1 2015 (up from 1.39B last quarter)

1.25 billion (87%) access Facebook using a mobile device monthly

82.4% of daily active Facebook users are outside the US and Canada

65% of Facebook users visit the site on a daily basis
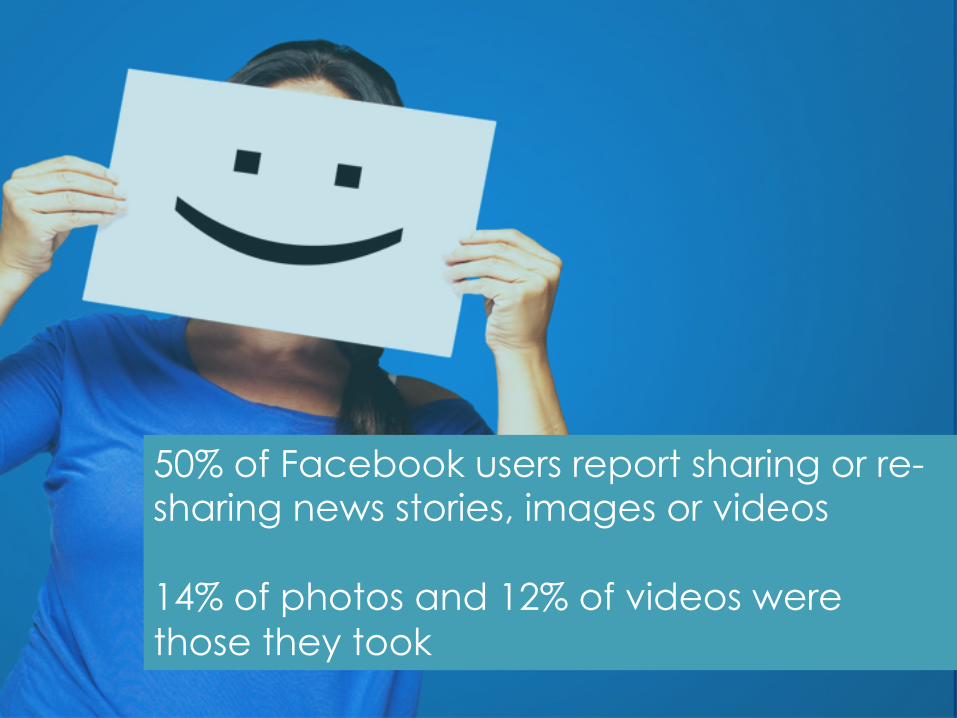
50% of Facebook users report sharing or re-sharing news stories, images or videos 14% of photos and 12% of videos were those they took
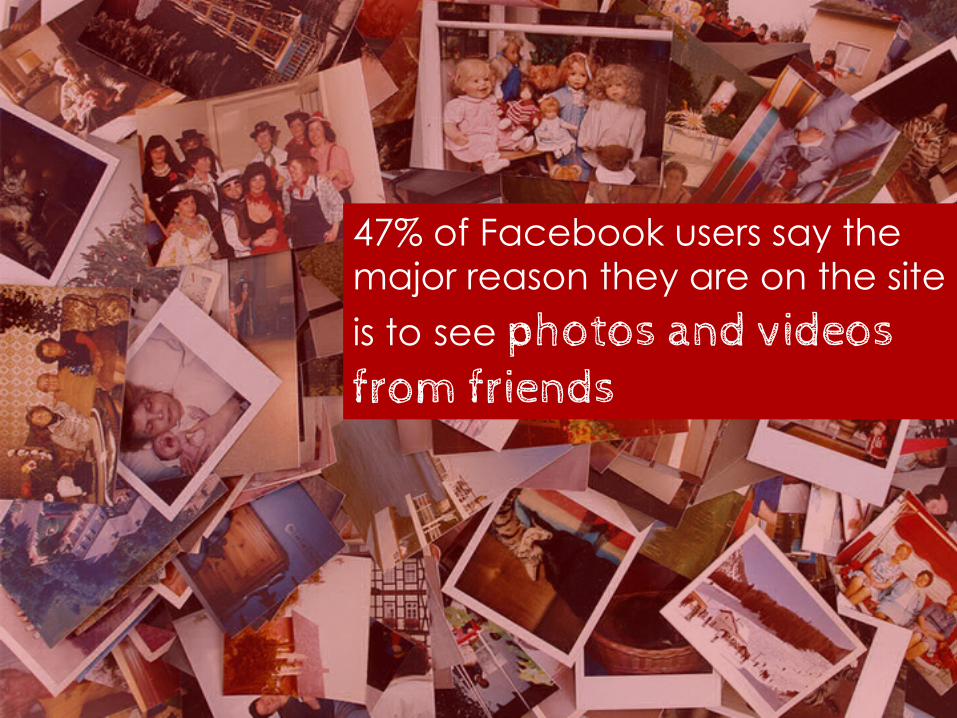
47% of Facebook users say the major reason they are on the site
is to see photos and videos from friends
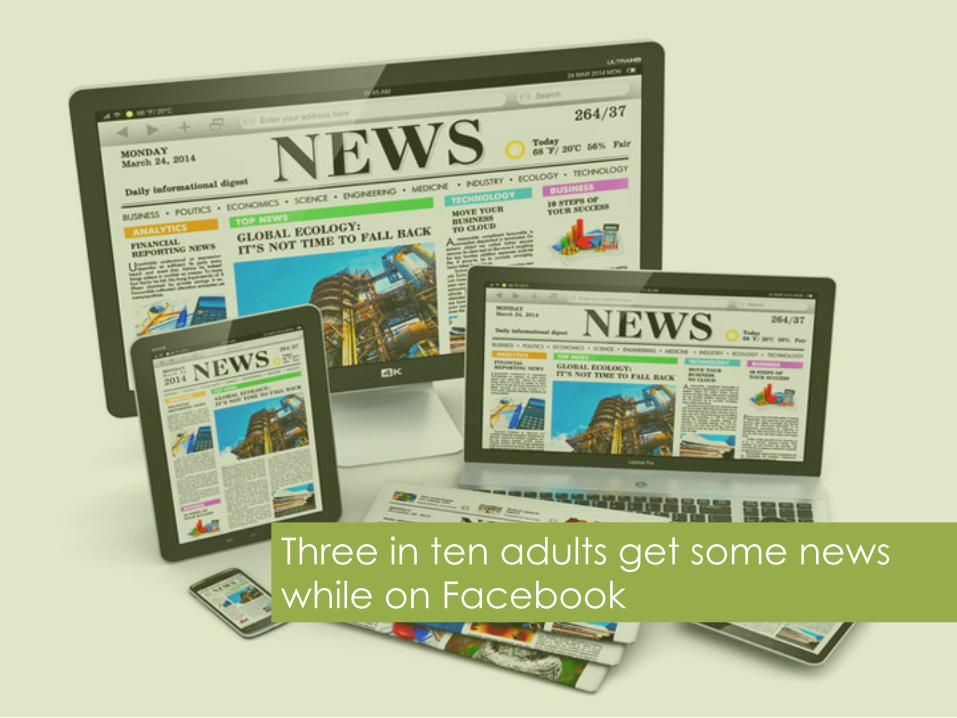
Three in ten adults get some news while on Facebook

LinkedIn news consumers stand out as being high earners and college educated
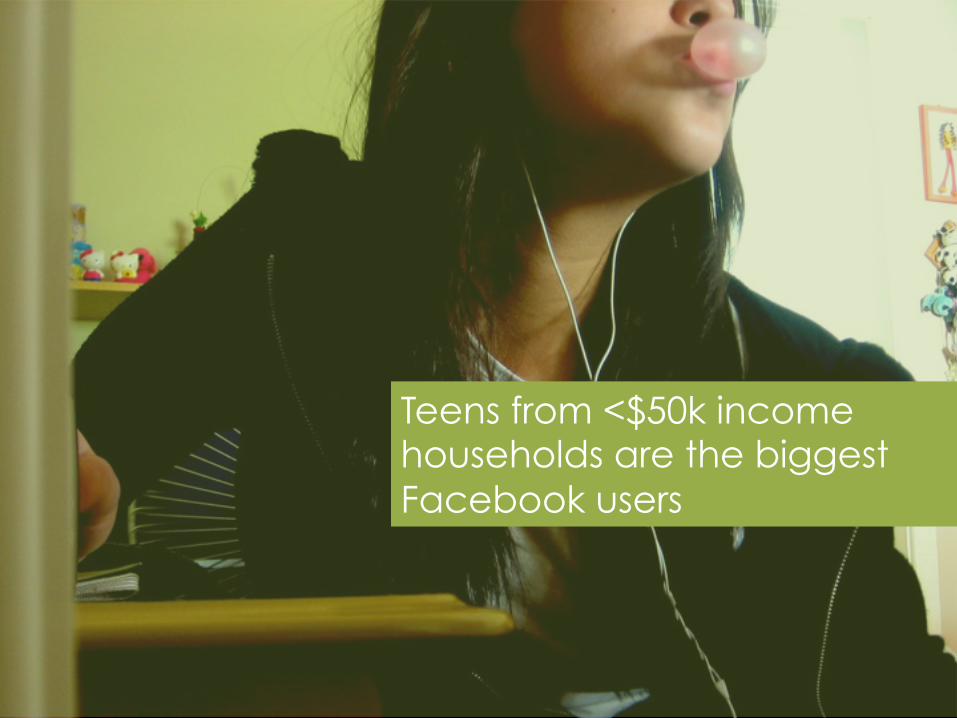
Teens from <$50k income households are the biggest Facebook users

twitter trends
Twitter has 288 million active monthly users
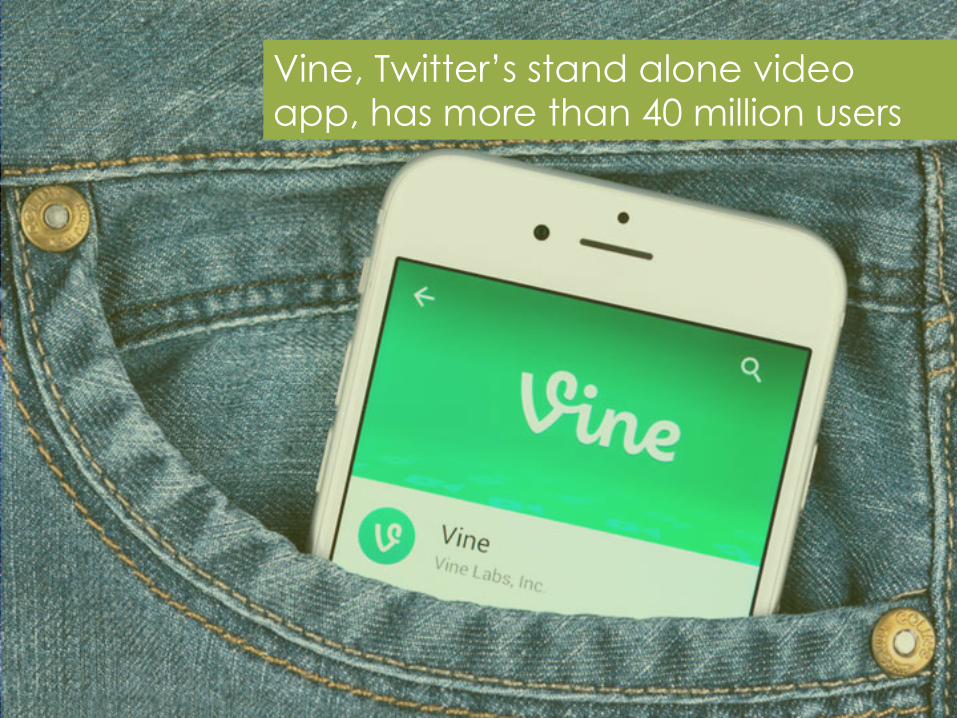
Vine, Twitter’s stand alone video app, has more than 40 million users
500 million Tweets are sent per day

44% of the 974 million existing Twitter accounts have
never sent a tweet
Photo: screenshot twitter.com

77% of Twitter accounts are outside the U.S.
80% of Twitter users are on mobile
39% said Twitter is their new holiday shopping list
visual content trends
300 million user accounts

Over 20 billion photos have been shared on Instagram

70 million photos and videos are uploaded each day to Instagram
47 million U.S. monthly active users estimated in 2015
To hit 50 million in 2016
75.8 million unique visitors on Pinterest as of January 2015
In 2014, Pinterest was valued at $3.8 billion
Photo: craftmehappy.com
The average American Pinterest user spends 1 hour and 17 minutes on the website
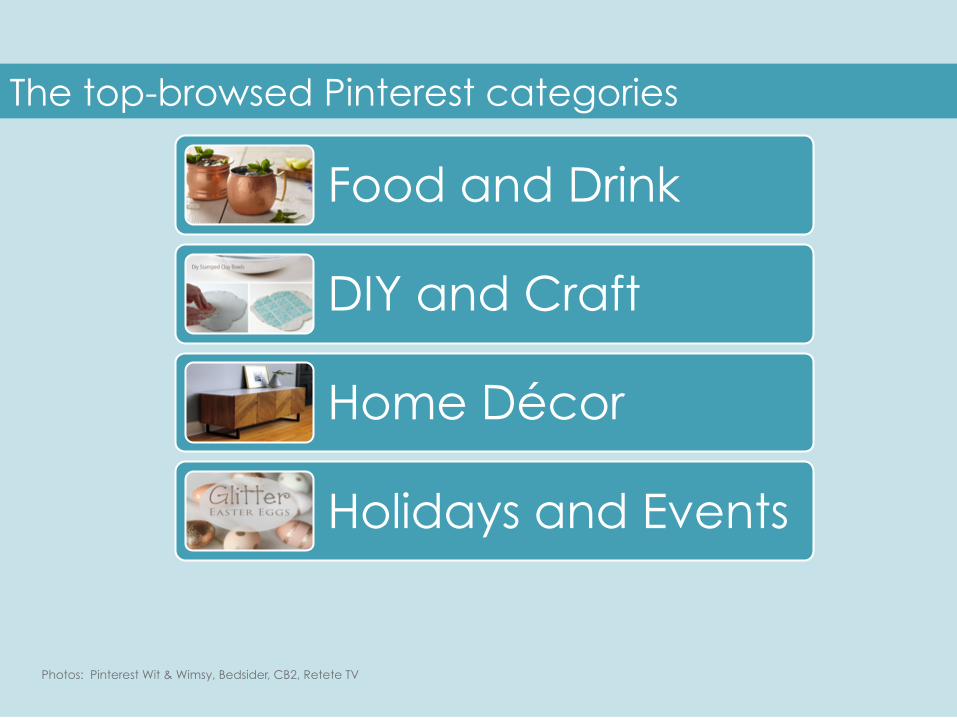
The top-browsed Pinterest categories
Photos: Pinterest Wit & Wimsy, Bedsider, CB2, Retete TV
Food and Drink
DIY and Craft
Home Décor
Holidays and Events

57% of Pinterest users interact with food-related content, the #1 category
Photos: Pinterest users Pop Sugar Fitness, Digital Mom Blog, Miss Me, Barefoot Blonde, SomeeCards, Alyssa and Carla, Emily Namachar
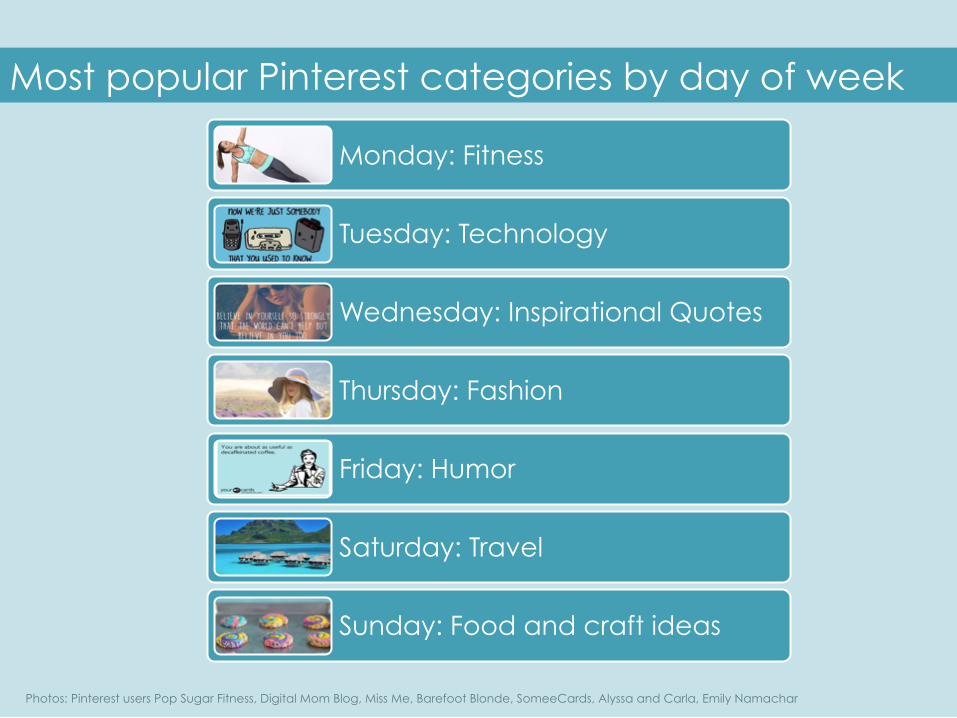
Most popular Pinterest categories by day of week
Monday: Fitness
Tuesday: Technology
Wednesday: Inspirational Quotes
Thursday: Fashion
Friday: Humor
Saturday: Travel
Sunday: Food and craft ideas

69% of Pinterest users have found at least one item that they’ve bought or wanted to buy
Photo: creativeswall.com
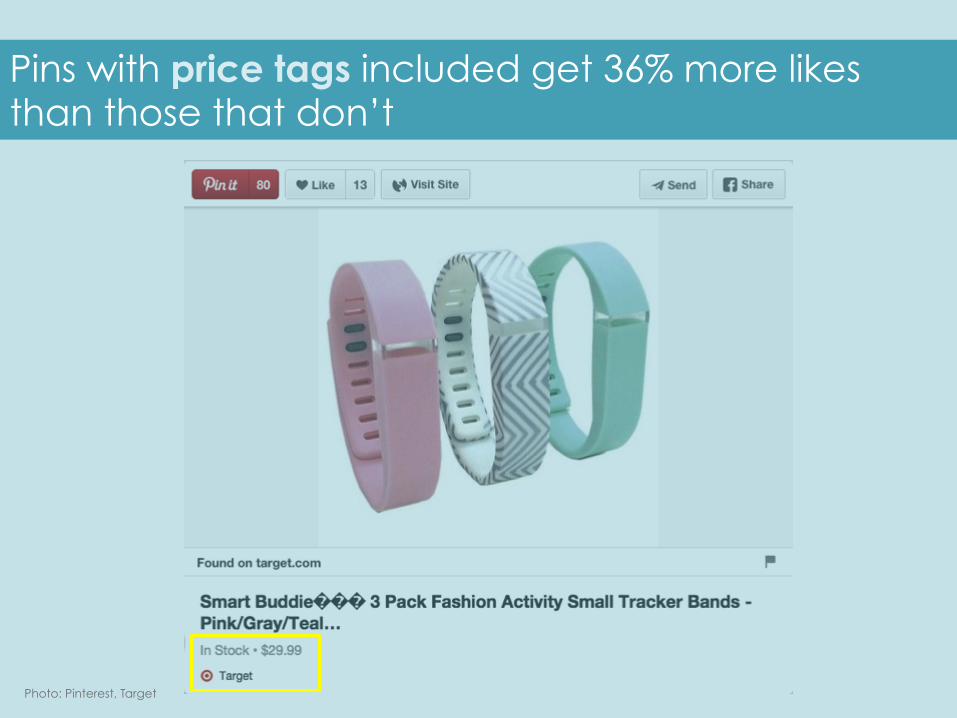
Pins with price tags included get 36% more likes than those that don’t
Photo: Pinterest, Target
snapchat trends
Snapchat has 100 million monthly active users
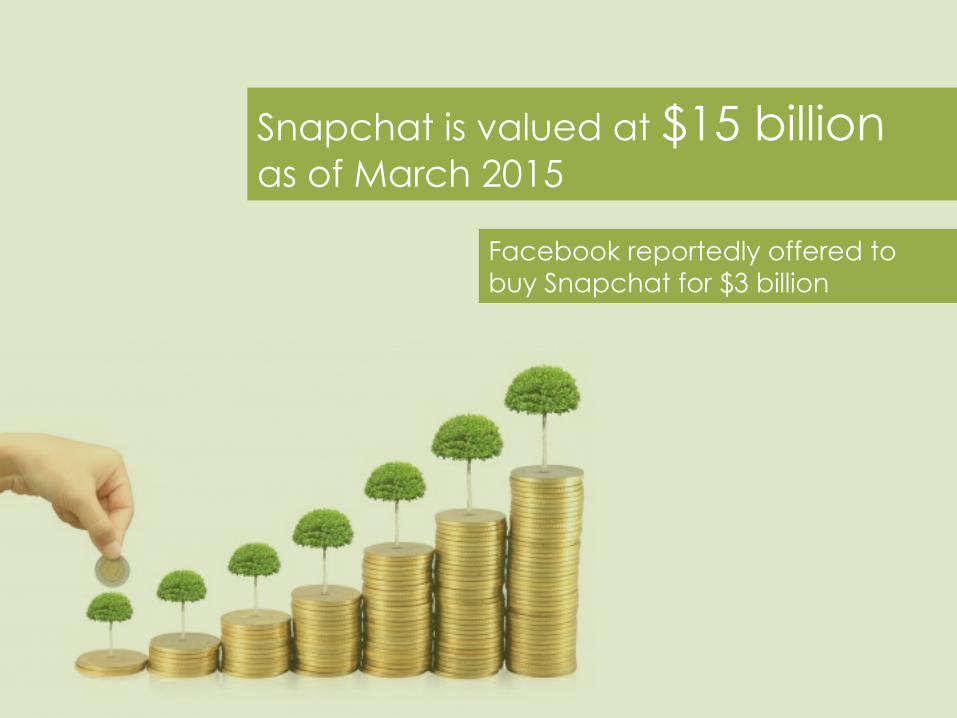
Snapchat is valued at $15 billion as of March 2015
Facebook reportedly offered to buy Snapchat for $3 billion
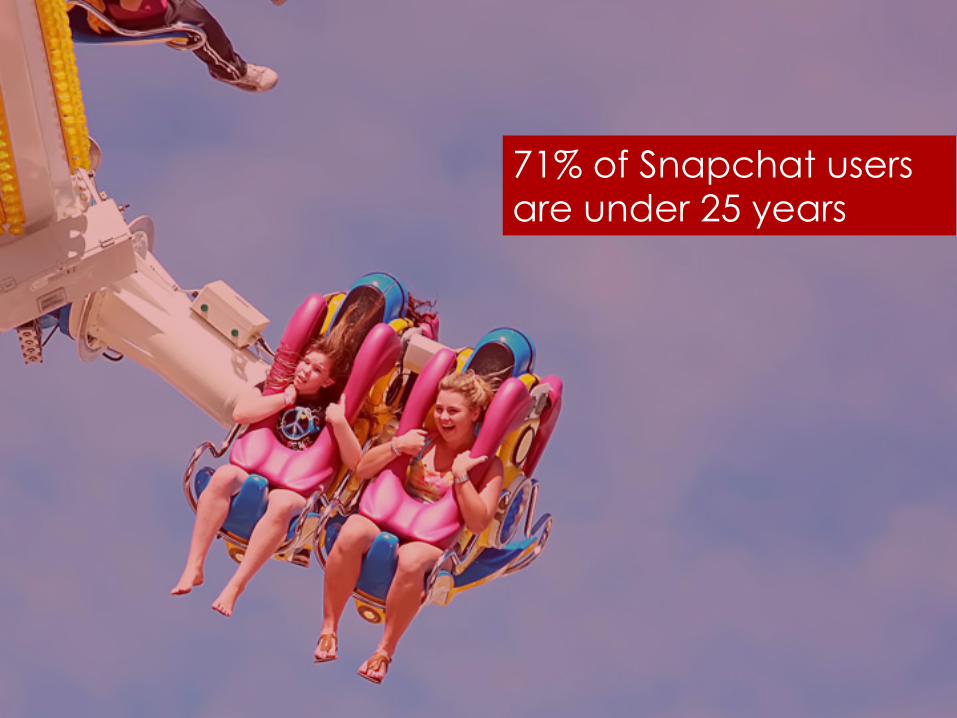
71% of Snapchat users are under 25 years
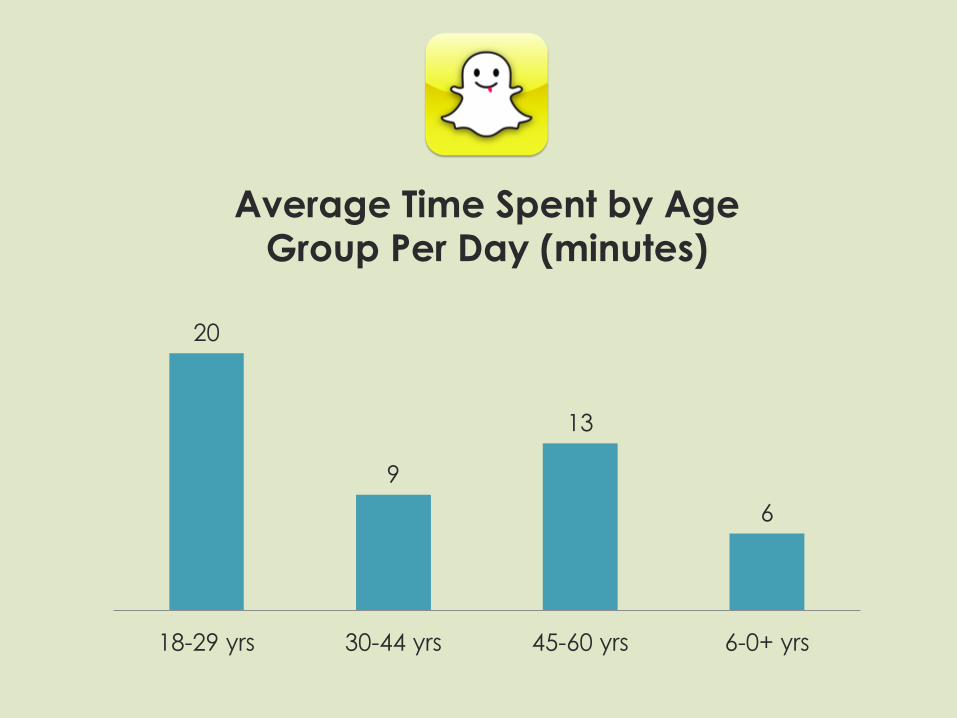
20
9
13
6
18-29 yrs 30-44 yrs 45-60 yrs 6-0+ yrs
Average Time Spent by Age Group Per Day (minutes)
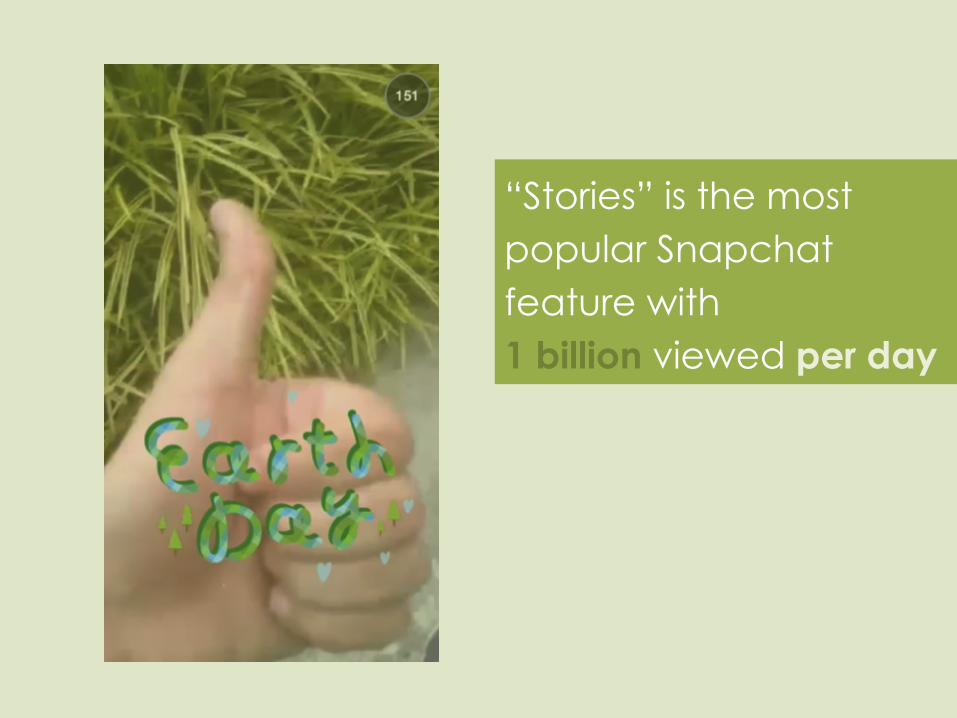
“Stories” is the most popular Snapchat feature with 1 billion viewed per day

5% of social media selfies are shared with Snapchat
of marketers use
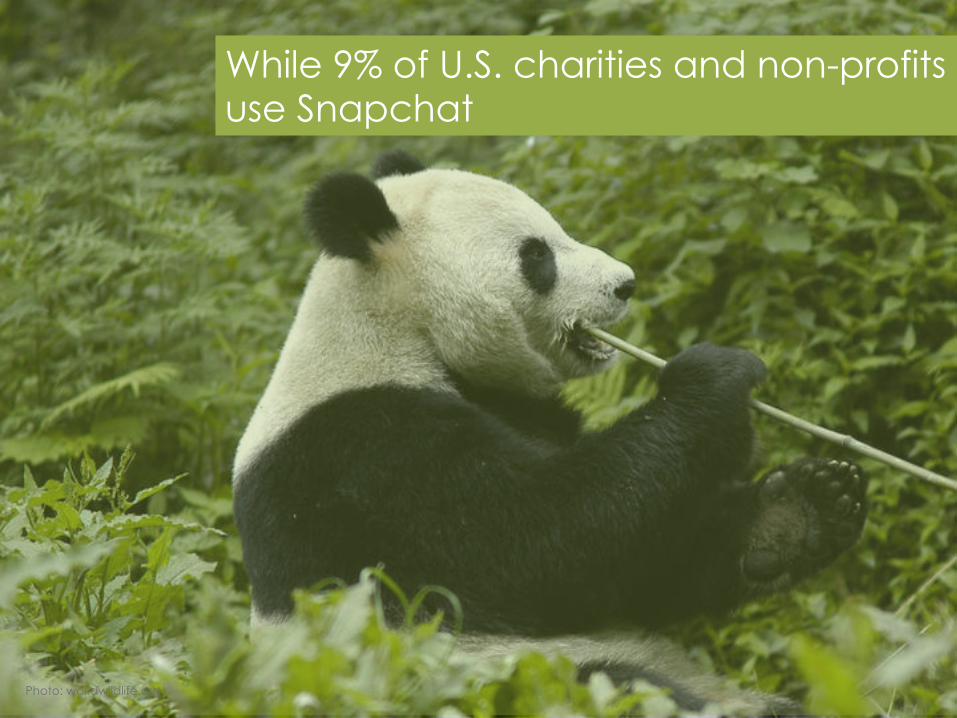
While 9% of U.S. charities and non-profits use Snapchat
Photo: worldwildlife.org
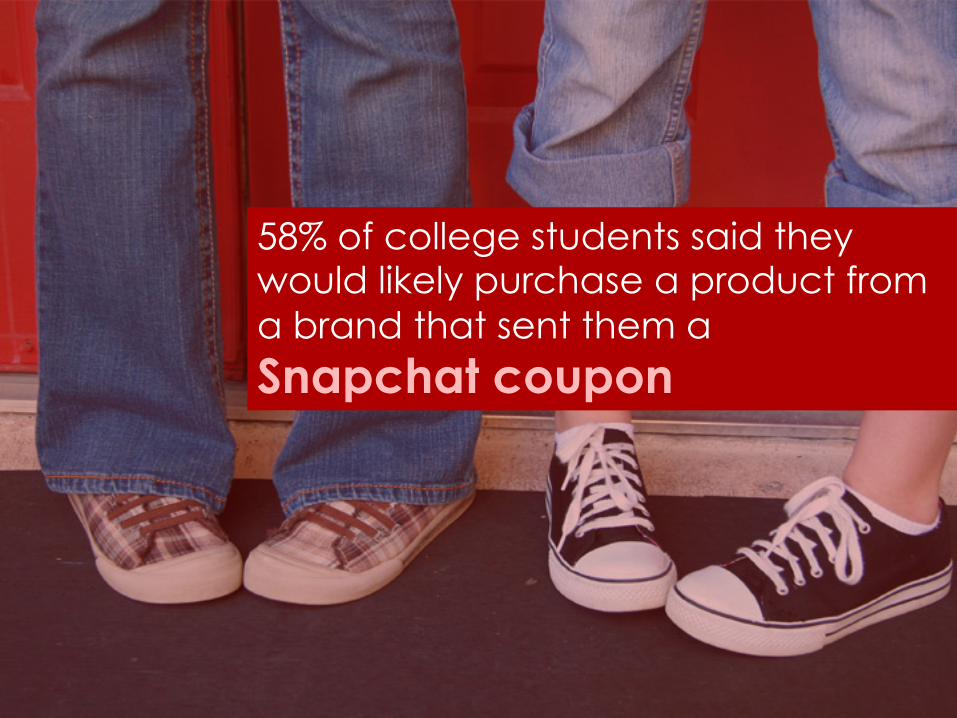
58% of college students said they would likely purchase a product from a brand that sent them a Snapchat coupon
Snapchat stars have reported earning $1,500
per day to $100,000 a week

online video trends
More than 1 billion unique users visit YouTube each month

80% of YouTube traffic comes from outside the US
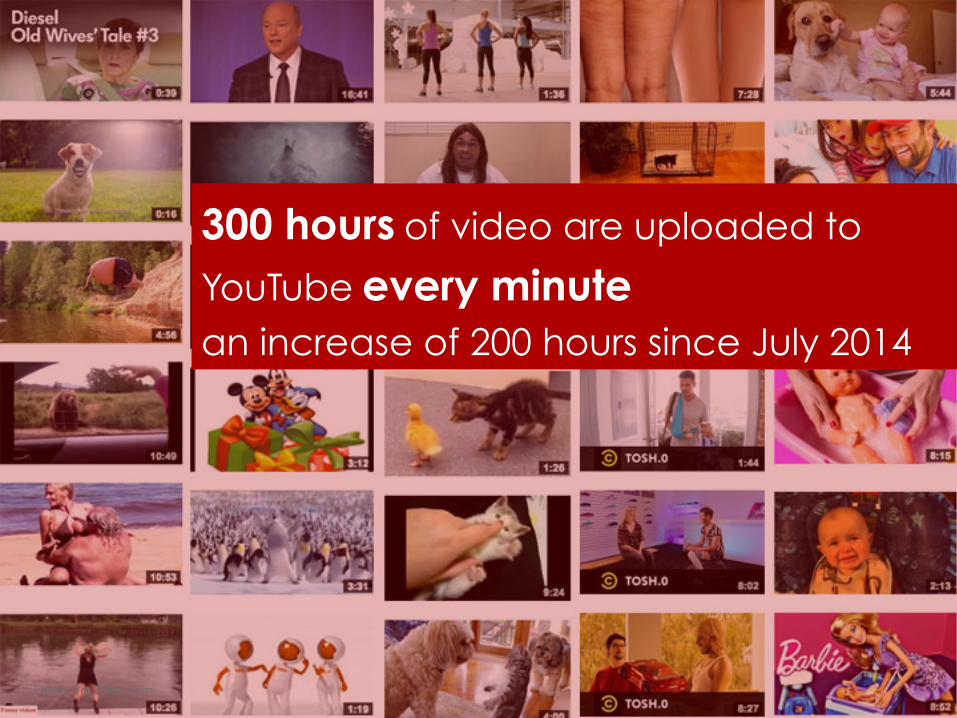
300 hours of video are uploaded to
YouTube every minute
an increase of 200 hours since July 2014
Photo: YouTube.com

Facebook is delivering 4 billion daily views as of Q1 2015 Up from 3 billion views in the previous quarter
YouTube reached 4 billion views daily in 2012, eight months after reaching the 3 billion mark and seven years after launch
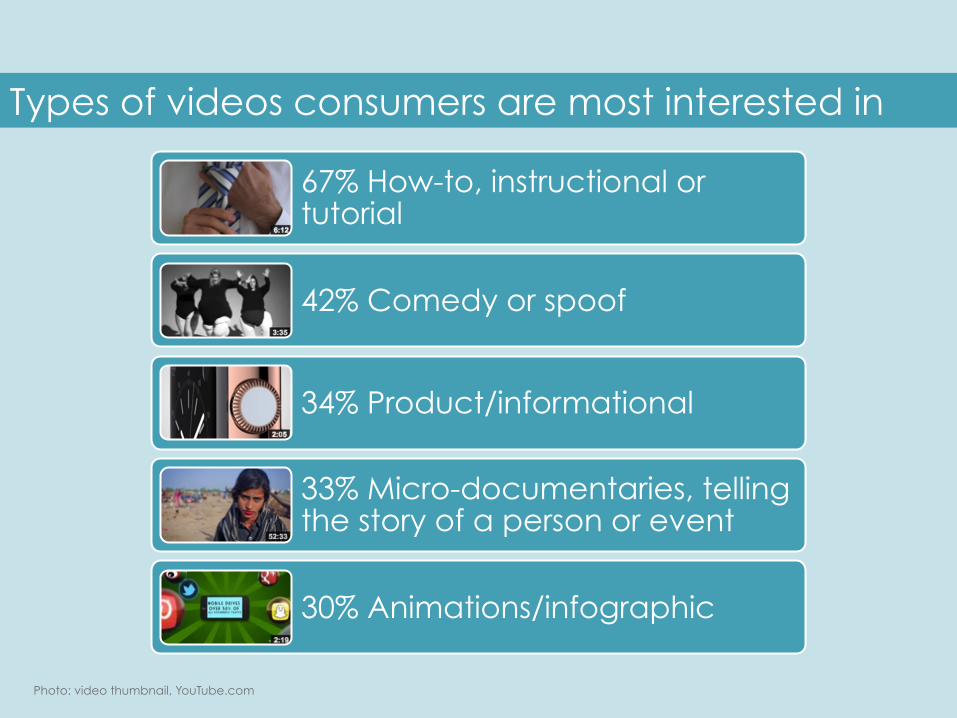
Types of videos consumers are most interested in
67% How-to, instructional or tutorial
42% Comedy or spoof
34% Product/informational
33% Micro-documentaries, telling the story of a person or event
30% Animations/infographic
Photo: video thumbnail, YouTube.com

In 2015, adults in the US will spend an average of 1 hour, 16 minutes each day with video on digital devices while time spent watching TV will
drop 20 minutes
Half of YouTube views are on mobile
Photo: video thumbnail, YouTube.com
Time spent watching video on mobile devices will increase from 30 minutes daily among all US adults in 2014 to 39 minutes per day in 2015
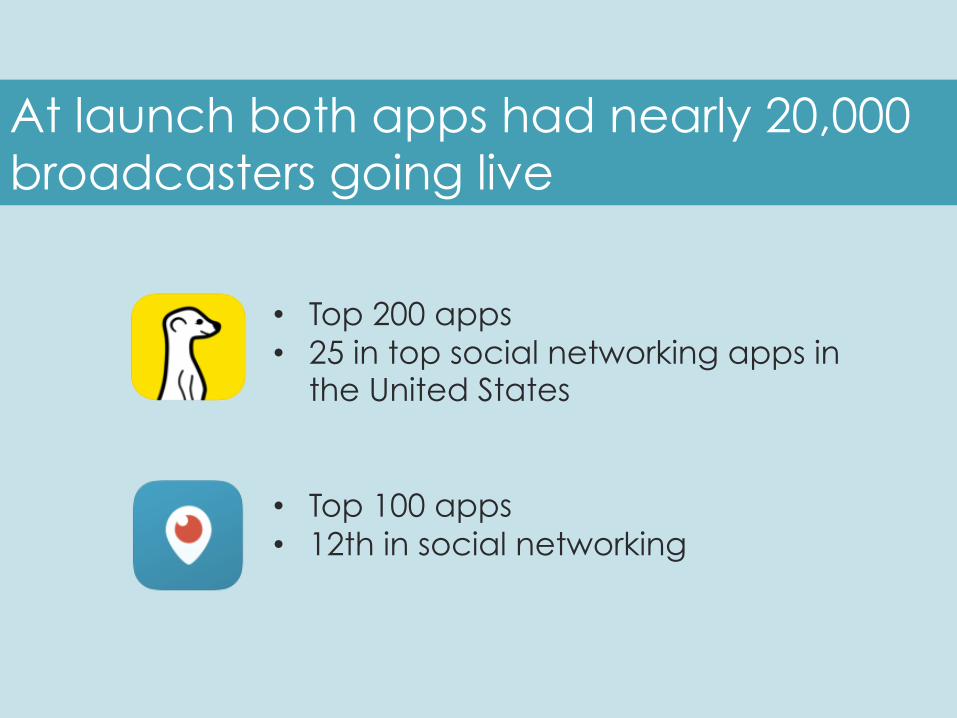
• Top 200 apps • 25 in top social networking apps in
the United States • Top 100 apps • 12th in social networking
At launch both apps had nearly 20,000 broadcasters going live
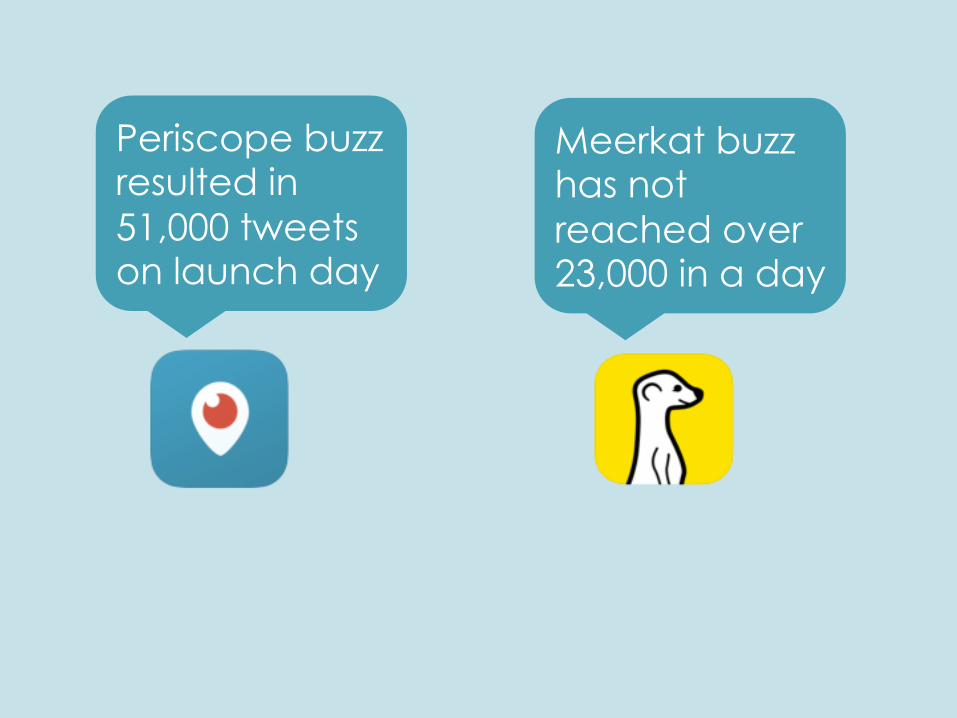
Periscope buzz resulted in 51,000 tweets on launch day
Meerkat buzz has not reached over 23,000 in a day
Mobile video views are up 18% – over 7% the prior year, providing for the first time a quantifiable audience for web video in a non-desktop environment
Visit us for source citations and more useful stats copy/paste url: fandommarketing.com/learning-center/social-media-statistics
HIRE US: fandommarketing.com [email protected]
go


![Social Media Marketing: The Big Six [Mind Blowing Infographic]](https://static.fdocuments.in/doc/165x107/55c55697bb61ebcd358b4741/social-media-marketing-the-big-six-mind-blowing-infographic.jpg)