Social Influence in Prosocial Behavior: Evidence from a ...
56
Social Influence in Prosocial Behavior: Evidence from a Large-Scale Experiment * Lorenz Goette Egon Tripodi First version: January 28, 2019 This version: June 22, 2020 Abstract We propose a novel experiment that prevents social learning, thus allowing us to disentangle the underlying mechanisms of social influence. Subjects observe their peer’s incentives, but not their behavior. We find evidence of conformity: when individuals believe that incentives make others contribute more, they also increase their contributions. Conformity is driven by individuals who feel socially close to their peer. However, when incentives are not expected to raise their peer’s contributions, participants reduce their own contributions. Our data is consistent with an erosion of norm-adherence when prosocial behavior of the social reference is driven by extrinsic motives, and cannot be explained by incentive inequality or altruistic crowding out. These findings show scope for social influence in settings with limited observability and offer insights into the mediators of conformity. Keywords: Prosocial behavior, social influence, online experiment. JEL Classification: C90, D83, D91 * Goette: University of Bonn, Institute for Applied Microeconomics, Adenauerallee 24-42, 53113 Bonn; [email protected]. Tripodi: European University Institute, Department of Economics, Via delle Fontanelle 18, 50014 San Domenico di Fiesole; [email protected]. This project has benefited from several conversations with Michele Belot, Fabian Dvorak, Mathijs Janssen, David K. Levine, Seung-Keun Martinez, Simone Quercia, and Daniel Spiro. We also thank numerous participants of the San Diego Spring School and of the Bologna SEYE workshop, as well as seminar audience in Mel- bourne for useful feedback. We are grateful to Caterina Giannetti and Katharina Janezic for helpful discussions at SEYE and EDP Jamboree. Research funding from the University of Bonn is gratefully acknowledged. Carina Lenze and Luis Wardenbach provided excellent research assistance. All errors remain our own. 1
Transcript of Social Influence in Prosocial Behavior: Evidence from a ...

Social Influence in Prosocial Behavior:
Evidence from a Large-Scale Experiment∗
Lorenz Goette Egon Tripodi
First version: January 28, 2019
This version: June 22, 2020
Abstract
We propose a novel experiment that prevents social learning, thus allowing us
to disentangle the underlying mechanisms of social influence. Subjects observe
their peer’s incentives, but not their behavior. We find evidence of conformity:
when individuals believe that incentives make others contribute more, they also
increase their contributions. Conformity is driven by individuals who feel socially
close to their peer. However, when incentives are not expected to raise their peer’s
contributions, participants reduce their own contributions. Our data is consistent
with an erosion of norm-adherence when prosocial behavior of the social reference
is driven by extrinsic motives, and cannot be explained by incentive inequality or
altruistic crowding out. These findings show scope for social influence in settings
with limited observability and offer insights into the mediators of conformity.
Keywords: Prosocial behavior, social influence, online experiment.
JEL Classification: C90, D83, D91
∗Goette: University of Bonn, Institute for Applied Microeconomics, Adenauerallee 24-42, 53113 Bonn;[email protected]. Tripodi: European University Institute, Department of Economics, Viadelle Fontanelle 18, 50014 San Domenico di Fiesole; [email protected]. This project has benefitedfrom several conversations with Michele Belot, Fabian Dvorak, Mathijs Janssen, David K. Levine,Seung-Keun Martinez, Simone Quercia, and Daniel Spiro. We also thank numerous participants ofthe San Diego Spring School and of the Bologna SEYE workshop, as well as seminar audience in Mel-bourne for useful feedback. We are grateful to Caterina Giannetti and Katharina Janezic for helpfuldiscussions at SEYE and EDP Jamboree. Research funding from the University of Bonn is gratefullyacknowledged. Carina Lenze and Luis Wardenbach provided excellent research assistance. All errorsremain our own.
1

1. Introduction
The increasing social connectivity of modern times fosters opportunities for social in-
teractions and comparisons with others. A growing literature illustrates how informa-
tion and cues about the behavior of others can induce social influence: the effect of
others’ actions on individual behavior. Social influence plays an important role across
a broad range of domains that includes charitable giving (Frey and Meier, 2004), finan-
cial decision making (Bursztyn et al., 2014), marketing (Bapna and Umyarov, 2015),
political participation (Cantoni et al., 2017), tax evasion (Drago et al., 2020), and well-
being (Aral and Nicolaides, 2017). While in most social influence studies individuals
observe others’ behavior, various models (e.g. Bernheim, 1994; Akerlof, 1997) explain
the spread of social influence even for unobservable behavior via conformity. Isolat-
ing this behavioral mechanism requires ruling out the learning opportunities derived
from observing the actions of others.
In this paper, we study social influence in prosocial behavior through conformity, i.e.
when actions are not directly observable. Social influence makes actions of connected
agents interdependent, but such interdependencies are often ignored in standard mod-
els of prosocial behavior.1 We examine how information about others’ environments
generates social influence. We intentionally shut out observability. This allows us to
disentangle the mechanisms of social influence and to assess the scope of social influ-
ence in applications where information about the behavior of others is harder to access
compared to information about the constraints, incentives or institutions that others
face.
We analyze social influence through a conceptual framework and an experimental
design focused on a notion of conformity that is due to identification with a peer and
her motives. When individuals encounter someone doing good out of intrinsic mo-
tives, they are inspired (or compelled) to conform to this behavior, and deviating cre-
ates a psychological cost. Given this preference, agents use the economic environment
to infer intentions of the social reference and attempt to conform to their behavior even
1Much of the theoretical literature models prosocial behavior and public good contributions as gamesof strategic substitutes. The most prominent examples of such theories are represented by models ofpure altruism (Becker, 1974) and impure altruism (Andreoni, 1989, 1990).
2

when this is not observable.
In a large-scale online experiment, 2,914 individuals engage in pairwise interactions
before they independently take part in a real effort donation task. The two main out-
comes of interest are (i) the amount of charitable donations individually generated
through the donation task and (ii) expectations of the amount generated by the other
player within the pair. In our experiment, individuals can generate donations to a
charity through a tedious physical task. We experimentally manipulate private incen-
tives for making donation: for each player in a pair, we cross-randomize one of three
levels of piece-rate (zero, moderate, and high) private incentives to generate donations
for Médecins Sans Frontières. Variation in the incentives of the other player in the pair
allows us to uncover social influence among peers: if an agent cares to conform, an in-
crease in her peer’s incentives will have both a direct effect on her peer’s donations and
an indirect effect on the agent’s donations as she tries to minimize distance with the
actions of her peer. We can then identify the social influence effects of peer incentives
and evaluate different behavioral motives by estimating the contemporaneous effect
of peer incentives on both expectations—about donations of the peer—and donations
of the agent whose incentives are held constant. Before the treatment manipulation,
pairs of subjects participate in a joint problem solving task, which we adopt to induce
social proximity between paired players (Chen and Li, 2009; Chen and Chen, 2011)
and increase relevance of the peer as a social reference. After that, we elicit a survey
measure of social proximity (Cialdini et al., 1997), which we use to investigate how
social proximity determines propagation of social influence.
We find evidence of social influence in donations: when the peer’s incentives in-
crease from zero to moderate, subjects expect their peer to increase donations and in
turn, they donate more themselves. These effects are entirely driven by subjects who
exhibit a close social connection to their peer, for whom the effect of increasing the
peer’s incentives from zero to moderate on donations is as large as half the effect of in-
creasing their own private incentives from zero to moderate. However, when the peer’s
incentives further increase from moderate to high, we find a different result: individ-
uals correctly expect their peer’s donations to not be affected by higher incentives,
and they themselves donate less when their peer has high incentives. Thus, individual
3

donations respond non-monotonically to peer’s incentives. These effects are, again,
entirely driven by the subsample of individuals who feel socially close to their peer.
For individuals who do not feel close to their peer, we cannot reject the null of no social
influence.
We propose a mechanism related to Fuster and Meier (2009), and argue that the
strength of the desire to conform depends on whether the peer engages in the behavior
for non-selfish reasons. Higher incentives for the peer can thus have an ambiguous
effect on behavior. If incentives are "too generous", the peer’s behavior may no longer
be viewed as non-selfish, and the desire to conform weakens. Thus, individuals may
well reduce effort in response to higher incentives for their peer. We formalize this
intuition in a model and show that non-monotonicities as observed in our experiment
can be generated in a simple version of the model.
One might suspect that higher peer incentives reduce an individual’s contributions
due to substitution effects from models of impure altruism. However, for such substi-
tution to occur, it needs to be the case where the individual expects a higher contribu-
tion from her peer. In our setting, this is clearly not the case.
Differences in incentives between individuals may also give rise to incentive-inequality
effects described in Breza et al. (2017). Incentive inequality in that sense predicts that,
conditional on own incentives, donations decrease with the difference in incentives to
the peer. Thus, they predict a monotonicity with regard to that gap. However, our
non-monotonicities arise for all levels of own incentives. In most of these cases, incen-
tive inequality would predict the opposite pattern. We develop a formal test and can
reject that incentive inequality explains the pattern we find.
Our work broadly contributes to the large literature in economics and psychology
that has studied empirically whether social information can produce social influence
on prosocial behavior, both in the lab (Cason and Mui, 1998; Bohnet and Zeckhauser,
2004; Eckel and Wilson, 2007; Krupka and Weber, 2009; Servátka, 2009; Duffy and Ko-
rnienko, 2010; Bigenho and Martinez, 2019) and in the field (Frey and Meier, 2004;
Shang and Croson, 2009; Chen et al., 2010; Fellner et al., 2013; Cantoni et al., 2017;
Bruhin et al., 2020). Our main contribution to this literature is to show that observing
the behavior of others is not necessary for people to be subject to social influence. In
4

fact, they will attempt to infer how others behave and conform to that behavior.
We also contribute to a growing literature that tries to disentangle the mechanisms
of social influence. While we are not the first that try to separately identify social learn-
ing from conformity (Bursztyn et al., 2014; Lahno and Serra-Garcia, 2015; Gilchrist and
Sands, 2016), our experiment is, to the best of our knowledge, the first with a focus on
conformity in an environment that entirely removes any opportunity for social learn-
ing. Moreover, compared to these papers, we are the first to study conformity in the
prosocial domain: Bursztyn et al. (2014) investigate social learning and the shared
experience of holding an asset as distinct mechanisms of peer effects in financial de-
cisions; Lahno and Serra-Garcia (2015) isolate conformity in lottery choice through a
decision environment stripped down of complexity to minimize the scope for social
learning; Gilchrist and Sands (2016) use weather instruments to estimate the effect of
cumulative movie viewership on the probability of going to watch a movie and run
various robustness checks to rule out social learning about quality of the movie.
Our findings have implications for a large literature on social influence and incen-
tives for charitable giving and volunteering (e.g. Eckel and Grossman, 2003; Landry
et al., 2006; Huck et al., 2015; Meer, 2017; Perez-Truglia and Cruces, 2017), furthering
our understanding of the forces that modulate the channels of social influence. It en-
riches the literature on the damaging role of incentives on norm-adherence (Gneezy
and Rustichini, 2000a,b; Fuster and Meier, 2009), by demonstrating a more nuanced
role of incentives. Furthermore, we add, to an empirical literature on the role of so-
cial proximity in social influence mediated by social information (see e.g. Topa, 2001;
Leider et al., 2009; Bond et al., 2012; Dimant, 2018), evidence that social proximity
also modulates social influence in the absence of social information. This evidence is
important because it shows that social proximity matters even when benefits of (and
opportunities to punish in) future interactions are absent.
Most closely related to ours is the work of Kessler (2017), who provides field and lab-
oratory evidence that public endorsement of peers to a charitable cause can produce
large complementarities in giving even when the actual amount of money donated
is not observable. He proposes social learning and conformity as primary behavioral
channels to explain such findings. Our work complements this paper in two important
5

ways: First, Kessler (2017) shows that endorsements affect beliefs about the quality of
a charity and others’ donations. Our experiment is designed to hold constant beliefs
about the quality of the charity to make a first attempt at separately identifying confor-
mity from social learning in the prosocial domain. Second, we use a novel approach to
identify social influence based on private incentives to donate in newly-formed social
bonds. This allows us to learn new lessons about the interaction between prosocial
motivations, social proximity and conformity.
The remainder of this paper is organised as follows. section 2 presents the experi-
mental design and predictions. section 3 illustrates the results and discusses mecha-
nisms of social influence. section 4 concludes.
2. The Experimental Setup
2.1. Experimental Design
We conduct an online experiment with registered workers from Amazon Mechanical
Turk. The study develops over five stages, featuring a full 3 × 3 between-subject de-
sign plus an additional control treatment. All subjects in the experiment are randomly
grouped into pairs. Prior to learning about the main experimental task, subjects make
contact with the other player in the pair. Pairs are formed after Registration, and the
first three stages are common to all pairs. In the fourth stage, each pair is randomly
assigned to one of ten treatments. The experiment concludes with a short survey and
review of the payoffs. We present each stage in detail below.2
1. Registration. Invited subjects accept the general conditions for participating in the
experiment before accessing the software interface. The study begins with general in-
structions that outline the key stages of the experiment: subjects are informed that they
will be randomly paired with another player with whom they will jointly complete the
first task, followed by the second task to be completed independently. After reading
the initial set of instructions, each subject chooses a number from 1 to 6, which they are
told will matter for the variable component of their pay at the end of the experiment.
We introduce tokens as the experimental currency. This stage is concluded by a short
2Full experimental instructions can be found in the supplemental material, Appendix C.
6

survey to collect demographic information (i.e. name, gender, age, and experience
on Amazon Mechanical Turk), which subjects are told will only be shared with their
peer.3
2. Joint problem solving task. As subjects progress to this stage of the experiment,
pairs are formed at random and subjects are introduced to their peer: they are pre-
sented with the demographic information of their peer (i.e. stated name, gender, age,
country of residence, and experience on Amazon Mechanical Turk) on their computer
screen. 4 All our subjects are residents in the United States.
Similar to Chen and Li (2009), we use a joint problem solving task to favor the for-
mation of a social connection between paired players. In this task, pairs of players
see the same four famous paintings. For each painting, subjects are incentivized to
identify – in coordination with their peer – the corresponding artist from a list of five:
each subject in the pair earns 20 tokens each time both players give the correct artist
for the same painting.5 Paired players can solve the task through a private online chat
(see interface in Figure B.3). We differ from Chen and Li (2009) by making rewards de-
pendent on both own and peer’s answers to increase incentives for establishing social
contact. Payoffs are revealed at the end of the experiment.
3. Oneness elicitation. We measure social proximity with the oneness scale. There are
two main reasons why this is a natural choice for the study: The oneness scale has been
found to explain social proximity for dyadic relationships relatively well in compar-
ison to more involved questionnaire-based scales from social psychology (Gächter et
al., 2015), and it is fast and simple to administer (see Figure B.4). The oneness scale
was first proposed by Cialdini et al. (1997) as a simple mean of two underlying scores:
(i) the Inclusion of Other in the Self (IOS) scale and the (ii) WE scale. The IOS scale
(Aron et al., 1992) is an easy-to-administer pictorial measure of social proximity be-
tween the research subject and a related person, constructed by simply asking subjects
to indicate which of seven diagrams, composed of two increasingly overlapping cir-
cles, best represents their connection to the related person of interest. Cialdini et al.
3We cannot verify that this information is truthfully provided. We ask people to provide a name tofacilitate interactions, but we did not expect players to recognize the peer as acquaintance/friend. Chatscripts provide no evidence of pre-existing relationships among paired participants.4The order of arrival to this page constitutes our random matching protocol.5We make the task hard by listing possible artists from relatively similar epoch and style.
7

(1997) later proposed to integrate the IOS scale with the WE scale, which asks subjects
to express the extent to which they would refer to themselves and another person of
interest as we, to capture complementary aspects of group membership embedded in
social relationships. Both scales are elicited without incentives.
4. Donation task. For this task, subjects have to decide how many donations to gen-
erate for charity and make a point prediction about the number of donations their
peer will generate. We treat such point prediction as proxy of beliefs of peer’s giving.6
To limit the scope of anchoring effects, we elicit expectations and desired number of
donations simultaneously. After recording the two variables, subjects carry out the
real effort task that generates these donations. Each donation requires entering 100
sequences of keystroke combinations “w”-“e” on a computer keyboard.7
Prior to eliciting beliefs and donations, subjects go through a small training exercise
to familiarize themselves with the real effort task, and this allows us to screen out
subjects who are unable to solve the task. Thereafter, the software randomly assigns
pairs of subjects to one of the ten different treatments.
Our experimental treatment manipulations simultaneously vary incentives to be-
have prosocially for both subjects in a pair. To make it very clear that variation in
monetary incentives is random and independent between peers, all players in the
nine incentivized treatment conditions are provided with ex-ante identical lottery in-
centives. This is also important for ensuring that different incentives could not be
viewed as a signal for the importance of the task (Ellingsen and Johannesson, 2008).
Subjects earn 50 tokens for each donation generated if the number picked in stage 1
matches the roll of a fair die. Across incentivized treatments, we vary the expected
stakes of monetary incentives for each player by means of a simple information de-
vice. The device randomly determines whether to disclose if the matching die has a
face number between the largest three or the smallest three figures of a die. When
this signal is provided, depending on the initial number chosen, this either reduces to
6For practical reasons we do not elicit the entire belief distribution, but instead use a measure that mostlikely captures the perceived mode of giving of the peer. To limit the scope for motivated reasoning, weincentivize correct predictions with a 20 tokens prize.7We choose a sterile task to limit the scope for confounding factors. A similar task has been used in otherexperiments studying incentives for charitable giving (Ariely et al., 2009; Meyer and Tripodi, 2017), andeffort provision (DellaVigna and Pope, 2016, 2017).
8

zero the chances of getting the piece-rate incentive to generate donations (incentives
are zero), or it increase chances to 1 in 3 (incentives are high). When this signal is not
provided, the probability of getting the piece-rate incentive for generating donations
is not updated and remains 1 in 6 (incentives are moderate).8 To make incentives com-
mon knowledge within each pair, we reveal to subjects their peer’s signal and initial
chosen number. We also make sure that subjects understand both their own and peer’s
incentives by (i) framing as "lucky" ("unlucky") the die roll when incentives are high
(zero) and (ii) directly providing them with the updated probabilities of receiving the
piece-rate to generate donations (see Figure B.5 for an example). This information rev-
elation scheme produces variation in the magnitude of expected incentives for acting
prosocially, for both player i and peer j of each pair, in a full 3× 3 between-subject
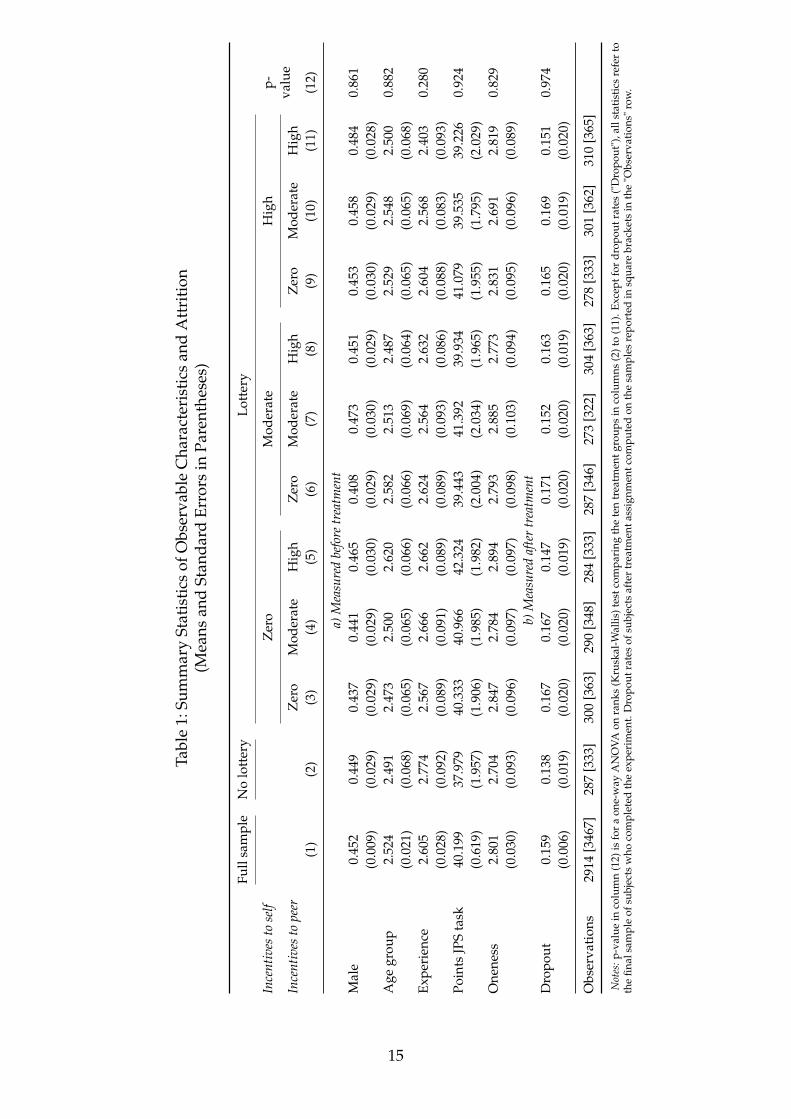
design. We enrich this design with a control no lottery condition. Figure 1 schematizes
the experimental design.
5. Exit. In the final stage, subjects answer some unincentivized questions to check
comprehension. The summary of individual payoffs concludes the experiment.
Completed registration,joint problem solving,and oneness elicitation
No lottery controlT10
Incentives to peerLottery treatments Zero Moderate High
T1-T9 Pj = 0 Pj =16 Pj =
13
ZeroT1 T2 T3
Incentives to selfPi = 0
ModerateT4 T5 T6
Pi =16
HighT7 T8 T9
Pi =13
Figure 1: Overview of Experimental Design and Treatment Assignment
8We prefer this probabilistic approach over randomizing a deterministic piece rate to reduce disap-pointment in pairs where one subject receives no incentive and her peer receives high incentives. Themain disadvantage is that it potentially introduces subjective evaluations of probabilities (see e.g. page637 of DellaVigna, 2018, for a discussion of the mixed evidence on probability weighting in real effortexperiments). However, this approach has the great advantage that, by reducing disappointment, ithelps avoid differential attrition across treatments.
9

2.2. Conceptual Framework and Predictions
To formalize our strategy for identifying social influence, consider the following sim-
ple model of prosocial behavior. Two agents a = {i, j} are presented with the oppor-
tunity to choose a donation effort da. There are four components to their utility: do-
nations create at a monotonically increasing and convex private cost c(da). Personal
benefit from donations is a heterogeneous altruism component va per unit of d, dis-
tributed according to c.d.f F(va) in the population, and a monetary benefit m. Agents
have a preference (or feel pressured) to conform to their peer. We follow Sliwka (2007)
in assuming that people conform to the natural behavior of their peer dnj , which is j’s
behavior absent pressures to conform.9 That preference is captured by a loss function
κi, j(·) that is convex, monotonically increasing in the absolute distance between di and
the expected dnj (because there is heterogeneity in v j). 10 We write the utility of agent i
from contributing di as:
U(di|mi,m j) = (vi +mi)di− c(di)−κi, j(|di−E(dnj |A j(m j)|) (2.1)
where E(dnj |A j(m j)) = Ev j
(argmax
d j
(v j +m j)d j− c(d j)|v j ∈ A j(m j)). We use this model
to understand contributions to large charities, for which changes of a few dollars in
aggregate donations are the proverbial drop in the ocean. Hence we consider a model
in which the marginal altruistic utility from donating to the charity is constant, but the
model can certainly be extended to allow for decreasing marginal returns.11
The key feature of our model is the function κi, j(·). It combines the standard forces
of conformism (Akerlof, 1997; Bernheim, 1994) with the innovation that the strength
of conformity depends on how normatively “attractive” the role played by the peer
is (Kelman, 1961). A role is normatively attractive if an agent desires to identify with
it. We model this by assuming that an individual’s cost from deviating depends on
9This formulation shuts out second-order strategic effects. It considerably simplifies the analysis, as itturns the solution into a maximization problem.
10We also normalize κi, j(0) = 0.11In the appendix, we consider a model of impure altruism with diminishing marginal utility. We showthat it predicts that an agent’s donation are globally declining in her peer’s incentives.
10

whether her peer engaged in the behavior for non-selfish reasons. We specify this as
κi, j(|di−E(dnj |A j(m j)|) =−
λi, j
2Pr(A j(m j))(di−E(dn
j |A j(m j)))2
with A j(m j) = {v j ∈ V : c(dnj )/dn
j > m j}. Thus, the set A j(m j) represents all agents for
whom choosing da given the monetary incentive m j does not cover their cost of effort.
The more non-selfish types there are, the stronger the conformism the individual feels
towards that behavior. The parameter λi, j ≥ 0 measures the importance of conformity
costs relative to the marginal utility of money, and may vary between individuals de-
pending on how socially close they feel to each other (Bond et al., 2012; Gioia, 2017).
For the case of quadratic costs c(d), it is easy to show that Pr(A j) = 1−F(m j), i.e.
the fraction of non-selfish types is the density to the right of m j in the distribution of
altruism parameters F(va).12 In this case, the objective function simplifies to
U(di|mi,m j) = (vi +mi)di−cd2
i2−
λi, j
2(1−F(m j))(di−E(dn
j |m j))2 (2.2)
This yields the first-order condition that implicitly defines the optimal di
di =vi +mi +λi, j(1−F(m j))(di−E(dn
j |m j))
c(2.3)
The equation illustrates how changes in m j act through two channels on the individ-
ual’s optimal behavior. The "traditional" conformism effect (Akerlof, 1997; Bernheim,
1994) acts through E(dnj |m j): higher incentives to j increase the normal effort dn
j and
thus act to increase d j in equation (2.3). The second channel acts through composi-
tion effects: higher m j reduces the fraction of individuals 1−F(m j) who engage in
the behavior for non-selfish reasons in equilibrium. Thus, while the traditional con-
formism channel is unambiguously positive, the second channel acts against this and
can overturn the sign of the overall effect.
In Figure 2, we illustrate the predictions of this model when v ∼ U [0,1] at varying
levels of the private benefits to contribute vi +mi. The left panel shows how j’s incen-
tives m j have positive effects on i’s donations when incentives are low; these effects are
12Because quadratic costs imply dnj =
v j+m jc , it follows that Pr(A j) := Pr(c(dn
j )/dnj > m j) = Pr
( v j+m j2 > m j
).
11

decreasing in j’s incentives and tend to become negative when m j becomes large rela-
tive to vi +mi. When incentives are sufficiently large that the set of agents who engage
in the prosocial activity out of altruism is empty, agents feel no need to conform and
changes in m j have no effect on di. These patterns translate into the non-monotonic
relationship between m j and di that is illustrated in the right panel of the figure.
Note: The left panel graphs the marginal effects of increasing the peer’s incentives (m j) on the agent’sdonations (di) at different levels of the agent’s private benefit to donate (vi +mi). The right panelgraphs the agent’s donations (di) as a function of her own private benefits to donate (vi +mi) and thepeer’s incentives (m j).
Figure 2: Own donations as a function of own and peer’s monetary incentives
In Appendix A.1, we study the model in a more general setting and show that for
a general distribution of types F(v) and a large set of cost functions, with constant
elasticity of effort k ≤ 1, there exists a threshold for m̃ j above which i becomes unre-
sponsive to changes in the incentives of her peer.
This theoretical framework offers two approaches to identify conformity through
incentives. The first, less data demanding, hinges on estimating the indirect effect of
changes in j’s incentives to donate on i’s donation behavior: conformity predicts that
an increase in j’s incentives should increase i’s donations. The second, identifies the
strategic complementarities of conformity by considering the effect of changes in j’s
incentives on both i’s expectations about j’s donations and i’s donations: if donations
are affected by conformity, changes in j’s incentives shift both i’s beliefs about j’s
donations and i’s donations in the same direction.
The framework also provides an explanation for why not all actions of a social ref-
erence may lead to conformity in the same way. Much like in theories of prosocial
12

behavior with incentives, e.g. for social signaling (Benabou and Tirole, 2006) and peer
punishment (Dutta et al., 2018), the extent to which agents wish to adhere to the be-
havior of a social reference can be endogenous to incentives. Our experimental design
allows us to separate conformity from these alternative explanations, to be discussed
in section 3.4.
2.3. Procedures
To uncover the role and determinants of the conformity channel of social influence,
we conduct six sessions of the experiment in 2017, between July 30 and August 4,
recruiting 3,467 subjects on Amazon Mechanical Turk.13 This is an online platform
that is becoming increasingly popular for conducting economic experiments (DellaVi-
gna and Pope, 2016) where thousands of registered workers are commonly employed
in tasks that require human intelligence. Compared to lab subjects, workers on this
platform are more heterogeneous in terms of socio-economic characteristics and have
been found to exert more attention to experimental instructions (Hauser and Schwarz,
2016).14 In our experiment, subjects that complete the study earn 1.20 USD partici-
pation fee plus bonus pay depending on their behavior during the experiment. To-
kens constitute the experimental currency at the exchange rate of 1 token=0.005 USD.
Completing the experiment took participants 17 minutes and 4 seconds on average.
Including participation fee, on average, subjects earned 1.63 USD for themselves, and
generated 1.13 USD donations for the charity of our choice – Médecins Sans Frontières.
For subjects that do not spend time on the donation task, the experiment only took 10
minutes and 33 seconds; these subjects earned 1.34 USD, including participation fee,
on average. Such average earnings are comparable to the 7.25 USD hourly earnings
accumulated by the most productive 4% of workers on this platform and are signifi-
cantly higher than the median hourly earnings of 2 USD (Hara et al., 2018). Participa-
tion in the experiment is allowed only once, and no retakes are granted to subjects that
13The experimental software is programmed in oTree (Chen et al., 2016). We collect data over multiplesessions to minimize risks of overloading our server.
14Like other studies conducted on this platform, we restrict participation in our experiment to workerswith an approval rate above 90%. We also restrict participation to workers residing in the U.S.
13

accidentally drop out of the study.15
2.4. Randomization Checks
From the total of 3,467 subjects that began the experiment, we work with a sample of
2,914 subjects who completed both the joint problem solving (JPS) task and the dona-
tion task. In the JPS task, subjects score an average of 40 out of the 80 available points.
After the task, subjects report a 2.8 oneness towards their peer on average (on a scale
between 1 and 7). Across the ten treatment conditions, subjects generate 4.6 donations,
on average, for Médecins Sans Frontières, and predict their peer to generate an average
of 3.9 donations. Table 1 shows balance in pre-treatment measures and attrition. The
lack of differential attrition across treatments attenuates concerns of disappointment
effects from our treatment manipulations.
2.5. Social Proximity
As argued in the conceptual framework, conformity requires some degree of social
connection to the social reference.16 This section discusses interpretation and deter-
minants of our measure of social proximity, which we elicit among pairs of strangers
after they interact in the JPS task.
Recall that in this task, pairs of subjects are presented with four paintings and they
need to agree on the correct artist to associate from a list of five artists for each painting.
Social contact within each pair occurs in the chat box that allows for instrumental
coordination on answers and strategies to solve the task.17 An average score of 40
out of 80 available points indicates significant coordinated effort to solve the common
puzzles; random click-through from both subjects would predict an expected score of
15A 40-minute timer is implemented to encourage subjects to complete the experiment timely and with-out distractions. Furthermore, to discourage speeding behavior and the use of bots, we implement apractice of the real effort task before treatment assignment.
16Studying behavioral mechanisms that operate via social interactions is methodologically complex.Some papers leverage existing social relationships and identities, while others induce the formationof social relationships and identities within the experiment (Goette et al. (2012) and Chen et al. (2014)for reviews of this literature). For our investigation, to avoid contaminating the conformity with otherforms of social influence deriving from the prospects of future interactions, we choose the approach ofbuilding social relationships among randomly and anonymously matched strangers.
17To solve puzzles, many of the subjects realize that they can use Google image search, and they tend tosplit up paintings to search with their peer.
14
Tabl
e1:
Sum
mar
ySt
atis
tics
ofO
bser
vabl
eC
hara
cter
isti
csan
dA
ttri
tion
(Mea
nsan
dSt
anda
rdEr
rors
inPa
rent
hese
s)
Full
sam
ple
No
lott
ery
Lott
ery
Ince
ntiv
esto
self
Zer
oM
oder
ate
Hig
hp-
valu
eIn
cent
ives
tope
erZ
ero
Mod
erat
eH
igh
Zer
oM
oder
ate
Hig
hZ
ero
Mod
erat
eH
igh
(1)
(2)
(3)
(4)
(5)
(6)
(7)
(8)
(9)
(10)
(11)
(12)
a)M
easu
red
befo
retr
eatm
ent
Mal
e0.
452
0.44
90.
437
0.44
10.
465
0.40
80.
473
0.45
10.
453
0.45
80.
484
0.86
1(0
.009
)(0
.029
)(0
.029
)(0
.029
)(0
.030
)(0
.029
)(0
.030
)(0
.029
)(0
.030
)(0
.029
)(0
.028
)A
gegr
oup
2.52
42.
491
2.47
32.
500
2.62
02.
582
2.51
32.
487
2.52
92.
548
2.50
00.
882
(0.0
21)
(0.0
68)
(0.0
65)
(0.0
65)
(0.0
66)
(0.0
66)
(0.0
69)
(0.0
64)
(0.0
65)
(0.0
65)
(0.0
68)
Expe
rien
ce2.
605
2.77
42.
567
2.66
62.
662
2.62
42.
564
2.63
22.
604
2.56
82.
403
0.28
0(0
.028
)(0
.092
)(0
.089
)(0
.091
)(0
.089
)(0
.089
)(0
.093
)(0
.086
)(0
.088
)(0
.083
)(0
.093
)Po
ints
JPS
task
40.1
9937
.979
40.3
3340
.966
42.3
2439
.443
41.3
9239
.934
41.0
7939
.535
39.2
260.
924
(0.6
19)
(1.9
57)
(1.9
06)
(1.9
85)
(1.9
82)
(2.0
04)
(2.0
34)
(1.9
65)
(1.9
55)
(1.7
95)
(2.0
29)
One
ness
2.80
12.
704
2.84
72.
784
2.89
42.
793
2.88
52.
773
2.83
12.
691
2.81
90.
829
(0.0
30)
(0.0
93)
(0.0
96)
(0.0
97)
(0.0
97)
(0.0
98)
(0.1
03)
(0.0
94)
(0.0
95)
(0.0
96)
(0.0
89)
b)M
easu
red
afte
rtr
eatm
ent
Dro
pout
0.15
90.
138
0.16
70.
167
0.14
70.
171
0.15
20.
163
0.16
50.
169
0.15
10.
974
(0.0
06)
(0.0
19)
(0.0
20)
(0.0
20)
(0.0
19)
(0.0
20)
(0.0
20)
(0.0
19)
(0.0
20)
(0.0
19)
(0.0
20)
Obs
erva
tion
s29
14[3
467]
287
[333
]30
0[3
63]
290
[348
]28
4[3
33]
287
[346
]27
3[3
22]
304
[363
]27
8[3
33]
301
[362
]31
0[3
65]
Not
es:p
-val
uein
colu
mn
(12)
isfo
ra
one-
way
AN
OVA
onra
nks
(Kru
skal
-Wal
lis)t
estc
ompa
ring
the
ten
trea
tmen
tgro
ups
inco
lum
ns(2
)to
(11)
.Exc
eptf
ordr
opou
trat
es("
Dro
pout
"),a
llst
atis
tics
refe
rto
the
final
sam
ple
ofsu
bjec
tsw
hoco
mpl
eted
the
expe
rim
ent.
Dro
pout
rate
sof
subj
ects
afte
rtr
eatm
enta
ssig
nmen
tcom
pute
don
the
sam
ples
repo
rted
insq
uare
brac
kets
inth
e"O
bser
vati
ons"
row
.
15

3.2. The chat box also introduces each subject to the peer by reporting peer’s stated first
name, age, gender, level of experience on the Amazon Mechanical Turk platform, and
common US residence. The oneness measure of social proximity is meant to capture
the extent to which basic demographic information and contact with the other player
in the JPS task facilitate the formation of perceived social proximity.18
To put into perspective the kind of social proximity captured by the oneness scale,
it is worth comparing the levels we measure to existing estimates. In other studies,
on the same scale from 1 to 7, oneness towards an acquaintance, non-close friend, and
close relationship is measured to be on average 2.5, 4.0, and 5.4, respectively (Gächter
et al., 2015). In our sample, we measure greatly different levels of oneness, with an
inter-quartile range capturing half of the entire range of possible realizations: the first
quartile of the distribution is 1, the median is 2.5, the third quartile is 4. Expectedly,
many subjects exhibit no social proximity to their peer in the experiment. But it is
interesting to notice that at least half of the sample exhibits social proximity towards
their peer – a stranger with whom they have recently made contact to solve puzzles –
similar to social proximity that other studies observe towards acquaintances. This is
not a causal effect of JPS interactions on social proximity, but gives an indication that
the JPS does harness social proximity. More direct causal evidence can be found in
Gioia (2017).
In Table B.7, least squares regressions illustrate the correlates of social proximity, and
highlights the role of both homophily (Marmaros and Sacerdote, 2006) and chat box con-
tact (Chen and Li, 2009) in the formation of social proximity. Although age difference
between the paired players does not seem to be highly predictive of social proxim-
ity, the peer being of the same gender and having similar experience on the platform
predict significantly higher oneness. The fit of this simple linear regression model im-
proves remarkably when we include a binary indicator – contact – for whether players
made reciprocal contact through the chat box provided.19 Players that make reciprocal
18Figure B.6 provides the distribution of the two psychological scales underlying oneness. These twoscales are strongly correlated (ρ = 0.731), with the WE scale exhibiting a relatively multi-peaked distri-bution compared to the clear single peak of the IOS scale (at the lowest level of social proximity). Allanalyses presented in the results section are robust to replacing either of these two scales as measuresof social proximity.
1980.4% of subjects used the chat box to make contact with the peer, and 64.6% of pairs managed to have aconversation (contact = 1). In these conversations, subject share their knowledge of the paintings, share
16

contact with their peer report 67.5% higher social proximity, and although the decision
to engage in chat interactions is endogenous, the relatively strong correlation of 0.294
(column (1)) is indicative of the role of social contact for the development of social
connection.
3. Experimental Results
3.1. Descriptive Evidence
In Table 2, we summarize average beliefs and donations across treatments, drawing
the patterns of interest that will be explained in the next section.
Own incentives. Donations are weakly monotonic in personal incentives. They strongly
increase when incentives go from zero to moderate and appear to flatten out when in-
centives are high. Moderate incentives also increase donations compared to a control
treatment in which subjects are not incentivized and incentives are never mentioned.
Beliefs indicate that individuals anticipate these patterns of direct incentive effects cor-
rectly, although they systematically underestimate the levels of others’ generosity.20
Peer incentives. Donations systematically respond non-monotonically to peer incen-
tives: for any level of personal incentives, donations increase when peer incentives go
from zero to moderate, and decrease when incentives go from moderate to high. Subjects
anticipate such comparative statics remarkably well. They anticipate that an increase
in their own incentives from zero to moderate is going to increase donations of their
peers and a further increase from moderate to high decreases their donations.
3.2. Evidence of Social Influence
In this subsection we test the statistical significance of these patterns and interpret
the evidence through the lens of our social influence framework. We also examine
relevant personal information and considerations (e.g., one says "If my husband was here he wouldknow, he is an art teacher lol", some other says that "Modern art sucks".), and agree upon strategies tosolve the task (e.g. "You betcha. I’m googling the heck out of it right now. I’ve got Miro for the first one,Botticelli for the second, Grant Wood for the 3rd, working on the 4th."). Scripts of these conversationscan be made available upon request.
20Consistent with studies finding that research subject accurately predict experimental results (DellaVi-gna and Pope, 2016), but people underestimate others’ prosocial attitudes (e.g. Goette et al., 2006).
17

Table 2: Beliefs and Donations Across Treatments (Means and Standard Errors)
Beliefs about peer’s donations Own donations
Incentives offeredNo (control) 3.585 3.934
(0.205) (0.222)Yes (3x3 treatments)
Incentives to peer Incentives to peerZero Moderate High Zero Moderate High
Ince
ntiv
esto
self Zero 2.540 4.331 4.637 3.233 3.417 3.190
(0.182) (0.215) (0.208) (0.217) (0.230) (0.210)Moderate 2.585 4.832 5.086 5.042 5.546 5.155
(0.193) (0.213) (0.207) (0.233) (0.235) (0.224)High 2.374 4.100 4.374 5.299 5.575 5.187
(0.174) (0.201) (0.195) (0.233) (0.229) (0.212)
whether the evidence can be explained by other theories of prosocial behavior.
Donationi = α +β1Lotteryi +β2Moderatei +β3Highi +β4Moderate j +β5High j +X i, jγ + εi
(3.1)
We use a linear regression model (3.1) to estimate how donations are affected by the
economic environment. Denoting an agent by i and her peer by j, this model estimates
both the effect of i’s incentives on i’s donations as well as the effect of j’s incentives
on i’s donations. We allow for the effects of incentives to be non-monotonic by coding
incentive as categorical variables. The regression model also includes an indicator for
the no lottery control treatment that isolate disappointment effects of not receiving the
incentives, as well as controls for observable characteristics of both players in a pair.
Belie fi = φ +δ1Lottery j +δ2Moderate j +δ3High j +δ4Moderatei +δ5Highi +X i, jω + εi
(3.2)
We also estimate the mirror regression model (3.2) for individual beliefs on the dona-
tions of her peer. This allows us to test the unique prediction of the social influence
framework that changes in peer incentives can cause a change in beliefs about how
peer j behaves and a change in the behavior of agent i in the same direction. The esti-
mates of regression models (3.1) and (3.2) are presented in panels (a) and (b) of Table 3,
18
respectively.
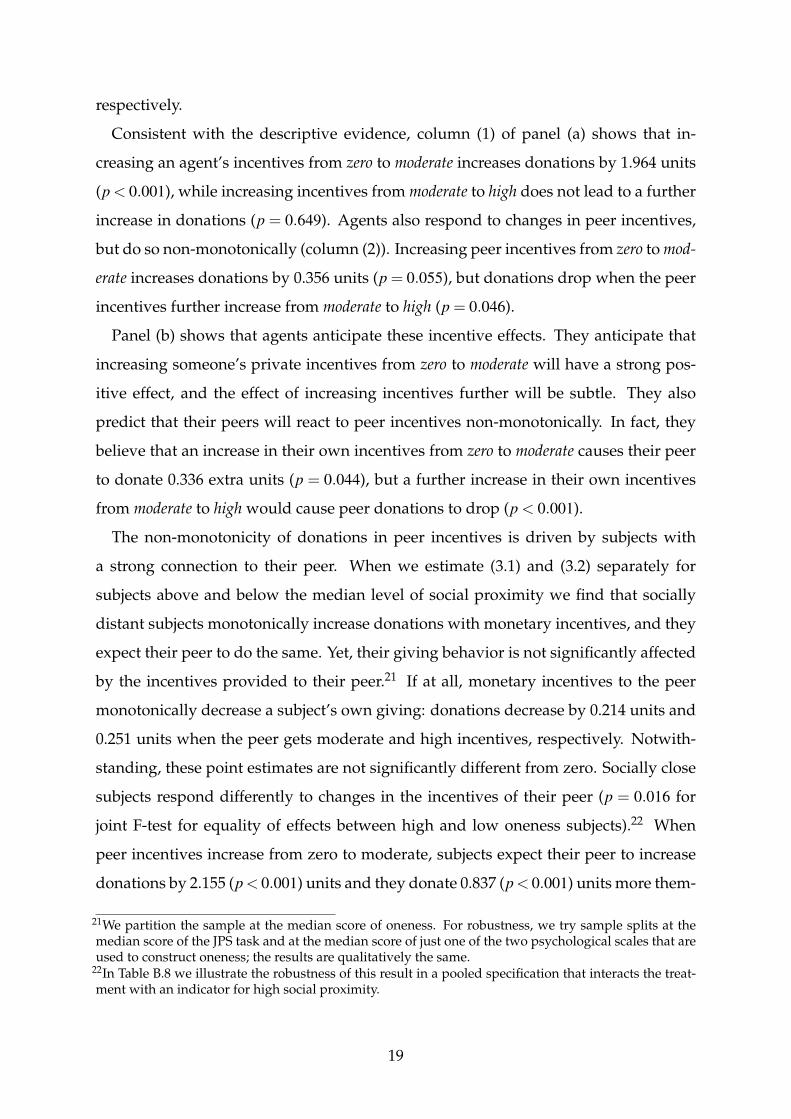
Consistent with the descriptive evidence, column (1) of panel (a) shows that in-
creasing an agent’s incentives from zero to moderate increases donations by 1.964 units
(p < 0.001), while increasing incentives from moderate to high does not lead to a further
increase in donations (p = 0.649). Agents also respond to changes in peer incentives,
but do so non-monotonically (column (2)). Increasing peer incentives from zero to mod-
erate increases donations by 0.356 units (p = 0.055), but donations drop when the peer
incentives further increase from moderate to high (p = 0.046).
Panel (b) shows that agents anticipate these incentive effects. They anticipate that
increasing someone’s private incentives from zero to moderate will have a strong pos-
itive effect, and the effect of increasing incentives further will be subtle. They also
predict that their peers will react to peer incentives non-monotonically. In fact, they
believe that an increase in their own incentives from zero to moderate causes their peer
to donate 0.336 extra units (p = 0.044), but a further increase in their own incentives
from moderate to high would cause peer donations to drop (p < 0.001).
The non-monotonicity of donations in peer incentives is driven by subjects with
a strong connection to their peer. When we estimate (3.1) and (3.2) separately for
subjects above and below the median level of social proximity we find that socially
distant subjects monotonically increase donations with monetary incentives, and they
expect their peer to do the same. Yet, their giving behavior is not significantly affected
by the incentives provided to their peer.21 If at all, monetary incentives to the peer
monotonically decrease a subject’s own giving: donations decrease by 0.214 units and
0.251 units when the peer gets moderate and high incentives, respectively. Notwith-
standing, these point estimates are not significantly different from zero. Socially close
subjects respond differently to changes in the incentives of their peer (p = 0.016 for
joint F-test for equality of effects between high and low oneness subjects).22 When
peer incentives increase from zero to moderate, subjects expect their peer to increase
donations by 2.155 (p< 0.001) units and they donate 0.837 (p< 0.001) units more them-
21We partition the sample at the median score of oneness. For robustness, we try sample splits at themedian score of the JPS task and at the median score of just one of the two psychological scales that areused to construct oneness; the results are qualitatively the same.
22In Table B.8 we illustrate the robustness of this result in a pooled specification that interacts the treat-ment with an indicator for high social proximity.
19

Table 3: Incentive Effects on Donations and Beliefs
Full sample Split by oneness H0 p-value:
High Low High = LowOutcome: (1) (2) (3) (4) (5)
(a) DonationsProvided Lottery -0.712∗∗∗ -0.831∗∗∗ -0.665∗ -1.066∗∗∗
0.464(0.262) (0.283) (0.389) (0.403)
Incentives to self (baseline: Zero)Moderate 1.964∗∗∗ 1.970∗∗∗ 1.921∗∗∗ 2.037∗∗∗
0.052(0.183) (0.182) (0.254) (0.260)
High 2.047∗∗∗ 2.044∗∗∗ 1.712∗∗∗ 2.502∗∗∗
(0.179) (0.179) (0.242) (0.259)Incentives to peer (baseline: Zero)
Moderate 0.356∗ 0.837∗∗∗ -0.214
0.016(0.186) (0.259) (0.268)
High -0.001 0.170 -0.251(0.180) (0.236) (0.269)
Constant 4.663∗∗∗ 4.650∗∗∗ 4.896∗∗∗ 4.248∗∗∗0.369
(0.368) (0.368) (0.500) (0.539)
Incentives to self, High - Moderate 0.083 0.073 -0.209 0.465∗
(0.182) (0.182) (0.246) (0.272)Incentives to peer, High - Moderate -0.356∗∗ -0.667∗∗∗ -0.037
(0.178) (0.245) (0.262)
H0 p-value: Incentives to peerZero = Moderate = High = 0 0.080 0.003 0.607
(b) BeliefsProvided Lottery -1.155∗∗∗ -1.188∗∗∗ -1.207∗∗∗ -1.315∗∗∗
0.822(0.237) (0.256) (0.358) (0.348)
Incentives to peer (baseline: Zero)Moderate 1.948∗∗∗ 1.962∗∗∗ 2.155∗∗∗ 1.773∗∗∗
0.391(0.161) (0.160) (0.222) (0.221)
High 2.237∗∗∗ 2.240∗∗∗ 2.227∗∗∗ 2.218∗∗∗
(0.158) (0.158) (0.211) (0.229)Incentives to self (baseline: Zero)
Moderate 0.336∗∗ 0.420∗ 0.257
0.435(0.167) (0.222) (0.240)
High -0.253 -0.337 -0.105(0.160) (0.221) (0.227)
Constant 4.273∗∗∗ 4.274∗∗∗ 4.800∗∗∗ 3.625∗∗∗0.075
(0.341) (0.341) (0.458) (0.495)
Incentives to peer, High - Moderate 0.288∗ 0.278∗ 0.072 0.445∗
(0.168) (0.167) (0.226) (0.242)Incentives to self, High - Moderate -0.589∗∗∗ -0.757∗∗∗ -0.362
(0.158) (0.219) (0.225)
H0 p-value: Incentives to selfZero = Moderate = High = 0 0.001 0.003 0.267
Observations 2914 2914 1571 1343
∗p < 0.10; ∗∗p < 0.05; ∗∗∗p < 0.01Notes: All specifications include gender, age group, and experience, of both the player and her peer, as well as session dummies.
Column (5) presents joint F-tests for the null hypotheses that point estimates – for each group of variables – are equal in thehigh and low oneness subsamples. Standard errors are clustered at the pair level. Results are qualitatively very similar in aseemingly unrelated regression framework that allows for correlation in the error term of individual beliefs and donations.
20

selves. However, when peer incentives increase from moderate to high, subjects again
believe that the incentive increase does not affect (p = 0.750) peer donations (correctly
so given that such increase in incentives for high oneness subjects does not increase
donations significantly (p = 0.395)), and donations decrease by 0.667 (p = 0.007) units
and individuals.23
The evidence is clear that the economic environment of the peer shapes willingness
to behave prosocially. This is evidence of conformity, with zero-to-moderate changes in
incentives causing individual donations and beliefs about the donations of others to
move in the same direction. At the same time, the evidence indicates that the desire
to conform diminishes when peer incentives are “too generous”. Fewer donations are
made when peer incentives are high in spite of the fact that expected donations from
the peer do not decrease.
This evidence is explained by a model of social influence in which conformity is
driven by identification with altruistic intentions. As we show in Section 2.2, such
model captures that changes in peer incentives not only affect donations of the peer,
but also the intensity of their altruistic intentions. The effects of peer incentives on
donations are non-monotonic because any loss in psychological utility due to norm
deviation is dampened when the norm is determined by weak altruistic intentions.
Wald estimates for the effect of beliefs on donations implied by our reduced form re-
gressions results help appreciate diminishing conformity more directly. From column
(2), we obtain that a one unit change in beliefs from increasing the peer’s incentives
from zero to moderate increases donations by 0.182 units (p = 0.035), while a one unit
change in beliefs from increasing the peer’s incentives from zero to high has no effect
on donations (bWald =−0.0003, p = 0.997). This pattern of diminishing influence of be-
liefs about others on individual prosocial behavior is even more pronounced for high
oneness subjects (column (3)).24
Alternatively, the non-monotonic effects of peer incentives on donations may be
23Importantly, differences in behavior across socially close and socially distant individuals does not ap-pear to be driven by differences in pro social orientation. In fact, we can use the control treatment toshow that in the absence of incentives subjects with high social proximity to their peer do not systemat-ically donate differently from subjects with low social proximity to their peer (p = 0.973, see Figure B.7).
24The belief change due to increasing the peer’s incentives from zero to moderate increases one’s dona-tions by 0.388 units (p < 0.001), while the belief change due to increasing the peer’s incentives from zeroto high has a precise null effect on donations of 0.076 (p = 0.448).
21

driven by a substitution effect due to altruistic crowding-out. Altruistic agents may
decrease their donations when they expect that incentives cause the peer to increase
donations. However, in such a model, an agent’s donations decrease globally with her
peer’s incentives: the reason is that increased donations by the peer always lower the
marginal utility of one’s own donation. Thus, impure altruism alone cannot explain
our findings, as we find non-monotonic effect of the peer’s incentives on the agent’s
behavior.
Another hypothesis is that substitution effects co-exist with conformity and explain
the diminishing conformity when peer incentives are high. This hypothesis is also at
odds with the evidence. Low oneness subjects believe that their peer respond to incen-
tives strongly and monotonically, but their donations do not respond to the incentives
of their peer (p = 0.607). All the non-monotonic response to peer incentives is driven
by high oneness subjects. However, the pattern in this group is also inconsistent with
the substitution hypothesis. They believe that changing incentives for their peer from
moderate to high has no significant effects on the peer’s donations (p = 0.750) and yet
they react by reducing their own donations by 0.667 units (p = 0.007).
The diminishing conformity interpretation is reminiscent of influential papers by
Gneezy and Rustichini (2000a,b) and the more recent study of Fuster and Meier (2009).
From their experiments, these authors conclude that incentives weaken adherence to
the norms of behavior dictated by the actions of a social reference – let this be a small
group or society. An important novel element of distinction of our findings is that
incentives do not seem to simply shut down adherence to social norms: in fact, the
magnitude of incentives matters. Relatively small incentives to act prosocially can
preserve a certain level of norm adherence and produce social influence.25 When this
is the case, our evidence suggests that larger incentives are more likely to backfire on
the positive spillovers of social influence, and perhaps the power of small (but not
large) incentives could be leveraged to crowd in donations.
25Ostracism as in Dutta et al. (2018) allows us to endogenize social norms to demonstrate that it is not themere incidence of payments that damages norm following, but sufficiently large incentives are insteadneeded. Albeit aligned with our evidence, for the absence of social interactions after the donation, wecannot meaningfully use this theory to explain our findings.
22
3.3. Incentive Inequality and Donor’s Morale
In the interpretation of our results, we have so far ignored the possibility that incen-
tive inequality in itself may affect an agent’s morale to work on a task to generate
donations for a charity. To assess this potential mechanism, we consider a model that
incorporates such effects from incentive inequality (Breza et al., 2017). Such a model
predicts that conditional on one’s own incentives, donation levels should be highest
when incentives for both players in a pair are equal, and monotonically decrease with
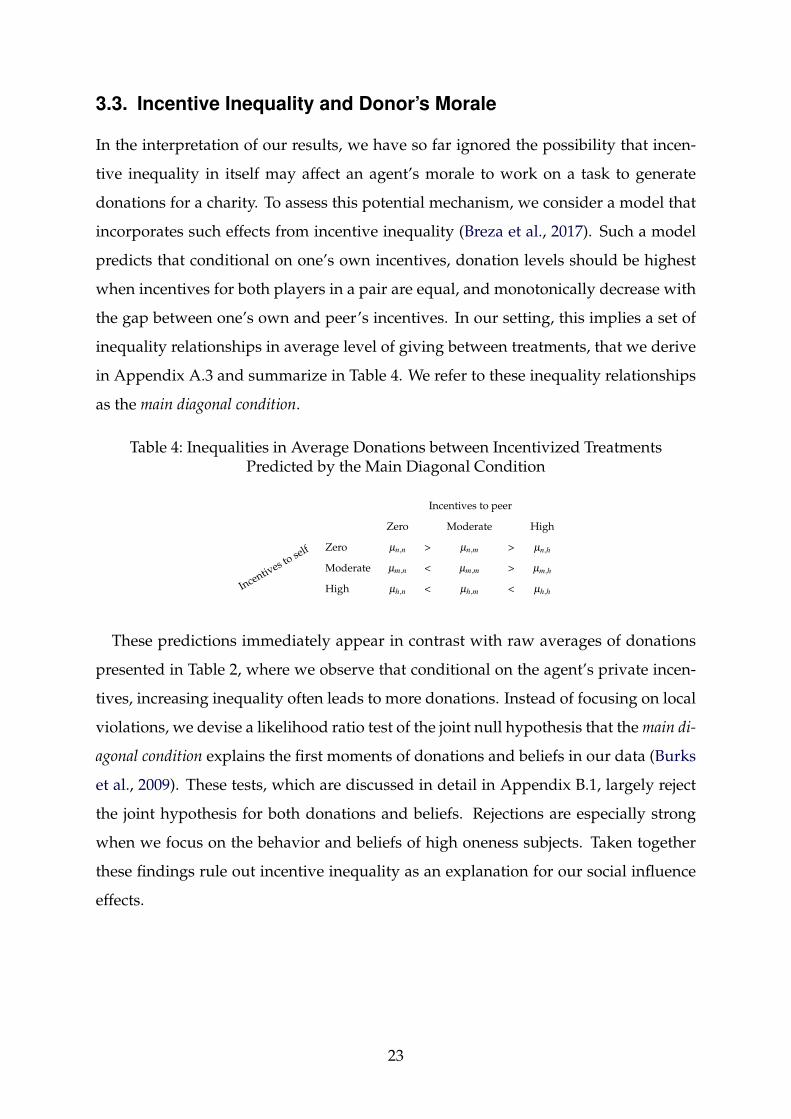
the gap between one’s own and peer’s incentives. In our setting, this implies a set of
inequality relationships in average level of giving between treatments, that we derive
in Appendix A.3 and summarize in Table 4. We refer to these inequality relationships
as the main diagonal condition.
Table 4: Inequalities in Average Donations between Incentivized TreatmentsPredicted by the Main Diagonal Condition
Incentives to peer
Zero Moderate High
Incentives to self Zero µn,n > µn,m > µn,h
Moderate µm,n < µm,m > µm,h
High µh,n < µh,m < µh,h
These predictions immediately appear in contrast with raw averages of donations
presented in Table 2, where we observe that conditional on the agent’s private incen-
tives, increasing inequality often leads to more donations. Instead of focusing on local
violations, we devise a likelihood ratio test of the joint null hypothesis that the main di-
agonal condition explains the first moments of donations and beliefs in our data (Burks
et al., 2009). These tests, which are discussed in detail in Appendix B.1, largely reject
the joint hypothesis for both donations and beliefs. Rejections are especially strong
when we focus on the behavior and beliefs of high oneness subjects. Taken together
these findings rule out incentive inequality as an explanation for our social influence
effects.
23

3.4. Other Mechanisms of Social Influence
Mechanisms such as social learning, social consumption, reciprocity, and conformism
have been proposed to explain the large body of evidence in support of the hypothe-
sis that most individuals are conditional co-operators (Frey and Meier, 2004). In this
section we discuss other mechanisms that can generate spillovers of giving in applica-
tions similar to the one we consider. Further, we explain how the experimental design
allows us to rule out these explanations.
Social learning. When people are asymmetrically informed about relevant parame-
ters, observing others’ behavior can facilitate information aggregation. In any charita-
ble giving context, the social value of a prosocial activity is uncertain, and the attitudes
of others towards the charitable activity may indeed be informative about the quality
of the charity or the social norm of giving to the specific cause. Our experiment ex-
cludes any scope for social learning. We make clear to subjects that the value generated
from a donation is 0.25 USD and that this is common knowledge. Yet, the effectiveness
of Médecins Sans Frontières in generating social value may be uncertain and some sub-
jects may know the charity better than others. Our experiment rules out this channel
by keeping donations private.
Joint consumption. Especially for volunteer work, this mechanism can play an im-
portant role in producing social influence. The prosocial action may involve social
activities that confer consumption utility from forming relationships, sharing com-
mon experiences, and other pleasant interactions during the activity. The lack of so-
cial interactions among participants during the donation makes it easy to rule out this
mechanism.
Reciprocity. This mechanism is often used to explain behavior in local social dilemmas
- where agents directly benefit from the prosocial behavior of others. In most cases,
charitable giving can instead be regarded as a global social dilemma, in the sense that
agents only benefit marginally from the prosocial behavior of others. In such settings,
we cannot expect that reciprocity could generate first order effects.
Signaling motives. The theory of Benabou and Tirole (2006) proposes the signaling
of altruism and greed as channels that endogenuously lead to strategic complemen-
tarity or substitutability of donations. They show that complementarities arise when,
24

as more people decide to donate, the image of the pool of donors deteriorates faster
than the image of non-donors. Our context is highly anonymous and our results are
unlikely to be driven by social signaling. At the same time, we recognize that the
Benabou and Tirole (2006) model admits a self-image interpretation.26 However, for
self-signaling to explain variation in donations, the treatment should affect the infer-
ence individuals can make about their own type, which cannot be in our setting where
peer incentives are random.27
Social influence in work effort. One possibility is that the social influence observed
in this study may have to do with conformity in work effort rather than in proso-
cial behavior. While we do not have a parallel experiment to rule out this channel,
prominent existing studies on social influence in the workplace (e.g. Mas and Moretti,
2009; Bandiera et al., 2010) show that some degree of socialization or observability of
co-workers’ effort during the activity is necessary for this channel to matter empiri-
cally. Because subjects in our experiment work on the real effort task for the charity in
isolation from their peer, we believe that this channel plays a trivial role, if any.
4. Conclusion
This study proposes a novel experiment to study social influence independently of
social learning. In our experiment, pairs of players collaborate on a task that provides
the opportunity to develop social proximity with their peer. Each individual then
independently generates donations to a charity through a tedious task, knowing both
her incentives and the incentives of her peer.
We provide evidence that information about the economic environment faced by a
social reference is sufficient to spread social influence. Agents respond to increases
in their peer’s incentives by expecting that their peer will donate more and in turn,
they donate more themselves. Our result are in line with a model of social influence
in which conformity is driven by identification with an attractive role (Kelman, 1961).
We find that conformity in donations is stronger when the agent feels socially close to26Especially, we do not dispute that signaling motives and conformity may have related behavioralroots. Jones and Linardi (2014) find that making signaling motives more salient increases conformism.
27Random assignment of peer incentive m j implies that for inference about own altruism type vi, withoutobserving peer donation d j, Ei(vi|di,mi,m j) = E(vi|di,mi).
25

her peer, and her response to the incentives of the peer are non-monotonic.28
Our results also have methodological implications. Increasingly, social scientists are
becoming interested in studying the relationship between beliefs about others’ behav-
ior and individual behavior. Such empirical efforts often have to overcome several
challenges, including the notorious reverse causality issue of false consensus.29 An
approach that is increasingly used in experiments to overcome similar challenges is
to introduce sources of belief variation that serve as instruments for beliefs (see e.g.
Smith, 2013; Costa-Gomes et al., 2014). The non-monotonicity of donations in peer’s
incentives is a warning that different incentives can generate IV estimates that are po-
tentially contradictory if we do not account for the model through which beliefs cause
behavior.
This evidence is informative of the mechanisms underlying conformity. As noted by
Dutta et al. (2018), whether conformity is a preference or a social norm is difficult to say
in most empirical settings. An individual may prefer to internalize social norms instead
of doing the introspection needed to determine her favorite strategies. While we do
not make this distinction, we think that our design makes it hard for individuals to
internalize social norms for these not being readily available. In fact, because others’
behavior is not observable, in order to enjoy any of the benefits of internalization,
subjects would first have to accurately assess what is the social norm in a relatively
unfamiliar environment.
An implication of our results is that small incentives can be more effective at crowd-
ing in prosociality, and non-pecuniary interventions may be better suited to leverage
social influence. Market designers should be cautious with changing incentives for
activities that are partly regulated by a social contract because larger incentives are
more likely to backfire on social influence. Consistent with this interpretation is the
surprising evidence that better paid police officers in West Africa become more corrupt
(Foltz and Opoku-Agyemang, 2015).
More broadly, by distinguishing conformity from social learning, our results illus-
trate the potential of social influence even in settings where social information is un-28Our setup does not distinguish between probabilistic and deterministic incentives. While it is possiblethat this probabilistic framing reinforces the effects, it is difficult to see how the framing alone (withoutthe higher expected payment) would generate the non-monotonicity we observe.
29The concern that beliefs reflect more the response function of the observer than the one of the observed.
26

likely to be informative of the quality of an activity. This improves our understanding
of the propagation of social influence in other applications, like exercising (Aral and
Nicolaides, 2017) and political mobilization (Bond et al., 2012), water and energy con-
servation (Ferraro and Price, 2013; Allcott and Rogers, 2014) where personal tastes are
likely unaffected by social information. A concern in this literature is that social-norm
information can be a double-edged sword, for it may lead to bunching of outcomes
around the norm. However, many of these recent field studies find that social-norm
information also leads to adjustment in the socially desirable direction for individuals
that are already doing better than what is dictated by the social norm. Our results
suggest that previous findings can be explained by conformity to expectation of how
others will react to social information. Assessing the portability of our results is an
interesting avenue for future research.
References
Akerlof, George A., “Social Distance and Social Decisions,” Econometrica, 1997, 65 (5),
1005–1027.
Allcott, Hunt and Todd Rogers, “The short-run and long-run effects of behavioral in-
terventions: Experimental evidence from energy conservation,” American Economic
Review, 2014, 104 (10), 3003–37.
Andreoni, James, “Giving with Impure Altruism: Applications to Charity and Ricar-
dian Equivalence,” Journal of Political Economy, December 1989, 97 (6), 1447–1458.
, “Impure Altruism and Donations to Public Goods: A Theory of Warm-Glow Giv-
ing,” The Economic Journal, June 1990, 100 (401), 464.
Aral, Sinan and Christos Nicolaides, “Exercise contagion in a global social network,”
Nature Communications, April 2017, 8.
Ariely, Dan, Anat Bracha, and Stephan Meier, “Doing Good or Doing Well? Image
Motivation and Monetary Incentives in Behaving Prosocially,” American Economic
Review, February 2009, 99 (1), 544–555.
Aron, Arthur, Elaine N Aron, and Danny Smollan, “Inclusion of other in the self
scale and the structure of interpersonal closeness.,” Journal of personality and social
27

psychology, 1992, 63 (4), 596.
Bandiera, Oriana, Iwan Barankay, and Imran Rasul, “Social incentives in the work-
place,” The review of economic studies, 2010, 77 (2), 417–458.
Bapna, Ravi and Akhmed Umyarov, “Do Your Online Friends Make You Pay? A
Randomized Field Experiment on Peer Influence in Online Social Networks,” Man-
agement Science, April 2015, 61 (8), 1902–1920.
Becker, Gary S., “A Theory of Social Interactions,” Journal of Political Economy, Novem-
ber 1974, 82 (6), 1063–1093.
Benabou, Roland and Jean Tirole, “Incentives and Prosocial Behavior,” American Eco-
nomic Review, December 2006, 96 (5), 1652–1678.
Bernheim, B. Douglas, “A Theory of Conformity,” Journal of Political Economy, 1994,
102 (5), 841–877.
Bigenho, Jason and Seung-Keun Martinez, “Social Comparisons in Peer Effects,”
Technical Report, Technical report, UCSD 2019.
Bohnet, Iris and Richard Zeckhauser, “Social Comparisons in Ultimatum Bargain-
ing,” Scandinavian Journal of Economics, October 2004, 106 (3), 495–510.
Bond, Robert M., Christopher J. Fariss, Jason J. Jones, Adam D. I. Kramer, Cameron
Marlow, Jaime E. Settle, and James H. Fowler, “A 61-million-person experiment
in social influence and political mobilization,” Nature, September 2012, 489 (7415),
295–298.
Breza, Emily, Supreet Kaur, and Yogita Shamdasani, “The Morale Effects of Pay In-
equality,” The Quarterly Journal of Economics, 2017.
Bruhin, Adrian, Lorenz Goette, Simon Haenni, and Lingqing Jiang, “Spillovers of
Prosocial Motivation: Evidence from an Intervention Study on Blood Donors,” Jour-
nal of Health Economics, 2020, 70, 102244.
Burks, Stephen V., Jeffrey P. Carpenter, Lorenz Goette, and Aldo Rustichini, “Cog-
nitive skills affect economic preferences, strategic behavior, and job attachment,”
Proceedings of the National Academy of Sciences, May 2009, 106 (19), 7745–7750.
Bursztyn, Leonardo, Florian Ederer, Bruno Ferman, and Noam Yuchtman, “Under-
standing mechanisms underlying peer effects: Evidence from a field experiment on
financial decisions,” Econometrica, 2014, 82 (4), 1273–1301.
28

Cantoni, Davide, David Y. Yang, Noam Yuchtman, and Y. Jane Zhang, “Are Protests
Games of Strategic Complements or Substitutes? Experimental Evidence from Hong
Kong’s Democracy Movement,” Working Paper 23110, National Bureau of Eco-
nomic Research January 2017. DOI: 10.3386/w23110.
Cason, Timothy N. and Vai-Lam Mui, “Social Influence in the Sequential Dictator
Game,” Journal of Mathematical Psychology, June 1998, 42 (2), 248–265.
Chen, Daniel L., Martin Schonger, and Chris Wickens, “oTree-An open-source plat-
form for laboratory, online, and field experiments,” Journal of Behavioral and Experi-
mental Finance, March 2016, 9, 88–97.
Chen, Roy and Yan Chen, “The Potential of Social Identity for Equilibrium Selection,”
American Economic Review, October 2011, 101 (6), 2562–2589.
Chen, Yan and Sherry Xin Li, “Group identity and social preferences,” American Eco-
nomic Review, 2009, 99 (1), 431–57.
, F. Maxwell Harper, Joseph Konstan, and Sherry Xin Li, “Social Comparisons and
Contributions to Online Communities: A Field Experiment on MovieLens,” Ameri-
can Economic Review, September 2010, 100 (4), 1358–1398.
, Sherry Xin Li, Tracy Xiao Liu, and Margaret Shih, “Which hat to wear? Impact of
natural identities on coordination and cooperation,” Games and Economic Behavior,
March 2014, 84 (Supplement C), 58–86.
Cialdini, Robert B., Stephanie L. Brown, Brian P. Lewis, Carol Luce, and Steven L.
Neuberg, “Reinterpreting the empathy-altruism relationship: When one into one
equals oneness.,” Journal of Personality and Social Psychology, 1997, 73 (3), 481–494.
Costa-Gomes, Miguel A., Steffen Huck, and Georg Weizsäcker, “Beliefs and actions
in the trust game: Creating instrumental variables to estimate the causal effect,”
Games and Economic Behavior, November 2014, 88 (Supplement C), 298–309.
DellaVigna, Stefano, “Structural behavioral economics,” Technical Report, National
Bureau of Economic Research 2018.
and Devin Pope, “Predicting Experimental Results: Who Knows What?,” Work-
ing Paper 22566, National Bureau of Economic Research August 2016. DOI:
10.3386/w22566.
and , “What motivates effort? Evidence and expert forecasts,” The Review of Eco-
29

nomic Studies, 2017, 85 (2), 1029–1069.
Dimant, Eugen, “Contagion of Pro-and Anti-Social Behavior Among Peers and the
Role of Social Proximity,” Technical Report 2018.
Drago, Francesco, Friederike Mengel, and Christian Traxler, “Compliance behavior
in networks: Evidence from a field experiment,” American Economic Journal: Applied
Economics, 2020, 12 (2), 96–133.
Duffy, John and Tatiana Kornienko, “Does competition affect giving?,” Journal of Eco-
nomic Behavior & Organization, May 2010, 74 (1), 82–103.
Dutta, Rohan, David K Levine, and Salvatore Modica, “Peer Monitoring, Ostracism
and the Internalization of Social Norms,” Technical Report, David K. Levine 2018.
Eckel, Catherine C and Philip J Grossman, “Rebate versus matching: does how we
subsidize charitable contributions matter?,” Journal of Public Economics, March 2003,
87 (3-4), 681–701.
Eckel, Catherine C. and Rick K. Wilson, “Social learning in coordination games: does
status matter?,” Experimental Economics, September 2007, 10 (3), 317–329.
Ellingsen, Tore and Magnus Johannesson, “Pride and prejudice: The human side of
incentive theory,” American economic review, 2008, 98 (3), 990–1008.
Fehr, Ernst and Klaus M. Schmidt, “A Theory of Fairness, Competition, and Cooper-
ation,” The Quarterly Journal of Economics, August 1999, 114 (3), 817–868.
Fellner, Gerlinde, Rupert Sausgruber, and Christian Traxler, “Testing Enforcement
Strategies in the Field: Threat, Moral Appeal and Social Information,” Journal of the
European Economic Association, June 2013, 11 (3), 634–660.
Ferraro, Paul J and Michael K Price, “Using nonpecuniary strategies to influence be-
havior: evidence from a large-scale field experiment,” Review of Economics and Statis-
tics, 2013, 95 (1), 64–73.
Foltz, Jeremy D and Kweku A Opoku-Agyemang, “Do higher salaries lower petty
corruption?,” A Policy Experiment on West Africa’s Highways, 2015.
Frey, Bruno S. and Stephan Meier, “Social Comparisons and Pro-Social Behavior:
Testing "Conditional Cooperation" in a Field Experiment,” The American Economic
Review, 2004, 94 (5), 1717–1722.
Fuster, Andreas and Stephan Meier, “Another Hidden Cost of Incentives: The Detri-
30

mental Effect on Norm Enforcement,” Management Science, October 2009, 56 (1), 57–
70.
Gächter, Simon, Chris Starmer, and Fabio Tufano, “Measuring the Closeness of Re-
lationships: A Comprehensive Evaluation of the ’Inclusion of the Other in the Self’
Scale,” PLOS ONE, June 2015, 10 (6), e0129478.
Gilchrist, Duncan Sheppard and Emily Glassberg Sands, “Something to talk about:
Social spillovers in movie consumption,” Journal of Political Economy, 2016, 124 (5),
1339–1382.
Gioia, Francesca, “Peer effects on risk behaviour: the importance of group identity,”
Experimental Economics, Mar 2017, 20 (1), 100–129.
Gneezy, Uri and Aldo Rustichini, “A Fine Is a Price,” Journal of Legal Studies, 2000, 29,
1–18.
and , “Pay Enough or Don’t Pay at All,” The Quarterly Journal of Economics, 2000,
115 (3), 791–810.
Goette, Lorenz, David Huffman, and Stephan Meier, “The Impact of Group Member-
ship on Cooperation and Norm Enforcement: Evidence Using Random Assignment
to Real Social Groups,” The American Economic Review, 2006, 96 (2), 212–216.
, , and , “The Impact of Social Ties on Group Interactions: Evidence from Mini-
mal Groups and Randomly Assigned Real Groups,” American Economic Journal: Mi-
croeconomics, February 2012, 4 (1), 101–115.
Hara, Kotaro, Abigail Adams, Kristy Milland, Saiph Savage, Chris Callison-Burch,
and Jeffrey P Bigham, “A Data-Driven Analysis of Workers’ Earnings on Amazon
Mechanical Turk,” in “Proceedings of the 2018 CHI Conference on Human Factors
in Computing Systems” ACM 2018, p. 449.
Hauser, David J. and Norbert Schwarz, “Attentive Turkers: MTurk participants per-
form better on online attention checks than do subject pool participants,” Behavior
Research Methods, March 2016, 48 (1), 400–407.
Huck, Steffen, Imran Rasul, and Andrew Shephard, “Comparing Charitable
Fundraising Schemes: Evidence from a Natural Field Experiment and a Structural
Model,” American Economic Journal: Economic Policy, May 2015, 7 (2), 326–369.
Jones, Daniel and Sera Linardi, “Wallflowers: Experimental Evidence of an Aversion
31

to Standing Out,” Management Science, March 2014, 60 (7), 1757–1771.
Kelman, HC, “Processes of opinion change,” Public Opinion Quarterly, 1961, 25.
Kessler, Judd B., “Announcements of Support and Public Good Provision,” American
Economic Review, December 2017, 107 (12).
Krupka, Erin and Roberto A. Weber, “The focusing and informational effects of
norms on pro-social behavior,” Journal of Economic Psychology, June 2009, 30 (3), 307–
320.
Lahno, Amrei M and Marta Serra-Garcia, “Peer effects in risk taking: Envy or confor-
mity?,” Journal of Risk and Uncertainty, 2015, 50 (1), 73–95.
Landry, Craig E, Andreas Lange, John A List, Michael K Price, and Nicholas G Rupp,
“Toward an understanding of the economics of charity: Evidence from a field exper-
iment,” The Quarterly journal of economics, 2006, 121 (2), 747–782.
Leider, Stephen, Markus M. Mobius, Tanya Rosenblat, and Quoc-Anh Do, “Directed
Altruism and Enforced Reciprocity in Social Networks,” The Quarterly Journal of Eco-
nomics, November 2009, 124 (4), 1815–1851.
Marmaros, David and Bruce Sacerdote, “How do friendships form?,” The Quarterly
Journal of Economics, 2006, 121 (1), 79–119.
Mas, Alexandre and Enrico Moretti, “Peers at work,” American Economic Review, 2009,
99 (1), 112–45.
Meer, Jonathan, “Does fundraising create new giving?,” Journal of Public Economics,
2017, 145, 82–93.
Meyer, Christian Johannes and Egon Tripodi, “Sorting into Incentives for Proso-
cial Behavior,” SSRN Scholarly Paper ID 3058195, Social Science Research Network,
Rochester, NY October 2017.
Perez-Truglia, Ricardo and Guillermo Cruces, “Partisan interactions: Evidence from
a field experiment in the united states,” Journal of Political Economy, 2017, 125 (4),
1208–1243.
Servátka, Maroš, “Separating reputation, social influence, and identification effects in
a dictator game,” European Economic Review, 2009, 53 (2), 197–209.
Shang, Jen and Rachel Croson, “A Field Experiment in Charitable Contribution: The
Impact of Social Information on the Voluntary Provision of Public Goods,” The Eco-
32

nomic Journal, October 2009, 119 (540), 1422–1439.
Sliwka, Dirk, “Trust as a signal of a social norm and the hidden costs of incentive
schemes,” American Economic Review, 2007, 97 (3), 999–1012.
Smith, Alexander, “Estimating the causal effect of beliefs on contributions in repeated
public good games,” Experimental Economics, September 2013, 16 (3), 414–425.
Topa, Giorgio, “Social Interactions, Local Spillovers and Unemployment,” The Review
of Economic Studies, April 2001, 68 (2), 261–295.
33

For Online Publication
A. Theoretical Appendix
A.1. More general framework
Consider the following more general formulation of the model presented in section 2.2
for any distribution of types F(v) and cost function c(·) such that c′(·)> 0, c′′(·)> 0 and
c(0) = 0.
U(di) = (vi +mi)di− c(di)−λi, j
2Pr(A j(m j))(di−E(dn
j |A j(m j)))2
where A j(m j) = {v j ∈V : c(dnj )/dn
j > m j}. Assuming that Pr(A j(m j)) and E(dnj |A j(m j))
are continuous in m j, the model gives the following comparative statics for the effect
of peer’s incentives on individual donations:
∂d∗i∂m j
= Λ
[∂Pr(A j(m j))
∂m j
(E(dn
j |A j(m j))−d∗i)+Pr(A j(m j))
∂E(dnj |A j(m j))
∂m j
]
where Λ = λ
c′′(d∗i )+λPr(A j(m j))and A j(m j) = {v j ∈V : c(dn
j )/dnj > m j}. This result leads to
the following Lemma:
Lemma 1. For cost functions with constant elasticity of donation effort k ≤ 1, (i) peer’s in-
centives tend to increase (decrease) individual donations for the more (less) altruistic and those
with higher (lower) private incentives mi to donate. However, (ii) there exists a m̃ j threshold
above which ∂d∗i∂m j
is 0 for any i.
Part (i) of the lemma follows from the observation that a necessary condition for ∂d∗i∂m j
to be negative when ∂Pr(A j(m j))∂m j
is negative is that E(dnj |A j(m j)) ≥ d∗i . This prediction
is specific to this model and runs counter to models of (impure) altruism where dona-
tions are more likely to be strategic substitutes for more altruistic donors. To see why
this happens, notice that conformity compels less altruistic individuals to donate more
than they would like, and increasing incentives for the social reference has two effects
on the utility loss from not conforming Pr(A j(m j))(di−E(dnj |A j(m j)))
2: First, an in-
crease due to the increase in dnj ; second, a decrease due to the decrease in Pr(A j(m j)).
34

The latter can be seen as alleviating the pressure to conform and helps individuals
adjust their donations towards their natural type.
Part (ii) of the Lemma requires proof, which we provide below.
Proof. The main step of this proof is to show that when the elasticity of donation
effort with respect to the private value of effort v j +m j is less or equal to 1, Pr(A j(m j))
is decreasing and E(dnj |A j(m j)) is increasing in m j.
Becausec(dn
j )
dnj
is monotonically increasing in m j and v j, all we need for ∂Pr(A j(m j))∂m j
≤ 0
is to show that the marginal altruistic types are excluded from A j(m j) when m j in-
creases.
That is, take v′j and m
′j s.t.
c(dnj (v
′j,m
′j))
dnj (v
′j,m
′j)
= m′j,
we want to show that a positive h implies
c(dnj (v
′j,m
′j +h))
dnj (v
′j,m
′j +h)
≤ m′j +h.
Notice that this is always the case if ∂
∂m j
[c(dnj )
dnj
]≤ 1. With that in mind, consider
∂
∂m j
[c(dn
j )
dnj
]=
(c′(dnj )d
nj − c(dn
j ))∂dn
j∂m j
(dnj )
2 =(v j +m j)
dnj
∂dnj
∂m j−
c(dnj )
dnj
∂dnj
∂m j
dnj
which for cost functions characterized by constant elasticity k of donations with re-
spect to the the value of donations (v j +m j) can be rewritten as30
30Using
k =v j +m j
dnj
∂dnj
∂ (v j +m j)=
v j +m j
dnj
∂dnj
∂m j
35

∂
∂m j
[c(dn
j )
dnj
]= k−
c(dnj )
dnj
k(v j +m j)
using c′′(d) > 0, c′(d) > 0, and c(0) = 0, we know that 0 ≤ c(dnj )
dnj≤ (v j +m j). In turn,
k ≤ 1 is sufficient condition for ∂
∂m j
[c(dnj )
dnj
]≤ 1.
Under the same conditions, E(dnj |A j) is increasing in m j. This is because, as we have
shown, larger incentives drive less altruistic types out of A j(m j) and because∂dn
j∂m j
> 0
for any v j.
A.2. Impure Altruism
In this section, we consider the properties of a model in which individuals have de-
creasing marginal utility from aggregate donations to the charity. We model this as
ui = (vi +mi)di +g(di +d j)−c2
d2i (A.1)
where we can now distinguish between warm-glow and pure altruism in an impure
altruism function that is linear in warm glow vidi and has pure altruism g(D) with
g′(D)> 0, but g′′(D)< 0. In addition, we require that | cg′′(D)c−g′′(D) |< 1 in order to guarantee
interior solutions. The Nash equilibrium in this game is characterized by an analogue
to equation 2.3:
di =mi + vi +g′(di +d j)
c(A.2)
and the corresponding condition for j. Performing comparative statics on A.2 show
that an agent’s donations are increasing in her own incentives, holding those of her
peer constant:
∂d j
∂m j= c
c−g′′
(c−g′′)2− (cg′′)2 > 0 (A.3)
36

Notice that the denominator in A.3 is positive because of the existence condition for
interior solutions. For the impact of the peer’s incentive on an agent, we find that
∂di
∂m j=
cg′′
c−g′′∂d j
∂m j< 0 (A.4)
Thus, with (global) diminishing marginal utility from donations to the charity, an
agent’s donations are strictly decreasing in her peer’s incentives, as claimed in the
text.
A.3. Incentive Inequality
One possible objection to leveraging heterogeneous monetary incentives to act proso-
cially for investigating the conformity channel of social influence is that incentive in-
equality in itself could be a source of strategic complementarities in donations. Recent
research from Breza et al. (2017) shows that unjustifiably heterogeneous incentives
in work environment can introduce a form of inequity aversion (Fehr and Schmidt,
1999) that damages morale to exert effort. The morale effect of incentive inequality is
a salient form of inequity aversion even when opportunities for comparing realized
payoffs are limited, and remains meaningful when payoff disparities depend on ef-
fort (rather than allocation decisions). In this section, we illustrate when this form of
inequity aversion can induce strategic complementarities in donations.
Consider a simple model of prosocial behavior similar to the one presented in ap-
pendix A.1, and replace the conformity term with the morale utility term from Breza
et al. (2017).
U(di) = (vi +mi)di−c2
d2i +M(mi,m j)di (A.5)
Morale M(·), as illustrated below, is a function of the gap in incentives between i
and j, and allows for additional direct psychological incentive effects. Parameters α
and β capture the extent to which people differentially dislike disadvantageous and
advantageous inequality, respectively. The function g(mi) captures any sort of direct
psychological effects of incentives, and f (·) is monotonically increasing in the gap
between incentives and satisfies f (0) = 0.
37

M(mi,m j) = g(mi)−α f (mi−m j|mi < m j)−β f (m j−mi|mi > m j)
From this simple model we can derive the closed form of the optimal donation level,
which is interpreted in the prediction that follows.
d∗i = c−1 [vi +mi−α f (mi−m j|mi < m j)−β f (m j−mi|mi > m j)+g(mi)]
Prediction (Incentive Inequality). If donor’s morale is damaged by incentive inequality, (i)
at any mi, i’s donations are monotonically decreasing in the size of incentive inequality, and (ii)
an increase (decrease) in either i’s or j’s incentives that reduces (increases) incentive inequality
increases (decreases) donations of both i and j.
The obvious implication of (i) is what we label a main diagonal condition: holding
i’s incentives constant, i’s donations should be highest when incentives are homoge-
neous, and monotonically decreasing in the size of the mi−m j gap.
Part (ii) further illustrates when incentive inequality introduces strategic comple-
mentarities in donations. However, notice how an increase (decrease) in m j that accen-
tuates (reduces) the gap between mi and m j decreases (increases) di and has a mixed
effect on d j – strengthening the strategic substitution of donations when the direct in-
centive effect on d j dominates the negative (positive) effect of increased (decreased)
inequality on j’s morale.
38

B. Empirical Appendix
B.1. Morale Effects of Incentive Inequality
In this section, we test for the morale effects of incentive inequality using a joint test of
the main diagonal condition that the model in Appendix A.3 implies.
The test of this joint hypothesis builds on Burks et al. (2009). We treat average do-
nations in the nine incentivized treatments of our experiment as a nine-dimensional
normal distribution with means µ pi,p j(which we treat as unknown) and diagonal co-
variance matrix Σ = σ2pi,p jI (which we treat as known). For the joint test, we use
maximum likelihood to determine the vector µ̂ pi,p jthat best fits the nine dimensional
vector of sample means Donationpi,p j - with and without the inequality constraints im-
posed by the main diagonal condition. A Likelihood Ratio test from the constrained and
unconstrained likelihood functions is used to jointly assess these constraints. The test
statistic is χ2(d) distributed with degrees of freedom d equal to the number of binding
inequality constraints.
Table B.5 reports the raw first moments of the nine-dimensional distribution, the
moments estimated with constrained Maximum Likelihood (constrained by the main
diagonal condition), and the corresponding Likelihood Ratio tests. Both for the whole
sample, and splitting the sample by oneness. Looking at the whole sample, one can
notice qualitative violations of the main diagonal condition that cause the constrained
estimates of the first moments to differ from the raw means. However, such violations
are not sufficiently strong to reject the joint hypothesis (p = 0.391).
Next, we test the restriction on the samples split by oneness. In panel (b), we con-
firm that the restrictions imposed by inequity aversion cannot be rejected among low
oneness subjects (p = 0.737). In panel (c), we strongly reject the main diagonal condi-
tion among high oneness subjects (p = 0.002). To understand how inequity aversion
is rejected for more socially close subjects, it is worth interpreting the two main local
violations that determine the results of the joint test. The first local violation is due to
the change in average donations between groups of players who get randomized out
of incentives: increases in their peer’s incentives – that ceteris paribus increase incentive
inequality – increase their own donations. This result is clearly inconsistent with the
39

morale effects of incentive inequality, and is also inconsistent with a concave altruistic
utility of giving.31 The second local violation is due to the change in average dona-
tions between groups of players who get randomized into relatively high incentives
(good news): decreases in their peers’ incentives – that ceteris paribus increase incentive
inequality – increase their own donations. This result is significant for the decrease in
peers’ incentives from high to moderate, and may be explained by substitution due to
concave (altruistic) utility of giving. However, evidence that expectations about peers’
levels of giving are virtually identical between these two groups makes this explana-
tion unlikely.
The main diagonal condition has a mirror set of conditions on beliefs across treat-
ments. Table B.6 also shows rejection of the conditions imposed by the morale effects
on incentive in equality on beliefs.
Taken together, the results of the analyses highlight that the complementarities ob-
served in the data are at variance with the predictions of inequity aversion. This con-
trast is particularly stark among subjects with closer connection to their peer, which
leaves our conformity framework as the more plausible explanation for our findings.
B.2. Additional Tables
31The standard framework of inequity aversion (Fehr and Schmidt, 1999), is less tractable in our settingbecause realized payoff inequality depends both on incentives provided and effort choices. Such aframework does however make the clear prediction that peer’s incentives should not affect individualdonations when an agent gets no incentives, and the t-test for one of the two local violations (µ̂n,n = µ̂n,m)reported in Table B.5 panel (c) provides evidence against this prediction.
40

Table B.5: Average Donations in Lottery Treatments, Maximum Likelihood Estimates(Coefficient Estimates and Standard Errors in Parentheses)
(a) Full sample Data θ̂ MLconstrained
Incentives to peer Incentives to peer Main Diagonal
Zero Moderate High Zero Moderate High p-value(1) (2) (3) (4) (5) (6) (7)
Ince
ntiv
esto
self Zero 3.233 3.417 3.190 3.320 3.320 3.190 LR: χ2
(2) = 1.877 0.391(0.217) (0.230) (0.209) (0.217) (0.230) (0.209)
Moderate 5.042 5.546 5.155 5.042 5.546 5.155 Local Violations: t-tests(0.233) (0.235) (0.224) (0.233) (0.235) (0.224) H0: µ̂n,n = µ̂n,m 0.551
High 5.299 5.575 5.187 5.299 5.366 5.366 H0: µ̂h,m = µ̂h,h 0.215(0.233) (0.229) (0.212) (0.233) (0.229) (0.212)
(b) Low oneness Data θ̂ MLconstrained
Incentives to peer Incentives to peer Main Diagonal
Zero Moderate High Zero Moderate High p-value(1) (2) (3) (4) (5) (6) (7)
Ince
ntiv
esto
self Zero 3.190 2.667 2.593 3.190 2.667 2.593 χ2(1) = 0.113 0.737
(0.320) (0.304) (0.299) (0.320) (0.304) (0.299)Moderate 4.778 5.105 4.622 4.778 5.105 4.622 Local Violations: t-tests
(0.337) (0.339) (0.332) (0.337) (0.339) (0.332) H0: µ̂h,n = µ̂h,h 0.727High 5.549 4.889 5.382 5.456 4.889 5.456
(0.370) (0.323) (0.331) (0.370) (0.323) (0.331)
(c) High oneness Data θ̂ MLconstrained
Incentives to peer Incentives to peer Main Diagonal
Zero Moderate High Zero Moderate High p-value(1) (2) (3) (4) (5) (6) (7)
Ince
ntiv
esto
self Zero 3.270 4.099 3.614 3.635 3.635 3.614 χ2
(2) = 12.443 0.002(0.295) (0.333) (0.285) (0.295) (0.333) (0.285)
Moderate 5.263 5.913 5.627 5.263 5.913 5.627 Local Violations: t-tests(0.322) (0.323) (0.298) (0.322) (0.323) (0.298) H0: µ̂n,n = µ̂n,m 0.057
High 5.103 6.293 5.034 5.103 5.581 5.581 H0: µ̂h,m = µ̂h,h 0.003(0.297) (0.316) (0.277) (0.297) (0.316) (0.277)
Notes: Degrees of freedom of the Likelihood Ratio test statistic equal the number of binding inequality constraints imposedby the composite null hypothesis. Empirical standard errors of the means are directly fed into the maximum likelihoodroutine.
41

Table B.6: Average Beliefs in Lottery Treatments, Maximum Likelihood Estimates(Coefficient Estimates and Standard Errors in Parentheses)
(a) Full sample Data θ̂ MLconstrained
Incentives to self Incentives to self Main Diagonal
Zero Moderate High Zero Moderate High p-value(1) (2) (3) (4) (5) (6) (7)
Ince
ntiv
esto
peer Zero 2.540 2.585 2.374 2.561 2.561 2.374
χ2(2) = 6.277 0.043
(0.182) (0.193) (0.174) (0.182) (0.193) (0.174)Moderate 4.331 4.832 4.100 4.331 4.832 4.100
(0.215) (0.214) (0.201) (0.215) (0.214) (0.201)High 4.637 5.086 4.374 4.637 4.708 4.708
(0.208) (0.207) (0.195) (0.208) (0.207) (0.195)
(a) Full sample Data θ̂ MLconstrained
Incentives to self Incentives to self Main Diagonal
Zero Moderate High Zero Moderate High p-value(1) (2) (3) (4) (5) (6) (7)
Ince
ntiv
esto
peer Zero 2.124 2.053 1.754 2.124 2.053 1.754
χ2(1) = 0.041 0.840
(0.241) (0.264) (0.225) (0.241) (0.264) (0.225)Moderate 3.703 3.992 3.357 3.703 3.992 3.357
(0.303) (0.296) (0.262) (0.303) (0.296) (0.262)High 3.907 4.301 4.213 3.907 4.256 4.256
(0.316) (0.310) (0.303) (0.316) (0.310) (0.303)
(a) Full sample Data θ̂ MLconstrained
Incentives to self Incentives to self Main Diagonal
Zero Moderate High Zero Moderate High p-value(1) (2) (3) (4) (5) (6) (7)
Ince
ntiv
esto
peer Zero 2.890 3.032 2.859 2.959 2.959 2.859
χ2(3) = 12.248 0.007
(0.265) (0.272) (0.249) (0.265) (0.272) (0.249)Moderate 4.901 5.530 4.878 4.901 5.530 4.878
(0.297) (0.292) (0.293) (0.297) (0.292) (0.293)High 5.157 5.783 4.500 5.124 5.124 5.124
(0.270) (0.267) (0.254) (0.270) (0.267) (0.254)
Notes: Degrees of freedom of the Likelihood Ratio test statistic equal the number of binding inequality con-straints imposed by the composite null hypothesis. Empirical standard errors of the means are directly fed intothe maximum likelihood routine.
42

Table B.7: OLS for Determinants of Social Proximity(Coefficient Estimates and Standard Errors in Parentheses)
Outcome: Oneness scale (1) (2)
Contact 1.434∗∗∗
(0.057)Male 0.120∗ 0.139∗∗
(0.062) (0.056)Same gender 0.236∗∗∗ 0.180∗∗∗
(0.061) (0.056)Age, absolute difference -0.003 -0.001
(0.003) (0.003)Experience, absolute difference -0.080∗∗∗ -0.072∗∗∗
(0.024) (0.022)Constant 3.051∗∗∗ 2.118∗∗∗
(0.122) (0.116)
Observations 2914 2914R2 0.014 0.189Correlation in regression residuals (oneness scale) between peers 0.294 (0.340) 0.167 (0.340)
∗p < 0.10; ∗∗p < 0.05; ∗∗∗p < 0.01Notes: All specifications include age group, experience, and session dummies. Standard errors
are clustered at the pair level.
Table B.8: Incentive Effects on Donations(Coefficient Estimates and Standard Errors in Parentheses)
Outcome: Donations (1) (2)
Lottery -0.763∗∗∗ -0.835∗∗∗
(0.288) (0.282)Incentives to self (baseline: Zero)Moderate 1.968∗∗∗ 1.968∗∗∗
(0.184) (0.181)High 2.090∗∗∗ 2.058∗∗∗
(0.180) (0.177)Incentives to peer (baseline: Zero)Moderate -0.286 -0.195
(0.258) (0.255)High -0.287 -0.263
(0.261) (0.258)Moderate ×High oneness 1.170∗∗∗ 1.049∗∗∗
(0.349) (0.343)High ×High oneness 0.486 0.445
(0.332) (0.328)Constant 3.906∗∗∗ 4.680∗∗∗
(0.262) (0.345)
Controls No YesObservations 2914 2914
∗p < 0.10; ∗∗p < 0.05; ∗∗∗p < 0.01Notes: Specification with controls includes age group, ex-
perience, and session dummies. Standard errors are clus-tered at the pair level.
43

B.3. Additional Figures
Figure B.3: Joint Problem Solving Task Software Interface
44

Figure B.4: Elicitation of the IOS (top) and WE (bottom) Scales
45

Figure B.5: Elicitation of Beliefs and Donations, and Treatment Assignment
46

Figure B.6: Distribution of Social Proximity Scales0
.1.2
.3.4
Frac
tion
1 2 3 4 5 6 7IOS/WE Scale
IOS Scale WE Scale
0.0
5.1
.15
.2.2
5Fr
actio
n
1 1.5 2 2.5 3 3.5 4 4.5 5 5.5 6 6.5 7Oneness Scale
47

Figure B.7: Cumulative Density Function of Donations in Control Treatment, byOneness Above/Below Median
Kolmogorov-Smirnov test, p-value = 0.9730
.2
.4
.6
.8
1
Cum
ulat
ive
Prob
abili
ty
0 2 4 6 8 10Number of Donations
Low oneness High oneness
48

C. Complete Instructions
C.1. Page 0: Consent
Please read this before clicking "Accept"
This HIT is an academic experiment on economic decision making. Based on how
you play the experiment, we will donate money to a charitable organization.
By participating in this experiment, you are participating in a study performed by
researchers at the University of Bonn. All data collected in this study are for research
purposes only.
The experiment requires you to press keys on your keyboard. You thus need full
dexterity in at least one hand. The experimental software complies with modern web
standards, but may require a physical keyboard to detect your keystrokes. For part of
the experiment you will be interacting with another player. To ensure that interactions
occur in a timely manner we give each participant 5 minutes maximum to complete
each of the following two pages. For the rest of the experiment a session timeout
applies. Your session expires 40 minutes after you accept this HIT. If you do not want
to complete the HIT within 40 minutes, we advise to return the HIT. We will not be
able to approve work for timed out HITs.
Compensation: After completing this HIT, you will receive your reward plus a
bonus payment that is based on how you play the experiment.
Legal information: Your participation is voluntary. You may stop participating at
any time by closing the browser window or the program to withdraw from the study.
Any reports and presentations about the findings from this study will not include any
information that could identify you. We may share the data we collect in this study
with other researchers doing future studies; if we share your data, we will not include
any information that could identify you. By accepting this HIT, you indicate that you
are older than 18 years and agree to participate in this experiment.
49

C.2. Page 1: Introduction
In this study each participant will be given the opportunity to engage independently
in a real effort game. By participating you create value for a charity.
Part of your variable bonus may be uncertain. For this we will ask you to pick a
number between 1 and 6, which the experimental software will match to a digital roll
of die.
What face of a die would you pick? [drop-down list]
For this experiment you will be paired to another player that is currently participat-
ing in the same experiment. Given that part of the experiment will involve common
problem solving, we would like pairs of players to get to know each other. For this, on
the next page we are collecting some basic socio-demographic information, which will
be shared with the paired participant. The socio-demographic information collected
is minimal and does not make you personally identifiable.
Throughout the experiment, you will engage in tasks that will determine your vari-
able bonus. Completing tasks you accumulate tokens. Tokens are converted to USD
at the end of the HIT. One token is worth 0.005 USD.
This experiment is a research effort to understand economic behavior. In what fol-
lows there will be no deception: we will do nothing different from what is explained
to you. For any question do not esitate to contact us.
C.3. Page 2: Survery on Demographic Information
We would like paired players to know a bit about each other. For this, we are collect-
ing some basic socio-demographic information, which will be shared with the other
participant.
What is your first name? [text field]
What is your age? [drop-down list]
What is your gender? [drop-down list]
For how long have you been a turker? [drop-down list]
50

C.4. Page 3: Wait Page
Please wait. Pairs are being formed.32
C.5. Page 4: Joint Problem Solving Task
32At this point of the experiment, each subject gets paired, randomly and anonymously, to another studyparticipant.
51

C.6. Page 5: Oneness Elicitation
C.7. Page 6: Instructions for Donations
You will be able to engage in charitable giving by working on a simple assignment.
Please carefully read the instructions below. Shortly, you will have the chance to fa-
miliarize yourself with this assignment in a training session. This will not affect your
donation or payoffs. After the training, we will explain the payoffs for this task.
The assignment involves consecutively pressing the keys w e on your keyboard.
You need to press the keys in this order. The keys are highlighted on the keyboard
below. The software will display the number of successfully completed sequences.
You generate a donation to Doctors without Borders by completing a given number
of sequences. A bar will indicate your progress towards this number.
In this example, you are asked to complete 100 keystroke sequences to generate a
donation. Remember that this is just an example so that you can familiarize yourself
with this assignment.
Please complete the training by pressing w e on your keyboard.
C.8. Page 7: Elicitation of Beliefs and Donations, and Treatment
Assignment
You can choose to generate 50 tokens donations to Doctors Without Borders (DWB) by
completing 100 keystroke sequences for each donation.
52
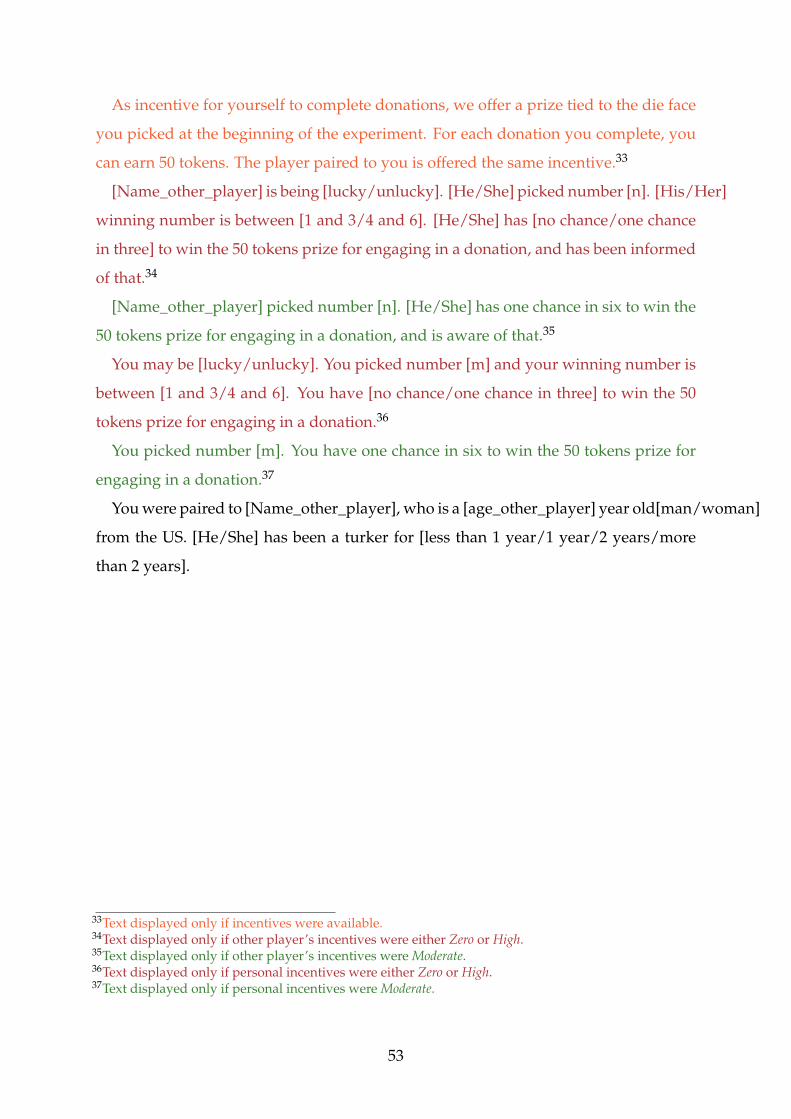
As incentive for yourself to complete donations, we offer a prize tied to the die face
you picked at the beginning of the experiment. For each donation you complete, you
can earn 50 tokens. The player paired to you is offered the same incentive.33
[Name_other_player] is being [lucky/unlucky]. [He/She] picked number [n]. [His/Her]
winning number is between [1 and 3/4 and 6]. [He/She] has [no chance/one chance
in three] to win the 50 tokens prize for engaging in a donation, and has been informed
of that.34
[Name_other_player] picked number [n]. [He/She] has one chance in six to win the
50 tokens prize for engaging in a donation, and is aware of that.35
You may be [lucky/unlucky]. You picked number [m] and your winning number is
between [1 and 3/4 and 6]. You have [no chance/one chance in three] to win the 50
tokens prize for engaging in a donation.36
You picked number [m]. You have one chance in six to win the 50 tokens prize for
engaging in a donation.37
You were paired to [Name_other_player], who is a [age_other_player] year old[man/woman]
from the US. [He/She] has been a turker for [less than 1 year/1 year/2 years/more
than 2 years].
33Text displayed only if incentives were available.34Text displayed only if other player’s incentives were either Zero or High.35Text displayed only if other player’s incentives were Moderate.36Text displayed only if personal incentives were either Zero or High.37Text displayed only if personal incentives were Moderate.
53

How many donations would you expect
[Name_other_player] to complete? (you will
earn 20 tokens if your guess is correct)
How many donations would you like to gen-
erate yourself?
0 Donations (0 tokens for DWB) 0 Donations (0 tokens for DWB)
1 Donation (50 tokens for DWB, and one
chance in [six/three] to earn 50 tokens for
[him/her]self)
1 Donation (50 tokens for DWB, and one
chance in [six/three] to earn 50 tokens for
yourself)
2 Donations (100 tokens for DWB, and one
chance in [six/three] to earn 100 tokens for
[him/her]self)
2 Donations (100 tokens for DWB, and one
chance in [six/three] to earn 100 tokens for
yourself)
3 Donations (150 tokens for DWB, and one
chance in [six/three] to earn 150 tokens for
[him/her]self)
3 Donations (150 tokens for DWB, and one
chance in [six/three] to earn 150 tokens for
yourself)
4 Donations (200 tokens for DWB, and one
chance in [six/three] to earn 200 tokens for
[him/her]self)
4 Donations (200 tokens for DWB, and one
chance in [six/three] to earn 200 tokens for
yourself)
5 Donations (250 tokens for DWB, and one
chance in [six/three] to earn 250 tokens for
[him/her]self)
5 Donations (250 tokens for DWB, and one
chance in [six/three] to earn 250 tokens for
yourself)
6 Donations (300 tokens for DWB, and one
chance in [six/three] to earn 300 tokens for
[him/her]self)
6 Donations (300 tokens for DWB, and one
chance in [six/three] to earn 300 tokens for
yourself)
7 Donations (350 tokens for DWB, and one
chance in [six/three] to earn 350 tokens for
[him/her]self)
7 Donations (350 tokens for DWB, and one
chance in [six/three] to earn 350 tokens for
yourself)
8 Donations (400 tokens for DWB, and one
chance in [six/three] to earn 400 tokens for
[him/her]self)
8 Donations (400 tokens for DWB, and one
chance in [six/three] to earn 400 tokens for
yourself)
9 Donations (450 tokens for DWB, and one
chance in [six/three] to earn 450 tokens for
[him/her]self)
9 Donations (450 tokens for DWB, and one
chance in [six/three] to earn 450 tokens for
yourself)
10 Donations (500 tokens for DWB, and one
chance in [six/three] to earn 500 tokens for
[him/her]self)
10 Donations (500 tokens for DWB, and one
chance in [six/three] to earn 500 tokens for
yourselfa )
aText displayed only if private incentives areavailable with positive ex-interim probability.
54

C.9. Page 8: Donation Task
You have chosen to make [D] donations. For this you will have to complete [D×100]
keystroke sequences to generate these donations
Please complete the donation to Doctors without Borders by pressing w e on your
keyboard.
C.10. Page 9: Short Questionnaire
Thank you for completing the donation task. Please fill out the short questionnaire
below and then go to the next page to review payoffs and complete the HIT.
You and your partner could earn 20 tokens for guessing correctly how many do-
nations the other did. Aside from the guessing question, was it clear to you that the
number of donations that YOU made was not directly affecting the payoff of the
other player? [Yes/No]
You and your partner could earn 20 tokens for guessing correctly how many do-
nations the other did. Aside from the guessing question, was it clear to you that the
number of donations that the OTHER made was not directly affecting your payoff?
[Yes/No]
Did you realize that the amount donated to charity was increasing in the dona-
tions that both you and the other player made? [Yes/No]
In choosing how many donations to make, were you influenced by the thought of
the number of donations the other person was going to make? [Yes/No]
Expecting that the other person could make more donations, makes you want to
donate [More/Less/Indifferent]
In other contexts, when you are about to make a charitable donation, do you ever
consider whether and how much other people are contributing to the same cause?
[Always/Very often/Sometimes/Rarely/Never]
In other contexts, when you are about to make a charitable donation, expecting
that other people could make more donations, makes you want to donate [More/-
Less/Indifferent]
Please recall the screen where you chose how many donations to make. What
55

were the chances YOU had to win the lottery for participating in the donation task?
[No chances/One chance in six/One chance in three/Cannot recall]
Please recall the screen where you chose how many donations to make. What
were the chances the OTHER player had to win the lottery for participating in the
donation task? [No chances/One chance in six/One chance in three/Cannot recall]38
38Questions displayed only if incentives were available.
56