
Social integration of organizational newcomers ...
65
1 Social integration of organizational newcomers: Socialization tactics and emotional stability in relation to access to resources and social integration. Master thesis - Tilburg University Faculty of Social and Behavioral Sciences 2017-2018 Author R.K.J. Valk ANR 504698 EMPLID 1274087 Supervisor dr. S. Batistič Second reader dr. R.F. Poell Theme Socialization process Project period September 2017 – May 2018
Transcript of Social integration of organizational newcomers ...

1
Social integration of organizational newcomers:
Socialization tactics and emotional stability in relation to access to
resources and social integration.
Master thesis - Tilburg University
Faculty of Social and Behavioral Sciences
2017-2018
Author R.K.J. Valk
ANR 504698
EMPLID 1274087
Supervisor dr. S. Batistič
Second reader dr. R.F. Poell
Theme Socialization process
Project period September 2017 – May 2018

2
Abstract
When a newcomer enters an organization, the organizational socialization process starts.
In this period the new employee acquires the attitudes, behavior, and knowledge they need to
be a participating member in the organization but also to socially integrate. A model based on
the uncertainty reduction theory has been created to explore the relationships between serial
socialization tactics and social integration mediated by access to resources and information.
Furthermore, emotional stability is included as a moderator in the relationship between serial
socialization tactics and access to resources and information. This research is a case study, the
data were collected within a large international company with its headquarters in the
Netherlands. A survey has been distributed to all newcomers who had been at the company for
one to three months. This resulted in a total of 504 respondents. The results, based on a multiple
regression analysis, demonstrate that resources and information partially mediate the
relationship between serial socialization tactics and social integration. This suggests that serial
socialization tactics are positively related to the access new hires have to resources and
information and is also positively related to the social integration of a new hire. Additionally
the results reveal that emotional stability does not moderate the relationship between serial
socialization tactics and access to resources and information. Based on the results, the paper
presents several theoretical and practical implications.
Keywords: Socialization tactics, serial tactics, access to resources and information, social
integration, emotional stability

3
Introduction
Organizational socialization is the process through which an individual acquires the
attitudes, behavior, and knowledge needed to participate as an organizational member (Van
Maanen & Schein, 1979). Within this process, there are two main factors: first, the perspective
of the employee who is trying to define his or her role within the organization, and second, the
perspective of the organization that is seeking to influence and shape its new members (Fisher,
1986). It is therefore apparent that both the newcomer and the organization influence the
socialization process (Reichers, 1987). The individual becomes part of the organization,
meaning that the newcomer can influence the organization; on the other hand, the organization
also has an impact on the individual (Anderson, Riddle, & Martin, 1999). Both the individual
and organization can benefit from a smooth socialization process (among other advantages, it
reduces uncertainty, increases job satisfaction, and passes on organizational culture; Carr,
Pearson, Vest, & Boyar, 2006; Fisher, 1986; Louis 1990). However, ineffective socialization
can have noticeable consequences for the organization. Fisher (1986) has argued that ineffective
socialization results in turnover intention, which then leads to a loss of productivity and disrupts
work, a costly consequence (Shaw, Gupta, & Delery, 2005; Louis, 1990). Investments in
recruitment and training are wasted, as they result in increased costs (Kammeyer-Mueller &
Wanberg, 2003). This illustrates the importance of a carefully considered socialization process.
One of the main research topics in the socialization literature is socialization tactics.
Different studies have collected empirical evidence that links socialization tactics to newcomer
adjustment such as learning (e.g., task mastery, organizational knowledge, and role clarity) and
assimilation (e.g., social integration; Bauer, Morrison, & Callister, 1998; Bauer, Bodner,
Erdogan, Truxillo, & Tucker, 2007; Saks & Ashforth 1997a). Within this research the focus
will be on the investiture and serial tactics as these are assumed to contribute to the relationships
newcomers develop with organizational insiders. The link between socialization tactics and the
social integration of a newcomer has been confirmed by previous studies, but there is little
research that examines the mediating mechanisms (e.g., social capital, knowledge acquisition,
and the influence of personal characteristics). Multiple scholars (Fang, Duffy, & Shaw, 2011;
Bauer et al., 1998; Saks & Ashforth, 1997a) have called for more research to examine these
mechanisms.
During organizational socialization, new hires arrive in an uncertain situation, in which
they have to learn quickly and integrate into different social groups (Berger, 1979). The
uncertainty reduction theory argues that newcomers to an organization desire to increase the

4
predictability of interactions between themselves and others (Berger & Calabrese, 1975).
Therefore, the new hire is motivated to reduce this uncertainty to a manageable level. This can
be achieved by newcomers seeking resources and information. Social interaction with
colleagues helps the new employee better understand his or her environment (Saks & Ashforth,
1997). Both organizational and individual socialization factors help new employees to find
resources and information through interacting and communicating with insiders. Previous
research from Fang et al. (2011) has proposed social capital as a mediating mechanism; that
study explained that social resources are embedded in social networks and explored how
individuals can achieve certain goals by using those networks. Lin (1999) has defined social
capital as resources that are embedded in a social structure. Information and resources are
accessible when an individual engages in purposive actions. This definition distinguishes
among three different factors: resources that are embedded in a social structure, the extent to
which such social resources are accessible to an individual, and the mobilization of such social
resources via purposive actions. Socialization tactics can help to develop relationships that will
provide individuals with access to resources and information (Fang et al., 2011) and will
eventually lead to better social integration (Bauer et al., 1998; Bauer et al., 2007; Saks &
Ashforth 1997a).
Every employee is different and copes in a unique way with a new and uncertain
environment. Personal characteristics are expected to influence the way in which employees
build relationships to obtain access to resources and information (Anderson, 2008). The Big
Five personality traits are extraversion, conscientiousness, agreeableness, emotional stability,
and openness. This research focuses on emotional stability. It is believed that scoring low on
emotional stability affects people’s social skills and sociability (Digman, 1990; Furukawa,
Sarason, & Sarason, 1998), which can result in smaller social networks. (Kalish & Robins,
2006). Judge, Erez, Bono, and Thoresen (2003) have reported that emotional stability plays an
important role in an individual’s fundamental beliefs about his or her own competence and self-
worth. It is therefore less likely that he or she will socialize with other members of the
organization to seek information, even if the company provides the opportunity (Grumam &
Saks, 2011).
During the socialization process, newcomers are presented with social networking
opportunities. Anderson (2008) has claimed that there is reason to believe that individual
differences affect the way they take advantage of these opportunities. His view suggests that
personality traits could have a moderating effect. Therefore, emotional stability is used as a
moderator in the relationship between socialization tactics and access to resources and

5
information. It is proposed that employees with a high level of emotional stability have more
access to resources and information when presented with serial and investiture socialization
tactics.
This study aims to make two contributions to the socialization field. First, while it
follows the work of Fang et al. (2011), Bauer et al. (1998), Bauer et al. (2007), and Saks and
Ashforth (1997a), it differs from these past studies by researching access to resources and
information and how this mediates the relationship between socialization tactics and social
integration. Second, it explores the personality trait emotional stability as a moderator.
This results in the following research questions: To what extent does access to resources
and information mediate the effects of investiture and serial socialization tactics on social
integration? And to what extent does the personality trait emotional stability moderate the
effects of investiture and serial socialization tactics to access to resources and information?
Theoretical Framework
Socialization tactics in relation to access to resources and information
Van Maanen and Schein (1979) have described socialization tactics as “the ways in
which the experiences of individuals in transition from one role to another are structured for
them by others in the organization” (p.230). They have proposed six different tactics that
organizations can use to achieve the desired outcome from newcomers. The first tactic is formal
versus informal (distinguishing newcomers from regular organizational members or seeing
them as part of the same group). The second tactic is collective versus individual (socializing
new members as a group or individually). The third tactic is sequential versus random (a clear
process or a random choice of activities). The fourth tactic is fixed versus variable (clear
information about the steps that need to be taken or no clear overview of what needs to be done).
The fifth tactic is serial versus disjunctive (a newcomer is trained by an experienced staff
member or there is no formal support). The sixth and final tactic is investiture versus divestiture
(the identity and personality of the newcomer are accepted, or the organization encourages the
newcomer to reject his or her prior identity).
The six tactics named by van Maanen and Schein (1979) have been frequently
researched and reviewed. Based on empirical research, Jones (1986) has proposed that the six
bipolar tactics (collective, formal, sequential, fixed, serial, and investiture) collectively
constitute institutionalized socialization. These tactics provide new hires with a structured and
formalized socialization experience that reduces uncertainty. Furthermore, different studies

6
have found that institutionalized socialization is negatively related to role ambiguity, role
conflict, and turnover intentions; however, it is positively related to job satisfaction and
organizational commitment (Allen & Meyer, 1990; Ashforth & Saks, 1996; Ashforth, Sluss, &
Saks, 2006). Conversely, Jones (1986) referred to individual, informal, random, variable,
disjunctive, and divestiture tactics as individualized socialization. These tactics help
newcomers question the current situation and innovate in their new roles. Jones not only divided
the six tactics into institutionalized and individualized socialization, based on factor analysis,
but also concluded that the six tactics can be grouped into three subgroups. First, social factors
which exist out of serial and investiture tactics. Jones (1986) proposed that these are the most
important because they provide employees with social cues and facilitate learning. The second
group is the content factors; formed by sequential and fixed tactics, these focus on the content
of the information. The third subgroup is context, containing formal and collective tactics. This
explains how an organization provides information.
This research focuses on the tactics that are assumed to contribute to the relationships
newcomers develop with organizational insiders. Saks, Uggerslev, and Fassina (2007) tested
the three factors of Jones (1986) in their meta-analytic review and also found that social tactics
are the main predictors of newcomer adjustment. Moreover, the research found that social
tactics are strongly related to the access newcomers have to social capital. Therefore, the first
tactic that is examined is investiture (versus divestiture). Investiture tactics present newcomers
with social support, which can provide them with positive feedback, help them to develop
relationships, and enable them to gain feelings of competence and confidence within these
interactions (Allen, 2006). These positive interactions with supportive organizational members’
tactics help new hires to feel accepted (Cable and Parsons, 2001).
The second set of tactics related to building relations and achieving social integration is
serial (versus disjunctive) tactics. A newcomer may be assigned to an experienced staff member
who will serve as a mentor and role model, or conversely, no formal support may be in place
(Van Maanen & Schein, 1979; Batistic, 2017). Serial tactics give experienced organizational
members the chance to act as role models and provide the new hire with access to particular
resources and information (Fang, et al., 2011). Moreover Bauer et al. (2007) found in their
meta-analytic review that fixed, serial, and investiture tactics are significantly correlated with
social acceptance.
The meta-analytical review of Saks et al. (2007) supports the proposition that investiture
and serial socialization tactics are the most strongly related to newcomers’ access to social
capital. They also found that these tactics are predictors of both proximal (e.g., role conflict and

7
role ambiguity) and distal (organizational commitment, job satisfaction, and turnover intention)
outcomes.
Investiture and serial socialization tactics provide newcomers with access to
experienced organizational members who act as role models and give newcomers social support
and feedback. These elements are necessary to develop relationships and gain confidence in
those interactions (Allen, 2006; Ashforth & Saks, 1996; Cable & Parsons, 2001). The tactics
also guide newcomers to the right resources and information, helping them to interact and
communicate with organizational insiders and to thereby enhance their networks (Fang, et al.,
2011). Therefore, the expectation is that serial and investiture tactics help new employees to
receive accurate, systematic, and consistent information from appropriate sources (Fang, et al.,
2011). This assumption leads to the first two hypotheses:
Hypothesis 1: Investiture socialization tactics are positively related to access to resources and
information.
Hypothesis 2: Serial socialization tactics are positively related to access to resources and
information.
Access to resources and information in relation to social integration
According to Fisher (1986), during organizational entry, new employees feel that they
need to reduce uncertainty about tasks, roles, and social transitions. Researchers have defined
three main goals that newcomers must accomplish in order to successfully integrate. The first
goal is to have a task transition wherein learning the tasks and gaining confidence in the role
are important. The second goal is resolution of role demands, which emphasizes understanding
of the tasks involved. The third goal is the social transition, which relates to feeling accepted
within the organization (Fischer, 1986; Morrison, 2002; Feldman, 1981).
Within this research, the focus is on social transition, also called social integration. The
aim is to identify how access to resources and information is related to social integration. Social
integration has a strong and potentially lasting impact on distal socialization outcomes such as
job performance and attitudes (Bauer et al., 2007; Saks, Uggerslev, & Fassina, 2007).
As mentioned before, socialization is a process influenced not only by organizational
initiatives but also by newcomers (Morison, 1993). A primary way in which newcomers reduce
uncertainty (Berger, 1979) is by seeking resources and information (Ashford, 1986). This also
enables the newcomer to better understand his or her new environment (Ashford & Taylor,

8
1990). A resource during the socialization process could be a colleague who possesses or
controls resources and information that are useful for the new hire in reaching his or her goals
(Seibert, Kraimer, & Liden, 2001).
In most research, social integration is about developing relationships in kind and
quantity; the role of seeking resources and information is often not taken into account (Morison,
1993). “The better the accessible embedded resources, the better embedded resources can and
will be mobilized in purposive actions by an individual” (Lin, 1999:42). Moreover, Blumer
(1969) has argued that the structure of relations is not where the essence of society lies and that
our results are instead dependent on an ongoing process of taking action. This suggests that
relationships between new hires and existing employees are meaningless without action.
Within this research, the focus is on the access that newcomers have to resources and
information, since these are the key means through which social capital is manifested (Seibert
et al., 2001). When newcomers enter an organization, they begin interacting with insiders to
access resources and information. They need to take action to access particular resources and
will start building relationships. By building these relationships with existing members of the
organization, they achieve full social integration (Fang et al., 2011). Access to resources and
information allows newcomers to achieve desired outcomes by supporting the flow of
information, reinforcing a social identity, and building a social network (Burt, 1992; Coleman,
1990; Lin, 1982, 1999). It is expected that access to resources and information helps
newcomers achieve social integration (Fang et al., 2011).
Hypothesis 3: Access to resources and information is positively related to social integration.
Investiture socialization tactics in relation to social integration mediated by access to
resources and information
Investiture socialization tactics are focused on accepting the identity of a new employee.
Newcomers can feel uncertain about being accepted and must begin interacting with
organizational insiders. Investiture tactics also allow organizational insiders to provide
feedback and social support, which directly help employees with the important social or
interpersonal aspects of the socialization process (Allen, 2006). Positive feedback and support
from organizational members lead to greater social acceptance for the new hire. This indicates
a direct relation between investiture socialization tactics and social integration. Bauer et al.
(2007) confirmed that investiture tactics are significantly correlated with the social acceptance
of a newcomer.
9
In line with Hypotheses 1 and 3, it is expected that the direct relationship between
investiture socialization tactics to social integration is partially mediated by access to resources
and information. As mentioned before, investiture tactics directly assist employees with social
or interpersonal aspects of the socialization process. This not only aids social integration but
also is critical for newcomers to obtain access to information and resources (Fang et al., 2011).
By receiving positive feedback and social support, they begin to develop a network and gain
confidence in interactions (Allen, 2006; Ashforth & Saks, 1996), which suggests that
employees feel accepted and socially integrated as a result (Fang et al., 2011; Cable and
Parsons, 2001; Bauer et al., 2007). It is expected that access to resources and information
partially mediates the relationship between investiture tactics and social integration.
Hypothesis 4: The relationship between investiture socialization tactics and social integration
is partially mediated by access to resources and information.
Serial socialization tactics in relation to social integration mediated by access to resources
and information
Serial socialization tactics provide a newcomer with a mentor. The mentor is an
experienced organizational member. Newcomers begin connecting directly with an
organizational insider who is also able to introduce them to other organizational members.
Morrison (2002) has stated that how newcomers are connected with insiders affects how
employees socially integrate. Serial tactics help newcomers to learn about organizational groups
and to build relationships at an early stage, which leads to greater social acceptance (Haueter,
Macan, & Winter, 2003; Bauer et al., 2007; Sonnentag, Niessen, & Ohly, 2004). Bauer et al.
(2007) confirmed that among others, serial tactics are related to social acceptance. It is therefore
expected that there is a direct relationship between serial socialization tactics and social
integration.
In addition, it is expected that the relationship between serial socialization tactics and
social integration is mediated by resources and information. This is in line with Hypotheses 2
and 3. When an experienced colleague is assigned to the newcomer as a mentor, the newcomer
gains direct access to information and resources (Fang et al., 2011). The newcomer is thereby
quickly embedded in the organizational network and given the opportunity to invest in building
relationships (Burt, 1992).

10
Developing these relationships is critical to social integration. It is expected that access
to resources and information partially mediates the relationship between serial socialization
tactics and social integration.
Hypothesis 5: The relationship between serial socialization tactics and social integration is
partially mediated by access to resources and information.
Moderating effect of emotional stability
Research on socialization tactics and related outcomes has mainly taken a “one size fits
all” approach. Within this approach, it is assumed that every new hire prefers the same
socialization tactics and would therefore benefit from the same access to resources and
information (Gruman & Saks, 2011). This approach is from an organizational perspective;
organizations choose particular socialization tactics to reach desired outcomes (Bauer et al.,
1998).
From a social capital perspective, the existing literature has mostly focused on the
structure of relationships between employees; little research has taken into account the personal
characteristics of employees and how these affect social capital benefits (Ibarra, 1992; Kalish,
2006). Ibarra (1992) found evidence that employees may differ in their ability to achieve those
social capital benefits. Anderson (2008) has likewise argued that there is reason to believe that
individual differences may affect the way employees take advantage of social networking
opportunities. However, more evidence is needed regarding whether different personality traits
impact social capital benefits such as access to resources and information (Mehra, Kilduff, &
Brass, 2001; Fang et al., 2011). Anderson’s view indicates a moderating effect of personality
traits. To determine whether there are personal traits that influence the link between
socialization tactics and access to resources and information, this research focuses on the
personality trait emotional stability as a potential moderating variable.
Personality traits such as emotional stability may explain how people react in stressful
situations (Bolger & Schilling, 1991). Being a newcomer in an organization is an uncertain
situation and can be stressful. Watson and Hubbard (1996) have demonstrated that individuals
that score high on emotional stability are more likely to cope well with stressful situations. They
appraise themselves and their environment more positively and are inclined to interpret
uncertain situations in a positive manner (Watson & Clark, 1984). Personality traits explain
individual behavior and stable patterns of behavior, thought, and emotion (Hogan, Hogan, &

11
Roberts, 1996). This indicates a moderating role; emotional stability is a stable pattern that aids
understanding of behavior in a particular situation.
Emotional stability is also referred to as “stability,” “emotionality,” and “neuroticism”
(Borgatta, 1964; Conley, 1985; Hakel, 1974; John, 1989; Lorr & Manning, 1978; Norman,
1963). Traits that are often related to emotional stability are feeling angry, anxious, depressed,
embarrassed, emotional, insecure, or worried (Barrick & Mount, 1991). Employees entering a
new company experience different kinds of feelings, and their perceptions of organizational
activities can be influenced by their emotional stability (Wanberg & Kammeyer-Mueller,
2000). Employees who score high on emotional stability tend to portray uncertain situations in
a positive way and do not feel personally rejected when an organization does not accept their
prior identity. It is therefore likely that they experience less difficulty with stressful situations
(Wanberg & Kammeyer-Mueller, 2000). They are also less likely to experience dysfunctional
job-related thought processes such as overgeneralization and perfectionism (Judge & Locke,
1993). Additionally, Necowitz and Roznowski (1994) state that employees who score high on
emotional stability will be more inclined to recall positive job-relevant information compared
to employees who score low on emotional stability, they will be inclined to recall more negative
job-relevant information. It is therefore expected that employees who score high on emotional
stability benefit more than other employees from the positive relationship between investiture
socialization tactics and access to resources and information.
Hypothesis 6a: High levels of emotional stability strengthen the positive effect of
investiture socialization tactics on access to resources and information and also enhance social
integration.
People who score high on emotional stability tend to have a positive opinion of not only
their surroundings but also themselves, which can result in more interactions with colleagues
and make these individuals more likely to seek out learning opportunities (Judge & Bono,
2001). As mentioned in Hypotheses 1 and 2, serial and investiture tactics are the strongest
predictors of access to social capital. It is expected that this relationship is stronger when
employees score higher on emotional stability. Emotional stability has a positive effect on
people’s social skills and sociability (Digman, 1990; Furukawa, Sarason, & Sarason, 1998).
People who experience more positive emotions at work will be less dependent on others
however their positive attitude will make them a desirable companion, which will work in their
favor when they are building their network (Judge & Locke, 1993; Brief, Butcher, & Roberson,

12
1995). When an organization provides newcomers with opportunities to seek resources and
information, employees that score high on emotional stability are more likely to take advantage
of these chances to socialize and to pursue the resources and information (Gruman & Saks,
2011). It is anticipated that employees who score high on emotional stability benefit even more
from serial socialization tactics. The experienced organizational member assigned to the
newcomer provides him or her with support, feedback, and learning opportunities.
Hypothesis 6b: High levels of emotional stability strengthen the positive effect of serial
socialization tactics on access to resources and information and also enhance social
integration.
Figure 1. Conceptual model. The proposed relationships tested in this study are presented in
this figure.
Methods
Research design and procedure
The research was conducted in close cooperation with the researched company. The
topic, goals, and deadlines of this study were established in consultation with the company.
Based on the needs of the firm and the student’s research goal, the student developed a survey
consisting of 46 items. The English-language survey was distributed digitally via Survey Gizmo
to all the employees who had joined the company within the past one to three months. The study
featured a cross-sectional design and relied on convenience sampling.
The distribution of the survey was achieved by approaching the company’s recruitment
and onboarding managers. They received information about the study and were asked to help
during the data collection process. The survey link, along with a cover letter, was sent directly
to the new hires by e-mail. At that point, the data collection started. A reminder was sent after
four days to increase the number of respondents. The data collected were exported from Survey
Gizmo and imported into IBM SPSS Statistics 24. The cover letter and the questionnaire are
found in Appendix A and Appendix B, respectively.
13
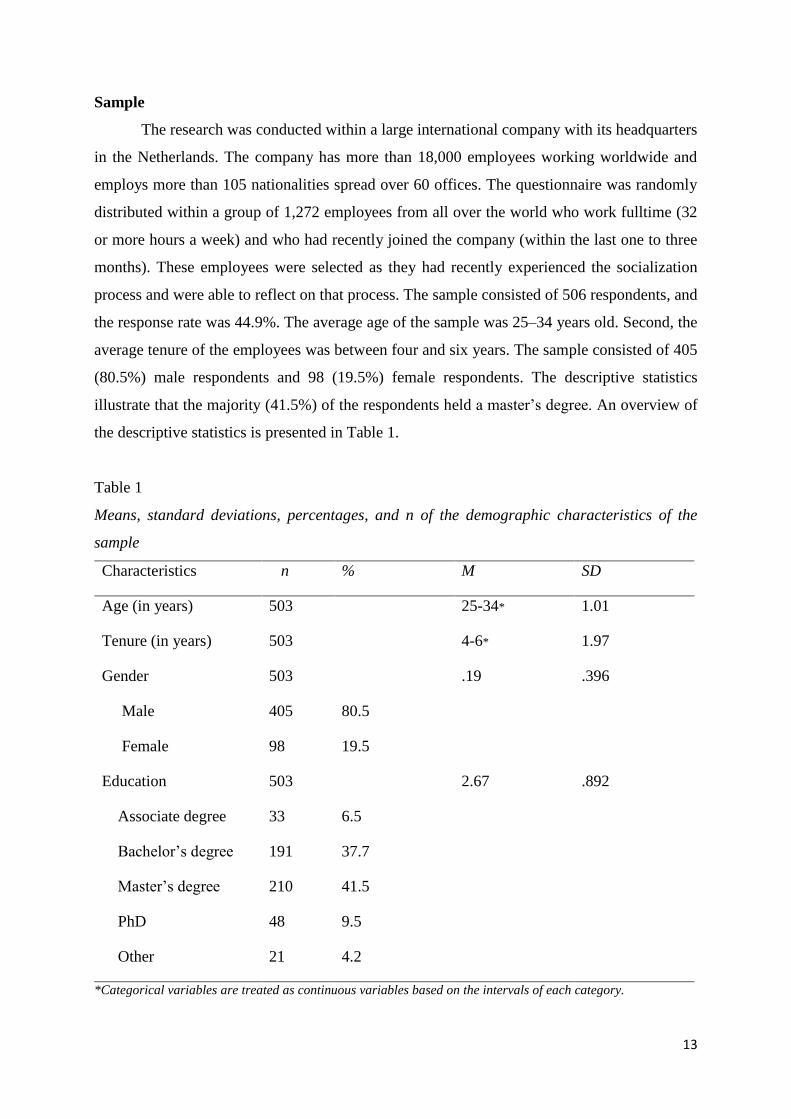
Sample
The research was conducted within a large international company with its headquarters
in the Netherlands. The company has more than 18,000 employees working worldwide and
employs more than 105 nationalities spread over 60 offices. The questionnaire was randomly
distributed within a group of 1,272 employees from all over the world who work fulltime (32
or more hours a week) and who had recently joined the company (within the last one to three
months). These employees were selected as they had recently experienced the socialization
process and were able to reflect on that process. The sample consisted of 506 respondents, and
the response rate was 44.9%. The average age of the sample was 25–34 years old. Second, the
average tenure of the employees was between four and six years. The sample consisted of 405
(80.5%) male respondents and 98 (19.5%) female respondents. The descriptive statistics
illustrate that the majority (41.5%) of the respondents held a master’s degree. An overview of
the descriptive statistics is presented in Table 1.
Table 1
Means, standard deviations, percentages, and n of the demographic characteristics of the
sample
Characteristics n % M SD
Age (in years) 503 25-34* 1.01
Tenure (in years) 503 4-6* 1.97
Gender 503 .19 .396
Male 405 80.5
Female 98 19.5
Education 503 2.67 .892
Associate degree 33 6.5
Bachelor’s degree 191 37.7
Master’s degree 210 41.5
PhD 48 9.5
Other 21 4.2
*Categorical variables are treated as continuous variables based on the intervals of each category.
14
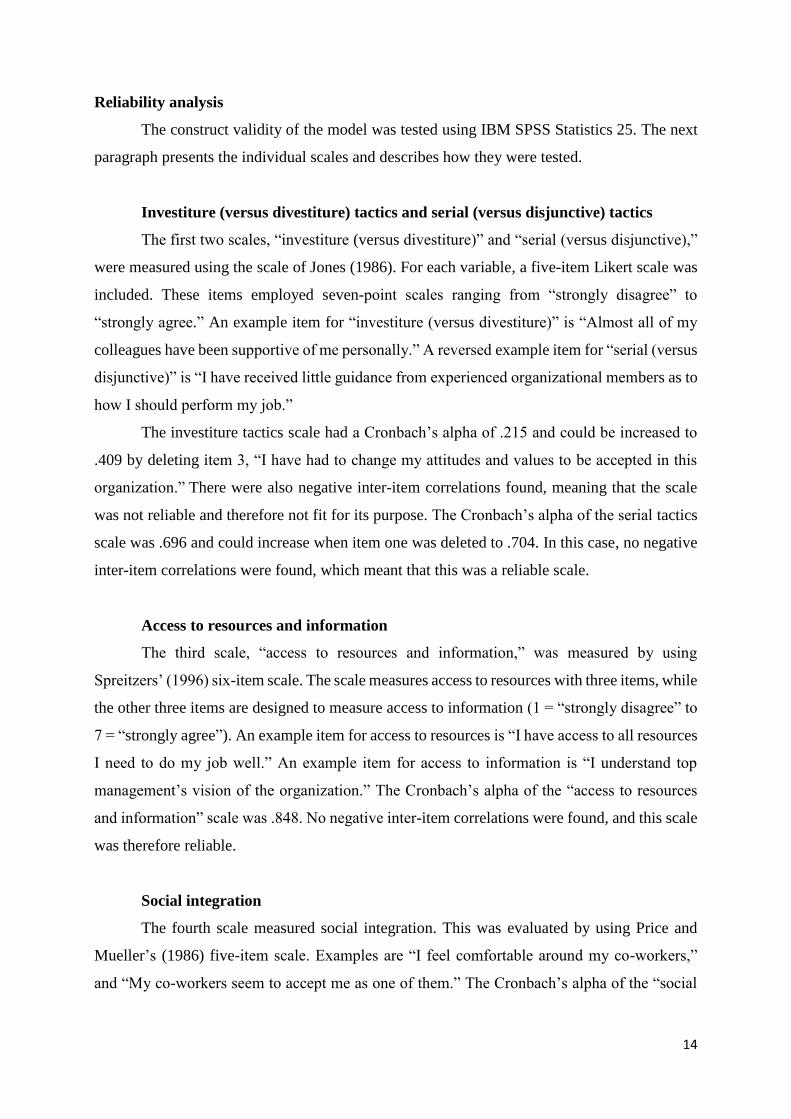
Reliability analysis
The construct validity of the model was tested using IBM SPSS Statistics 25. The next
paragraph presents the individual scales and describes how they were tested.
Investiture (versus divestiture) tactics and serial (versus disjunctive) tactics
The first two scales, “investiture (versus divestiture)” and “serial (versus disjunctive),”
were measured using the scale of Jones (1986). For each variable, a five-item Likert scale was
included. These items employed seven-point scales ranging from “strongly disagree” to
“strongly agree.” An example item for “investiture (versus divestiture)” is “Almost all of my
colleagues have been supportive of me personally.” A reversed example item for “serial (versus
disjunctive)” is “I have received little guidance from experienced organizational members as to
how I should perform my job.”
The investiture tactics scale had a Cronbach’s alpha of .215 and could be increased to
.409 by deleting item 3, “I have had to change my attitudes and values to be accepted in this
organization.” There were also negative inter-item correlations found, meaning that the scale
was not reliable and therefore not fit for its purpose. The Cronbach’s alpha of the serial tactics
scale was .696 and could increase when item one was deleted to .704. In this case, no negative
inter-item correlations were found, which meant that this was a reliable scale.
Access to resources and information
The third scale, “access to resources and information,” was measured by using
Spreitzers’ (1996) six-item scale. The scale measures access to resources with three items, while
the other three items are designed to measure access to information (1 = “strongly disagree” to
7 = “strongly agree”). An example item for access to resources is “I have access to all resources
I need to do my job well.” An example item for access to information is “I understand top
management’s vision of the organization.” The Cronbach’s alpha of the “access to resources
and information” scale was .848. No negative inter-item correlations were found, and this scale
was therefore reliable.
Social integration
The fourth scale measured social integration. This was evaluated by using Price and
Mueller’s (1986) five-item scale. Examples are “I feel comfortable around my co-workers,”
and “My co-workers seem to accept me as one of them.” The Cronbach’s alpha of the “social

15
integration” scale was .718. There were no negative inter-correlations found, and this scale was
therefore found to be reliable.
Emotional stability
The fifth scale, “emotional stability,” was measured using Shafer’s (1999a) six-item
bipolar scale. The participant was presented with trait-term pairs using a seven-point semantic
differential type scale. The participant was asked to mark where he or she scored by checking
which of the two options best described him or her. An example is “at ease to nervous” and
“calm to anxious.” The Cronbach’s alpha of the “emotional stability” scale was .817. There
were no negative inter-correlations found, and this scale was therefore reliable.
Control variables
To rule out spurious relations, this study used the following control variables: gender (0
= male, 1 = female), age (in years; Ashforth, Sluss, and Saks, 2007), education, and employment
type (fixed position, flex position, or internship). These variables might have affected how
individuals interpreted the socialization tactics and which socialization tactics they had
experienced. Education could have been related to skills at the time of hiring, and age may have
been linked to the career stage of the new hire (Feldman, 1989). The variable employment type
was used to control for different groups within the organization. The type of contract could have
influenced how new hires felt about their future at the company and how willing they were to
invest time in learning and building relationships. The questions are shown in Appendix B. For
more information on the reliability test, see Appendix E.
Analysis
When the data collection was completed, the survey was closed, and the data were
exported to an Excel CSV document. The first screening of the data took place in Excel. The
results were checked for missing data and imported into IBM SPSS Statistics 25. Dummy
variables and new variables for the reversed items were added, and the descriptive statistics
were calculated. This resulted in an overview of the sample’s demographic characteristics with
means and standard deviations (see Table 1). Outliers were identified for the variables
investiture, emotional stability, resources and information, and social integration. By examining
the 5% trimmed, it could be concluded that the outliers did not strongly impact the mean scores
of the scale; therefore, the outliers were not deleted from the sample (Gather, 1986)
16
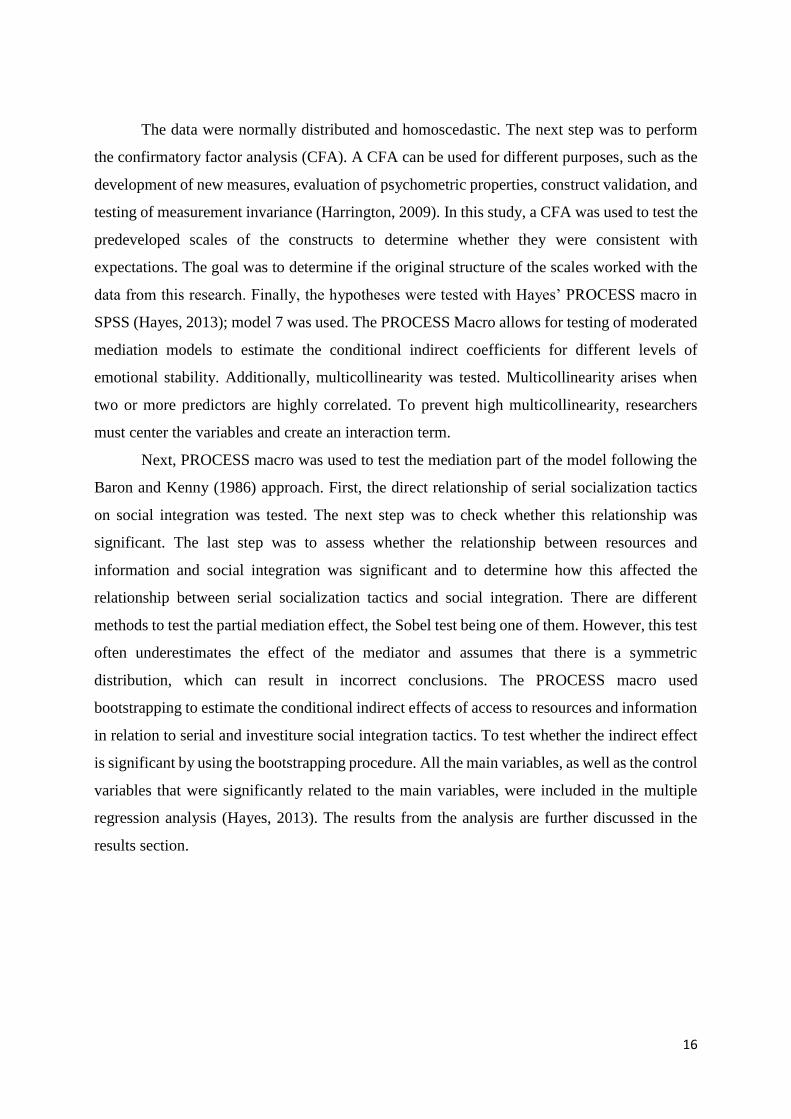
The data were normally distributed and homoscedastic. The next step was to perform
the confirmatory factor analysis (CFA). A CFA can be used for different purposes, such as the
development of new measures, evaluation of psychometric properties, construct validation, and
testing of measurement invariance (Harrington, 2009). In this study, a CFA was used to test the
predeveloped scales of the constructs to determine whether they were consistent with
expectations. The goal was to determine if the original structure of the scales worked with the
data from this research. Finally, the hypotheses were tested with Hayes’ PROCESS macro in
SPSS (Hayes, 2013); model 7 was used. The PROCESS Macro allows for testing of moderated
mediation models to estimate the conditional indirect coefficients for different levels of
emotional stability. Additionally, multicollinearity was tested. Multicollinearity arises when
two or more predictors are highly correlated. To prevent high multicollinearity, researchers
must center the variables and create an interaction term.
Next, PROCESS macro was used to test the mediation part of the model following the
Baron and Kenny (1986) approach. First, the direct relationship of serial socialization tactics
on social integration was tested. The next step was to check whether this relationship was
significant. The last step was to assess whether the relationship between resources and
information and social integration was significant and to determine how this affected the
relationship between serial socialization tactics and social integration. There are different
methods to test the partial mediation effect, the Sobel test being one of them. However, this test
often underestimates the effect of the mediator and assumes that there is a symmetric
distribution, which can result in incorrect conclusions. The PROCESS macro used
bootstrapping to estimate the conditional indirect effects of access to resources and information
in relation to serial and investiture social integration tactics. To test whether the indirect effect
is significant by using the bootstrapping procedure. All the main variables, as well as the control
variables that were significantly related to the main variables, were included in the multiple
regression analysis (Hayes, 2013). The results from the analysis are further discussed in the
results section.

17
Results
Bivariate correlations
The Pearson correlation coefficient (r) was used to test the bivariate correlations among
all variables in the model. The control variables were also tested to determine how they were
related to the main variables. Table 2 contains an overview of the means, standard deviations,
and correlations of the main variables and control variables. The main variables were linked to
each other as expected, and the control variable employment type was correlated with the main
variables.

18
Table 2
Means, standard deviations, and correlations
Notes: R&I stands for “resources and Information,” social int. stands for “social integration,” and emotional st. stands for “emotional stability.”
n = 504. Cronbach’s alphas are on the diagonal in parentheses
* p < .05, ** p < .01 (two tailed)
Variable M SD 1 2 3 4 5 6 7 8 9
1. Investiture 5.39 .749 (.215)
2. Serial 5.18 .963 .359** (.696)
3. R&I 5.59 .821 .208** .406** (.848)
4. Social int. 3.94 .501 .205** .324** .412** (.718)
5. Emotional St. 2.29 .656 -.126** -.220** -.155** -.174** (.817)
6. Age . .010 -.033 -.038 -.071 -.086 -
7. Gender -.077 -.019 -.049 -.046 .083 .036 -
8. Education .046 -.044 -.072 -.069 -.007 -.003 .006 -
9. Employment .019* .037 -.074 -.147** -.058 -.004 -.034 -.015 -

19
Confirmatory factor analysis
A CFA in IBM SPSS Amos 25 was used to test the construct validity of the model and
to identify if the factor structure fit the data. It explored and verified the factors and the loadings
of the factors (Blunch, 2012). A research model with five variables was drawn in IBM SPSS
Amos 25; additionally, the observed and latent variables were drawn. The results indicated that
all the regression weights were significant (p < .01). To check whether there was a good fit with
the model, the student considered different values. First, the chi-square divided by degrees of
freedom value (CMIN/DF = 2.126). The closer the chi-square is to 1, the better the fit. Scores
between 2 and 5 indicate a reasonable fit (Marsh & Hocevar, 1985) The next values were the
comparative fit index (CFI = .92) with a cutoff value close to .95, the root mean square error of
approximation (RMSEA = .052) with a cutoff value close to .06, the standardized root mean
square residual (SRMR = .0643) with a cutoff value close to .08, and the TLI (TLI = .896) with
a cutoff value of .9. These values all indicated a good fit (Hu & Bentler, 1999). Appendix C
contains an overview of the CFA output, including the regression weights.
Multiple regression and hypothesis testing
Based on the previous results, the student tested the hypotheses using Hayes’ PROCESS
for the multiple regression analysis. An overview of the results is shown in Table 3. Hypotheses
1 and 4 could not be tested since the investiture socialization tactics scale was excluded from
the model based on reliability testing. Even though the scale was proven to be unreliable, an
additional analysis with investiture included in the model is presented at the end of this section
to provide a full picture. These results needs be interpret with caution.
The second hypothesis was part of confirming the partial mediation that was expected.
To confirm partial mediation, a positive relationship between serial socialization tactics and
access to resources and information was required. The results of the analysis presented in Table
3 for model 1 indicate that there was indeed a significant positive relationship between serial
socialization tactics and access to resources and information (b = .2570, p < 0.04). Hypothesis
2 was therefore accepted.
For mediation to occur the variable “access to resources and information” must have a
significant positive relationship with the dependent variable “social integration.” This was
anticipated by Hypothesis 3 and confirmed by the results from the analysis shown in Table 3.
The results reveal that there was a positive relationship between access to resources and
information and social integration (b = .1984, p < 0.000). Based on these results, Hypothesis 3
was accepted.
20
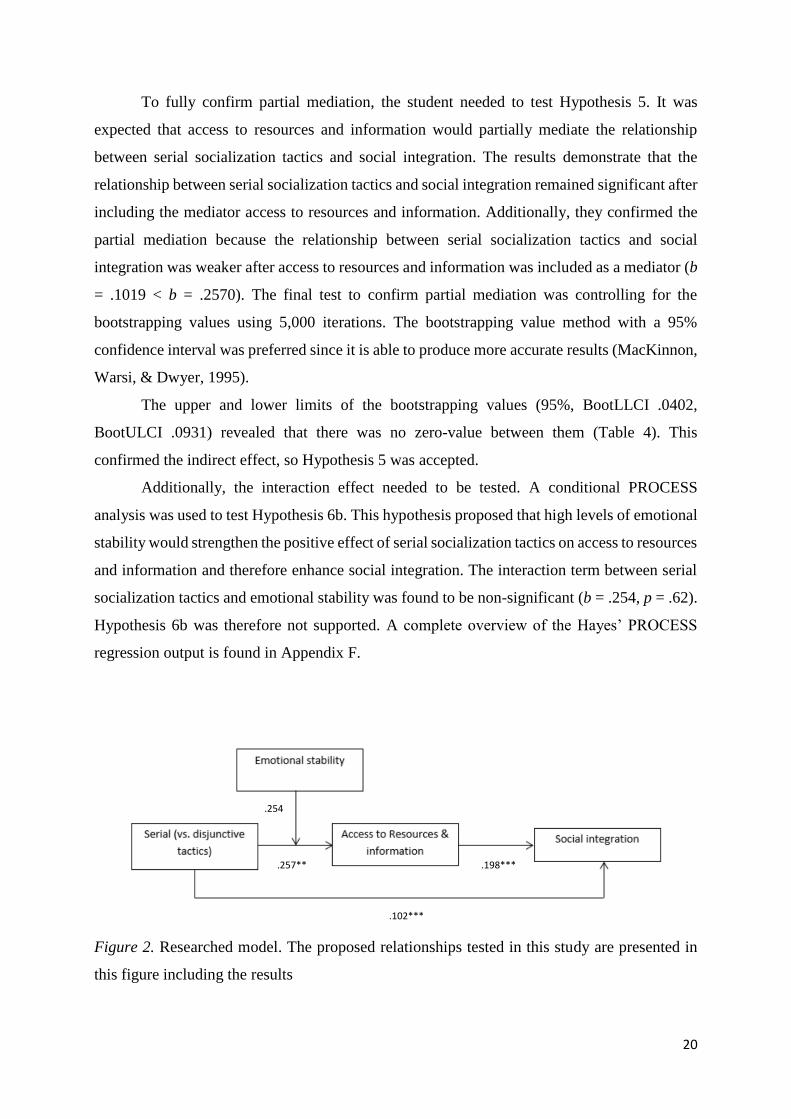
To fully confirm partial mediation, the student needed to test Hypothesis 5. It was
expected that access to resources and information would partially mediate the relationship
between serial socialization tactics and social integration. The results demonstrate that the
relationship between serial socialization tactics and social integration remained significant after
including the mediator access to resources and information. Additionally, they confirmed the
partial mediation because the relationship between serial socialization tactics and social
integration was weaker after access to resources and information was included as a mediator (b
= .1019 < b = .2570). The final test to confirm partial mediation was controlling for the
bootstrapping values using 5,000 iterations. The bootstrapping value method with a 95%
confidence interval was preferred since it is able to produce more accurate results (MacKinnon,
Warsi, & Dwyer, 1995).
The upper and lower limits of the bootstrapping values (95%, BootLLCI .0402,
BootULCI .0931) revealed that there was no zero-value between them (Table 4). This
confirmed the indirect effect, so Hypothesis 5 was accepted.
Additionally, the interaction effect needed to be tested. A conditional PROCESS
analysis was used to test Hypothesis 6b. This hypothesis proposed that high levels of emotional
stability would strengthen the positive effect of serial socialization tactics on access to resources
and information and therefore enhance social integration. The interaction term between serial
socialization tactics and emotional stability was found to be non-significant (b = .254, p = .62).
Hypothesis 6b was therefore not supported. A complete overview of the Hayes’ PROCESS
regression output is found in Appendix F.
Figure 2. Researched model. The proposed relationships tested in this study are presented in
this figure including the results
.254
.257** .198***
.102***

21
Table 3
Conditional direct and indirect effects of serial socialization tactics on social integration,
mediated by access to resources and information and moderated by emotional stability
Predictor variable B SE T R2
Model 1: F(7, 492) = 16.1972*** .4328***
Main effect on the mediator variable: R&I
Serial socialization tactics .2570* .1253 2.0518
Emotional stability -.261 .2725 -.9617
Serial tactics X emotional stability .0340 .0525 .6477
Educational level -.0594 .0385 -1.5442
Age -.0225 .0340 -.6604
Gender -.0758 .0862 -.8800
Employment type -.1737* .0702 -2.4751
Model 2: F(6, 493) = 22.9549***
Main effect on dependent variable: social integration .4673***
Serial socialization tactics .1019*** .0234 4.3506
Resources and information .1984*** .0276 7.1869
Educational level -.0221 .0236 -.9360
Age -.0280 .0208 -1.3458
Gender -.0376 .0528 -.7115
Employment type -.1440*** .0432 -3.3322
Moderated mediation analysis
Bootstrap results for conditional indirect effect of serial socialization tactics on social
integration at values of the moderator (emotional stability)
Boot indirect Boot SE LL 95% CI UL 95%CI
1.667 (-1SD) .0622* .0150 .0334 .0922
2.333 (0SD) .0667* .0137 .0402 .0931
3.000 (+1SD) .0712* .0169 .0391 .1051
Index of moderated mediation
.0067 .0123 -.0153 .0338
Notes: n = 500; sample size = 50,000; LL = lower limit; CI = confidence interval; UL = upper limit. *p <0.05, ** p <0.01, *** p <0.001

22
Multiple regression and hypothesis testing including the investiture scale
The investiture socialization tactics scale was not found to be reliable during the
reliability testing. In this section, the results with the 5 item scale included in the model are
briefly presented, but it is important to take into consideration the reliability of the scale and
interpret the results with caution.
The results demonstrated that Hypothesis 1 could not be confirmed; a positive
relationship was expected between investiture socialization tactics and resources and
information, while the results pointed to a negative effect (b = -.243, p = .0111). The third
hypothesis predicted a positive relationship between access to resources and information and
social integration. This hypothesis was confirmed (b = .2298, p = .000). The fourth hypothesis
anticipated that access to resources and information would partially mediate the relationship
between investiture socialization tactics and social integration. The relationship between
investiture socialization tactics and social integration remained significant when the mediator
access to resources and information was included. Additionally, the results confirmed partial
mediation because the relationship between investiture socialization tactics and social
integration was weaker when access to resources and information was incorporated as a
mediator (b = .0578 < b = -.2430). The bootstrapping values (95% Boot LLCI .0111, BootULCI
.1039) confirmed the partial mediation. Hypothesis 6a was not supported; the interaction term
between investiture socialization tactics and emotional stability was found to be significant (b
= .2117, p = .000), but the index of moderated mediation revealed a non-significant result (95%
BootLLCI -.0231, BootULCI .0848).
See Appendix G for a complete overview of the Hayes’ PROCESS regression output.
Discussion
This study investigated the relationship of investiture and serial socialization tactics on
access to resources and information and explored how that can relates to higher levels of social
integration. The topic is highly interesting since ineffective socialization can have meaningful
consequences. Ineffective socialization results in turnover intention, loss of productivity, and
higher recruitment and training costs (Fisher, 1986; Shaw, Gupta, & Delery, 2005; Louis, 1980;
Kammeyer-Mueller & Wanberg, 2003).
Additionally, the role of the individual characteristic emotional stability was studied to
see if it attenuated or strengthened the relationship between investiture and serial socialization
tactics and access to resources and information. The results show that serial socialization tactics

23
are positively related to social integration. Access to resources and information partially
mediates this relationship in a positive way. Further, emotional stability does not moderate the
relationship between serial socialization tactics and access to resources and information. The
next steps are discussing the study’s theoretical contribution, its limitations, and suggestions
for future research. Finally, the practical implications based on the previous results are
discussed.
Theoretical contributions
Previous research regarding socialization tactics and access to resources and
information has focused on measuring social capital by gauging the network structure of the
new hire (Fang, 2011). In this present study, social capital was not measured using the network
structure of the new hire; the focus was instead on the new hire’s access to particular resources
and information, as well as on his or her actions. This is in line with the uncertainty reduction
theory; a new hire is motivated to reduce uncertainty by seeking resources and information
(Saks & Ashforth, 1997). The question is how organizations can influence this process. The
impact of serial socialization tactics was therefore measured to demonstrate how this factor is
related to new hires’ access to resources and information. The results reveal that serial
socialization tactics are positively linked to the access new hires have to the resources and
information they need. These findings are in line with Fang et al. (2011), who proposed that
socialization tactics can help individuals to access particular resources and information. From
an organizational perspective, having an experienced colleague help newcomers and ensuring
role clarity both contribute to perceiving more access to resources and information new hires
need.
Another important aspect during the socialization process is the social integration of an
employee. Social integration has a strong impact on different distal socialization outcomes such
as job performance and attitudes (Bauer et al., 2007; Saks, Uggersleve, & Fassina, 2007). The
results point to a positive relationship between serial socialization tactics and social integration
mediated by access to resources and information, which is in line with previous research (Fang,
2011; Bauer et al., 1998; Bauer et al., 2007; Saks & Ashforth, 1997a). This paper thus
contributes to the literature by testing this relationship in a multinational company.
Additionally, approaching social capital from an action-taking standpoint and finding
significant results imply that social capital can be measured in several ways. The results suggest
that accessing resources and information supports new hires in building relationships with
colleagues. From an organizational perspective, it is important to help new hires understand the

24
strategies and goals of the firm. Moreover, new hires should be able to obtain resources when
they have an idea and should have access to resources and information to do their job well. This
will have a positive impact on how new hires perceive their social integration.
The second contribution relates to the personality trait emotional stability. Emotional
stability does not moderate the relationship between serial socialization tactics and access to
resources and information. There are different possible explanations for this finding. According
to Tidwell and Sias (2005), a longitudinal method is necessary for adequate trait measurement.
By evaluating emotional stability once, one may fail to measure a long-term trait, but instead
capture a temporary mood or state (George, 1992). States can vary daily and might be affected
by the situation (George, 1992). Within this research, access to resources was measured over a
longer time period, between one and three months, in varied contexts. A longitudinal approach
to measuring emotional stability could impact the results.
From a theoretical standpoint, it is possible that personal characteristics such as
emotional stability do not function as a moderator within this relationship. Previous research
has also found a direct relationship between emotional stability and access to resources and
information. Both Fang et al. (2011) and Judge and Bono (2001) reported that emotional
stability is a potential facilitator of the mobilization of resources and information. Individual
differences in areas such as personality may influence newcomers’ access to social capital and
their approach to constructing their social network. Digman (1990) has suggested that the level
of emotional stability affects employees’ social skills. Additionally, emotional stability could
affect their sociability (Furukawa, Sarason, & Sarason, 1998), which could impact both how
the new hires interact with organizational insiders and how these insiders react to them (Bauer
et al., 1998; Saks & Ashforth, 1997a). Both are instrumental in gaining access to the right
resources and information and eventually achieving social integration. As previously
mentioned, employees need to take action to actually access resources and information. Kuhl
(1981) has stated that people who score high on emotional stability tend to be more relaxed and
confident, which makes them more action-oriented. This all indicates that there is a possible
direct relationship between emotional stability and access to resources and information.
Limitations and suggestions for future research
Several limitations impacted this research and should be taken into account when
interpreting the results. First, this research employed a cross-sectional design, which means that
the data were collected at one point in time due to time restrictions. It is therefore not possible
to draw inferences about the causality of the variables. It is recommended to use a longitudinal

25
research design in the future by collecting data at different moments in time. Socialization is a
process that evolves over time, and the changes that occur in that process are important. For
this reason, it is possible that data collected at just one point in time are insufficient (Ritchie,
Lewis, Nicholls, & Ormston, 2013). Previous research on socialization models has suggested
that the needs of a new hire are likely to change over time (e.g., Feldman, 1976; Porter, Lawler,
& Hackman, 1975). Different feelings and emotions are involved during the socialization
process (e.g., uncertainty). When a newcomer enters an organization, he or she desires
information and social support. The need for serial socialization tactics may be stronger during
this first period. However, when an employee is starting to feel more secure, other desires may
emerge (Ashforth & Saks, 1996; Kats, 1980). Longitudinal studies offer insight into these
patterns of change and could possibly point to a cause-effect relationship over time. This paper
recommends that future researchers in this area collect data in different waves using the same
sample to increase the chance of identifying causality (Rajulton, 2001). Previous research has
indicated that the socialization process is usually measured at a three-month interval. This could
mean that the first measurement takes place when a newcomer enters the organization, the
second after three months, the third at six months, and so on (Bauer et al., 1998; Bauer et al.,
2007). Ashforth (2012) has elaborated on this topic and has concluded that it is difficult to
create a clear overview of when and how often certain processes and outcomes should be
assessed. The socialization process is dependent on the context and individuals involved, which
makes measuring it complex.
The second limitation is that the method used was a questionnaire, a method susceptible
to bias. New hires were self-reporting, which may have motivated them to give socially
desirable answers (Austin, Deary, Gibson, McGregor, & Dent, 1998). Future research would
benefit from additional analyses (e.g., interviews or focus groups). In-depth interviews are a
powerful tool for generating descriptions and interpretations of an employee’s social world
(Ritchie, Lewis, Nicholls, & Ormston, 2013). By performing an in-depth interview, the
researcher can speak to employees who have knowledge and experience of the problem of
interest. It is an opportunity to learn and see the world from another perspective (Ruben &
Rubin, 2012). A focus group, on the other hand, not only offers insight into employees’ own
experiences, but also allows them to hear how other employees have experienced the
socialization process. Participants in the focus group listen, reflect on what is said, and possibly
consider their standpoint further. This can result in additional material triggered by the
responses of other new hires (Ritchie, Lewis, Nicholls, & Ormston, 2013).

26
The third limitation is that this study only used one of the Big Five characteristics.
Emotional stability showed a non-significant relationship in the model. However, earlier
research has suggested that personality characteristics such as agreeableness and openness to
experience are significantly related to investiture and serial socialization tactics (Gruman &
Saks, 2011). Moreover, research related to resource- and information-seeking has found that
conscientiousness impacts the way new hires seek resources and information (Tidwell & Sias,
2005). As regards future research, it is important to include all the Big Five characteristics:
extraversion, agreeableness, conscientiousness, emotional stability, and openness to
experience. This will provide greater insight into how employees in a given social context seek
resources and information and how their social integration might differ (Morrison, 1993).
Finally, in future research it would be of additional value to include a context related
variable besides the personal characteristics, such as personal organization fit. Personal
organizational fit is the compatibility between a new employee and the organization in which
they work (Bowen, Ledford, & Nathan, 1991). Personal organizational fit plays an important
role in the recruitment process however there is less research on how personal organizational
fit develops through the socialization process (Cable & Parsons, 2001). During the socialization
process an organization has the opportunity to ensure the continuity of central values and norms,
providing newcomers with guidelines on how to respond to their work environment and their
coordination with coworkers (Bauer et al., 1998). At the same time the new employee is feeling
uncertain and it trying to learn about their new environment through social contacts. Cable and
Parsons (2001) Found that new employees perceive higher levels of personal organization fit
when they are exposed to serial and investiture tactics. The opportunity to learn and interact
with from an experienced organizational member and positive social support help the new hire
to experience a better fit. Additionally the interactions with an experienced organizational
member encourages new employees to accept the existing norms and values. It appears that
positive social interactions with colleagues give the new employee the opportunity to learn and
adopt the values of their new environment. For future research it would be interesting to see
how the values of a new, the organizational values and the fit between them are related to the
social integration of a new employee.

27
Practical implications
The research results lead to several practical implications for organizations wishing to
improve new hires’ access to resources and information and to help them socially integrate.
New hires attempt to reduce their feelings of uncertainty as they enter an organization.
Uncertainty can be mitigated by providing resources and information via different
communication channels and stimulating social interaction with superiors and colleagues (Saks
and Ashforth, 1997a). The organization can assist new hires in this process by developing
different serial socialization tactics. First, it is important for an organization to have practices
in place that ensure new hires are not left to their own devices. Firms should therefore promote
and reward organizational members for their involvement (Baker & Dutton, 2007). Social
contacts are important for a new hire, these contacts help a new hire to feel socially accepted.
One of these practices could be a mentor program in which an experienced organizational
member is assigned to the new hire to provide him or her with information, resources, social
contacts, and advice about how to perform the job. Ideally, the mentor should be someone who
has performed the same job him or herself (Jones, 1986). As this mentor performed their job
before he or she has the most knowledge about the resources and information a new hire needs
to perform their job well. A new hire will be able to use these resources and information to start
building a network in the organization.
Additionally, mentors should help newcomers develop strategies to create a stronger
connection with their supervisor and coworkers (Saks & Grumman, 2011). The mentor is also
able to introduce the new hire to important stakeholders. These first social contacts are
important in feeling accepted and socially integrated within the organization. Also the
relationship the new hire builds with his or her mentor could contribute to them feeling socially
integrated.
When designing and implementing socialization tactics within the organization, a firm
might benefit from organizing informal activities compelling newcomers and organizational
members to come together and work on network skills to start developing an internal network.
An example of an informal activity could be introducing new hires to all the different social
activities and clubs within the organization. Joining a club or an activity is beneficial for the
social network of the new hire. According to Burt (1992), obtaining contacts in different areas
of an organization also allows a new employee to acquire resources and information. A new
hire will be able to use these resources and information to further develop their social network.

28
Reference list
Allen, D. G. 2006. Do organizational socialization tactics influence newcomer embeddedness
and turnover? Journal of Management, 32: 237-256.
Allen, N. J., & Meyer, J. P. (1990). The measurement and antecedents of affective,
continuance and normative commitment to the organization. Journal of occupational
and organizational psychology, 63(1), 1-18.
Anderson, M. H. (2008). Social networks and the cognitive motivation to realize network
opportunities: A study of managers' information gathering behaviors. Journal of
Organizational Behavior, 29(1), 51-78.
Anderson, C. M., Riddle, B. L., & Martin, M. M. (1999). Socialization processes in groups.
The handbook of group communication theory and research, 139-163.
Ashford, S. J. (1986). Feedback-seeking in individual adaptation: A resource
perspective. Academy of Management journal, 29(3), 465-487.
Ashforth, B. K., & Saks, A. M. (1996). Socialization tactics: Longitudinal effects on
newcomer adjustment. Academy of management Journal, 39(1), 149-178.
Ashforth, B. E., Sluss, D. M., & Saks, A. M. (2006). Socialization tactics, proactivity, and
learning: how process and content influence adjustment. In annual meeting of the
Academy of Management, Atlanta.
Ashford, S. J., & Taylor, M. S. (1990). Adaptation to work transitions: An integrative
approach. Research in personnel and human resources management, 8, 1-39.
Austin, E.J., Deary, I.J., Gibon, G. J., McGregor, M.J., & Dent, J.B. (1998). Individual
response spread in self-report scales: Personality correlations and consequences.
Personality and Individual Differences, 24(3), 421-438. doi: 10.1016/S0191-8869(97)
00175-X
Baker, W., & Dutton, J. E. (2007). Enabling positive social capital in organizations. Exploring
positive relationships at work: Building a theoretical and research
foundation, 325345.
29
Baron, R. M., & Kenny, D. A. (1986). The moderator–mediator variable distinction in social
psychological research: Conceptual, strategic, and statistical considerations. Journal of
personality and social psychology, 51(6), 1173.
Barrick, M. R., & Mount, M. K. (1991). The big five personality dimensions and job
performance: a meta-analysis. Personnel psychology, 44(1), 1-26
Batistič, S. (2017). Looking beyond-socialization tactics: The role of human resource systems
in the socialization process. Human Resource Management Review.
Bauer, T. N., Bodner, T., Erdogan, B., Truxillo, D. M., & Tucker, J. S. (2007). Newcomer
adjustment during organizational socialization: A meta-analytic review of antecedents,
outcomes, and methods. Journal of Applied Psychology, 92(3), 707-721.
doi:http://dx.doi.org/10.1037/0021-9010.92.3.707
Bauer, T., Morrison, E. & Callister, R. (1998). Organizational socialization: A review and
directions for future research. Research in Personnel and Human Resources
Management. 16. 149-214.
Berger, C. R. (1979). Beyond initial interaction: Uncertainty, understanding, and the
development of interpersonal relationships. Language and social psychology, 122-144.
Berger, C. R., & Calabrese, R. J. (1975). Some explorations in initial interaction and beyond:
Toward a developmental theory of interpersonal communication. Human
communication research, 1(2), 99-112.
Blumer, H. (1969). Fashion: From class differentiation to collective selection. The
sociological Quarterly, 10(3), 275-291.
Blumer, H. (2012). Symbolic Interactionism [1969]. Contemporary Sociological Theory, 62.
Blunch, N. (2012). Introduction to structural equation modeling using IBM SPSS statistics
and AMOS. Sage.
Bolger, N., & Schilling, E. A. (1991). Personality and the problems of everyday life: The role
of neuroticism in exposure and reactivity to daily stressors. Journal of
personality, 59(3), 355-386.
30
Borgatta, E. F. (1964). The structure of personality characteristics. Systems Research and
Behavioral Science, 9(1), 8-17.
Bowen, D. E., Ledford Jr, G. E., & Nathan, B. R. (1991). Hiring for the organization, not the
job. Academy of Management Perspectives, 5(4), 35-51.
Brass, D. J. (1995). Creativity: It’s all in your social network. Creative action in
organizations, 94, 99.
Brief, A. P., Butcher, A. H., & Roberson, L. (1995). Cookies, disposition, and job attitudes:
The effects of positive mood-inducing events and negative affectivity on job
satisfaction in a field experiment. Organizational behavior and human decision
processes, 62(1), 55-62.
Burt, R.S., (1992) Structural Holes: The Social Structure of Competition. Cambridge, MA:
Harvard University Press.
Cable, D. M., & Parsons, C. K. 2001. Organization tactics and person-organization fit.
Personnel Psychology, 54: 1-23.
Carr, J. C., Pearson, A. W., Vest, M. J., & Boyar, S. L. (2006). Prior occupational experience,
anticipatory socialization, and employee retention. Journal of management, 32(3),
343-359.
Coleman, J. S., (1990). Foundations of Social Theory, Belknap Press, Cambridge, MA
Conley, J. J. (1985). Longitudinal stability of personality traits: A multitrait–multimethod–
multioccasion analysis. Journal of personality and social psychology, 49(5), 1266.
Digman, J. M. (1990). Personality structure: Emergence of the five-factor model. Annual
review of psychology, 41(1), 417-440.
Fang, R., Duffy, M. K., & Shaw, J. D. (2011). The organizational socialization process:
Review and development of a social capital model. Journal of Management, 37(1),
127-152.
Feldman, D. C. 1976b. A practical program for employee socialization.Organizational
Dynamics, autumn: 64-80.

31
Feldman, D. C. (1981). The multiple socialization of organization members. Academy of
management review, 6(2), 309-318.
Feldman, D. C. 1989. Careers in organizations: Recent trends and future directions. Journal of
Management, 15: 135- 156.
Fisher, C. D. (1986). Organizational Socialization: An integrative review. Research in
Personnel and Human Resource Management, 4. 101-145.
Furukawa, T., Sarason, I. G., & Sarason, B. R. (1998). Social support and adjustment to a
novel social environment. International Journal of Social Psychiatry, 44(1), 56-70.
Gather, U. (1986). Robust estimation of the mean of the exponential distribution in outlier
situations. Communications in Statistics-Theory and Methods, 15(8), 2323-2345.
George, J. M. (1992). The role of personality in organizational life: Issues and evidence.
Journal of Management, 2(18), 185-213.
Granovetter, M. S. (1973). The strength of weak ties. American journal of sociology, 78(6),
1360-1380.
Gruman, J. A., & Saks, A. M. (2011). Socialization preferences and intentions: Does one size
fit all? Journal of Vocational Behavior, 79(2), 419-427.
Gruman, J. A., Saks, A. M. & Zweig, D. I. (2006). Organizational socialization tactics and
newcomer proactive behavior: An integrative study. Journal of Vocational Behavior,
69, 90–104.
Hakel, M. D. (1974). Normative personality factors recovered from ratings of personality
descriptors: The beholder's eye. Personnel psychology, 27(3), 409-421.
Harrington, D. (2009). Confirmatory factor analysis. Oxford University Press.
Haueter, J. A., Macan, T. H., & Winter, J. (2003). Measurement of newcomer socialization:
Construct validation of a multidimensional scale. Journal of vocational
behavior, 63(1), 20-39.
Hayes, J. R. (2013). The complete problem solver. Routledge.
32
Hogan, R., Hogan, J., & Roberts, B. W. (1996). Personality measurement and employment
decisions: Questions and answers. American psychologist, 51(5), 469.
Hu, L. T., & Bentler, P. M. (1999). Cutoff criteria for fit indexes in covariance structure
analysis: Conventional criteria versus new alternatives. Structural equation modeling:
a multidisciplinary journal, 6(1), 1-55.
Ibarra, H. (1992). Homophily and differential returns: Sex differences in network structure
and access in an advertising firm. Administrative science quarterly, 422-447.
John, O. P. (1989). Towards a taxonomy of personality descriptors. In Personality
psychology (pp. 261-271). Springer, New York, NY.
Jones, G.R. (1986) Socialization tactics, self-efficacy, and newcomers' adjustments to
organizations. Academy of Management Journal,29, 262-279
Judge, T. A., & Bono, J. E. (2001). Relationship of core self-evaluations traits—self-esteem,
generalized self-efficacy, locus of control, and emotional stability—with job
satisfaction and job performance: A meta-analysis. Journal of applied
Psychology, 86(1), 80.
Judge, T. A., Erez, A., Bono, J. E., & Thoresen, C. J. (2003). The core self‐evaluations scale:
Development of a measure. Personnel psychology, 56(2), 303-331.
Judge, T. A., & Locke, E. A. (1993). Effect of dysfunctional thought processes on subjective
well-being and job satisfaction. Journal of Applied Psychology, 78(3), 475.
Kalish, Y., & Robins, G. (2006). Psychological predispositions and network structure: The
relationship between individual predispositions, structural holes and network
closure. Social Networks, 28(1), 56-84.
Kammeyer-Mueller, J. D., & Wanberg, C. R. (2003). Unwrapping the organizational entry
process: disentangling multiple antecedents and their pathways to adjustment. Journal
of Applied Psychology, 88(5) 779.
Katz, R. 1980. Time and work: Toward an integrative perspective. In B. M. Staw & L. L.
Cummings (Eds.), Research in organizational behavior, vol. 2: 81-127. Greenwich,
T: JAI Press.

33
Kuhl, J. (1981). Motivational and functional helplessness: The moderating effect of state
versus action orientation. Journal of Personality and Social Psychology, 40(1), 155.
Lin, N. (1999). Building a network theory of social capital. Connections, 22(1), 28-51.
Lorr, M., & Manning, T. T. (1978). Personality correlates of the sex role types. Journal of
Clinical Psychology, 34(4), 884-888.
Louis, M.R. (1990). Acculturation in the workplace: Newcomers and lay ethnographers. In B.
Schneider (ed.), Organizational climate and culture, 85-129
MacKinnon, D. P., Warsi, G., & Dwyer, J. H. (1995). A simulation study of mediated effect
measures. Multivariate behavioral research, 30(1), 41-62.
Marsh, H.W. & Hocevar, D.(1985). Application of confirmatory factor analysis to the study
of self-concept: First- and higher-order factor models and their invariance across
groups. Psychological Bulletin, 97, 562–582.
Mehra, A., Kilduff, M., & Brass, D. J. (2001). The social networks of high and low self-
monitors: Implications for workplace performance. Administrative science
quarterly, 46(1), 121-146
Morrison, E. W. (1993). Longitudinal study of the effects of information seeking on
newcomer socialization. Journal of applied psychology, 78(2), 173.
Morrison, E. W. (1993). Newcomer information seeking: Exploring types, modes, sources,
and outcomes. Academy of management Journal, 36(3), 557-589.
Morrison, E. W. (2002). Newcomers' relationships: The role of social network ties during
socialization. Academy of management Journal, 45(6), 1149-1160.
Norman, W. T. (1963). Toward an adequate taxonomy of personality attributes: Replicated
factor structure in peer nomination personality ratings. The Journal of Abnormal and
Social Psychology, 66(6), 574.
Porter, L. W., Lawler, E. E., & Hackman, J. R. (1975). Behavior in organizations.
Price, J. L., & Mueller, C. W. (1986). Absenteeism and turnover of hospital employees.

34
Rajulton, F. (2001). The fundamentals of longitudinal research: an overview. Canadian
Studies in Population, 28(2), 169-185.
Reichers, A.E. (1987). An interactionist perspective on newcomer socialization rates.
Academy of Management Review, 12,278-287.
Ritchie, J., Lewis, J., Nicholls, C. M., & Ormston, R. (Eds.). (2013). Qualitative research
practice: A guide for social science students and researchers. Sage.
Ruben, H. and Rubin, I. (2012). Qualitative Interviewing: the Art of Hearing Data, London:
Sage.
Saks, A. M., & Ashforth, B. E. (1997). Organizational socialization: Making sense of the past
and present as a prologue for the future. Journal of vocational Behavior, 51(2), 234-
279.
Saks, A. M., Uggerslev, K. L., & Fassina, N. E. (2007). Socialization tactics and newcomer
adjustment: A meta-analytic review and test of a model. Journal of vocational
behavior, 70(3), 413-446.
Seibert, S.E., Kraimer, M.L., & Liden, R.C. (2001). A social capital theory of career success.
Academy of Management Journal, 22, 219-237
Shafer, A. B. (1999a). Brief bipolar markers for the Five Factor Model of Personality.
Psychological Reports, 84, 1173–1179
Shaw, J. D., Gupta, N., & Delery, J. E. (2005). Alternative conceptualizations of the
relationship between voluntary turnover and organizational performance. Academy of
management journal, 48(1), 50-68.
Spreitzer, G. M. (1996). Social structural characteristics of psychological
empowerment. Academy of management journal, 39(2), 483-504.
Tidwell, M., & Sias, P. (2005). Personality and information seeking: Understanding how traits
influence information-seeking behaviors. The Journal of Business Communication
(1973), 42(1), 51-77.
Van Maanen, J., & Schein, E. (1979). Toward a theory of organizational socialization.
Research in Organizational Behavior, 1, 209-264

35
Wanberg, C. R., & Kammeyer-Mueller, J. D. (2000). Predictors and outcomes of proactivity
in the socialization process. Journal of applied psychology, 85(3), 373.
Watson, D., & Hubbard, B. (1996). Adaptational style and dispositional structure: Coping in
the context of the Five‐Factor model. Journal of personality, 64(4), 737-774.

36
Appendix A – Cover letter
Dear (new) Colleague,
Welcome to (company name). We hope you settled in well and that you enjoy working here.
(Company name) finds it very important that you feel welcome and that you have access to
the necessary information and tools in order to be able to perform your new job. Therefore we
are working hard on improving our onboarding process. Onboarding is related to different
activities and processes that are in place within the organization to make you feel welcome as
a new employee and to ensure you have the right knowledge, skills and behaviors to perform
well in your new job.
As you have recently experienced (company name) onboarding process, we would very much
appreciate if you can share your feedback with us. Your input will be used to improve our
Onboarding process in 2018 as well as for master thesis purposes. All answers will remain
confidential and anonymous.
We divided the survey in several subtopics.
Onboarding experience
Working within (company name)
Social and personal aspects
General information
Below you can find the link to our survey it will take 5 to 10 min. to fill in the questionnaire.
https://www.surveygizmo.com/s3/4113729/Onboarding-Survey-2018
If you have any questions regarding the master thesis, please contact: (email address)
(Contact details mentor)
Once again, thank you very much and success in your new job at (company name)!
Kind regards,
(Researchers name)
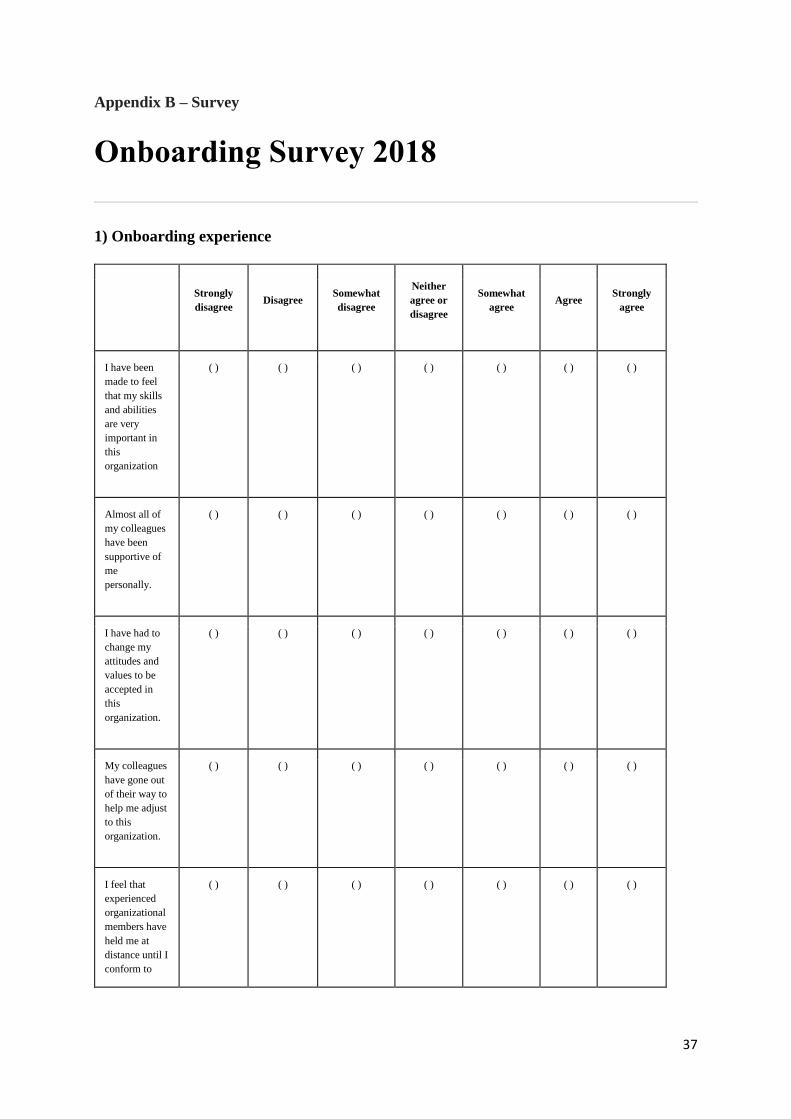
37
Appendix B – Survey
Onboarding Survey 2018
1) Onboarding experience
Strongly
disagree Disagree
Somewhat
disagree
Neither
agree or
disagree
Somewhat
agree Agree
Strongly
agree
I have been
made to feel
that my skills
and abilities
are very
important in
this
organization
( ) ( ) ( ) ( ) ( ) ( ) ( )
Almost all of
my colleagues
have been
supportive of
me
personally.
( ) ( ) ( ) ( ) ( ) ( ) ( )
I have had to
change my
attitudes and
values to be
accepted in
this
organization.
( ) ( ) ( ) ( ) ( ) ( ) ( )
My colleagues
have gone out
of their way to
help me adjust
to this
organization.
( ) ( ) ( ) ( ) ( ) ( ) ( )
I feel that
experienced
organizational
members have
held me at
distance until I
conform to
( ) ( ) ( ) ( ) ( ) ( ) ( )

38
their
expectations.
Experienced
organizational
members see
advising or
training
newcomers as
one of their
main job
responsibilities
in this
organization.
( ) ( ) ( ) ( ) ( ) ( ) ( )
I am gaining a
clear
understanding
of my role in
this
organization
from
observing my
senior
colleagues.
( ) ( ) ( ) ( ) ( ) ( ) ( )
I have
received little
guidance from
experienced
organizational
members as to
how I should
perform my
job.
( ) ( ) ( ) ( ) ( ) ( ) ( )
I have little or
no access to
people who
have
previously
performed my
role in this
organization.
( ) ( ) ( ) ( ) ( ) ( ) ( )
I have been
generally left
alone to
discover what
my role should
be in this
organization.
( ) ( ) ( ) ( ) ( ) ( ) ( )
I have been
through a set
of training
( ) ( ) ( ) ( ) ( ) ( ) ( )

39
experiences
which are
specifically
designed to
give
newcomers a
thorough
knowledge of
job related
skills.
During my
training for
this job I was
normally
physically
apart from
regular
organizational
members.
( ) ( ) ( ) ( ) ( ) ( ) ( )
I did not
perform any of
my normal job
responsibilities
until I was
thoroughly
familiar with
departmental
procedures
and work
methods.
( ) ( ) ( ) ( ) ( ) ( ) ( )
Much of my
job knowledge
has been
acquired
informally on
a trial and
error basis.
( ) ( ) ( ) ( ) ( ) ( ) ( )
I have been
very aware
that I am seen
as "learning
the ropes" in
this
organization.
( ) ( ) ( ) ( ) ( ) ( ) ( )

40
Working within (company name)
2) Working within (company name)
Strongly
disagree Disagree
Somewhat
disagree
Neither
agree or
disagree
Somewhat
agree Agree
Strongly
agree
I have access
to all
resources I
need to do
my job well.
( ) ( ) ( ) ( ) ( ) ( ) ( )
I understand
the strategies
and goals of
my
organization.
( ) ( ) ( ) ( ) ( ) ( ) ( )
When I need
additional
resources to
do my job I
usually get
them.
( ) ( ) ( ) ( ) ( ) ( ) ( )
I have access
to
information I
need to do
my job well.
( ) ( ) ( ) ( ) ( ) ( ) ( )
I can obtain
the necessary
resources to
support new
ideas.
( ) ( ) ( ) ( ) ( ) ( ) ( )
I understand
top
management's
vision of the
organization.
( ) ( ) ( ) ( ) ( ) ( ) ( )

41
Social aspects
3) What would you say about the atmosphere in your immediate work group in terms of friendliness? 1 = not friendly
at all to 5 = very friendly
( ) 1 ( ) 2 ( ) 3 ( ) 4 ( ) 5
4) To what extend do people in your immediate work group help you find ways to do a better job?
( ) Never ( ) Almost never ( ) Occasionally / Sometimes ( ) Almost every time ( ) Always
5) To what extent do you discuss personal problems with individuals in your immediate work group?
( ) Never ( ) Almost never ( ) Occasionally / Sometimes ( ) Almost every time ( ) Always
6) I feel comfortable around my co-workers.
( ) Strongly disagree ( ) Disagree ( ) Neither agree or disagree ( ) Agree ( ) Strongly agree
7) My co-workers seem to accept me as one of them.
( ) Strongly disagree ( ) Disagree ( ) Neither agree or disagree ( ) Agree ( ) Strongly agree
Personal aspects (part 1)
Please select the option that bests describes your personality.
8) At ease - Nervous
( ) Very at ease ( ) Slightly at ease ( ) Neither at ease or nervous ( ) Slightly nervous ( ) Very nervous
9) Calm - Anxious
( ) Very calm ( ) Slightly calm ( ) Neither calm or anxious ( ) Slightly anxious ( ) Very anxious
10) Unagitated - Tense
( ) Very unagitated ( ) Slightly unagitated ( ) Neither unagitated or tense ( ) Slightly tense ( ) Very tense
11) Unworried - Fearfull
( ) Very unworried ( ) Slightly unworried ( ) Neither unworried or fearfull ( ) Slightly fearfull ( ) Very fearfull
12) Self-assured - Worrying
( ) Very self-assured ( ) Slightly self-assured ( ) Neither self-assured or worrying ( ) Slightly worrying
( ) Very worrying
13) Hardy - Vulnerable
( ) Very hardy ( ) Slightly hardy ( ) Neither hardy or vulnerable ( ) Slightly vulnerable ( ) Very
vulnerable

42
Personal aspects (part 2)
14) Quiet - Talkative
( ) Very quiet ( ) Slightly quiet ( ) Neither quiet or talkative ( ) Slightly talkative ( ) Very talkative
15) Introverted - Extraverted
( ) Very introverted ( ) Slightly introverted ( ) Neither introverted or extraverted ( ) Slightly extraverted ( )
Very extraverted
16) Retiring (modest) - Sociable
( ) Very retiring ( ) Slightly retiring ( ) Neither retiring or sociable ( ) Slightly sociable ( ) Very sociable
17) Shy - Outgoing
( ) Very shy ( ) Slightly shy ( ) Neither shy or outgoing ( ) Slightly outgoing ( ) Very outgoing
18) Reserved – Friendly
( ) Very reserved ( ) Slightly reserved ( ) Neither reserved or friendly ( ) Slightly friendly ( )
Very friendly
19) Loner – Joiner
( ) Very a loner ( ) Slightly a loner ( ) Neither a loner or a joiner ( ) Slightly a joiner ( ) Very a joiner
General information
20) Gender:
( ) Male
( ) Female
21) Age:
( ) 18-24
( ) 25-34
( ) 35-44
( ) 45-54

43
( ) 55-64
( ) 65-74
22) Tenure (total working years):
( ) Less than one year
( ) 1-3 years
( ) 4-6 years
( ) 7-10 years
( ) 11-15 years
( ) 15+
23) Highest achieved education level:
( ) Associate degree
( ) Bachelor's degree
( ) Master's degree
( ) PhD
( ) Other - Write In: _________________________________________________
24) Employment type:
( ) Company name (fix)
( ) Agency / contractor (flex)
( ) Internship
25) Career track:
( ) Project manager
( ) Manager
( ) Expert
26) Country of origin: Options
27) Work location: Options

44
Appendix C – Regression weights and output CFA
Table 4
Unstandardized regression weights
Factor loading Estimate S.E. C.R. P
Investiture 5 Investiture -.949 .184 -5.147 ***
Investiture 4 Investiture .993 .156 6.357 ***
Investiture 3 Investiture -.765 .197 -3.889 ***
Investiture 2 Investiture .890 .104 8.524 ***
Investiture 1 Investiture 1.000
Serial 5 Serial -1.017 .134 -7.615 ***
Serial 4 Serial -.778 .143 -5.429 ***
Serial 3 Serial -1.084 .157 -6.925 ***
Serial 2 Serial .874 .090 9.725 ***
Serial 1 Serial 1.000
Information3 Resourceinfo .670 .081 8.253 ***
Information2 Resourceinfo .839 .065 12.807 ***
Information1 Resourceinfo 1.018 .058 17.492 ***
Resources3 Resourceinfo .870 .076 11.510 ***
Resources2 Resourceinfo .643 .062 10.329 ***
Resources1 Resourceinfo 1.000
Social5 Social 1.265 .115 10.975 ***
Social4 Social 1.117 .105 10.648 ***
Social3 Social .207 .153 1.353 ***
Social2 Social 1.042 .114 9.113 ***
Social1 Social 1.000
Neuroticism6 Neuroticism .667 .089 7.498 ***
Neuroticism5 Neuroticism 1.184 .116 10.244 ***
Neuroticism4 Neuroticism .961 .088 10.884 ***
Neuroticism3 Neuroticism 1.325 .129 10.308 ***
Neuroticism2 Neuroticism .941 .074 12.705 ***
Neuroticism1 Neuroticism 1.000
*** P = < .001

45
Table 5
CMIN
Model NPAR CMIN DF p CMIN/DF
Default model 96 559.530 282 .000 2.126
Saturated model 378 .000 0
Independence model 27 4134.911 351 .000 11.780
Table 6
Baseline comparisons
Model NFI RFI IFI TLI CFI
Default model .855 .820 .918 .896 .916
Saturated model 1.000 1.000 1.000
Independence model .000 .000 .000 .000 .000
Table 7
RMSEA and SRMR
Model RMSEA LO 90 HI 90 PCLOSE
Default model .052 .046 .058 .276
Independence model .161 .157 .165 .000
SRMR .0643
Results (default model)
Minimum was achieved
Chi-square = 599.530
Degrees of freedom =282
Probability level = .000

46
Appendix D – Standardized regression weights including difference with common latent
factor
Table 8
Standardized regression weights
Loading Estimate with
CLF
Estimate without
CLF
Delta
Investiture 5 Investiture 0.127 -0.326 -0.453
Investiture 4 Investiture 0.357 0.394 0.037
Investiture 3 Investiture 0.223 -0.237 -0.46
Investiture 2 Investiture 0.394 0.527 0.133
Investiture 1 Investiture 0.527 0.543 0.016
Serial 5 Serial -0.13 -0.476 -0.346
Serial 4 Serial 0.152 -0.346 -0.498
Serial 3 Serial 0.024 -0.455 -0.479
Serial 2 Serial 1.127 0.551 -0.576
Serial 1 Serial 1.049 0.566 -0.483
Information3 Resourceinfo 0.666 0.562 -0.104
Information2 Resourceinfo 0.621 0.685 0.064
Information1 Resourceinfo 0.7 0.826 0.126
Resources3 Resourceinfo 0.726 0.751 0.025
Resources2 Resourceinfo 0.654 0.683 0.029
Resources1 Resourceinfo 0.647 0.73 0.083
Social5 Social 0.704 0.806 0.102
Social4 Social 0.765 0.801 0.036
Social3 Social 0.334 0.09 -0.244
Social2 Social 0.452 0.625 0.173
Social1 Social 0.457 0.554 0.097

47
Neuroticism6 Neuroticism 0.435 0.461 0.026
Neuroticism5 Neuroticism 0.698 0.748 0.05
Neuroticism4 Neuroticism 0.625 0.653 0.028
Neuroticism3 Neuroticism 0.753 0.801 0.048
Neuroticism2 Neuroticism 0.557 0.578 0.021
Neuroticism1 Neuroticism 0.553 0.612 0.059
Appendix E – Reliability analysis
Reliability Investiture scale
Table 9
Reliability Statistics
Cronbach's
Alpha
Cronbach's
Alpha Based
on
Standardized
Items N of Items
.215 .456 5
Table 10
Item-Total Statistics
Scale Mean
if Item
Deleted
Scale
Variance if
Item
Deleted
Corrected
Item-Total
Correlation
Squared
Multiple
Correlation
Cronbach's
Alpha if
Item
Deleted
Investiture, skills and
abilities
20.98 35.126 .106 .148 .195
Investiture, support
colleague
20.50 33.635 .284 .271 .135

48
Investiture, change
attitudes and values
21.87 9.189 .120 .032 .409
Investiture, help
colleague adjustment
21.62 33.540 .132 .180 .173
Investiture, distance
colleagues
21.67 32.085 .156 .074 .150

49
Table 11
Inter-Item Correlation Matrix
Investiture,
skills and
abilities
Investiture,
support
colleague
Investiture,
change
attitudes
and values
Investiture,
help
colleague
adjustment
Investiture,
distance
colleagues
Investiture, skills and
abilities
1.000 .368 -.025 .227 .064
Investiture, support
colleague
.368 1.000 .088 .389 .185
Investiture, change
attitudes and values
-.025 .088 1.000 .055 .147
Investiture, help
colleague adjustment
.227 .389 .055 1.000 -.061
Investiture, distance
colleagues
.064 .185 .147 -.061 1.000

50
Reliability Serial scale
Table 12
Reliability Statistics
Cronbach's
Alpha
Cronbach's
Alpha Based
on
Standardized
Items N of Items
.696 .690 5
Table 13
Item-Total Statistics
Scale Mean
if Item
Deleted
Scale
Variance if
Item
Deleted
Corrected
Item-Total
Correlation
Squared
Multiple
Correlation
Cronbach's
Alpha if
Item
Deleted
Serial, advising and
training main
responsibilities
20.62 19.459 .291 .271 .704
Serial, clear
understanding role
20.45 19.430 .343 .255 .687
Serial, little guidance
colleagues
21.01 14.655 .509 .342 .622
Serial, no access
previously performed
job
20.47 15.314 .499 .386 .625
Serial, Left alone 20.60 14.608 .629 .420 .564

51
Table 14
Inter-Item Correlation Matrix
Serial,
advising and
training main
responsibilitie
s
Serial, clear
understanding
role
Serial, little
guidance
colleagues
Serial, no
access
previously
performed job
Serial, Left
alone
Serial, advising and
training main
responsibilities
1.000 .479 .137 .049 .275
Serial, clear
understanding role
.479 1.000 .144 .162 .265
Serial, little guidance
colleagues
.137 .144 1.000 .514 .512
Serial, no access
previously performed
job
.049 .162 .514 1.000 .544
Serial, Left alone .275 .265 .512 .544 1.000

52
Reliability access to resources and information scale
Table 15
Reliability Statistics
Cronbach's
Alpha
Cronbach's
Alpha Based
on
Standardized
Items N of Items
.848 .851 6
Table 16
Item-Total Statistics
Scale Mean if
Item Deleted
Scale
Variance if
Item Deleted
Corrected
Item-Total
Correlation
Squared
Multiple
Correlation
Cronbach's
Alpha if Item
Deleted
Resources, acces to do
job
27.96 16.155 .689 .547 .813
Resources, strategies
and goals
27.54 19.022 .646 .467 .824
Resources, need
additional resources
27.74 17.711 .645 .456 .821
Information, access to 27.76 16.988 .714 .590 .807
Information, resources
support new ideas
28.07 17.610 .639 .414 .822
Information,
understanding vision
27.93 18.909 .484 .357 .851

53
Table 17
Inter-Item Correlation Matrix
Resources,
acces to do
job
Resources,
strategies and
goals
Resources,
need additional
resources
Information,
access to
Information,
resources
support new
ideas
Information,
understanding vision
Resources, acces to
do job
1.000 .498 .554 .704 .507 .345
Resources,
strategies and goals
.498 1.000 .443 .502 .463 .572
Resources, need
additional resources
.554 .443 1.000 .612 .534 .314
Information, access
to
.704 .502 .612 1.000 .528 .321
Information,
resources support
new ideas
.507 .463 .534 .528 1.000 .415
Information,
understanding
vision
.345 .572 .314 .321 .415 1.000

54
Reliability Neuroticism scale
Table 18
Reliability Statistics
Cronbach's
Alpha
Cronbach's
Alpha Based
on
Standardized
Items
N of Items
.817 .816 6
Item-Total Statistics
Scale Mean if
Item Deleted
Scale
Variance if
Item Deleted
Corrected
Item-Total
Correlation
Squared
Multiple
Correlation
Cronbach's
Alpha if Item
Deleted
Neuroticism, At ease -
Nervous
11.58 10.895 .654 .478 .772
Neuroticism, Calm -
Anxious
11.68 11.298 .590 .424 .787
Neuroticism, Unagitated
- Tense
11.34 11.133 .621 .405 .779
Neuroticism, Unworried
- Fearfull
11.35 11.789 .603 .391 .785
Neuroticism, Self-
assured - Worrying
11.59 11.299 .614 .385 .781
Neuroticism, Hardy -
Vulnerable
11.42 12.794 .407 .192 .823

55
Inter-Item Correlation Matrix
Neuroticism,
At ease -
Nervous
Neuroticism,
Calm -
Anxious
Neuroticism,
Unagitated -
Tense
Neuroticism,
Unworried -
Fearfull
Neuroticism,
Self-assured
- Worrying
Neuroticism,
Hardy -
Vulnerable
Neuroticism, At ease
- Nervous
1.000 .611 .505 .473 .473 .285
Neuroticism, Calm -
Anxious
.611 1.000 .463 .381 .447 .238
Neuroticism,
Unagitated - Tense
.505 .463 1.000 .531 .444 .317
Neuroticism,
Unworried - Fearfull
.473 .381 .531 1.000 .487 .327
Neuroticism, Self-
assured - Worrying
.473 .447 .444 .487 1.000 .393
Neuroticism, Hardy
- Vulnerable
.285 .238 .317 .327 .393 1.000

56
Reliability social integration scale
Table 19
Reliability Statistics
Cronbach's
Alpha
Cronbach's
Alpha Based
on
Standardized
Items
N of Items
.718 .752 5
Item-Total Statistics
Scale Mean
if Item
Deleted
Scale
Variance if
Item
Deleted
Corrected
Item-Total
Correlation
Squared
Multiple
Correlation
Cronbach's
Alpha if
Item
Deleted
Social, rate
friendliness
15.39 4.492 .444 .260 .683
Social, colleagues
help to do better job
15.67 4.510 .511 .278 .658
Social, personal
problems
16.88 4.391 .289 .107 .776
Social, comfortable
around co-workers
15.49 4.467 .651 .532 .617
Social, acceptance
co-workers
15.54 4.342 .625 .532 .618

57
Inter-Item Correlation Matrix
Social, rate
friendliness
Social,
colleagues
help to do
better job
Social,
personal
problems
Social,
comfortable
around co-
workers
Social,
acceptance
co-workers
Social, rate friendliness 1.000 .363 .132 .456 .441
Social, colleagues help
to do better job
.363 1.000 .255 .429 .470
Social, personal
problems
.132 .255 1.000 .291 .236
Social, comfortable
around co-workers
.456 .429 .291 1.000 .696
Social, acceptance co-
workers
.441 .470 .236 .696 1.000

58
Appendix F: Hayes PROCESS with Serial Socialization tactics
Run MATRIX procedure:
**************** PROCESS Procedure for SPSS Version 3.00 *****************
Written by Andrew F. Hayes, Ph.D. www.afhayes.com
Documentation available in Hayes (2018). www.guilford.com/p/hayes3
**************************************************************************
Model : 7
Y : SocialTo
X : SerialTo
M : Resource
W : Neurotic
Covariates:
Educatio Age Gender Employme
Sample
Size: 500
**************************************************************************
OUTCOME VARIABLE:
Resource
Model Summary
R R-sq MSE F df1 df2 p
.4328 .1873 .5795 16.1972 7.0000 492.0000 .0000
Model
coeff se t p LLCI ULCI
constant 4.9106 .7002 7.0135 .0000 3.5349 6.2863
SerialTo .2570 .1253 2.0518 .0407 .0109 .5032
Neurotic -.2621 .2725 -.9617 .3367 -.7976 .2734
Int_1 .0340 .0525 .6477 .5175 -.0691 .1371

59
Educatio -.0594 .0385 -1.5442 .1232 -.1351 .0162
Age -.0225 .0340 -.6604 .5093 -.0893 .0443
Gender -.0758 .0862 -.8800 .3793 -.2452 .0935
Employme -.1737 .0702 -2.4751 .0137 -.3117 -.0358
Product terms key:
Int_1 : SerialTo x Neurotic
Test(s) of highest order unconditional interaction(s):
R2-chng F df1 df2 p
X*W .0007 .4195 1.0000 492.0000 .5175
**************************************************************************
OUTCOME VARIABLE:
SocialTo
Model Summary
R R-sq MSE F df1 df2 p
.4673 .2184 .2187 22.9549 6.0000 493.0000 .0000
Model
coeff se t p LLCI ULCI
constant 2.6539 .1918 13.8368 .0000 2.2770 3.0307
SerialTo .1019 .0234 4.3506 .0000 .0559 .1479
Resource .1984 .0276 7.1869 .0000 .1442 .2526
Educatio -.0221 .0236 -.9360 .3497 -.0686 .0243
Age -.0280 .0208 -1.3458 .1790 -.0688 .0129
Gender -.0376 .0528 -.7115 .4771 -.1413 .0662
Employme -.1440 .0432 -3.3322 .0009 -.2289 -.0591
****************** DIRECT AND INDIRECT EFFECTS OF X ON Y *****************
Direct effect of X on Y
Effect se t p LLCI ULCI
.1019 .0234 4.3506 .0000 .0559 .1479

60
Conditional indirect effects of X on Y:
INDIRECT EFFECT:
SerialTo -> Resource -> SocialTo
Neurotic Effect BootSE BootLLCI BootULCI
1.6667 .0622 .0150 .0334 .0922
2.3333 .0667 .0137 .0402 .0931
3.0000 .0712 .0169 .0391 .1051
Index of moderated mediation:
Index BootSE BootLLCI BootULCI
Neurotic .0067 .0123 -.0153 .0338
---
*********************** ANALYSIS NOTES AND ERRORS ************************
Level of confidence for all confidence intervals in output:
95.0000
Number of bootstrap samples for percentile bootstrap confidence intervals:
5000
W values in conditional tables are the 16th, 50th, and 84th percentiles.
NOTE: Variables names longer than eight characters can produce incorrect output.
Shorter variable names are recommended.
------ END MATRIX -----

61
Appendix G: Hayes PROCESS with Investiture Socialization tactics
Run MATRIX procedure:
**************** PROCESS Procedure for SPSS Version 3.00 *****************
Written by Andrew F. Hayes, Ph.D. www.afhayes.com
Documentation available in Hayes (2018). www.guilford.com/p/hayes3
**************************************************************************
Model : 7
Y : SocialTo
X : InvestTo
M : Resource
W : Neurotic
Covariates:
Educatio Age Gender Employme
Sample
Size: 500
**************************************************************************
OUTCOME VARIABLE:
Resource
Model Summary
R R-sq MSE F df1 df2 p
.3317 .1101 .6345 8.6916 7.0000 492.0000 .0000
Model
coeff se t p LLCI ULCI
constant 7.7864 .5548 14.0346 .0000 6.6963 8.8764
InvestTo -.2430 .0954 -2.5483 .0111 -.4304 -.0557
Neurotic -1.2753 .2702 -4.7198 .0000 -1.8061 -.7444
Int_1 .2117 .0510 4.1534 .0000 .1116 .3119
Educatio -.0718 .0402 -1.7835 .0751 -.1508 .0073

62
Age -.0400 .0355 -1.1255 .2609 -.1097 .0298
Gender -.0510 .0904 -.5639 .5731 -.2286 .1267
Employme -.1974 .0739 -2.6724 .0078 -.3425 -.0523
Product terms key:
Int_1 : InvestTo x Neurotic
Test(s) of highest order unconditional interaction(s):
R2-chng F df1 df2 p
X*W .0312 17.2508 1.0000 492.0000 .0000
----------
Focal predict: InvestTo (X)
Mod var: Neurotic (W)
Conditional effects of the focal predictor at values of the moderator(s):
Neurotic Effect se t p LLCI ULCI
1.6667 .1098 .0301 3.6545 .0003 .0508 .1689
2.3333 .2510 .0408 6.1443 .0000 .1707 .3312
3.0000 .3921 .0689 5.6934 .0000 .2568 .5274
**************************************************************************
OUTCOME VARIABLE:
SocialTo
Model Summary
R R-sq MSE F df1 df2 p
.4533 .2055 .2223 21.2478 6.0000 493.0000 .0000
Model
coeff se t p LLCI ULCI
constant 2.7028 .1942 13.9188 .0000 2.3212 3.0843
InvestTo .0578 .0177 3.2580 .0012 .0229 .0927
Resource .2298 .0260 8.8532 .0000 .1788 .2809
Educatio -.0272 .0239 -1.1378 .2558 -.0741 .0198

63
Age -.0317 .0209 -1.5150 .1304 -.0729 .0094
Gender -.0241 .0534 -.4510 .6522 -.1289 .0808
Employme -.1347 .0435 -3.0988 .0021 -.2201 -.0493
****************** DIRECT AND INDIRECT EFFECTS OF X ON Y *****************
Direct effect of X on Y
Effect se t p LLCI ULCI
.0578 .0177 3.2580 .0012 .0229 .0927
Conditional indirect effects of X on Y:
INDIRECT EFFECT:
InvestTo -> Resource -> SocialTo
Neurotic Effect BootSE BootLLCI BootULCI
1.6667 .0252 .0298 .0111 .1042
2.3333 .0577 .0181 .0347 .1039
3.0000 .0901 .0235 .0453 .1377
Index of moderated mediation:
Index BootSE BootLLCI BootULCI
Neurotic .0487 .0298 -.0231 .0848
---
*********************** ANALYSIS NOTES AND ERRORS ************************
Level of confidence for all confidence intervals in output:
95.0000
Number of bootstrap samples for percentile bootstrap confidence intervals:
5000
W values in conditional tables are the 16th, 50th, and 84th percentiles.
NOTE: Variables names longer than eight characters can produce incorrect output.
Shorter variable names are recommended.

64
------ END MATRIX -----
Run MATRIX procedure:
**************** PROCESS Procedure for SPSS Version 3.00 *****************
Written by Andrew F. Hayes, Ph.D. www.afhayes.com
Documentation available in Hayes (2018). www.guilford.com/p/hayes3
**************************************************************************
Model : 7
Y : SocialTo
X : InvestTo
M : Resource
W : Neurotic
Covariates:
Educatio Age Gender Employme
Sample
Size: 500
**************************************************************************
OUTCOME VARIABLE:
Resource
Model Summary
R R-sq MSE F df1 df2
p
.3317 .1101 .6345 8.6916 7.0000 492.0000
.0000
Model
coeff se t p LLCI ULCI
constant 7.7864 .5548 14.0346 .0000 6.6963 8.8764
InvestTo -.2430 .0954 -2.5483 .0111 -.4304 -.0557
Neurotic -1.2753 .2702 -4.7198 .0000 -1.8061 -.7444
Int_1 .2117 .0510 4.1534 .0000 .1116 .3119
Educatio -.0718 .0402 -1.7835 .0751 -.1508 .0073
Age -.0400 .0355 -1.1255 .2609 -.1097 .0298
Gender -.0510 .0904 -.5639 .5731 -.2286 .1267
Employme -.1974 .0739 -2.6724 .0078 -.3425 -.0523
Product terms key:
Int_1 : InvestTo x Neurotic
Test(s) of highest order unconditional interaction(s):
R2-chng F df1 df2 p
X*W .0312 17.2508 1.0000 492.0000 .0000
----------
Focal predict: InvestTo (X)
Mod var: Neurotic (W)
Conditional effects of the focal predictor at values of the moderator(s):
Neurotic Effect se t p LLCI
ULCI
1.6667 .1098 .0301 3.6545 .0003 .0508
.1689
2.3333 .2510 .0408 6.1443 .0000 .1707
.3312

65
3.0000 .3921 .0689 5.6934 .0000 .2568
.5274
**************************************************************************
OUTCOME VARIABLE:
SocialTo
Model Summary
R R-sq MSE F df1 df2
p
.4533 .2055 .2223 21.2478 6.0000 493.0000
.0000
Model
coeff se t p LLCI ULCI
constant 2.7028 .1942 13.9188 .0000 2.3212 3.0843
InvestTo .0578 .0177 3.2580 .0012 .0229 .0927
Resource .2298 .0260 8.8532 .0000 .1788 .2809
Educatio -.0272 .0239 -1.1378 .2558 -.0741 .0198
Age -.0317 .0209 -1.5150 .1304 -.0729 .0094
Gender -.0241 .0534 -.4510 .6522 -.1289 .0808
Employme -.1347 .0435 -3.0988 .0021 -.2201 -.0493
****************** DIRECT AND INDIRECT EFFECTS OF X ON Y *****************
Direct effect of X on Y
Effect se t p LLCI ULCI
.0578 .0177 3.2580 .0012 .0229 .0927
Conditional indirect effects of X on Y:
INDIRECT EFFECT:
InvestTo -> Resource -> SocialTo
Neurotic Effect BootSE BootLLCI BootULCI
1.6667 .0252 .0298 .0111 .1042
2.3333 .0577 .0181 .0347 .1039
3.0000 .0901 .0235 .0453 .1377
Index of moderated mediation:
Index BootSE BootLLCI BootULCI
Neurotic .0487 .0298 -.0231 .0848
---
*********************** ANALYSIS NOTES AND ERRORS ************************
Level of confidence for all confidence intervals in output:
95.0000
Number of bootstrap samples for percentile bootstrap confidence intervals:
5000
W values in conditional tables are the 16th, 50th, and 84th percentiles.
NOTE: Variables names longer than eight characters can produce incorrect
output.
Shorter variable names are recommended.
------ END MATRIX -----