Social Expenditures in Taiwan (China) - World...
56
9 Social Expenditures in Taiwan (China) Peter C. Y. Chow Abstract Social expenditures in Taiwan (China) accelerated during recent decades in accordance with economic development, social transformation, and democratization. Among the various categories of expenditure, education spending received the highest priority and continues to do so up to this day. Furthermore, the government was able to match its human resource development targets with the actual needs of the economy while promoting competition among individuals for educational advancement. Spending on another priority area_social security_has risen gradually with social security programs initially covering only a small targeted segment of the population and then expanding to cover a wider cross-section of the society. Meanwhile, a comprehensive National Health Insurance (NHI) was introduced only a few years ago (in 1995). The hallmark of Taiwan (Chinas) approach to social policy has thus been gradualism. This aspect has helped it avoid fiscal crises due to unsustainable social spending. However, democratization in recent years will likely to accelerate such spending. World Bank Institute
Transcript of Social Expenditures in Taiwan (China) - World...

9
Social Expenditures in Taiwan (China)
Peter C. Y. Chow
Abstract
Social expenditures in Taiwan (China) accelerated during recent decades in accordance with economicdevelopment, social transformation, and democratization. Among the various categories of expenditure,education spending received the highest priority and continues to do so up to this day. Furthermore, thegovernment was able to match its human resource development targets with the actual needs of theeconomy while promoting competition among individuals for educational advancement. Spending onanother priority area_social security_has risen gradually with social security programs initially coveringonly a small targeted segment of the population and then expanding to cover a wider cross-section of thesociety. Meanwhile, a comprehensive National Health Insurance (NHI) was introduced only a few yearsago (in 1995). The hallmark of Taiwan (China�s) approach to social policy has thus been gradualism. Thisaspect has helped it avoid fiscal crises due to unsustainable social spending. However, democratization inrecent years will likely to accelerate such spending.
World Bank Institute
Copyright © 2001The International Bank for Reconstructionand Development/The World Bank1818 H Street, N.W.Washington, D.C. 20433, U.S.A.First Printing January 2001
The World Bank enjoys copyright under protocol 2 of the Universal Copyright Convention. This materialmay nonetheless be copied for research, educational, or scholarly purposes only in the member countriesof The World Bank. Material in this series is subject to revision. The findings, interpretations, andconclusions expressed in this document are entirely those of the author(s) and should not be attributed inany manner to the World Bank, to its affiliated organizations, or the members of its Board of ExecutiveDirectors or the countries they represent.
Social Expenditure in Taiwan (China)Peter C. Y. Chow2001. 56 pages. Stock No. 37167

iii
Contents
Foreword v
The Development of Social Spending Policies in Taiwan 5
An Evaluation of the Development of Social Spending in Taiwan 38
Summary and Conclusions 42
References 43
Appendix 46


v
Foreword
This paper, entitled Social Expenditure in Taiwan (China) by Professor Peter C. Y Chow of CityUniversity of New York (CUNY), was prepared for a project on Social Development in EastAsia. The project was organized by the World Bank Institute under the auspices of the Programfor the Study of the Japanese Development Management Experience which is financed by theHuman Resources Development Trust Fund established at the World Bank by the Government ofJapan.
The principal objectives of this Program are to conduct studies on the Japanese and East Asiandevelopment management experience and to disseminate the lessons of this experience todeveloping and transition economies. Typically, the experiences of other countries are alsocovered in order to ensure that these lessons are placed in the proper context. This comparativemethod helps identify factors that influence the effectiveness of specific institutionalmechanisms, governance structures, and policy reforms in different contexts. A related andequally important objective of the Program is to promote the exchange of ideas among Japaneseand non-Japanese scholars, technical experts and policy makers.
The outputs of the project on Social Development in Asia include seven papers on topics such aspension systems, health insurance, education, and employment policies which are scheduled tobe published in the WBI Working Paper series. In addition, a set of papers focusing on the socialpolicy experience of Japan over the past fifty years is being processed separately as a book-length manuscript.
Farrukh Iqbal, Program DirectorWorld Bank Institute


1
Social Expenditures in Taiwan (China)*
Peter C. Y. Chow
City University of New YorkDepartment of Economics
Those countries that have been most successful�including, notably, many here in EastAsia�have also invested heavily in their people, have put in place the right policyfundamentals, and have not discriminated against their rural sectors.
Address to the Board of Governors
Hong Kong, China
by
James D. Wolfensohn, President
The World Bank Group
September 23, 1997
The ultimate aim of economic development is to promote the well-being of people. As an economybecomes more modernized, both the demand for and supply of social expenditures increases. Hence, thegrowth of social expenditures in Taiwan has accelerated in accordance with economic development, socialtransformation, and democratization in the last three decades.
In this study, �social expenditures� include education, social welfare payments (for example, socialinsurance for income security, employment services, social assistance, and welfare services) as well aspublic health and medical care. Among these, Taiwan has been focusing most heavily on education andincome security for targeted population segments�such as retirement pensions and survivors� benefits forpublic service employees. Government support of education is evidenced by priority funding foreducation, science, and culture in government budgets as stipulated in Article 10 of the Amendments tothe Constitution. Government expenditures on pensions and survivors� benefits for civil serviceemployees, military personnel, and other insurants have been built into their respective retirement systems.By contrast, social assistance is selectively granted to the needy only. Until the proposed National AnnuitySystem is implemented by the year 2000, Taiwan has no nationwide income security or unemploymentinsurance systems equivalent to those found in the United States. Therefore, Taiwan�s social welfaresystem is far behind that of many industrialized economies.
In its earlier stages of development, Taiwan�s health insurance covered only government employees,military personnel, teachers and school administrative staff members, and insured laborers in a handful ofoccupations. The plan was gradually extended to cover farmers, fishermen, and low-income householdsbefore a comprehensive National Health Insurance (NHI) system was inaugurated in March 1995.1
However, despite the incomplete coverage of its social welfare system, Taiwan was able to achieve modestprogress in social development compared with other developing economies at a similar level ofdevelopment. Taiwan has maintained a relatively equitable income distribution in comparison with other
* Taiwan refers to Taiwan (China) throughout this paper.1. Prior to March 1, 1995, insured persons (including those covered by labor insurance, government employee plans, and related
schemes) accounted for only 57.6 percent of the total population.

2 Peter C. Y. Chow
developed and developing economies. The ratio of income shared by the top 20 percent of households tothat of the bottom 20 percent of households fluctuated between 4.17 and 5.38 during the 1980�96 period,2
and the Gini coefficient fluctuated between 0.29 and 0.32. Moreover, Taiwan has also performed relativelywell based on other social indicators. Table 1 below compares some selected social indicators amongTaiwan, other developing economies, and industrial economies. In addition to its equitable distribution ofincome, Taiwan has made modest progress in many other social indicators in the past three decades: lifeexpectancy at birth increased from 62.3 in 1961 to 71.87 in 1996 for men, and from 66.76 to 77.92 forwomen in the same period . The percentage of school-age children enrolled in elementary schoolsincreased from 84 percent in the 1952�53 academic year to 99.91 percent in the 1995�96 academic year,and that in junior high schools increased from 34.85 percent to 99.75 percent in the same period .The adultliteracy rate increased from 74 percent to 94 percent, the number of health personnel per 10,000 personsincreased from 11.37 in 1961 to 57.53 in 1996, and the number of hospital beds per 10,000 personsincreased from 3.70 in 1961 to 53.39 in 1996.3 According to the criteria of the United NationsDevelopment Programme (UNDP), Taiwan�s social indicators have reached a stage of high humandevelopment similar to that found in developing economies. Other social indicators such as infantmortality and maternal mortality rates are summarized in table 2 below. For the sake of brevity, otherrelevant social indicators are illustrated by a series of diagrams presented in the Appendix.
According to the Human Development Report by the UNDP, government expenditures on socialsecurity benefits accounted for 16.2 percent of the gross national product (GNP) in industrializedeconomies, but only 2.7 percent of the GNP in developing economies classified as those with high humandevelopment during the 1985�90 period.4 It was estimated that social security expenditures in Taiwanaccounted for 5.87�6.81 percent of the GNP (21.2�24.6 percent of the total government budgets) in 1996.5
Therefore the share of social security expenditures in Taiwan, though far above that of developingeconomies classified as high human development, is still much lower than what is found in industrializedeconomies. An interesting question that arises is how the social security system in Taiwan�which is farless comprehensive and has a much smaller share in its total GNP than in industrialeconomies�contributes to social development to such an extent that it (according to comparisons ofselected social indicators reported in table 1) outperforms industrialized economies by UNDP criteria.6
Could one generalize the Taiwan experience so as to provide some transferable lessons for otherdeveloping economies? These topics are interesting not only for academic economists but alsopolicymakers who are mapping out development plans and strategies for developing economies.
The purpose of this study is to analyze these three major categories of social expenditures�education,social welfare, and health care�in Taiwan, and to investigate how Taiwan�s social expenditure policieshave contributed to its social development as reflected in its social indicators, which are better than otherdeveloping economies at similar levels of development. It is expected that through this study, one couldderive significant lessons and experiences from Taiwan�s social expenditures and its resultant socialdevelopment.
2 The ratio was higher than in the Netherlands (4.5) and in Japan (4.6), but lower than in Brazil (32.1), Hong Kong (12.3), Singapore
(9.6), the United States (9.1), and Korea (5.7).3. CEPD (1996). Executive Yuan.4 From table 18 in Human Development Report 1994, United Nations Development Programme (UNDP 1994).5 A broad definition of social security benefits in Taiwan includes social welfare, community development and environmental
protection, as well as pension and survivors� benefits. The figures depend on whether or not one includes community development andenvironmental protection in social security expenditures. The above three categories accounted for 14.4 percent, 3.4 percent, and 6.8percent, respectively, in net expenditures of the government budget in 1996, whereas net expenditures of all levels of governmentaccounted for 27.7 percent of the GNP in 1996. CEPD (1998), Ministry of Finance (1995).
6 The only exception is the adult literacy rate, which is 94 percent in Taiwan but 98.3 percent in industrialized economies. With nomale-female distinction, one cannot argue whether life expectancy at birth in industrialized economies is longer or shorter than that inTaiwan.

Social Expenditures in Taiwan (China) 3
Table 1. Selected Social Indicators
Taiwan HHD MHD LHD ADCs IC1996 1994 1994 1994 1994 1994
Life expectancy at birth (years) 71.87 (m)a
77.92 (f)a71.5 67.1 56.4 62.1 74.1
Infant mortality per 1,000 livebirths
6.66 25 46 85 64 14
Maternal mortality rate (per100,000 live births)
7.68 119 206 753 471 31
Daily calorie intake per capita 3,076 2,894 2,730 2,262 2,253 ..Population with access to safewater (percent)b
88.8 85 69 71 80 ..
Adult literacy rate (percent) 94 92 80 50 64 98.3Public expenditure on educationas percent of the GNP[Figure for 1993�94]c
5.73[7.0]
4.6 2.9 3.4 3.6 5.4
Social security benefitsexpenditures as percent of GDP[Figure for 1985�90]d
5.2[6.2]
2.7 3.3 0.6 2.7 16.2
a. M stands for male, F stands for female, respectively.b. The time period is 1990�95 for developing economies.c. If private education expenditures are included.d. If expenditures on community development and environmental protection are included.HHD: High Human Development.MHD: Medium Human Development.LHD: Low Human Development.ADCs: All Developing Countries (Economies).IC: Industrial Countries (Economies).Sources: Data for Taiwan, except for infant and maternal mortality rates, were derived from Taiwan
Statistical Data Book, 1998 (CEPD 1998a).Data for others: Except for education and social welfare expenditure, which were derived from Human
Development Report, 1994, United Nations Development Programme (UNDP 1994); all other data werederived from Human Development Report, 1997. (UNDP 1997).
Table 2. Major Social Indicators in Taiwan, 1966�96
Year A B * C * D E F G H I JMale Female
1966 65.18 69.74 21.69 71.55 23.16 32.63 3.44 10.90 38.601967 65.31 69.87 22.57 62.26 19.50 33.73 3.81 10.20 39.101968 65.22 70.01 20.71 54.03 16.40 34.36 4.20 9.14 41.001969 66.34 70.89 19.14 48.88 15.30 35.38 3.57 8.85 41.601970 66.66 71.56 16.85 40.35 14.70 35.45 3.96 9.30 43.701971 67.19 72.08 15.51 39.69 16.83 35.37 15.99 12.16 41.401972 67.56 72.30 14.02 34.72 13.30 37.07 16.80 12.49 44.00
(table continues on following page)

4 Peter C. Y. Chow
Year A B * C * D E F G H I JMale Female
1973 67.57 72.48 14.08 40.33 13.80 41.53 18.26 13.14 46.301974 67.80 72.76 12.94 32.35 13.30 40.22 17.77 14.17 48.701975 67.27 73.42 12.57 24.75 12.90 38.56 18.85 16.47 50.301976 68.70 73.59 10.60 29.53 12.16 37.56 92.63 43.17 19.66 19.39 53.701977 68.69 73.85 11.47 29.56 11.71 39.14 93.46 44.47 22.32 20.66 57.801978 69.15 74.32 9.91 22.48 11.24 39.16 94.18 44.51 21.33 21.12 61.601979 69.36 74.48 9.55 17.28 10.74 39.21 94.60 45.27 20.78 22.66 63.801980 69.56 74.54 9.83 18.66 10.34 39.25 94.77 49.67 22.22 23.82 66.801981 69.74 74.64 8.86 19.38 9.88 38.76 95.13 52.58 24.29 25.20 69.501982 69.86 74.86 8.08 19.06 9.61 39.30 94.31 56.64 28.98 27.03 72.401983 69.90 75.08 7.64 17.01 9.15 42.12 95.43 57.62 30.65 28.10 74.501984 70.46 75.53 6.86 14.06 8.84 43.30 95.65 60.63 32.86 30.19 76.401985 70.82 75.81 6.78 9.85 8.46 43.46 95.65 62.32 38.47 34.42 77.901986 70.97 75.88 6.29 9.41 8.08 45.51 95.95 66.45 41.84 35.64 79.101987 71.09 76.31 5.08 8.94 7.79 46.54 96.09 68.43 43.88 39.27 80.201988 70.99 76.21 5.34 9.09 7.43 45.56 96.40 70.42 44.50 41.72 81.701989 71.10 76.48 5.71 12.72 7.10 46.35 96.77 70.80 43.12 42.59 82.701990 71.33 76.75 5.27 11.94 6.78 44.50 97.12 73.01 43.80 44.79 83.601991 71.83 77.15 5.05 7.78 6.41 44.39 97.97 72.93 45.14 47.15 84.201992 71.79 77.22 5.18 6.85 6.15 44.83 97.60 75.49 46.30 49.62 85.101993 71.61 77.52 4.80 8.92 5.98 44.89 98.12 77.28 47.90 52.17 86.201994 71.81 77.76 5.07 8.05 5.82 45.40 97.47 78.57 48.98 53.87 87.501995 71.85 77.74 6.43 7.59 5.58 45.34 98.36 88.84 52.62 55.37 88.001996 71.87 77.92 6.66 7.68 5.34 45.76 98.23 89.57 53.39 57.53 88.80
Note: A. Life expectancy at birth.B. Infant mortality rate: death rate per 1000 live births.C. Maternal mortality rate: death rate per 100,000 live births. a : Include Kinmen County and Lienkiang County�the offshore islands�since 1994.D. Illiterate rate of population aged 6 and over.E.Female labor force participation rate.F. Net enrollment rate for school-age children (6-14) in compulsory education.G. Net enrollment rate for school-age children (14-17) in senior high/vocational schools , after 1995. School-age children (12-17).H. Number of hospital beds per 10, 000 persons.I. Number of health personnel per 10, 000 persons.J. Percentage of population served by tap water.
Sources: Social Indicators in Taiwan Area, DGBAS (1996a).Ministry of Education (1998b).
This paper is organized in the following order: The following section analyzes the development ofpolicies for major social expenditures in Taiwan. Then a section is devoted to analyses and evaluations ofTaiwan�s experiences in its development of social spending. The final section deals with lessons of the�Taiwan experience� that are transferable to other developing economies.

Social Expenditures in Taiwan (China) 5
The Development of Social Spending Policies in Taiwan
Social expenditures and economic development have interacted with each other in many developingeconomies, including Taiwan. First of all, educational achievement and economic development have areciprocal cause-and-effect relationship in the development process. The emphasis of education in Taiwanhas provided the nation with the necessary labor force for its economic development, which has in turnenabled both the government and its people to be able to afford higher-quality education. Second, thepursuit of economic growth with equity in Taiwan, as epitomized in the preface of its Constitution,mandated the government to expand social welfare programs after more than three decades ofdevelopment. As a result, social development and political stability were enhanced, which in turn helpedeconomic development.
Taiwan�s economic development is well documented (Galenson 1979; Kuo, Ranis, and Fei 1981;Tsiang 1984), but the improvement of its social welfare with relatively low social spending is rarelyknown. It has been argued that Taiwan had been following a similar trajectory to that of Japan in itspostwar economic development [�wild geese flying pattern� a la Akamatsu (1962), and Kojima (1989)].Interestingly enough, social developments in the two economies exhibit many similarities: Both economieshave relatively low shares of social welfare expenditures in their respective GNPs, yet both have achievedrelatively high levels of social development. Moreover, the role of the family in both economies has been avery important function in education, health care, and social welfare.
But differing from Japan, Taiwan has had a heavy burden of national defense in its governmentbudget. In the 1950s and 1960s, national defense usually accounted for more than 40 percent of thegovernment budget. As a result, social expenditures accounted for less than 10 percent during this period.Moreover, the distribution of social welfare expenditures was concentrated in a small targeted segment ofthe population. Until the early 1990s, a great majority of senior citizens had to rely on private sources suchas personal savings and family support for living allowances, health care, and extended personal care.
Relatively speaking, educational expenditures had larger shares than that of social expenditures eventhough the latter could have provided the authoritarian government with more effective control forsociopolitical stability, as occurred in Singapore.7 In the 1950s and 1960s when national defense dominatedgovernment budgets, educational expenditures still increased steadily, both in dollar amount and percentageshare. This phenomenon could be explained by a multifaceted rationale. First, Taiwan�s initial equitableincome distribution (owing to successful land reform in the 1950s) had reduced the demand for socialwelfare. Second, education was considered an investment that would complement economic development inTaiwan. The expansion of education (which would provide greater social equity and employmentopportunities) could enhance the earned incomes for the working class and possibly reduce the demand forsocial welfare. Third, the prolonged period of authoritarian regime from 1947 to 1987 in Taiwan hadrepressed the demand for an institutionalized social welfare system. Finally, the traditional family system,before it was eroded by industrialization and urbanization, had played an important role in providing socialwelfare, which is generally run by the public sector in many industrialized economies.
Prior to the 1980s, social security programs for income maintenance in Taiwan covered only a smallsegment of the targeted population. Government provisions of pensions and survivors� benefits werelimited only to retired government employees, military personnel, private school teachers, and a small
7 The degree of urbanization in Taiwan is far less than that of Singapore, which is mainly a city-state. In general, demand for social
welfare, especially public housing, increases as an economy becomes more urbanized. This is another rationale for explainingdifferent policy choices of social spending between education and social welfare in Singapore and Taiwan.

6 Peter C. Y. Chow
segment of insured labor. But, after more than three decades of economic development, Taiwan was ableto expand those programs to cover more and more disadvantaged groups. Examples of such coverage arethe provision of a monthly living allowance for aged farmers and low-income senior citizens. Moreover, asdemocratization gained momentum after the lifting of Martial Law in 1987,8 many social welfareprograms were speeded up by partisan competition for voter support during the periodic elections.9 As aresult, piecemeal social welfare programs, funded or unfunded, have proliferated rapidly since the late1980s. A major task under way is to integrate all existing programs into a universal National AnnuitySystem by the year 2000.
Health insurance initially covered government employees, military personnel, school teachers, and asmall segment of insured laborers only, but the coverage gradually expanded to more and more groupssuch as farmers and fishermen. Moreover, the coverage also extended to the spouses and children of theinsured in each scheme. In general, the government subsidized insurance premiums for various insuredgroups and compensated for the operating deficits of various insurance programs through general taxrevenues. Eventually the comprehensive NHI, which integrated all existing health insurance programs intoa universal one, was implemented in March 1995.
From the overview of developing social expenditure policy in Taiwan, one could argue that educationwas considered an ingredient for economic development, whereas social welfare was more or less aresidual, or by-product of modernization. The expansion of social expenditures in Taiwan was a directresult of economic development, social transformation, and democratization. Taiwan�s social developmentin the postwar era went through an evolutionary process, under which the family played an important, butdeclining role in providing social welfare for its immediate and extended members. In this role, the familyshares expenditures for informal and auxiliary education, provides for health care expenses and care-giving for family members, and supports the living allowances for elderly parents. Family expenditures oneducation, health care, care-giving, and old-age income maintenance probably are more cost-effective thanpublic spending, but are hard to quantify for policy assessments.
Education as an Investment in Human Capital
In development literature, it is said that capital can be borrowed, technology can be transferred fromabroad, but human capital has to be nurtured indigenously within a developing country. Taiwan, as one ofthe late industrializing economies, is no exception. Hence, the government placed a great emphasis oneducation, starting with the pyramid structure of the school system.
A PROFILE OF THE EDUCATION SYSTEM IN TAIWAN. A bird�s eye view of the educational system inTaiwan is illustrated in figure 1. The length of education varies from person to person. Normally it takes16 to 18 years for a child to move from kindergarten to the completion of a college education. Thepreschool education usually starts with nursery school or kindergarten at age 4 or 5, depending on theindividual. A formal education system of 6-3-3 (six years of elementary education, three years of juniorand senior high school, respectively), was in effect until 1969, when the nine-year �fundamentalcompulsory education� system was implemented. After that level, there are two types of three-yearsecondary education�senior high schools and senior vocational schools. Both require students to pass an
8 After Martial Law was lifted in 1987, constitutional rights and civil liberties such as the freedom of the press, freedom of assembly,
and organizing opposition parties were restored, and the due process of the periodic election of legislative bodies at the centralgovernment level resumed.
9 Expansions of social welfare programs such as liberalizing the living allowances for elderly people became party platforms andcampaign slogans during periodic elections in the 1990s. The interactions of various elections held at the four levels of governmenthad shortened the election cycles in Taiwan. In fact, an election was held almost every year between 1989 and 1997.

Social Expenditures in Taiwan (China) 7
entrance exam. The pass rate for senior high school students was about 24�27 percent in recent years.Those who fail the entrance exams for senior high school usually go to vocational schools.
For school-age children, nearly 100 percent enroll in elementary schools, and nearly 99.8 percent enrollin junior high schools. Moreover, there is no gender gap on educational opportunity. At the �fundamentalcompulsory education� level, there is no significant difference in enrollment rates between male and femalestudents . For secondary and higher education, female students seem to do better in moving up theeducational ladder. In the 1996�97 school year, 92.9 percent of female and 88.6 percent of male graduatesfrom junior high school went to vocational and senior high schools. Moreover, 62.7 percent of female and55.3 percent of male graduates from high schools went to college in the same school year.
Figure 1. The School System in Taiwan
Source: Ministry of Education (1998a).

8 Peter C. Y. Chow
In past years, the ratio of student enrollment at senior high and vocational schools was three to seven.But, this ratio has been undergoing periodic adjustments�depending on the employment structuresprojected by the government at various stages of economic development to be addressed below. Thecrossing arrows atop the secondary education level in figure 1 indicate that after completing theirsecondary education, students could move in either direction for higher education�they may chooseeither a junior college or a four-year senior college. The pass rate for four-year colleges fluctuates between30 and 60 percent during different time periods of development in higher education. There are two typesof junior colleges; in addition to the two-year and three-year junior colleges admitting senior high(vocational) school graduates, there is a five-year junior college that admits junior high school graduates.
The share of private (versus public) schools in total educational institutions increases with educationlevel. Before compulsory education was extended to junior high school level in 1969, private schoolsaccounted for 18 percent of junior high schools in 1965, but the number has dropped to less than 5 percentsince then. In recent years , private schools have accounted for less than 2 percent of the compulsory stageof primary education. For senior high and vocational schools, private schools have accounted for 25 and60 percent, respectively, since the mid-1980s. Since 1970, private junior colleges have accounted for morethan 70 percent and private senior colleges and universities for 50 percent of total college enrollment. Theproportional increases of private schools in accordance with the level of education is attributable to thedisproportionate share of higher education in total educational budgets compared with the shares ofprimary and secondary education. This pattern is consistent with the standard pyramid of educationalinvestment in general textbooks of educational economics.
In 1996, the numbers of students per 1,000 people at all levels of schools were distributed in thefollowing manner: 11 in kindergarten, 91 in elementary, 53.2 in junior high, 46.2 in senior high andvocation schools, 25.7 in college (29.4, if one counts the number of those in the last two years of theirfive-year junior college careers ), and 2.1 in graduate school. Hence, nearly one-quarter of the totalpopulation was enrolled at all levels of schools. Postgraduate education was initiated in the early 1960s,but did not mature until the 1980s.
SOCIAL ATTITUDES TOWARD, AND GOVERNMENT SUPPORT OF, EDUCATION. Taiwan�s emphasis oneducation was partly attributable to its long-standing indigenous tradition of respecting learning andscholarship in Confucian society,10 partly to the societal motivation of catching up with Western scienceand technology,11 and partly to the colonial legacy and government drive for the task of �nationalreconstruction� after 1949.12 The government�s dedication to education is evidenced by the increasingpercentage shares of educational budgets at all levels of governments in the past three decades.13
During the period that national security was the top priority and national defense accounted for thelion�s share in the government�s budget, there was a legal protection of the minimum share of educational
10 In traditional Chinese society, the learned scholar has the highest social status, followed by farmer, craftsman, and merchant. The
indigenous philosophy of considering education as a long-term investment in human capital could be traced to an old Chinese saying:�While it takes ten years to grow the trees, it would take 100 years to nurture the educated men.�
11 �Democracy and science� was the slogan for the �May 4 Movement� for Westernization initiated by liberal intellectuals in the early1920s during the period of Republican Chinese rule in the mainland. The Nationalist government emphasized �science andtechnology� but not so much �democracy� in education after it relocated to Taiwan in 1949.
12 Free public schools were established during 1930�31 with nearly one-third of school-age children enrolled. This figure reached 71percent during the 1943�44 period. However, there was a two-tier school system that split Japanese and Taiwanese children during thecolonial period. Moreover, there was some discriminatory treatment against Taiwanese in middle and higher education. After 1949,the Nationalist government declared that the fall of mainland China to Communists had been caused by the failure of education.Hence, education was emphasized as part of the task of �national reconstruction� at that time.
13 The share of educational expenditures in the total government budget started climbing from 14.1 percent in the 1960s, reached 16.5percent in the 1970s, 18.5 percent in the 1980s, and 19.5 percent during the 1990�97 period. By contrast, the share of national defensedeclined from 43 percent in the 1960s to 29 percent in the 1970s, 23.6 percent in the 1980s, and to 14.9 percent during the 1990�97period.

Social Expenditures in Taiwan (China) 9
expenditures at all levels of government prior to the constitutional amendment of July 1997.14 While theconstitutional protection of education expenditure in the central government budget was eroded during theperiod of authoritarian regime (when Martial Law was in effect), educational expenditures ingovernments� budgets at the provincial and local levels generally exceeded by far the minimum percentageshares required by the Constitution. One could probably argue that the constitutional protection oneducation, though not being fully implemented by the central government, at least provided a legitimatebasis for government support on education at a time when national security dominated national prioritiesand national defense gobbled up the central government�s budget. When the government extended tuition-free, compulsory education�which it had provided at the primary level since the end of World War II�tothe level of junior high school in 1969, the GNP per capita was about $345.00 based on that year�sexchange rate. After the first nine years of tuition-free, fundamental compulsory education, thegovernment has tended to provide more support for vocational schools than senior high schools at the levelof secondary education since the economy took off in the mid-1960s. For higher education, thegovernment tried to connect the educational outputs with the changing employment structures in adynamic economy so as to minimize educated unemployment. As a result there are more rigid controls onthe growth of student enrollment in public universities than in private ones.
In general, the responsibilities of educational finance at all levels of government are distributed in thefollowing way (with some exceptions): the central government is mainly responsible for higher education,the provincial government is responsible for senior high school and vocational education, and localgovernments are responsible for fundamental compulsory education (elementary and junior high). But,Taiwan�s is a �fiscal centralist� economy in that the central government has also provided grants-in-aid tosupport primary and secondary education to minimize regional disparities.15 In the period of 1986�95, thecomposition of total educational expenditure at all levels of government was as follows: 26 percent fromthe central government, 36.88 percent from the provincial and municipal governments, 36.26 percent fromthe county and city governments, and less than 1 percent from the township government.16 Hence, by thefinal account of net expenditures at all levels of government structures�which include intergovernmentaltransfers�the provincial and local governments are responsible for the largest shares of total educationalexpenditures.17
During the 1991�95 period, educational expenditures in the public sector accounted for 5.85 percentof total GNP whereas those from the private sector accounted for 1.23 percent.18 Therefore, the privatesector accounted for less than 20 percent of total education expenditures�a ratio much lower than that inthe Republic of Korea. However, these statistics only represent the percentage distribution of educationalexpenditures between public and private institutions. This angle underestimates, for instance, the role offamilies in sharing educational spending�both in-school and out-of-school expenses. In addition to tuition
14 The latest constitutional amendments in July 1997 added an article on the �priority funding� for education, science, and culture (ESC)
but abolished the legal protection of the minimum percentage shares of ESC at all levels of government budgets�for example, 15percent at the central level, 25 percent at the provincial level, and 35 percent at city and county levels, as stipulated by Article 164 ofthe Constitution. The rationale for lifting the legal protection on educational expenditures was arguably to reduce the policy distortionson resource allocation and to provide more flexibility in government budgeting. The constitutional amendment was passed despitestrong protests from educators and intellectuals. The government promised, in response, that the funding of education, science, andculture would not be undercut. To back this promise, the educational budget in the following fiscal year was set at 16.2 percent of thecentral government�s budget.
15 Article 163 of the constitution also emphasized the balanced development of education in all regions and the provision of subsidiesfrom the central government.
16 From Ministry of Education (1997c).17 The final accounts of government expenditures include the regular operating budgets as well as special budgets approved by the
legislative bodies at all levels of government. Critics have argued that the disproportional share of educational expenditures at thelocal levels tended to aggravate the disparities of public schools between urban and rural areas and between the rich and poorcounties�for example, school facilities in remote mountainous areas are far below the standards of their counterparts in themetropolitan areas.
18 The target set in the Educational White Paper (the blue plan for educational reform) was to raise the educational expenditures to 7percent of the total GNP each year.

10 Peter C. Y. Chow
fees, textbooks, and stationary supplies, the people of Taiwan also provide their children with thenecessary expenses for tutoring, for attending cramming sessions, and for private schooling for extra-curricular activities such as piano lessons, dance, and other artistic pursuits. From kindergarten to college,and even into postgraduate education, the role of family support, though hard to quantify, accounts for agreat deal of educational spending.19
THE DISTRIBUTION OF EDUCATIONAL BUDGETS AT ALL LEVELS OF EDUCATION. In actual budgetaryallocation at all levels of education, the government distributed more than 60 percent of its total educationalbudget for primary and secondary education and less than 20 percent for higher education in the 1950s and1960s. However, the shares of higher education in the total budget have been increasing since the 1970s tonurture better-quality human resources and thus to develop knowledge- and technology-intensive industries.The share of higher education fluctuated between 21 and 25 percent in the 1980s and 1990s, but the share ofcompulsory primary and junior high education was over 40 percent, as shown in table 3 below.20
Table 3. Composition of Educational Expenditure by Level of Education (percent)
Fiscal
year
Grand
total
Education
adminis-
tration
Kinder-
garten
Primary
school
Junior
high
school
Senior
high
school
Senior
vocational
school
Junior
college
Univer-
sity and
college
Social
education Others
1950 100.00 3.04 32.48 35.38 15.14 2.94 11.041956 100.00 0.84 41.44 30.75 12.10 3.18 11.691961 100.00 0.32 0.97 38.46 30.92 13.72 2.10 13.511966 100.00 0.84 0.80 32.72 35.09 19.63 3.90 7.031971 100.00 2.53 0.42 25.13 37.29 27.32 4.29 3.021976 100.00 5.43 0.91 28.20 19.79 9.17 8.80 8.88 11.87 3.21 3.741980 100.00 8.79 1.42 28.41 17.88 8.63 9.02 6.94 12.63 3.79 2.501981 100.00 10.09 1.64 25.64 17.94 8.20 8.84 8.30 13.16 4.37 1.831982 100.00 12.79 1.73 23.55 16.95 8.02 9.13 8.36 13.98 3.23 2.261983 100.00 13.28 1.64 24.51 16.40 6.82 8.24 8.86 14.82 3.39 2.041984 100.00 13.17 2.32 24.31 17.36 7.07 8.80 8.71 13.41 3.21 1.641985 100.00 14.24 3.23 22.91 16.64 6.95 8.76 8.41 13.38 3.75 1.731986 100.00 14.50 3.21 22.48 15.73 6.87 8.76 7.93 13.58 3.85 3.091987 100.00 13.31 3.10 21.98 15.19 6.95 9.49 8.73 15.97 3.28 2.001988 100.00 12.01 3.12 23.42 14.35 6.68 9.29 6.95 18.69 4.56 0.931989 100.00 12.63 3.33 24.59 14.51 6.71 8.93 7.28 16.39 4.45 1.181990 100.00 10.15 3.20 23.74 14.41 7.25 9.69 7.52 16.33 6.33 1.381991 100.00 9.59 2.74 23.45 15.47 6.57 8.23 6.71 16.95 6.82 3.461992 100.00 9.15 3.08 22.57 15.65 6.85 7.91 6.97 16.84 6.91 4.081993 100.00 8.71 2.77 24.38 16.04 6.84 7.62 6.86 15.97 6.76 4.051994 100.00 8.97 2.67 23.90 16.09 6.88 7.95 7.25 15.53 6.86 3.911995 100.00 8.60 2.97 24.43 16.50 6.90 8.15 6.71 15.49 6.75 3.491996 100.00 10.11 2.88 24.53 16.11 7.57 7.99 6.79 14.26 6.29 3.49
Source: Ministry of Education (1997b).
19 Available statistics that are most relevant to educational expenditures shared by households are from �Structure of Household
Consumption Expenditure� in DGBAS (1995). The statistics indicate that the share of �recreation, entertainment, education andcultural services� in disposable income increased from 1.62 percent in 1966 to 13.12 percent in 1995. But, there are no furtherdisaggregate data that one can use to single out �educational expenditure.�
20 The distribution of total educational expenditures includes both private and public schools. As noted in the text, there are more privatecolleges and universities than public ones. Hence, this figure could overestimate the government�s support in higher education.

Social Expenditures in Taiwan (China) 11
In terms of educational expenditure per student at all levels, there has been a trend of putting moreemphasis on elementary and junior high school students relative to college students since the mid-1970s.The ratio of per student educational expenditure in four-year colleges was 8.4 and 5.4 times greater thanthose in elementary and junior high schools, respectively, in 1976, but these ratios dropped to 3.2 and 2.6,respectively, in 1995. In terms of current expenditure per student, the ratio for four-year colleges was 5.4and 3.4 times greater than for elementary and junior high school students, respectively, in 1976, butdropped to 2.5 and 2.0, respectively, in 1995.21 It is apparent, therefore, that more resources have beenallocated to elementary and junior high schools over time.
This trend indicates that the interlevel distribution of educational resources favored �fundamentalcompulsory education� to consolidate the foundation of the educational pyramid. As social rates of returnare much higher for elementary and secondary education than for higher education, the interlevelbudgetary allocation of educational expenditures as indicated above has become more and more closelycorrelated with the social rates of returns at all levels of education.
LABOR FORCE PLANNING PROGRAMS FOR SECONDARY AND HIGHER EDUCATION. A series of labor forceplanning programs were implemented by distributing the enrollment ratios between senior and vocationalhigh schools in secondary education, by monitoring the number of college enrollment, and by controllingthe quota of each discipline in higher education through its budgetary allocation for public colleges anduniversities. Though the labor force planning program could not fully project the market demand foreducated labor at each specific industry level in advance, as a subset of the � indicative planning� in theoverall economic development plan,22 it did provide the public with the general trend of employmentstructure so as to guide parents and students in determining educational plans.
For secondary education, the government has put greater emphasis on vocational than high schooleducation since the economy took off in the mid1960s. The enrollment distribution between senior high andvocational schools is adjusted periodically in accordance with the employment structure projected by a seriesof labor force development plans. During 1965�66, as Taiwan shifted from its �inward-looking,� importsubstitution plan to an �outward looking,� export-promotion development strategy, the ratio of enrollment invocational schools relative to senior high schools was about one to one (50.3 percent versus 49.7 percent).Since then, the government has reversed the trend through its manpower development plan by targeting 60percent vocational and 40 percent senior high enrollment. Since the 1980s, the ratio of vocational school tosenior high school enrollment was nearly two to one until it stabilized at seven to three in the 1990s.23
Meanwhile, there was a compositional shift among various categories of vocational schools. Owing tothe transformation of the economic structure, enrollment in agricultural vocational schools dropped from35 percent of total vocational schools during 1950�51 to 4 percent during 1986�87�whereas that inindustrial vocational schools increased from 26 percent to 49 percent in the same period. After the mid-1980s, there was a slight decline in the share of industrial vocational schools and a modest increase in theshare of commercial vocational schools. For the 1996�97 school year, students enrolled in commerce andindustrial vocational schools accounted for 80.6 percent of total vocational school students. On therecommendation of the Council on Education Reform�which is a cabinet-level institutional setup�thegovernment decided to promote �comprehensive high school� education by expanding the ratio of highschool enrollment to that of vocational schools so that the ratio would be one to one in the near future. Thechanging ratio of high schools versus vocational schools and the compositional shift in vocational schools
21 These ratios are grand totals for all schools at all levels without any separation between the private and public ones.22 Starting with 1953, Taiwan engaged in a series of �four-year economic development plans.� Most of those plans are fairly loose
examples of �indicative planning� rather than mandatory command-based economic planning.23 The ratio was maintained about 66�68 percent and 34�32 percent from the 1980�81 academic year until the 1990s. Meanwhile, it is
noted that schools that educate primary school teachers were upgraded to college level in the early 1970s.

12 Peter C. Y. Chow
in different disciplines indicated the changing demand for technical and college-level education as theeconomic structure underwent rapid transformation starting in the 1980s.
The development of higher education in the postwar era can be divided into four periods (Chen Shu-Feng 1991). The period from the end of World War II to the Kuomintang (KMT)�led Nationalistgovernment�s relocation to Taiwan in 1949 was a period of stagnation. Economic rehabilitation and thereconstruction of infrastructure was the nation�s top priority, and the government converted only threehigher education institutions left from the time when Taiwan was a Japanese colony (1895�1945) intocolleges and universities, with no new universities founded. Private universities were not allowed at thattime. From 1950 to 1972, except for the first three years, higher education was undergoing significantgrowth because Taiwan started its first four-year economic development plan in 1953. Between 1954 and1962, there was a parallel growth between the expansion of four-year colleges and universities and two-year junior colleges. From 1963 to 1972, there was a rapid expansion of (mostly privately funded) juniorcolleges after the government accepted a policy report from educational advisors at Stanford University.
It was pointed out in the Stanford Report that the ratio of technicians to engineers in Taiwan was only0.4 to 1 at that time but was about one to one or even as high as two-and-a-half to one in otherindustrialized economies. Hence, through government deliberation, there was a rapid expansion of juniorcolleges, with the greatest increases in five-year, private junior colleges, which admitted graduates ofjunior high schools.24 However, this overexpansion resulted in a subsequent period of �restrictive growth�policy in all higher education during 1973�85, until liberalization in 1986. As the demand for collegeeducation increased, the government deliberately expanded higher education by pushing collegeenrollment from 20 to 30 college students per 1,000 in total population between the late 1980s and themid-1990s. Another major policy change in the 1990s was the freeze in the expansion of five-year juniorcolleges; at the same time four-year technological colleges were expanded to meet the increasing demandfor high-quality technicians and engineers needed for the economic transformation.
The changing ratios of student enrollment in senior vocational schools and academic high schools andthe expansion of higher education described above illustrates that education has been based on �socialdemand� projected by the government rather than �private demand� as expressed by individuals inTaiwan. The government maintains a state-planning apparatus along with a market system with opencompetition for college admissions and with private financing for university education. Under suchcircumstances, the government manipulates the supply of college graduates by controlling the growth ofoverall college enrollment25 and monitoring the quota distribution of enrollment in each academicdepartment.26 This process, which is more rigid in public universities than in private ones, is controlledthrough the nationwide joint entrance examination.
For private colleges and universities, the government used to set up the minimum standards for facilitiesto be compatible with their programs, regulated tuition and other fees charged to students, and supervised thecore curricula so as to fulfill nationwide standards. In some cases, the government provided private collegesand universities with grants tied to specific policy objectives such as raising the quality of their teachingfaculties, promoting computer-aided methods of teaching, and so on. Owing to the limited growth and more
24 The overexpansion of the five-year junior colleges resulted in inadequate facilities, substandard faculty, overpriced tuition, and a lack
of flexibility in allowing students to change majors after registering for specific categories.25 In spite of governmental control on overall college enrollment, the net percentage of senior high school graduates entering college still
increased from 38.3 percent in 1965 to 56.6 percent in 1995.26 Political considerations made it very hard for the Ministry of Education to abolish any academic department. Hence, the rigid quota in
each academic department, as pointed out by Galenson (1979), �tended to steer students into disciplines for which there was littledemand.�(p. 397). Therefore, a remedial policy of dual majors was developed in the 1980s.

Social Expenditures in Taiwan (China) 13
rigid quota of enrollment in public universities, there is a strong demand for private college education,27 andconsequently a strong incentive for the private universities and colleges to expand their enrollment.
In general, private colleges and universities are either affiliated with religious institutions orassociated with the social elite, opinion leaders, and retired politicians who have substantial influence onpublic policies. Therefore the growth of private colleges and universities was not constrained even underthe authoritarian period. This is why the Ministry of Education has a more liberal policy on enrollmentexpansion in private institutions than in public ones, and as a result there are more students in privatecolleges than in public ones. Competition for admissions to prestigious universities is fierce for students,especially in prominent fields at prestigious institutions. Meanwhile, college and university administratorsare also competing with each other to attract the most brilliant students. With few exceptions, parents andstudents are implicitly and explicitly guided by the ranking of each university when they fill out collegeadmission forms. Prestigious national universities usually get the highest priority in obtaining fundingfrom the government, whereas mediocre ones get the lowest.28 A similar situation occurs with regard tofund-raising for private colleges and universities .29
Since the mid-1970s, the percentage of college students majoring in engineering has been the highestwith more than 30 percent, and those majoring in commerce and business administration have ranked thesecond-highest with more than 20 percent of total college students. Meanwhile, the percentage ofhumanities majors dropped from 10 percent in 1975 to 6 percent in 1995. For natural sciences and finearts, the share dropped from 4.8 percent to 2.8 percent, and from 3.5 percent to 1.7 percent, respectively, inthe same period. Therefore, the changing supplies of college graduates in each discipline was, though nottotally successful, intended to better match the employment structure in a dynamic economy as projectedby the labor force plan. To some extent, engineering and business majors are much easier to place in thelabor market than those majoring in the humanities and the arts. So, the overall labor force plan, thoughnot without caveats, was generally justifiable during the early period of economic development.
Certainly there is a legacy when a government plans the allocation of human resources. The changingemployment structure in a rapidly growing economy such as Taiwan usually results in inaccurateprojections of the labor force demand. The overexpansion of five-year junior colleges in the 1963�72period was an obvious drawback of the manpower plan. The other one was government manipulation ofthe enrollment ratio between vocational schools and high schools at seven to three in the 1980s. The initialpolicy objective in limiting the growth of high school enrollment was to increase the supply of qualitylabor through vocational education and to slow down the competition created by college entranceexaminations. However, as a result of social progress, the demand for college education increased, andnow more and more parents want their children to go through the regular track of college education bycompeting in the entrance examination for high school admissions. Consequently, there have been manycases in which vocational schools had a hard time recruiting students.
We have to conclude, then, that the policy of tying student enrollment at the secondary and higherlevels of education with the projected labor force demand, which was justifiable in the earlier stages ofeconomic development, may not be feasible as the economic structure becomes more complex. Therefore,a sound educational policy in the initial period of economic development may eventually becomedetrimental in later periods (of higher complexity). Following this realization, education policy after the
27 One could argue that income elasticity of demand for higher education is rather high whereas price elasticity of demand is low.
However, to the best of my knowledge, so far there are no rigorous quantitative studies on this subject in Taiwan.28 Prestigious universities have historically had more alumni in the legislative and executive branches in the government, so their budget
requests win approval more easily. Moreover, the quality of their programs makes funding more justifiable.29 Starting with the mid-1990s, the policy of �university autonomy� enabled public universities to have more policy discretion in
personnel and financial decisions, including fund-raising from the private sector for up to 30 percent of total operating budgets. In thisway, market competition among colleges and universities is further enhanced.

14 Peter C. Y. Chow
mid-1980s was substantially liberalized with much less government regulation and more and moreadministrative autonomy and individual initiative. We also have to concede that the labor force program asa subset of �indicative economic planning,� though not perfect in projecting the market demand, wasmodestly successful by providing the public with a general tendency of labor employment structure in theearlier period of economic development.
Even though the importance of equal opportunity in education is widely recognized, there is somecontroversy surrounding the social equity of sharing the costs and resources of education. Studentsenrolled in public institutions have more resources, but share less of the cost for their education than thosein private ones. The ratios of current expenditure per student between public and private schools at alllevels in 1995 were as follows: 1.98 in four-year colleges, 1.8 in junior colleges, 1.75 in senior highschools and 1.8 in vocational schools. Moreover, educational costs for private colleges are much higher,whereas their quality is much lower than the public ones.30 Hence, there is an inherent government subsidygranted for those elites who were admitted to public universities, especially the prestigious ones. However,admissions criteria are based on open competition through a joint entrance examination for all schools.Competition offers a strong incentive for students to work hard and do well in their studies (or at least, dowell in their entrance exams) so that they could be admitted to public institutions.
Another drawback is the sharing of educational resources at junior high schools. Owing to fiercecompetition for passing the entrance exam for senior high schools, there is a dichotomy of the �talentedclass� versus the �cowboy class� in many junior high schools, which are supposed to be part of the�fundamental compulsory education.� Students in the talented class are the superstars who are allocatedmore resources for their academic work in preparing for entrance exams whereas those in the cowboyclass are usually left unattended. In response to strong criticism from many educators, the government hasprovided more vocational and technical curricula for those who are not heading for senior high schools.Meanwhile, there is a long-range plan to abolish the entrance exam for vocational schools by extendingcompulsory education from 9 to 12 years by 2001.
In general, education has been considered an investment rather than a consumption item in Taiwan.Therefore, as is the case with its export-oriented strategy, the government of Taiwan has been playing aninstrumental and strategic role in investment in education and labor force planning. With its budgetaryallocations on education expenditures, the central government has assumed an instrumental role inimplementing a series of manpower planning programs, and managed to manipulate the outputs of educationto match the employment structure in the labor market. Hence, the supply of human capital is said to bettermatch the market demand, even though educated unemployment is not completely eradicated. Critics of thelabor force planning program usually cite the imperfect projections of labor market demand in a dynamic,rapid-growth economy and the myopic, employment-oriented goals with less emphasis on individualdifferences, from a philosophical standpoint, among the ultimate objectives of education. Others argue thatsuch planning may destroy the integrity of education by putting more emphasis on applied fields andignoring subjects in the humanities and pure sciences. However, by controlling educational output inaccordance with the projected trends in the labor market, indicative planning in education appears tominimize educated unemployment, which is fairly prevalent in many developing economies. Owing to thissuccess, unemployment compensation was not an urgent policy issue until the late 1990s.31
30 Woo (1991) estimated that students at a private university paid as much as 50 percent of total educational expenses whereas those at a
public university paid only 7 percent of their total costs. The quality of education is proxied by the relative student-teacher ratios inprivate (22.2 to 1) and public universities (10.5 to 1).
31 Though admitting the possibility of alleged underestimations, the unemployment rate never exceeded 2 percent in the last threedecades until it reached 2.6 percent in 1996. In the 1994 Survey of Living Conditions conducted by the Ministry of the Interior (1994),health insurance was ranked as the first priority of social welfare policy with 34.8 percent, and job training and employment servicesscored less than 6 percent; unemployment compensation was not listed in the survey questionnaire. However, the governmentannounced that �unemployment insurance� for full-time workers would be implemented by the end of 1998 (and it was).

Social Expenditures in Taiwan (China) 15
Though education was based on social demand projected by the government, the educational systemin Taiwan could be considered a mixed system that combines state planning and market competition.32
While educational outputs are manipulated by government labor force planning, rather than beingdetermined by laissez-faire policy, educational opportunities are open and subject to bitter competition.Advancement to higher levels of education in Taiwan, which is viewed as commensurate to climbing the�ladder of social status,� depends solely on the test scores of entrance examinations.33 Hence, educationalopportunities are open to the entire school-age population.34
EDUCATIONAL ATTAINMENT IN TAIWAN. Examples of significant achievements in educational attainmentare shown in table 4. The illiteracy rates in the population aged 15 and over dropped from 14.96 percent in1976 to 5.68 percent in 1996. The percentage of the population aged 15 and over who completed seniorand vocational schools increased from 18.93 percent in 1976 to 35.53 percent in 1996, while that ratioincreased from 3.52 percent to 10.95 percent in the same period for those completing junior college. Theratio of college graduates in the population aged 15 and over increased from 3.87 percent to 8.37 percentin the same period. Hence, educational attainment increased substantially in the last two decades. In aword, the percentage of people who completed postsecondary education accounted for more than 19.32percent of the population in 1996.35 By UNDP criteria, Taiwan�s educational attainment is comparable tothat in the high human development economies.36
In an international comparison of educational attainment in the total population aged 25 and over,Taiwan has reached a level comparable to that of Japan and the United States at the level of secondaryeducation but is still far behind both economies at the tertiary level of education. The distribution of theadult population aged 25 and over with secondary education in Taiwan in the mid-1990s was 44.5 percent,similar to the 44.5 percent figure in Japan and 44.4 percent in the United States. However, those withcollege education added up to only 14.3 percent in Taiwan whereas the equivalent ratio was 21.2 percentin Japan and 45.2 percent in the United States.
The improvement of educational attainment in the labor force is evidenced by the relative shifts of educatedlabor in the last three decades. Among the employed, those with primary education or less dropped from 77.1percent in 1966 to 26.1 percent in 1995, those with junior high school education increased from 10.2 percent to21.1 percent, those with vocational and senior high school education from 8.8 percent to 33.2 percent, and thosewith college education and higher from 3.91 percent to 20.6 percent in the same period. Hence, educationattainment in Taiwan has substantially upgraded the quality of human capital, which is considered the mainresource for Taiwan�s economic development.
On international cultural exchange, it is hard to argue whether education is an export or import industry inTaiwan. Taiwan accommodates more than 5,000 foreign scholars and students for advanced studies, most ofthem in the humanities, each year. Moreover, nearly 10,000 overseas Chinese students come to Taiwan for all
32 It is noted that educational policy has become more and more liberal in the 1990s. For example, textbooks for elementary schools,
which used to be unified all over Taiwan, have been gradually privatized; textbooks for junior and high schools are to be privatized bythe year 2000. The momentum of democratization has spread to all universities and colleges, with the result that most administratorsare selected through direct elections with faculty-student participation.
33. Since the 1990s, a small quota for senior high schools as well as colleges and universities has been set up to recruit some gifted andtalented students who were eligible for exemptions from entrance exams. Meanwhile, a major reform that will replace the entranceexams by other evaluation instruments is under way.
34 Woo (1991) argued that there was a transfer of benefits from taxpayers to the educated elites who were admitted to public universities.Since admission to all universities is entirely based on nationwide joint entrance examination scores, it is possible for children of higher-income families to repeat the entrance exam year after year. Moreover, richer parents could afford to send their children to after-schoolprograms, and they can also hire private tutors. The effect of income distribution on educational opportunities needs further study.
35 From table 2-24 of the Summary of Educational Statistics (Ministry of Education 1997b), p. 38.36 According to Human Development Report 1997 (United Nations 1997), the gross enrollment ratio for all levels was 68 percent in 1994
for high human development in developing economies. But the overall enrollment rate for people aged 6 to 21 was 85 percent inTaiwan in 1992.

16 Peter C. Y. Chow
levels of education each year. However, Taiwan has sent several thousand students annually to study abroad,most of them in the United States, Japan, and Europe. On the positive side, since the early 1980s, a �reversedbrain drain� with returning professionals and technicians has filled the labor force gap in high-technologyindustries. The stock of human capital from returning scholars and professionals has been instrumental forstructural transformation in Taiwan since then. In addition, many overseas Chinese students, on completingtheir college education and returning to their home countries, have become managerial officers and liaisonpersonnel for Taiwan�s multinational corporations in Southeast Asian economies. Such unplanned dividendsfrom investment in education exemplify the education industry�s being highly internationalized in Taiwan.
Table 4. Educational Attainment of Population (Age 15 and Over)
LiterateSchoolyear Total Illiterate Total
Self-tutored Primary
Jr.high
Sr.high
Voca-tional
Jr.college
Collegeand univ.
1976 100.00 14.96 85.03 3.70 40.05 14.96 7.88 11.05 3.52 3.871977 100.00 14.21 85.79 3.57 39.12 15.50 7.94 11.81 3.78 4.071978 100.00 13.49 86.51 3.48 37.73 16.12 8.10 12.63 3.96 4.491979 100.00 12.84 87.16 3.51 36.68 16.64 8.09 13.48 4.20 4.561980 100.00 12.26 87.73 3.16 35.98 17.08 8.57 13.88 4.45 4.611981 100.00 11.62 88.37 3.10 34.84 17.45 8.35 15.09 4.71 4.831982 100.00 11.07 88.92 2.98 33.92 17.51 8.42 16.02 5.01 5.061983 100.00 10.58 89.42 2.91 32.95 17.69 8.45 16.93 5.34 5.151984 100.00 10.09 89.89 2.71 32.14 17.84 8.47 17.82 5.58 5.331985 100.00 9.62 90.38 2.47 31.25 17.86 8.83 18.72 5.86 5.391986 100.00 9.18 90.82 2.36 30.32 17.98 9.08 19.39 6.15 5.541987 100.00 8.76 91.25 2.06 29.59 18.00 9.24 20.19 6.43 5.741988 100.00 8.34 91.66 1.69 29.09 18.12 9.27 20.89 6.68 5.921989 100.00 7.98 92.01 1.56 28.48 18.06 9.52 21.31 7.01 6.071990 100.00 7.59 92.42 1.51 27.48 18.30 9.77 21.95 7.33 6.081991 100.00 7.15 92.85 1.41 26.56 18.38 9.61 22.77 7.77 6.361992 100.00 6.84 93.17 1.33 25.05 18.34 9.95 23.29 8.42 6.791993 100.00 6.59 93.41 1.31 23.91 18.21 10.27 23.80 8.84 7.071995 100.00 5.99 94.00 0.95 22.85 17.49 9.78 25.04 10.08 7.811996 100.00 5.68 94.33 0.82 21.52 17.14 9.65 25.88 10.95 8.37
Source: Ministry of Education (1997b).
THE CONTRIBUTION OF EDUCATION TO SOCIOECONOMIC DEVELOPMENTS. The contribution of education toeconomic development is manyfold. At the macroeconomic level, educational attainment and the resultantaccumulation of human capital significantly contributed to the growth of the economy in past decades. Theimprovement in the quality of the labor force and the accumulation of the stock of human capital have enabledTaiwan to transform itself from an developing economy of predominantly labor-intensive industries in the 1960sto a newly industrializing economy with modest human capital and technology-intensive industries in the 1990s.
In the growth accounting framework, it was estimated that the contribution of education, on nationalincome, the so-called residual factor of growth (Denison 1962) accounted for 45�55 percent of the growth ratesof the gross domestic product (GDP) in accordance with different weights on human capital under various

Social Expenditures in Taiwan (China) 17
econometric models.37 The following table summarizes the major empirical results of the contribution ofeducation to economic growth in Taiwan in the past decades:
Author(s) PeriodPercent of education contribution
or gross residual factorsSamuel Ho (1978) 1953�72 55 percentHou and Hsu (1972) 1953�70 47 percentWang and Tallman (1994) 1965�89 45 percent
Sources: Studies listed in the table.
At the microeconomic level, educational attainment is also reflected in the earnings of salariedemployees: An earlier study by Jiang (1988) argued that the effect of education expansion on incomedistribution depended on the relative impacts of the �composition effect� and the � compression effect,�though �it is not possible to determine, a priori, the net effect on inequality of educational expansion� (p.190).38 Jiang argued that �the change in the educational composition will eventually lower the inequalityof pay if education keeps expanding� (Jiang 1988, p. 197). By decomposing earnings through educationalattainment and scale of enterprises, Liu, Sakamoto, and Yang (1996) found that the marginal effect ofeducational attainment on earnings increased along with the increase in the scale of business enterprises(p. 168). Other studies such as Zveglich, Rodgers, and Rodgers III (1996) indicated that education hadcontributed to the narrowing of the �gender gap� of wage differentials because �female workers gainedrelative to their male counterparts in measured qualifications, particularly education and experience, innearly every period and at all education levels� (p. 15).39
In other aspects, education also contributed to social developments. The increasing female labor forceparticipation rates (column 7 in table 2), the rising social status of women as evidenced by educationalattainment, and the changing social stratification of the educated are contributions of the � externaleffects� of education. In addition, equal educational opportunities and meritocracy for the educated reduce�rent seeking� activities and promote labor discipline and ethics. Both are highly contributive to theemerging institutional framework under a competitive market economy during the process of economicdevelopment. The tradition of respecting learned scholars and intellectual elites, though having erodedsomewhat in the past decades, enables the educated elite to maintain their social status, and to becomepublic opinion leaders, regardless of their economic and political powers.40 Educational attainment issignificantly contributive to the formation of the middle class, which has enhanced the social harmony and
37 The gross residual factors in growth accounting models (whether neoclassical or endogenous) include the growth of human capital that
is indexed by levels of education. Wang and Tallman (1994) used two sets of weights: 1, 1.2, and 2, as well as 1, 2, and 4 to measureprimary, secondary, and higher education, respectively.
38 As education expands, the changing composition of the labor force initially increases income inequality, as more people aretransferred from a low- to a high-education group. So, the �composition effect� causes more inequality at first. But, as the supply ofeducated labor increases, it �compress[es] the premium earned by the more educated.� Using the data set in 1978 and 1986, Jiang(1988) found that the composition effect is greater than the compression. So, the net effect of education on earning inequality ispositive. Jiang concluded that �a persistent expansion of education beyond elementary level is still desirable in the future� (p. 194).
39 It is noted that the aggregate gender earnings ratio remained fairly constant at 65 percent between 1978 and 1992. Meanwhile, there isno discrimination in terms of educational opportunities between male and female students as reflected in the net enrollment rates ofschool-age population for both sexes.
40 The influence of intellectual elites on public policies is manyfold; in addition to having better opportunities to work in government,they are usually the opinion leaders in the actual policymaking process. In various public social policies, the trio of policymakersusually includes scholars, government bureaucrats, and related interest groups.

18 Peter C. Y. Chow
political stability in the developmental process.41 Therefore, educational development is contributive to theoverall modernization process in Taiwan.42
Nevertheless, critics have pointed out that Taiwan�s education could be characterized by a system of�formality,� biased in favor of the �diploma� rather than �learning.� According to this view, because of thefierce competition fueled by the joint entrance examination at all levels, the school education system lacksdiversity, initiative, and creativity. During the authoritarian period, too much emphasis was placed onpolitical ideology, and too little on individual differences and on nurturing leadership and citizenship in acivilian society.43 Taiwan�s educational system has consequently been under public scrutiny from interestgroups and under critical review by the government since the early 1990s. A comprehensive platform formajor educational reform is under way.44
A System of Social Security for Targeted Population Segments and Limited Social Welfare for the Needy
Taiwan�s simultaneous achievement of growth and equity is well recognized.45 In contrast with the Kuzneteffect (1955) of economic growth (namely, deteriorating income distribution at an early stage ofdevelopment in most developing economies), Taiwan�s economic miracle was accompanied by itsreputable record of equitable income distribution. After decades of rapid economic development, its Ginicoefficient never exceeded 0.32 and the relative income ratio between farms and nonfarm households wasmaintained at the range of 0.70 to 0.83 throughout the 1980s. This record is partly attributable to thegovernment�s efforts in deliberately improving the incomes of farming households by increasing their non-farm-related income. The percentage of non-farm-related income accounted for 35.3 percent of farmers�total income in 1964, but it increased to nearly 80 percent in the early 1990s.46
As Taiwan becomes more industrialized, more modernized and more democratic, its changingsocioeconomic structures contribute substantially to the rising demand for social welfare services. Thesedeterminant factors include the aging of the population, the changing family structure (including thegrowth of the nuclear family), the increase in the divorce rate and the number of single-parent families, therise of the dual-career family, as well as the decline in family functions such as the provision of healthcare, personal care, and income support for aged parents. Moreover, welfare politics generated by themomentum of democratization since the late 1980s have further accelerated the proliferation of socialwelfare expenditures. Hence, social welfare programs, which were available only to a selectively targetedsegment of the population initially, have been gradually expanding to cover more and more groups such asinsured workers, aged farmers, and other less privileged groups (for example, middle- and low-incomehouseholds). As a comprehensive National Annuity System is to be implemented by the year 2000,
41 Yang (1991) argued that owing to submissive education, education expansion did contribute to political stability from the 1960s to the
1980s, but it did not really contribute to Taiwan�s democratization. However, one probably could not deny that educational attainmentis an important criterion for defining social class, regardless of different definitions of the so-called middle class. If one agrees that therise of a �middle class� is an important ingredient for democracy, then education, at least indirectly, contributes to democratization.
42 For Taiwan�s social and political modernization, see Wen-hui Tsai (1993, pp. 125�40). Meanwhile, on the relationship betweeneducation and social development, Yang (1991) argued that education has only legitimized the political elites rather than equippingthem with professional expertise. On the relationship between education and democratization, Lippset (1981) argued that education isonly the �necessary,� but not sufficient condition, for democratization.
43 Literature on the criticism of education is voluminous. These statements are partly from the author�s own judgment and partly derivedfrom Yang (1991) and Chen Po-chang (1991).
44 The cabinet-level Council on Education Reform, consisting of a group of scholars, has been undertaking comprehensive reviews of thecurrent educational system. The government has promised to cooperate with the committee by adopting the committee�s proposals tothe greatest extent. Proposed reforms include, but are not limited to, the following: a �small school, small class policy,� partnershipsbetween communities and schools, an �integrated curriculum framework,� �equal access to education for disabled students� for nine-year compulsory education, the �promotion of comprehensive high schools,� a new, �balanced� curriculum for high schools, an �openpolicy for textbooks� at the secondary education level, and various channels for �increasing opportunities for college education.�
45 See John C. Fei, Gustav Ranis, and Shirley Kuo (1979).46 From the Quarterly Report of National Income, DGBAS, various issues.

Social Expenditures in Taiwan (China) 19
Taiwan�s piecemeal expansions of social welfare could perhaps be characterized as a �creeping welfarestate� with an indigenous Confucian cultural and value system.
THE COVERAGE OF SOCIAL WELFARE PROGRAMS IN TAIWAN. To some extent, social welfare, incomesecurity (for example, retirement pensions and survivors� benefits) and social insurance areinterchangeable in Taiwan. Currently, social welfare payments include the following categories: (a) socialinsurance for income security; (b) employment services, social assistance, and welfare services to theneedy; and (c) medical care and public health. This section will analyze the first two programs undercategories (a) and (b), and the third one will be addressed in the next-to-last section below.
Initially, social insurance for income security only covered government employees, military personnel,school teachers and educational administrative staffs, and a few occupations of insured labor. Therefore,payments for pensions and survivors� benefits have been the most significant portion of overall social welfareexpenditures until recent expansions of other welfare programs for other disadvantaged groups.
In a broad definition of social welfare expenditures�which include social welfare, community development,and environmental protection, as well as pension and survivors� benefits�its shares in total government budgetsincreased from 10.4 percent in 1971 to 24.6 percent in 1996. Prior to the 1980s, expenditures for pension andsurvivors� benefits were the major shares of total social welfare expenditures. After 1981, expenditures for pensionand survivors� benefits were separated from other social welfare programs. The share of social welfareexpenditures in the government budget increased from 3.8 percent in 1981 to 14.4 percent in 1996, whereas that ofpension and survivors� benefits increased modestly from 5.9 percent to 6.8 percent in the same period. At themacroeconomic level, total social welfare expenditures accounted for 4.0 percent of the GNP whereas pensionsand survivors� benefits accounted for 1.88 percent in 1996.47
Social assistance includes providing a living allowance for low-income households, subsidies formedical treatment, calamities, and emergency assistance, as well as disaster and crisis relief. Welfare servicesinclude welfare for children under 12, adolescents aged 12 to 18, women, the elderly, and persons withdisabilities. Employment services include vocational counseling and guidance, vocational training, andplacement in the private sector. Using a more rigid criterion to define the �the poverty line� than mostindustrialized economies,48 the government of Taiwan estimated the percentage of low-income householdseligible for social assistance to be less than 1 percent of total households, with no significant increase in thelast decades.49 The rationale for a rigid criterion for eligibility for social assistance is to avoid the misuse ofsocial entitlements and to minimize the potentially damaging effects of welfare payments on work incentive.
Table 5 below illustrates the distribution of social welfare expenditures in the 1990s. It is clear thatexpenditures for pensions and survivors� benefits accounted for the largest shares in total social welfareexpenditures. Before implementing NHI in 1995, expenditure for pensions and survivor benefits accountedfor 40 percent during the 1990�94 period. After that, it accounted for nearly one-third of social welfare
47 From Ministry of Finance (1996, table 3) and CEPD (1998a). The share of social welfare expenditures in the GNP was lower than the
U.S. figure of 6.9 percent, but higher than the 1.9 percent in Korea and 0.5 percent in Singapore. Meanwhile, it is noted that Taiwandid not have social security taxes at all.
48 Taiwan defined the poverty line by the criterion of a �minimum cost of living,� which was about one-third to 40 percent of the annualaverage disposable income. In 1997, the minimum cost of living in Taipei was set at NT$6,720.00 whereas for other areas it was set atNT$6,000.00. The criterion of �minimum living expenses� was revised to tie with �60 percent of average living expenses� rather thanthe �40 percent of average disposable� income in November 1997. As a result, the poverty line was set at $7,750.00 in Taipei and$6,700.00 in other areas. Meanwhile, the number of households eligible for social assistance increased by a factor of 1.43. Forcomparison, the poverty line in the United States is set at 40 percent of the median income whereas Scandinavian economies set it at60 percent of the median income.
49 Lee (1998) argued that although there was no significant increase in the percentage of �poor households� in the total population, therewas a significant tendency of �feminization of poverty� between 1976 and 1995, under which more female-headed than male-headedhouseholds dropped below the �poverty line.� It should be noted that Lee used a different criterion of poverty: 50 percent of the grandmean of the median of disposable income.

20 Peter C. Y. Chow
expenditures at all levels of government. The shares of welfare services were fairly stable between 19.4percent and 22.3 percent of total social welfare expenditure, whereas social assistance decreased from 9.4percent in 1990 to 5.7 percent in 1995. Expenditures on employment services accounted for less than 1.5percent. Meanwhile, the share of social insurance increased dramatically from 17.4 percent in 1990 to 33.1percent in 1995 owing to the implementation of National Health Insurance.
Table 5. Social Welfare Expenditure of All Levels of Government(Millions of New Taiwan Dollars NTS)
Social Welfare Expenditure
Fiscal year and
locality Total
Social
insurance
Social
assistance
and relief
Social
welfare
services
Employment
services
Medical
care and
public health
Expenditure
for pensions
and survivor
benefits
1990
Central Govt. 120048 58360 15461 5023 29481 1481 6914 61688
Taiwan Prov. 28501 28501 10805 9951 2617 405 4723
Taipei Mun. 7248 6310 915 15 2335 152 2893 938
Kaohsiung Mun. 3224 2493 544 10 996 72 871 731
Grand Total 159021 95664 27725 14999 35429 2110 15401 63357
100.0% 60.2% 17.4% 9.4% 22.3% 1.3% 9.7% 39.8%
1991
Central Govt. 138783 65963 17856 4250 33449 2082 8326 72820
Taiwan Prov. 31030 31030 14177 7311 2429 457 6656
Taipei Mun. 9483 8344 2044 16 2674 181 3429 1139
Kaohsiung Mun. 3655 2841 478 10 1108 89 1156 814
Grand Total 182951 108178 34555 11587 39660 2809 19567 74773
100.0% 59.1% 18.9% 6.3% 21.7% 1.5% 10.7% 40.9%
1992
Central Govt. 169444 84577 28961 5784 37557 1794 10481 84867
Taiwan Prov. 31320 31320 20205 2046 2862 678 5529
Taipei Mun. 11518 10226 1451 18 4169 191 4397 1292
Kaohsiung Mun. 4029 3013 578 1290 90 1055 1016
Grand Total 216311 129136 51195 7848 45878 2753 21462 87175
100.0% 59.7% 23.7% 3.6% 21.2% 1.3% 9.9% 40.3%
1993
Central Govt. 175356 86833 31289 3125 40137 1977 10305 88523
Taiwan Prov. 31420 31420 17914 3245 3659 829 5773
Taipei Mun. 12286 10813 1896 1521 2404 287 4705 1473
Kaohsiung Mun. 5380 4189 797 30 1428 85 1849 1191
Grand Total 224442 133255 51896 7921 47628 3178 22632 91187
100.0% 59.4% 23.1% 3.5% 21.2% 1.4% 10.1% 40.6%
1994
Central Govt. 184402 91046 30789 3364 44708 2232 9953 93356
Taiwan Prov. 34340 34340 20017 2711 3962 900 6750
Taipei Mun. 15128 13410 3212 1526 3155 216 5301 1718
Kaohsiung Mun. 6077 4507 1079 30 1466 100 1832 1570
Grand Total 239947 143303 55097 7631 53291 3448 23836 96644
100.0% 59.7% 23.0% 3.2% 22.2% 1.4% 9.9% 40.3%
(table continues on following page)

Social Expenditures in Taiwan (China) 21
Social Welfare Expenditure
Fiscal year and
locality Total
Social
insurance
Social
assistance
and relief
Social
welfare
services
Employment
services
Medical
care and
public health
Expenditure
for pensions
and survivor
benefits
1995
Central Govt. 230411 134464 66194 9533 48354 2053 8330 95947
Taiwan Prov. 45824 45824 25584 5711 4494 844 9191
Taipei Mun. 18691 16788 5844 1860 3927 240 4917 1903
Kaohsiung Mun. 7871 6352 2694 40 1858 104 1656 1519
Grand Total 302797 203428 100316 17144 58633 3241 24094 99369
100.0% 67.2% 33.1% 5.7% 19.4% 1.1% 8.0% 32.8%
Note: 1. The Expenditure for pension and survivor benefits of Taiwan Province is classified under Expenditure for Education, Science andSocial Insurance. Housing is included in Expenditure for Community Development.2. The Expenditure for pension and survivor benefits of Taipei Municipality was included under Expenditure for social insurancebefore fiscal 1992. It is excluded in this table.3. The Expenditure for social insurance of Kaohsiung Municipality was classified under Expenditure for social welfare foundations.It is separated and inserted as an independent item in this table. The Social assistance and relief expenditure was not included infiscal 1992.
Sources: CEPD (1994).Central Government: Central Government Audit Final Report, Ministry of Audit.Taiwan Province: Taiwan Provincial Audit Final Report, Ministry of Audit.Taipei Municipality : Taipei Minicipal Audit Final Report, Ministry of Audit.Kaohsiung Municipality : Kaohsiung Municipal Audit Final Report, Ministry of Audit.
From table 5, one can also see that pension and survivors� benefits, which covered only selected, targetedpopulations (approximately 8.5 percent of the total), dominated the entire social welfare program in Taiwan in theearly 1990s. However, Taiwan�s incomplete social welfare system was supplemented by the private sector, whichhas been playing a significant role in promoting economic security, health care, and emergency assistance. In pastdecades, many social services that were generally provided by the public sector in Western industrializedeconomies were taken over by the family, community and other private sectors in Taiwan. Social assistance wasgenerally regarded as the last resort for less fortunate or disadvantaged groups. It is hard, however, to quantitativelyassess the impact of the private sector in providing those social assistance and welfare services.
DEVELOPMENT OF SOCIAL WELFARE IN POSTWAR PERIOD. Development of social welfare expenditures inTaiwan in the postwar era consisted of expansions of the scope of social welfare programs, the degrees ofprotection and coverage under various insurance schemes, and the increasing numbers of eligiblerecipients under each program. With the expansion of social welfare programs, the share of transferpayments in household disposable income more than doubled from 5.3 percent in 1964 to 11.8 percent in1992. However, the distribution of transfer payments among various income brackets was less thanequitable. For example, transfer payments received by those households on the top 20 percent incomebracket were much more than those received by households in the bottom 20 percent during 1994�96.50 Inother words, the efficacy of transfer payment on income distribution is rather limited, and there is room forfurther improvement in distributing social welfare resources more equitably. Table 6 below indicates theimpacts of various transfer payments on income distribution.
50 According to survey data from the DGBAS, the ratios of transfer payments received by households in the top 20 percent income
bracket to those in the bottom 20 percent were 2.05 in 1994, 1.36 in 1995, and 1.41 in 1996. Part of the reason for the unequitabledistribution of transfer payments among different income brackets is that government subsidies of various health insurance premiumsare based on the occupation, rather than income, of the insured.

22 Peter C. Y. Chow
Table 6. The Impacts of Government Transfer Payments on Income Distribution (percent)
Impacts of Government transfer paymentsRatio of relativeincome before
governmenttransfer oayment
(1)
Governmentexpenditures on
social welfare andothers
(percent)
Governmentrevenues
(direct taxesand others)(percent)
Total(percent)
Ratios of relative incomes (2)after government transfer
payment (1)+(2)1970 4.300 �4.000 �9.000 �13.000 4.1701980 4.300 �4.000 �9.000 �13.000 4.1701981 4.327 �2.400 �9.400 �11.800 4.2091982 4.408 �2.400 �9.600 �12.000 4.2881983 4.512 �4.100 �11.300 �15.400 4.3581984 4.535 �4.500 �9.100 �13.600 4.3991985 4.640 �4.000 �9.500 �13.500 4.5051986 4.780 �8.000 �11.000 �19.000 4.5901987 4.882 �7.900 �11.100 �19.000 4.6921988 5.053 �10.500 �9.800 �20.300 4.8501989 5.176 14.500 �9.400 5.100 5.2271990 5.520 �23.000 �11.000 �34.000 5.1801991 5.310 �24.000 �10.000 �34.000 4.9701992 5.560 �23.000 �9.000 �32.000 5.2401993 5.760 �26.000 �8.000 �34.000 5.4201994 5.790 �30.000 �11.000 �41.000 5.3801995 5.930 �50.000 �9.000 �59.000 5.3401996 6.170 �68.000 �11.000 �79.000 5.380
Source: Quarterly National Economic Trends in Taiwan Area, Various issues, Taipei:Directorate General of Budget, Accounting and Statistics (DGBAS).
As one examines the development of social expenditures in Taiwan, one could easily find that policyinitiatives to promote social development could be subdivided into three time periods:
A) THE EARLY PERIOD FROM THE 1950S TO THE MID-1960S:A series of land reforms undertaken by the government in the early 1950s had greatly enhanced theequitable distribution of income in Taiwan. The land reform programs (which included rentreductions, sales of public land, and the �land-to-the tiller� program) had substantially raised therelative income between farmers and the nonfarming population. These incentives greatly enhancedfarming productivity and maintained the low cost of food supply for the urban labor class, which inturn contributed to low wages for developing labor-intensive, light manufacturing industries forexports. As a result, labor employment increased and wage earners benefited more than they couldhave gained under the import-substitution policy as dictated by the Stolper-Samuelson theorem.Hence, initial equitable distribution of income was further enhanced by the growth of labor-intensiveexports during past decades of development.
Examining economic developments and government interventions in Taiwan and Korea, Rodrik(1995) argued that, among other factors, the initial conditions of equitable distribution of income andwealth in these two economies had enabled their governments �to focus on economic growth as thetop priority.� In other words, land reform and equitable distribution of income at the initial stage of
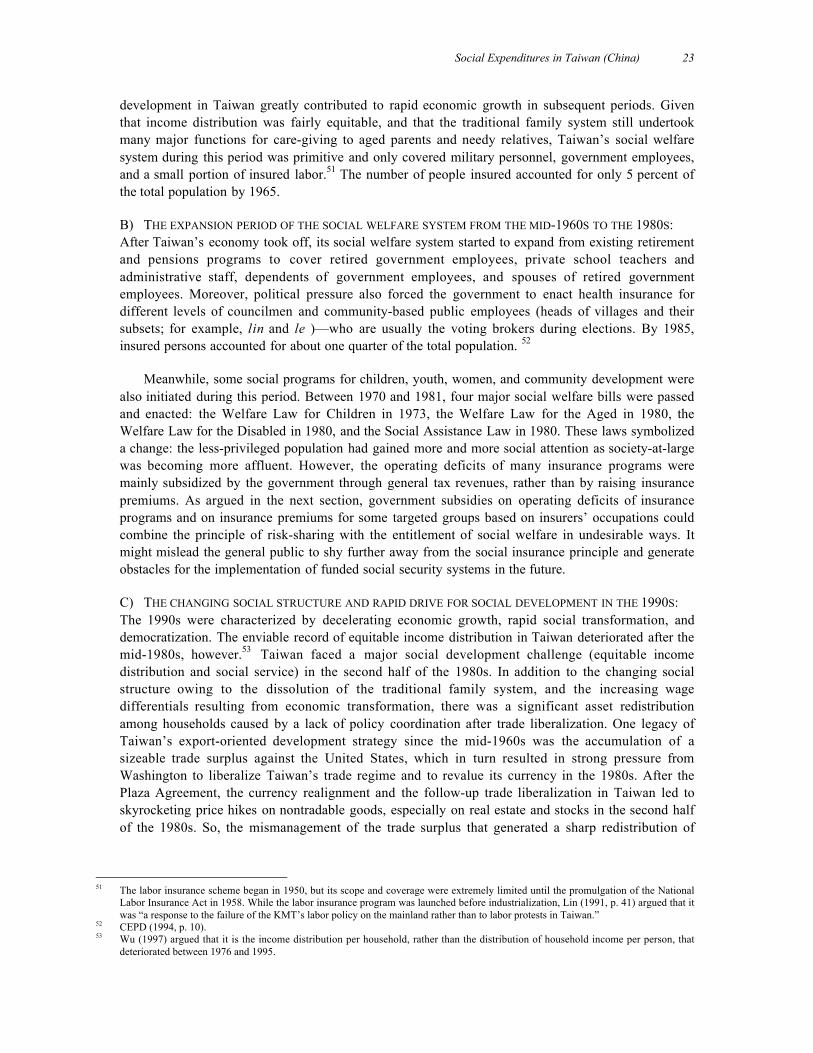
Social Expenditures in Taiwan (China) 23
development in Taiwan greatly contributed to rapid economic growth in subsequent periods. Giventhat income distribution was fairly equitable, and that the traditional family system still undertookmany major functions for care-giving to aged parents and needy relatives, Taiwan�s social welfaresystem during this period was primitive and only covered military personnel, government employees,and a small portion of insured labor.51 The number of people insured accounted for only 5 percent ofthe total population by 1965.
B) THE EXPANSION PERIOD OF THE SOCIAL WELFARE SYSTEM FROM THE MID-1960S TO THE 1980S:After Taiwan�s economy took off, its social welfare system started to expand from existing retirementand pensions programs to cover retired government employees, private school teachers andadministrative staff, dependents of government employees, and spouses of retired governmentemployees. Moreover, political pressure also forced the government to enact health insurance fordifferent levels of councilmen and community-based public employees (heads of villages and theirsubsets; for example, lin and le )�who are usually the voting brokers during elections. By 1985,insured persons accounted for about one quarter of the total population. 52
Meanwhile, some social programs for children, youth, women, and community development werealso initiated during this period. Between 1970 and 1981, four major social welfare bills were passedand enacted: the Welfare Law for Children in 1973, the Welfare Law for the Aged in 1980, theWelfare Law for the Disabled in 1980, and the Social Assistance Law in 1980. These laws symbolizeda change: the less-privileged population had gained more and more social attention as society-at-largewas becoming more affluent. However, the operating deficits of many insurance programs weremainly subsidized by the government through general tax revenues, rather than by raising insurancepremiums. As argued in the next section, government subsidies on operating deficits of insuranceprograms and on insurance premiums for some targeted groups based on insurers� occupations couldcombine the principle of risk-sharing with the entitlement of social welfare in undesirable ways. Itmight mislead the general public to shy further away from the social insurance principle and generateobstacles for the implementation of funded social security systems in the future.
C) THE CHANGING SOCIAL STRUCTURE AND RAPID DRIVE FOR SOCIAL DEVELOPMENT IN THE 1990S:The 1990s were characterized by decelerating economic growth, rapid social transformation, anddemocratization. The enviable record of equitable income distribution in Taiwan deteriorated after themid-1980s, however.53 Taiwan faced a major social development challenge (equitable incomedistribution and social service) in the second half of the 1980s. In addition to the changing socialstructure owing to the dissolution of the traditional family system, and the increasing wagedifferentials resulting from economic transformation, there was a significant asset redistributionamong households caused by a lack of policy coordination after trade liberalization. One legacy ofTaiwan�s export-oriented development strategy since the mid-1960s was the accumulation of asizeable trade surplus against the United States, which in turn resulted in strong pressure fromWashington to liberalize Taiwan�s trade regime and to revalue its currency in the 1980s. After thePlaza Agreement, the currency realignment and the follow-up trade liberalization in Taiwan led toskyrocketing price hikes on nontradable goods, especially on real estate and stocks in the second halfof the 1980s. So, the mismanagement of the trade surplus that generated a sharp redistribution of
51 The labor insurance scheme began in 1950, but its scope and coverage were extremely limited until the promulgation of the National
Labor Insurance Act in 1958. While the labor insurance program was launched before industrialization, Lin (1991, p. 41) argued that itwas �a response to the failure of the KMT�s labor policy on the mainland rather than to labor protests in Taiwan.�
52 CEPD (1994, p. 10).53 Wu (1997) argued that it is the income distribution per household, rather than the distribution of household income per person, that
deteriorated between 1976 and 1995.

24 Peter C. Y. Chow
assets among households undercut Taiwan�s long term record of equitable income distribution.54
While the ratio of disposable income of the highest 20 percent to the lowest 20 percent of householdswas only 5.34 to 1 in 1995, the average saving per household of the highest 20 percent to the lowest20 percent was 23.79 to 1.55 The ratio of asset distribution of the highest 20 percent of household tothe lowest 20 percent was 16.83 to 1 in the 1990s.56
The increasing unequitable distribution of assets generated a significant �wealth effect� throughcapital gains and property appreciation. This �wealth effect� caused by unequitable asset distribution(including rents, interest and dividends as well as capital gains), would lead income distribution tofurther deteriorate.57 Hence, the inconsistent policy objectives between trade liberalization and socialequity has substantially undermined the enviable income distribution that prevailed after the secondhalf of the 1980s. Because the government failed to implement appropriate taxing policy measures todeal with the asset redistribution caused by trade liberalization, Taiwan�s long-term equitable incomedistribution was jeopardized by its short-term shift of trade regimes. Moreover, as the money gametook hold, more and more financial resources were devoted to speculation on nonproductive assets,and workers� ethics (which had been an important asset for economic development), was substantiallyeroded. Hence, the negative aspect of the mismanagement of the trade surplus, and the lack of policycoordination between trade liberalization and social equity in the 1980s in Taiwan should providesome lessons for developing economies facing similar phenomena. For any economy to maintainequitable income distribution, a shift of its trade regime from protection to liberalization shouldsimultaneously be accompanied by a set of taxing policies to wipe out the �windfall gains� from theexisting owners of nontradable goods�for example, real estate and stocks.
The other factor contributing to the deterioration of income since the mid-1980s was the structuraltransformation of the economy. Available statistics indicate that wages and salaries of collegegraduates increased much faster than those of individuals without college degrees, and the incomes ofadministrators and managers increased 1.9 to 2 times while that of farmers and servicepeople onlyincreased 1.5 to 1.7 times in the second half of the 1980s. The increase of the share of the elderly inthe total population in the late 1980s created more and more low-income households among seniorcitizens. As the elderly�s share increased over time, the percentage of senior citizens aged 65 and overbelonging to low-income households increased from 9.9 percent in 1990 to 27.6 percent in 1992.
In addition to this demographic transition trend, and the erosion of traditional families, thedemand for social welfare services was further aggravated by the legacies of election politics asdemocratization in Taiwan accelerated following the lifting of Martial Law in 1987.58 The electionpolitics in Taiwan generated substantial political debts for elected officials and representatives, andthe incumbent government has been under strong political pressure ever since to expand more andmore entitlement programs without adding new sources of tax revenue.59 Therefore, partisan
54 At the peak of the bubble economy in 1988, the average price of residential housing was 17 times the mean of annual household
savings. The skyrocketing price of real estate in metropolitan areas made it impossible for any mid-income individual to purchase atwo-bedroom apartment with his or her life savings. Though the percentage of self-owned housing was reportedly 82.52 percent in1994, the data are meaningless unless statistics on the concentration of multiple housing are made available.
55 From DGBAS (1996b), table 104 (Disposable income, consumption expenditure, and savings of households).56 DGBAS (1991).57 The current system of taxing on �security transactions� rather than �capital gains� could further aggravate the deterioration of
equitable income distribution, but political considerations make it very difficult to change the existing tax system.58 Social welfare payments were considered as benevolence at the mercy of the leader under an authoritarian regime. Periodic elections
subsequently enhanced welfare politics owing to the buying of votes (in effect) in an immature democracy.59 A public opinion poll indicated that, while most people would like the government to expand its social welfare programs, only 18
percent were willing to pay more taxes for these expansions.

Social Expenditures in Taiwan (China) 25
competition by using votes-buying tactics through the welfare campaign intensified during theperiodic elections in the 1990s.60
FACTORS CONTRIBUTING TO PIECEMEAL EXPANSIONS OF SOCIAL WELFARE. The Confucian teachings offilial piety, the traditional extended family, and the patriarchal-patrilineal kinship society in Taiwaninspired the people to use �family� as the primary provider of care-giving for elderly parents andgrandparents. In that kinship society, it was perfectly legitimate for elderly parents and even grandparentsto depend on their children or grandchildren for care and financial support (including a living allowance).Meanwhile, this was considered a �glorious and noble obligation� for the younger generations.61 Hence, ina Confucian welfare state, the family, extended families, and even the community undertake a verysignificant role in fulfilling the functions of social services that are generally provided by the governmentin the Western industrialized welfare states (Jones 1993).
Prior to the 1980s, social welfare was pretty much considered a �residual� in overall social development.Social assistance for the needy provided by the government was generally considered as the last resort.Moreover, Taiwan�s people tended to place greater value (higher utility) on those monies received from theirchildren out of filial piety than those from government welfare programs. Under such circumstances, socialwelfare services provided by the government had never played a significant role in Taiwan. Hence, in termsof budgetary allocation, the priority funding of social expenditures was ranked with education at the top,followed by expenditures on health care, while social welfare spending was considered the lowest one exceptfor pensions and survivors� benefits for the targeted segments of the population.
Partly for that reason, economic security was institutionalized only for a targeted segment comprisingless than 10 percent of the total population.62 For government employees, military personnel, and privateschool teachers, pensions and survivors� benefits were built into their respective retirement systems.63 Asdemand for income security increased over time, more and more of the working population was broughtunder coverage through various retirement plans. By the end of 1996, 74.3 percent of the economicallyactive population aged 25 and over was covered under various pension plans and retirement systems.
Governmental social assistance was granted only to truly needy individuals, who were less than 20percent of the elderly population in the early 1990s. Dramatic changes in the social welfare benefits for theelderly occurred in the early 1990s. In May 1995, the government installed the �Temporary Statute forElderly Farmers� Welfare Allowance,� passed by the Legislative Yuan. It was estimated then that about19.4 percent of the senior citizens aged 65 and over were eligible for the �monthly benefits of livingallowances� for elderly farmers,64 and another 19.3 percent of senior citizens were thought to be eligible
60 T. J. Cheng and Chi Schive (1996).61 The tradition for children to take good care of their parents and grandparents has eroded recently. According to a survey of income
sources for senior citizens by the DGBAS, the percentage of children�s financial support in their total incomes declined from 65.8percent in 1986 to 52.3 percent in 1993. Meanwhile, children�s support accounted for 54.6 percent of major sources of income fornonfarming groups, and 29.6 percent for farming groups. Source: Survey of Senior Citizens, 1993 (DGBAS 1993).
62 There is an allegation that these pension programs favored the loyal supporters of the ruling party (which has been in charge of thecentral government since 1949). This allegation could be rationalized on the grounds of political economy, in that �a benefit shared byeveryone is no benefit at all� (Rigger 1995, p. 10). Despite denials from the government, there are political and social connotations inthe selections of the targeted population for institutionalizing economic security programs. Politically, military personnel andgovernment employees have been loyal supporters of the ruling party. Ethnically, prior to the 1970s, most key positions in the militaryand government were held by mainlanders who had come to Taiwan after 1949.
63 Teachers in public institutions (but not private ones) were considered civil service employees. Therefore, the inclusion of privateschool teachers in a government pension program was considered an expansion of the social welfare system. Meanwhile, thoseeligible for retirement pensions have the option of receiving a lump-sum payment or monthly benefits when they retire.
64 The proposal was initiated by the largest opposition party�the Democratic Progressive Party (DPP)�in the Legislative Yuan. Thelegislative process was completed without adequate planning and in the face of strong protest from the ruling party. The amount ofmonthly allowance of NT$3,000.00 was only half of the minimum living expenses set by the government. Its critics pointed out that itserved only a political purpose rather than a social or economic one. Moreover, it was argued that entitlement without means-testingwas not an efficient method of resource allocation and that the system was not equitable for low-income taxpayers who had to pay for

26 Peter C. Y. Chow
for subsidies for �aged people with middle to low income� by the end of 1995.65 Consequently, in additionto those eligible for various institutionalized retirement benefits with funded revenues, another 38.6percent of the senior citizens aged 65 and over were covered under the unfunded but institutionalizedsocial welfare programs by the end of 1996.66 This is why we argued that social assistance, socialinsurance, and income security were mixed in one other at the beginning of this section.
Taiwan�s rapid industrialization and social transformation led to the dissolution of the traditionalextended family and the erosion of social hierarchies in traditional society. The average family sizedecreased from 5.07 in 1977 to 3.92 in 1996. The share of the nuclear family (with four members or less)increased from 59.83 percent of total households in 1981 to 65.53 percent in 1996.67 In conjunction, thepercentage of coresidence of elderly parents with married children declined steadily from 70 percent in themid-1980s to 64.3 percent in 1996, and children�s support for elderly parents declined from 65.8 percent in1986 to 48.3 percent in 1996. This phenomenal development partially resulted in the increasing demandfor social welfare programs for senior citizens over time.
Therefore, Taiwan�s social welfare system could be characterized by an evolutionary process ofpiecemeal expansions driven by its modernization path. Taiwan�s lack of an institutionalized,comprehensive social welfare system could be attributed to the existence of the traditional family system,the equitable distribution of income and land at the initial stage, the repressed demand for social welfareunder authoritarian rule, and welfare clientelism (to be discussed later).68 At some point, the mechanism ofmodernization (such as the dissolution of the traditional extended family, the speeding up of the formationof nuclear families), the aging of the population, and the deterioration of income distribution) undercutsthe social functions of families. The welfare politics under democratization has further aggravated theproliferation of unfunded social welfare benefits. Moreover, there is a lack of consensus on how far thesocial welfare system should be implemented and to what extent Taiwan should imitate the Westernwelfare state. In short, it can be concluded that the piecemeal expansion of social welfare programs inTaiwan was caused by modernization, social transformation, and democratization.
In comparison with Singapore�s Central Provident Fund (CPF), which was first introduced in 1955,Taiwan�s national annuity system, even if implemented by the year 2000 as planned, would beconsiderably late by any criteria. What is the rationale for Taiwan�s belated social welfare system? Inanswer, Taiwan�s initial equity of income and land ownership owing to land reform at an earlier stage ofeconomic development enabled the government to concentrate mainly on economic growth, as Rodrik(1995) argued. Also, urbanization in Taiwan is a lot slower than in Singapore, which is basically a city-state. Taiwan�s approach toward its social equity seemed to focus more on the �equity� of educational andemployment opportunities, which was supposed to generate an even more equitable distribution of incomethan would have been possible otherwise. The government�s strong support of education actually reduced
this entitlement. It was also noted that the proposal would �increase the difficulties [in the] planning and integrating of a universalcoverage pension program.� See Joseph Lee (1995).
65 There were two categories of living allowance subsidy for middle- and low-income senior citizens based on the �minimum livingexpense� in 1993; the eligibility criterion for the first category (lowest income) was that one�s income could only be 1.5 times that ofthe �minimum living allowance,� whereas the second one specified an income level of 1.5 to 2 times. The criterion for the secondcategory was liberalized to 1.5�2.5 times in 1995. Since then, the monthly payment has been set at $6,000.00 per month for thoseeligible for the first category and $3,000.00 for those in the second category.
66 Among the 1.68 million senior citizens aged 65 and over at the end of 1996, 1.23 million were covered either by pensions or unfundedold-age benefits such as farmers� benefits, as well as living allowance for mid- to low-income households totaling 0.64 million.However, the noninstitutionalized provision of the �monthly benefits for honoring senior citizens� in some local governmentscontrolled by the DPP covered the rest of the aged population. It was estimated that the ratio of the elderly population without monthlyliving allowances from pensions or welfare payments had dropped to 26.8 percent by the end by 1996, as indicated by figure 2.
67 From DGBAS (1997).68 Lin (1991) argued that Taiwan�s belated welfare system could also be attributed to the lack of union representation and working-class
consciousness (or the presence of ambiguous consciousness at best). The former was caused by political exclusion during theauthoritarian regime whereas the latter is a result of a combination of the complicated class structure, the large number of small andmedium-size family-owned firms, and political inhibition.

Social Expenditures in Taiwan (China) 27
income inequity, which in turn lowered the public demand for social welfare for income redistribution.The export-led growth policy, which was focused on labor-intensive exports, generated more employmentopportunities and more equitable income for the labor class than an import-substitution policy would have.The prevalence of small and medium-size familial enterprises and complicated class structure reduced thelabor-management tensions commonly existing in industrialized economies. The inhibited labor movementand crippled trade union representations during the period of authoritarian regime had repressed the publicdemand for social welfare (Lin 1991). Moreover, during the authoritarian regime, the charismatic leaderwho tended to consider social welfare as the benevolence of his government had also delayed theinstitutionalization of a comprehensive social welfare system.
COMPARATIVE PERSPECTIVES ON THE POLITICAL ECONOMY OF SOCIAL WELFARE IN THE 1950S AND THE
1980S: IS THERE WELFARE CLIENTELISM IN TAIWAN? In terms of political economy, one interestingquestion to be addressed is this: why will the government of Taiwan, which was able to successfullyimplement the �land to the tiller� program and maintained an equitable distribution of income since the1950s, not push for a similar housing redistribution policy of �house to the tenant� program�particularlysince this lapse was contributing to the destruction of social equity in the 1980s? In fact, redistributingland ownership by taxing the �windfall profits� from land speculation in the urban areas was thecornerstone of the �principle of livelihood� formulated by Dr. Sun Yat-sen, whose teaching wasepitomized in the preface of the Constitution.69 Why did the government succeed in introducing landreform during the 1950s but failed to do the same with its urban housing policy in the 1980s?
The rationale lies with differences of the political economy of regime stability between these twoperiods. Being exiled to Taiwan in 1949, the Nationalist government led by the KMT had to legitimize itsleadership by generating social popularity and by fending off any potential challenge from the existingestablishment. At that time, the most likely indigenous threat to the KMT leadership would be the richlandlords. Hence, by implementing the land reform program and by redistributing land to the tillers underan authoritarian regime that was able to insulate itself from interest groups, the KMT government wouldgreatly enhance the legitimacy of its leadership and positively contribute to political stability in the 1950s.
However, democratization in the 1980s generated populist pressure on the incumbent. Electionpolitics enabled the rich property owners and land developers to allegedly collude with financial giants toput strong pressure on elected officials and representatives. Therefore, even though the KMT still controlsthe central government, political feasibility prohibits it from carrying out the teachings of Dr. Sun Yat-senon redistributing land ownership in urban areas. Unlike Singapore, where public housing would enhancethe popularity of the incumbent, the KMT government in Taiwan, facing the political reality of periodicelection under a multiparty political system, has not been able to offer a public housing program similar tothe one in Singapore for the �shell-less� tenants since the 1980s.70
Wang (1997) argued that there was a tendency toward �welfare clientelism� in Taiwan, under whichpolitical parties would propose social welfare policies in favor of their own supporters, excludingcompetitors� supporters from proposed programs. Accordingly, the central government�which has beenand still is under the control of the KMT�has gained loyal support from its clientele by providingpensions and survivors benefits to military personnel, veterans, and civil service employees rather than
69 Inspired by Henry George�s (1839�97) �single tax on land� (which was crystallized in his 1879 book, Poverty and Progress), Sun
Yat-sen�s �principle of livelihood� was dominated by the theory of �equalization of land rights,� which advocated that land tax beimposed to socialize the unearned increment of land value owing to social progress.
70 In a fashion that is similar to the American dream, owning one�s own home is considered an important indicator of social status inTaiwan. Tenants who are resigned to never owning a home ridicule themselves as �shell-less snails.� It should be noted that thegovernment did provide some low-cost housing for the labor class at one point. Those apartments were mainly built on public landwith a long-term lease (as opposed to the purchase of land) from the government. In the end, however, the limited supply did notcontribute to any significant increase of the home ownership for the �shell-less� poor.

28 Peter C. Y. Chow
providing a nationwide old-age income security program for all senior citizens.71 Similarly, one of theopposition parties, the Democratic Progressive Party (DPP), has tried to seek grass roots support throughlocal governments under its jurisdiction by providing monthly benefits for those senior citizens who wereexcluded from existing retirement pension schemes.72 The DPP may have identified those senior citizenswho had been excluded from existing income security schemes as its targeted clientele, and tried to gainits support by providing them with monthly living allowances through local government budgets. Hence,there is a proliferation of unfunded social welfare benefits since the 1990s as partisan politics for voters�support have intensified. To some extent, welfare clientelism (Wang 1994) has demonstrated its validity inrecent elections, as we see below.73
In the local election held in November 1997, the DPP scored a big gain, winning 12 out of a total of23 positions of mayors and magistrates (most of whom are in heavily populated urban areas), bringingmore than 70 percent of the total population under its jurisdiction. If the unfunded old-age monthlybenefits proposed by the DPP spread from the cities and counties under DPP jurisdiction to other areas,then it certainly would be detrimental to the full implementation of the funded national annuity program inthe future. Hence, the negative legacies of welfare clientelism should not be overlooked at all.
With the prevailing welfare politics, social insurance programs have expanded rapidly since the late1980s. The percentage of insured persons in total population more than doubled from 25.5 percent in 1985to 57.6 percent in 1995, which substantially increased the financial burden on the government. In general,the government either paid or subsidized insurance premiums through general tax revenues. Moreover, thegovernment usually supplemented the operating deficits of various programs through general tax revenuesrather than raising insurance premiums. Hence, the risk-sharing principle of insurance was violated andsocial welfare expenditures were mixed in with payments of insurance premiums. This could also lead,among other things, to moral hazard problems and further distortions of social equity in the future.74
TOWARD A COMPREHENSIVE NATIONAL ANNUITY SYSTEM IN THE TWENTY-FIRST CENTURY. The currentstatus of old-age income security (which, as we saw, is a result of piecemeal expansions of various socialwelfare schemes in the past) is summarized in figure 2.75 Several fallouts can be identified under thecurrent income security schemes. First of all, existing retirement benefit�pension schemes only covered74.25 percent of the working population aged 25�64 as of the end of 1996. Hence, more than one-quarterof the working population has no insurance for old-age income security at all. Among senior citizens aged65 and over, about 26.8 percent has no institutionalized retirement pension. The monthly payments of old-age living allowances provided by local governments under DPP are not sustainable financially, and notequitable socially at all. Therefore, Taiwan�s government intends to incorporate those without old-ageincome security protection, many of whom are disadvantaged groups badly in need, into the proposedNational Annuity System to be implemented by the year 2000.
71 Prior to KMT�s indigenization (Taiwanization) starting in 1972 under the premiership of Chang Ching Kuo, most key positions in the
party and government were held by the Mainlanders (those who emigrated to Taiwan after 1949) and their descendants. Based on thisfact, the theory of welfare clientelism (Wang 1994) argued that KMT had targeted the military personnel and government employeesas its clientele, whereas the DPP, a grassroots party that was dominated by local elites, had chosen the elderly farmers and seniorcitizens in general as its target clientele.
72 The provision of a monthly living allowance for senior citizens with no means-testing excludes those who have already had pensionand retirement benefits of any kind. However, fiscal centralism in Taiwan has forced local governments with limited leverage ofautonomous tax revenues to sustain the unfunded program forever.
73 Prior to a local election in November 1997, the KMT proposed the provision of a �monthly living allowance� for senior citizens,which was similar to DPP�s proposal in Taipei county. The KMT candidate for the Taipei magistrate still lost the election, however.
74 A typical example of moral hazard could be found in the liberal admissions policy on farmers� insurance. Since there is no agerestriction on farmers� insurance and there is generous government subsidy on its insurance premiums, the ratio of insured farmers tothe actual farming population increased from 126.1 percent in 1989 to 206.4 percent in 1997.
75 Figure 2 and the following discussions were derived from CEPD (1998b).

Social Expenditures in Taiwan (China) 29
Figure 2. Current Status of Old-Aged Income Security and The Proposed National Annuity System
Source: CEPD (1998b).
Second, owing to piecemeal expansions of various social welfare programs, government subsidies oninsurance premiums for many of the insurants were based on their occupations rather than income status.Hence, the distribution of welfare resources is far from equitable. There is substantial room for welfarereform, if one considers government subsidy to be �welfare.� Third, existing income security programshave no mechanism for transferring insurants� equity from one retirement scheme to another. If onechanges jobs involving two different insurance schemes, then the lack of a transferring mechanism wouldresult in substantial loss to the insured. This lack of transfer mechanism in current income-securityschemes could create a �lock-in effect� and reduce labor mobility in the labor market.
Fourth, the lump-sum payment for retirement benefits and pensions could lead to financial crisis if therecipients are unable to manage their retirement funds properly. A comprehensive national annuity system

30 Peter C. Y. Chow
that would integrate various pension and social welfare programs to cover all of the working-agepopulation is expected to be implemented before 2000.76 The principle for basic annuity is to require thatall working individuals under age 64 to join the national annuity system. Except for low- and middle-income households, everyone would have to contribute part of his or her income toward a trust fund untilretirement age before he or she is eligible for the basic annuity. The retirement benefits would be tied toindividual contributions.
If the proposed national annuity system is implemented by 2000 as planned, then the development ofTaiwan�s belated welfare state could be described as an evolutionary process in its overall modernization.Its merits and drawbacks are to be evaluated in the next-to-last section.
The Gradualism Principle in the History of the National Health Insurance System
Contrary to the social welfare system for income security that is limited to a segment of the population,and selective welfare services to the needy only, the health care system in Taiwan is characterized by itscomprehensiveness and near-universal coverage. Given the legal basis for providing extensive services forsanitation and health protection to its people,77 the government of Taiwan was dedicated to pursue the goalof good health for all people. Owing to rapid industrialization, urbanization, and demographic transition inthe past decades, the demand for health care and medical services had increased over time. Yet, thedevelopment of health care and medical service and the eventual implementation of the National HealthInsurance (NHI) system was characterized by a step-by-step gradualism principle in accordance withsocioeconomic development, demographic transition, and democratization.
DEVELOPMENT OF PUBLIC HEALTH AND MEDICAL CARE IN THE POSTWAR PERIOD. Based on selectedindexes of health performance�such as life expectancy at birth, infant mortality rate, and maternalmortality rate�reported in tables 1 and 2, Taiwan has reached a status of �high human development�among developing economies, and has even outperformed industrialized economies in many aspects suchas infant mortality and maternal mortality rates. At the bottom of table 7, one can also find that the shareof total health expenditures in GDP increased from 4.2 percent in 1990 to 5.48 percent in 1996. This ratio,though still far below those in industrial economies, is far above most other developing economies. Itwould be interesting to study Taiwan�s health care and medical services and derive some lessons for otherdeveloping economies. A brief review of the development of public health and medical care in the postwarperiod would be informative for many outsiders. We divide this history into three periods:78
A) THE INCEPTION PERIOD (1947�70)
During the immediate postwar period, the government reconstructed the health services system andexpanded medical education from what was left by the Japanese occupation. At the grass roots level ahealth station was set up in each township, whereas a health bureau was set up in each city and countydistrict.79 The focus of public health was aimed at effective prevention and control of communicablediseases, the implementation of family planning, and the improvement of family and environmental
76 The proposed national annuity system would require all members of the working population aged 25 to 64 to join in the system by
paying monthly premiums until they retire at age 65. The distribution of premiums under the current proposal is 20 percent paid by thegovernment, 64 percent paid by the employer, and 16 percent paid by the employee.
77 The legal basis could be traced to the following stipulations in the Constitution and its amendments. Article 155 stipulates that �theState, in order to promote social welfare, shall establish a social insurance system.� Article 157 stipulates that �the State, in order toimprove national health, shall establish extensive services for sanitation and health protection, and a system of public medicalservice.� Section 4 of Article 9 of the Constitutional amendment also stipulates that �the State shall promote national healthinsurance.�
78 The following section was derived from Department of Health (1994).79 Major functions of health stations include medical services in outpatient clinics, services in maternal and children�s health care, family
planning, prevention and control of chronic and acute diseases, health education, sanitation inspections, and immunization.

Social Expenditures in Taiwan (China) 31
sanitation. The expansion of medical education enabled medical personnel and facilities to growrapidly. Immunization programs were implemented and free vaccinations were made available forinfants and children.80 Therefore, many communicable diseases were brought under effective control.In 1965, the World Health Organization (WHO) declared that Taiwan was free of malaria, and hasrenewed that designation since then. Other plagues such as smallpox and rabies were eliminated oneafter another.
Table 7. Statistic of Governmental Expenditure for Health, 1990�96
1990 1991 1992 1993 1994 1995 1996
Amount ofMoney (%)
Amount ofMoney (%)
Amount ofMoney (%)
Amount ofMoney (%)
Amount ofMoney (%)
Amount ofMoney (%)
Amount ofMoney (%)
Government Sector 29,086,496 16.07 34,391,982 15.55 40,288,075 16.21 43,784,459 15.50 44,293,149 13.85 42,435,251 11.43 42,128,728 10.28
Health AdministrationAgencies
9,041,752 5.00 11,475,663 5.19 13,845,326 5.57 12,362,921 4.38 11,569,354 3.62 11,839,598 3.19 12,716,364 3.10
Current Account 7,158,324 3.96 8,712,812 3.94 8,054,565 3.24 6,980,612 2.47 7,330,008 2.29 7,557,366 2.04 8,296,719 2.02
Capital Account 1,883,428 1.04 2,762,851 1.25 5,790,761 2.33 5,382,309 1.91 4,239,346 1.33 4,282,232 1.15 4,419,645 1.08
Medical Care Institutions 1,934,824 10.57 21,803,599 9.86 25,445,535 10.24 30,546,711 10.82 31,855,384 9.96 29,883,100 8.05 28,738,394 7.01
Current Account 11,973,331 6.62 15,264,189 6.90 19,564,609 7.87 23,701,780 8.39 24,639,804 7.71 22,578,293 6.08 21,775,566 5.31
Capital Account 7,161,493 3.96 6,539,410 2.96 5,880,926 2.37 6,844,931 2.42 7,215,580 2.26 7,304,808 1.97 6,962,828 1.70
Other Government Sector 909,920 0.50 1,112,720 0.50 997,214 0.40 874,827 0.31 868,411 0.27 712,554 0.19 673,971 0.16
Insurance Sectora 62,775,500 34.69 79,252,648 35.83 98,422,260 39.59 111,506,334 39.48 129,583,707 40.53 194,455,104 52.38 221,193,127 53.97
Bureau of NationalHealth Insurance MedicalBenefits
— — — — — — — — — — 162,580,621 43.80 221,193,127 53.97
Government Employees'Insurance (and related)
10,558,024 5.83 12,683,592 5.73 16,021,742 6.44 19,546,405 6.92 22,872,835 7.15 5,149,970 1.39 — —
Labor Insurance 37,647,266 20.80 48,348,735 21.86 58,551,243 23.55 64,774,795 22.94 76,144,434 23.81 18,074,094 4.87 — —
Farmers Health Insurance 14,351,813 7.93 17,203,230 7.78 21,939,799 8.83 24,764,837 8.77 27,926,156 8.73 6,846,138 1.84 — —
Councilmen HealthInsurance
199,707 0.11 282,878 0.13 488,756 0.20 568,261 0.20 648,085 0.20 429,323 0.12 — —
Low-Income HouseholdHealth Insurance
18,690 0.01 734,213 0.33 1,420,720 0.57 1,852,036 0.66 1,992,197 0.62 1,374,958 0.37 — —
Private Sector 89,097,000 49.24 107,569,000 46.63 109,887,490 44.20 127,129,218 45.01 145,856,526 45.62 134,329,765 36.19 146,505,974 35.75
Household 82,757,000 45.73 98,691,000 44.61 99,954,490 40.21 116,480,218 41.24 134,913,526 42.20 117,849,765 31.75 127,097,974 31.01
Nonprofit Organization 246,000 0.14 274,000 0.12 287,000 0.12 321,000 0.11 356,000 0.11 439,000 0.12 495,000 0.12
Capital Investment 6,094,000 3.37 8,604,000 3.89 9,646,000 3.88 10,328,000 3.66 10,587,000 3.31 16,041,000 4.32 18,913,000 4.61
Total 180,958,996 100% 221,213,630 100% 248,597,825 100% 282,420,011 100% 319,733,382 100% 371,220,120 100% 409,827,829 100%
Per Capita healthexpenditure(NT$)
8945 10815 12036 13546 15163 17455 19114
Health expenditure aspercentage of GNP
4.10% 4.49% 4.57% 4.73% 4.95% 5.33% 5.44%
Health expenditure aspercentage of GDP
4.20% 4.60% 4.66% 4.81% 5.01% 5.39% 5.48%
a. After 1995, all insurance programs were integrated into NHI.Source: Department of Health (1997).
During this period, there were only three major health insurance schemes, covering only a smallsegment of the population: Labor Insurance (LI) for private sector employees, GovernmentEmployees� Insurance (GEI), and Retired Government Employees� Insurance (RGEI). With limitedmedical resources, the government�s efforts were focused more on the prevention and control ofdiseases and less on concrete policy measures to promote health care and medical services for allpeople. However, at the time when institutionalized health insurance was limited to a small,segmented population, and the government could only take care of public health, the private sectorhad assumed a significantly active function in health care. During this period, a great majority ofmedical expenditures were covered by individuals, family members, extended families, and evenmutual assistance groups from respective communities.
80 The government is dedicated to eradicating the vaccine-preventable communicable diseases by freely providing immunization shots
against polio, tuberculosis, hepatitis-B, and so on, for all infants and pre-school-age children.

32 Peter C. Y. Chow
B) THE EXPANSION PERIOD (1971�85)Economic development and improvement of living standards created more demand for medicalservices and health care. It also led to rapid expansions of medical facilities and supplies of healthpersonnel. The total number of health personnel increased from 18,227 to 66, 278, and the number ofhospitals went up from 7,107 to 12,323 in the period between 1971 and 1985. As a result, the numberof health personnel per 10,000 increased from 12.16 to 34.42, and the number of hospital beds per10,000 increased from 15.99 to 38.47 in the same period.81
Among different types of medical facilities, private clinics and hospitals have grown much fasterthan public ones. The expansion of public clinics and hospitals were limited by the governmentbudget. By contrast, the growth of private ones was primarily based on the market demand for healthcare. The systemic education of medical personnel launched in the inception period could supply thepublic with the necessary labor force for medical care.
In fact, the government took a �market-friendly� approach to the expansion of private clinics andhospitals. Since the colonial period (1895�1945), medical profession had been able to attract the besttalents from the inhabitants of Taiwan. From a political viewpoint, as intellectual elites were attractedto a busy medical career, and benefited from these profitable businesses, they would have less time toengage in political sabotage against the government�either colonial or authoritarian. Meanwhile, themedical profession used to be considered as a benevolent social service under which the governmentwould only collect personal income taxes but not the general business (corporate) income taxes.Hence, given the social status of the medical profession and the market-friendly approach adopted bythe government, the growth of private clinics and hospitals was not checked by the existence of theauthoritarian regime (1947�87).
Meanwhile, the provisions of medical services by missionary hospitals and other nonprofitinstitutions had greatly enhanced the quantity and quality of medical services. However, in terms ofthe number of hospital beds, the private sector�s capacity multiplied by 2.85 while that of the publicsector went up to 3.49 times the original number during this period.82 This phenomenon reflected therelative size of medical facilities between the private and public sectors.
Government efforts in developing the infrastructure of public health care enabled the healthindustry to grow rapidly in this period. Policy measures for health insurance were moving at anevolutionary pace. The three major insurance programs�Labor Insurance, Government EmploymentInsurance (including retired employees), and Insurance for private school teachers and administrativestaffs�expanded the number of their insurants steadily to nearly 40 percent of the total populationduring this period. Each of these programs were gradually expanded to cover the spouses anddependent children of the insured.
Among major insurance programs, the Government Employees� Insurance program has beenoperating with persistent deficits that are mainly compensated by general tax revenues rather than raisinginsurance premiums. The operating deficits in all health insurance programs increased steadily and hadexceeded 20 percent of total operating costs by the mid-1980s. Cumulative operating deficits fromGovernment Employees� Insurance and Labor Insurance exceeded NT$140 billion by the early 1990sprior to the implementation of NHI in March 1995. In other words, in addition to subsidies on insurance
81 From DGBAS (1995), table 56 (Medical Facilities and Health Personnel).82 Calculated from Department of Health (1996b).

Social Expenditures in Taiwan (China) 33
premiums for various insurants, the government subsidized 20 percent of the operating cost of healthinsurance for those insurers that took care of nearly 40 percent of the total population. This legacyeventually leads to a proliferation of �entitlement,� as the government has to subsidize health insurancepremiums for some segments of the population in order to persuade them to join the NHI scheme.However, we should note that medical care and health expenses accounted for 4.5�5.3 percent ofhousehold consumption expenditures during this period.83 In other words, individuals, families (andextended families, if any), still assumed the main responsibility for medical expenses for the uninsured.
C) THE INTEGRATION PERIOD (1985�PRESENT).One legacy of the rapid expansion period is an unequal distribution of medical care resources amongdifferent geographic regions.84 A major step of integrating the existing health and medical care system inthis period was establishing a medical care network, and then promulgating the Medical Care Law andamending the Physician�s Law. This was followed by a second-stage plan that stressed the addition ofprimary care units, establishing district hospitals, and setting up an emergency medical care network.Meanwhile, the Farmers� Health Insurance (FHI) program was installed in July 1989, and otherinsurance schemes were gradually expanded to cover more retirees and dependents of the insured. By1994, 57.6 percent of the total population was covered under various health insurance programs.
In 1986, the government declared its determination to implement the National Health Insurance(NHI) system by 2000. Later, it was announced that NHI would be intact before 1994. On July 19,1994, the Legislative Yuan passed the �National Health Insurance Law,� which was amended later toinclude the provision of �mandatory enrollment� in the program. Eventually, the plan wasimplemented in March 1995. Essentially, NHI integrated the existing health insurance programswithin Government Employees� Insurance, Labor Insurance, and Farmers� Health Insurance systemsand other programs, and extended the coverage to insured individuals� dependents, spouses, andothers�thus creating a comprehensive national insurance system. Anyone who has registered forresidence in Taiwan for more than four months is eligible to use the NHI system. Within nine monthsof its actual start, the newly initiated NHI covered 92.34 percent of the total population by December1995, and increased this to 96.27 percent by January 1997�a jump of nearly 8 million insured in lessthan two years. Among the remaining 3.71 percent of uninsured individuals (nearly 0.8 million), mostof them belong to socially disadvantaged groups.
A COMPARISON OF THE DEVELOPMENT OF HEALTH INSURANCE SYSTEMS IN JAPAN AND TAIWAN. In manyrespects, the progress of Taiwan�s medical care and health insurance is similar to those in industrializedeconomies, especially Japan. However, NHI in Taiwan was a considerably belated development of socialpolicy in comparison with most OECD economies. In the 1960s and early 1970s, the greatest emphasisregarding health care in industrialized economies remained on the establishment of a strengthened healthcare system, and the question of promoting equitable medical services. The emphasis on health promotioncame at a later date in most OECD economies, as it did in Taiwan. But, in spite of their similarity indeveloping health care, the initiation date of a comprehensive health insurance system in Taiwan was latecompared with what had occurred in Japan.
Why did Taiwan implement its comprehensive NHI at a later stage than Japan, which had itsComprehensive Health Insurance system (CHI) as early as 1961? In addition to different stages ofeconomic development between Japan and Taiwan, there are at least three major reasons for Taiwan�sbelated development of its NHI. The first one was in the different weights of national defense expendituresin respective government budgets. As noted previously, Taiwan�s government had to spend more than 40 83 From DGBAS (1995), table 15 (Structure of Household Consumption Expenditure).84 At that time, one practicing physician in villages or townships served 4,000 persons, whereas his or her counterpart in urban areas
served only 1,800.

34 Peter C. Y. Chow
percent of its budget on national defense in the 1960s, and nearly 30 percent in the 1970s. Given the heavyburden on national defense, the legal protection on educational expenditures in the government budget,and the legacies of existing insurance programs (which required the government to cover the operatingdeficits through general tax revenues), the government could not afford to implement the NHI plan at anearlier date. Such a comprehensive insurance system could not be introduced until the share of nationaldefense in government budget decreased in the 1990s. The second reason was the relative scarcity ofmedical facilities in Taiwan. Available medical facilities in Taiwan in the 1990s were much less developedcompared with Japan when the CHI system was installed in the 1960s. Although the number of physiciansper 10,000 people was 12.9 in Taiwan in 1995, comparable to a figure of 11.04 in Japan in 1960, if weexclude traditional Chinese herb specialists working as doctors, then Taiwan had only 8.7 physicians per10,000 people in 1995, which is much less than the Japanese figure prior to the implementation of its CHIin 1960. The number of hospital beds per 10,000 people in Japan was 73.5 in 1960, but was only 52.62 inTaiwan when NHI started in 1995.85 In terms of the percentage of population covered by health insurance,Japan reached 98.7 percent in 1960 whereas Taiwan only reached 57.6 percent prior to the initiation ofNHI. So, to implement the CHI in Japan would only marginally expand its coverage and modestly increasedemand for medical services. The NHI system in Taiwan, by contrast, substantially increased the demandfor medical care services as its insured population increased by nearly 35 percent of the total population.
Third, Japan�s democratization was completed by the early 1950s whereas Taiwan started its full-scaledemocratization as late as 1987, when Martial Law was lifted. Undoubtedly, Taiwan�s NHI was speededup by strong populist pressure after democratization gained its momentum in the late 1980s. Had Taiwanbeen democratized at an earlier date, then the NHI system could probably come into play by populistpressure at an earlier date than the mid-1990s.
CURRENT STATUS OF THE NHI SCHEME: PROBLEMS AND PROSPECTS. At the time of writing (May 1998),Taiwan�s belated NHI has just completed its third year of operation after its initiation. Currently, NHIcovers 96.27 percent of the total population, an increase of 7.9 million people in less than three years.Contracted clinics and hospitals account for 91 percent of all health institutions. By the end of 1996,administrative expenditures of NHI only accounted for 2.55 percent of total operating costs. This ratio isnot only far below the legal ceiling of 3.5 percent, but is also lower than equivalent figures in otherindustrialized economies. Hence, NHI has achieved significant administrative efficiency in its first threeyears of operation.
Theoretically speaking, NHI in Taiwan is based on the principles of �self-sufficiency� and �risk-sharing.� Except for the administrative cost and subsidies of the premiums for legally targeted segments ofthe population,86 the government is not supposed to be responsible for any operational losses or gains.Moreover, the insurance premiums (which are shared by the employers, employees, and the government)are supposed to be adjusted periodically with a ceiling of the premium rate of 6 percent. Revenues frompremiums (contributions) are expected to meet total operational expenditures with 5 percent of the totalcontributions to be deposited as a Security Fund to balance the incomes and expenditures in the longer run.Relative to the controversy revolving about the coverage and cost-sharing of the social welfare system, theimplementation of NHI had a more widespread consensus among the public in that the �pay as you go�principle was more socially acceptable. The policy objective of having its �contribution in line withexpenditures� and �self-sufficiency� in its financial structure was met in the first few years of
85 For international comparisons, the number of hospital beds per 10,000 people was 37 in Korea, 46 in the United States, and 158 in
Japan in 1995. The number of physicians per 10,000 people was 17 in Japan, and 22 in the United States in 1995.86 In addition to paying 60 percent of the insurance premium as an employer for military dependents and government employees, the
government subsidized 100 percent of the insurance premiums for low-income families and retired servicemen (70 percent for theirdependents), 70 percent for farmers and fishermen, 40 percent for organized communities and members of occupational associations,30 percent for private school teachers, and 10 percent for laborers in the private sector.

Social Expenditures in Taiwan (China) 35
implementation. To control waste in medical care services under the NHI scheme, the government set upan auditing system to manage and supervise the providers� contracts, and to monitor and investigate theclaims. A copayment system with a lower rate for primary care clinics and higher rates for regionalhospitals and medical centers is expected to encourage patients to use the primary care clinics for minorillnesses, and large hospitals only for more complicated cases and for more comprehensive care. Theceilings on various schemes of copayment include 6 percent of the average per capita income in theprevious year, 30 days for the discharge of an acute patient, and one year for inpatient care.
One basic principle of keeping the cost of health insurance in check is the �equal payment for equalservice� for outpatient care, and the diagnosis-related group practice of per-case payment for inpatientcare. With regulations on fee schedules, the government anticipated that competition among medical careproviders would improve the quality and efficiency of medical care services under NHI. However, criticspointed out that there was a lack of cost-sharing mechanism because the insured only pay a nominalregistration fee regardless of the intensity of treatment.87 For inpatient care, the cost-sharing scheme is topay additional charges for upgrading beds and part of the cost of meals during hospital stays. The lack ofan appropriate cost-sharing mechanism could lead to the abuse of medical resources and eventuallyjeopardize the financial solvency of the NHI system.
As reported in table 7, government expenditures for health care increased from NT$180.96 billion in1990 to NT$409.83 billion in 1996. After adjustment based on the consumer price index, there was a netincrease of 88.73 percent in health spending between 1990 and 1996. By breaking down governmenthealth expenditures into government, insurance, and private sectors, one can find out from table 7 that theshare of the government sector in health expenditures decreased from 16.07 percent in 1990 to 10.28percent in 1996, while that of the private sector decreased from 49.24 percent to 35.75 percent in the sameperiod. The share of the insurance sector, by contrast, increased from 34.69 percent in 1990 to 53.97percent in 1996. As noted before, government subsidy on insurance premiums accounted for nearly one-third of the NHI budget after 1995. Hence, one can argue that government share in overall healthexpenditure was approximately 26.5 percent in 1996.
By the end of 1997, the revenues collected from premiums exceeded program expenses. However, thegrowth rate of these is only 3.3 percent per year, whereas that of spending was more than 7 percent sinceNHI was implemented. Moreover, with the expansion of the coverage of NHI and the liberalizing of thecopayment waiver, the target of controlling the growth rate of expense at 10 percent per year may not befeasible in the near future. Hence, the fiscal structure of the NHI scheme must be adjusted before itseventual insolvency in the longer term.
Next, government subsidies on insurance premiums for the legally targeted population accounted fornearly one-third of the total NHI budget. Hence, Taiwan�s government seemed to assume a vital role inmaintaining the financial stability of NHI. This caused a dramatic growth of social welfare expenditures inthe government budget at a rate of 46.2 percent in 1995 and 25.1 percent in 1996�at a time when totalgovernment expenditures went up by only 8.4 percent and came down by 3.3 percent, respectively, inthese two fiscal years.88 Direct government involvement in the NHI scheme has put the government in ashaky position of assuming the risk of managing public health, rather than spreading the risk to the insuredpopulation. In that regard, it seemed that the government of Taiwan had decided that health insurance wasa �public good.� Therefore, the government subsidized health insurance premiums for various targetpopulations through general tax revenues. Other examples of this involve NHI being extended to many
87 The registration fee is NT$50.00 for each office visit at the primary care clinic and district hospital, and NT$100.00 at regional and
medical hospitals. By converting into U.S. dollars at the current exchange rate, they are $1.43 and $2.86, respectively.88 Calculated from Ministry of Finance (1995, table 3). The figures refer to net government expenditures at all levels of government.

36 Peter C. Y. Chow
areas of public health care such as insurance for AIDS patients and the management of the separation ofmedical services from dispensing prescriptions.89
However, any �public good� is bound to result in a �free rider� problem unless there is a clear-cutprinciple of cost-sharing. It seems that the legacy of piecemeal expansions of welfare has alreadygenerated a misconception about the risk-sharing principle of NHI among the general public. In addition tothe lack of a cost-sharing mechanism, government subsidy on health insurance premiums would mix theinsurance principle in with entitlement programs and violate the �risk-sharing� and �pay as you go�principles of any insurance system. Moreover, the government�s subsidizing various segments of theinsured population based on occupational status distorts the redistributive effect of transfer payments andaggravates income inequality, as indicated before. Hence, for the NHI system to become sustainable, it isnecessary to review the legitimacy and social justice of government subsidies on insurance premiums,90
the cost-sharing schemes for medical services, the quality of medical service provided, and alternativesystems in terms of managerial efficacy.91 None of these reviews would be easy to accomplish given thecurrent political constraints of immature democracy.
The expanding NHI did increase the delivery of medical services according to the statistics of theHealth Department; the number of clinic visits increased 13 percent between 1994 and 1995. The numberof in-hospital patients increased 9.4 percent and the average hospital stay went up from 11 days per personto 15 days in the same period. As a result, the occupancy rate of hospital beds increased from 55 percent in1994 to 61 percent in 1995�an increase of 6 percentage points a year after the implementation of NHI. Itis difficult to evaluate whether there is any social waste caused by the abuse of the NHI system. Atpresent, there is no accurate dataset available to measure the quality of medical services in Taiwan.However, one survey has shown that the approval rate of NHI increased from 33 percent in the early daysof its implementation to 78.4 percent in January 1998.
The government seems to have deliberately upgraded the delivery of medical care services byintegrating health and medical care systems (the former applies to preventive care, and the latter totreatment), and by providing computerized information services so as to make immediate and adequatehealth and medical care services available to the people. Therefore, medical service and health care inTaiwan can be further upgraded to levels that are close to those in OECD economies. Consequently,Taiwan�s health performance�in addition to the increasing life expectancy and declining infant mortalityrates reported in table 2�is reflected in the changes of major causes of death from acute infectiousdiseases such as gastritis, pneumonia, and tuberculosis to chronic diseases, accidents, and injuries.
Another interesting aspect is observed by comparing the role of government in health care with thoseof other developing economies. The Korean government, for instance, only covered administrative costswhile it left insurance premiums to be entirely borne by employers and the insured. Even thoughgovernment subsidies in Taiwan of insurance premiums for low-income families and retired servicemen(100 percent) may be justified for social equity, other subsidies on insurance premiums based onoccupations of the insured�such as farmers and fishermen (70 percent) and community-based populations(40 percent)�were mainly attributable to political rather than socioeconomic justifications. As a result of 89 Physicians in Taiwan used to perform a dual duty of providing medical services and dispensing prescriptions to their patients. The law
required that dispensing prescriptions be separated from performing medical services after two years of implementing the NHIscheme. Therefore, Taiwan was supposed to implement the policy by March 1, 1997. Under heavy fire from pharmacists, it waspostponed for one more year, to March 1, 1998.
90 After integrating into the NHI system, in addition to the 60 percent share of insurance premiums for its own employees� insurance, thegovernment also shared 10 percent of the insurance premiums for labor insurance and 70 percent of farmers� insurance. Thediscriminatory treatment of different professions is challenged by critics on grounds of social injustice.
91 Under the NHI Act, there is a sunset clause that requires the government to review the entire NHI system after two years of itsoperation. At the time of writing (May 1998), it was reported that the government had decided to transform the NHI scheme into a�government-operated but privately managed� health care system based on the self-sufficiency principle.

Social Expenditures in Taiwan (China) 37
those entitlement programs, government subsidy on insurance premiums accounted for one-third of theoperating budget of the NHI system. Hence, the share of social welfare expenditures at all levels of thegovernment budget (including pensions and survivors� benefits) in Taiwan reached 21.2 percent in 1996,compared with only 13 percent in Korea.
There are five major policy objectives for the NHI system to pursue in the near future:92
(1) To expand NHI coverage by universally insuring all of the population. Because most of theremaining uninsured are in disadvantaged groups, residents in mountainous areas and offshore islands, andunemployed people, it may require further government subsidy on the marginal population who cannotafford to pay premiums, and yet are not eligible for government subsidy under the present social assistanceact.
(2) To maintain the financial solvency of the NHI scheme. To accomplish this goal, it is necessary torequire the government to set up an actuarial model by equitably determining premiums for all insurants.In particular, as pointed out by critics, government employees should pay their premiums based on totalsalaries. Next, to improve the management of the Safety Fund by investing in government, corporate andtreasury bonds, and by depositing the collected premiums in interest-bearing and other profitable financialassets. Then, to control medical costs charged by the providers, and to set up an appropriate cost-sharingmechanism to keep an eye on the abuse of medical resources and to build a healthy and sustainablefinancial system for NHI.
(3) To provide equal opportunities for all insured people. Policy measures such as reducing themedical costs of residents in the mountainous and remote areas, and balancing the distribution of medicalresources between urban and rural areas to increase the accessibility of medical services for everyoneshould be seriously considered.
(4) To improve the managerial efficacy of NHI. Many policy proposals such as privatizing the NHIsystem and increasing managerial autonomy are still pending on legislative actions. This process needs tobe speeded up.
(5) To improve the quality of medical service by monitoring the providers. All of these policymeasures bring us close to the �Goal of Health for All,� set by the Health White Paper announced by theDepartment of Health in 1994.
In summary, Taiwan�s gradualism in providing comprehensive health insurance for its people wasbrought on by its budgetary constraints generated by the heavy burden on national defense, the availabilityof medical facilities, and the late arrival of its democratization. Political calculations have resulted in thepiecemeal expansion of social welfare programs under the principle of gradualism, mandating thegovernment to subsidize insurance premiums for several segments of the population. To some extent, thegovernment of Taiwan has considered health care as a public good, which invited direct governmentinvolvement in managing NHI. But without a clear-cut cost-sharing scheme, it is easy to encounter thefree-rider problem and the abuse of medical resources.
Government subsidy on insurance premiums for low-income families may be justifiable for socialequity, but not necessarily for other people based on occupation. As government subsidy accounted for asignificant share of health expenditures, the risk-sharing NHI system has turned into entitlement.
92 The following statements were derived from CEPD (1998b).

38 Peter C. Y. Chow
As demand for health care increases over time, medical resources need to be appropriately allocated toaccomplish the �Goal of Health for All.� Given the increasing dependency ratio (caused by the aging ofthe population) and the high income-elasticity of demand for health and medical services, Taiwan mayhave to spend more and more on health and medical care in the future.
An Evaluation of the Development of Social Spending in Taiwan
Social expenditures in Taiwan are somewhat unique with divergent patterns in their respective paths ofdevelopment. Investment in human capital for economic development was carried out by labor forceplanning programs, through government priority funding in educational budgets. Though the supply oflabor was monitored by the government, a combination of government planning and market mechanismthrough open competition for educational advancement enabled individuals to pursue their own goals.
Considering health care as a public good, the government implemented a comprehensive nationalhealth insurance system (NHI) through a gradualist approach based on available financial and medicalresources. The step-by step expansions of various health insurance programs before eventually comingtogether under a unified NHI is another unique feature of Taiwan�s experience in the provision of healthcare. The gradualism in pushing toward the �health for all� principle through a comprehensive NHI wasdriven in accordance with the availability of financial and medical resources, and political considerationsinvolving heavy national defense spending and election politics.
Since social welfare expenditures used to be dominated by the pensions and survivors� benefits for asegment of the population, the theory of welfare clientelism seems to have some validity. Acomprehensive �safety net� of income security for all people will be implemented by integrating existingpension schemes into a National Annuity System in the future. Before the comprehensive NationalAnnuity System was initiated, piecemeal expansions of social welfare resulted in substantial legacies interms of unfunded social welfare payments. The following evaluations could possibly offer some lessonsfor other developing economies when they are mapping out their social expenditures policies.
Education: A free, nine-year compulsory education at the primary and junior high school levels ofeducation is required by law. By the academic year 2001, this will be extended to 12 years (the senior highschool level). Periodic adjustment of the enrollment ratios between vocational schools and senior highschools, and labor force planning regarding college enrollment are intended to coordinate the supply oflabor with that of market demand. The distributional pyramid of educational expenditures is consistentwith social rates of return on all levels of education. The education system is a mixture of governmentplanning and market competition, with government monitoring the outputs of education through budgetaryallocation while allowing individuals to compete with each other for educational advancement. Theconstitutional mandate of the priority allocation of government budget on education�though erodedsomewhat at the central government level during the period of authoritarian rule�is an important lessonfor other developing economies, especially for those whose military expenditures dominate the overallgovernment budgets. The rationale of having legal protection over education expenditures may not betotally justified on economic grounds, and may result in policy distortions regarding resource allocation.Nevertheless, the approach symbolizes the importance of government emphasis on education, which iscritical for nurturing human capital for economic development in most developing economies.
An indicative labor force planning policy that links the output of education with market demand,though not without any adverse consequence, is another distinguished characteristic of the educationsystem in Taiwan. Even though the eventual supply of educated labor may not completely match thedynamic market demand of the labor market at specific industry levels, the policy has at least provided ageneral outlook on employment structure and probably sown the seed for its future development. The

Social Expenditures in Taiwan (China) 39
efficacy of Taiwan�s human resources was more prominent during the early stage of economicdevelopment, when the government could project the labor market demand better and control highereducation enrollment tightly. As the economic structure gets more complex and the projection of labormarket demand becomes more difficult in the later stages of economic development, broader guidelineswith a much more flexible educational policy becomes necessary. That is one reason why the liberalizationof education, especially the deregulation of higher education occurred in the late 1980s.
If education is considered an investment, then Taiwan�s education policy could offer some lessons fordeveloping economies. For those developing economies in which the labor market is fragmented, and inwhich recipients of education generally are inexperienced investors, indicative planning with someflexibility to accommodate individual differences on education may be a vital alternative to the laissez-faire approach. But, any sound policy must be adjusted periodically in accordance with the changingsocioeconomic environment. Meanwhile in Taiwan, the government�s emphasis on education iscomplemented by the full support of the private sector owing to the society�s Confucian, scholasticnature�which regards intellectual elites as highly respected role models of character development. Thenonpecuniary reward of educational achievement is valued highly in a Confucian society such as Taiwan.Returns from investment in education are not limited to conventional growth accounting or rates ofreturns. Rather, the externality of education in Taiwan has widely spread to its social stratification,democratization, and overall modernization.
Social welfare: Taiwan�s gradualism in expanding its social welfare system�which resulted from itsunique conditions of initial equitable distribution of land and income, its Confucian welfare state, and itslong period of authoritarian regime�has both positive and negative lessons for other developingeconomies. First of all, equitable distribution of land ownership and income at the initial stage ofeconomic development enabled the government to focus more on growth rather than incomeredistribution. Therefore, budgetary allocation could emphasize education and health care to nurture thenecessary human capital for economic development. The export-promotion development strategy based onlabor-intensive industries generated more labor employment, created more equitable income, and reducedthe demand for social welfare. The traditional family in this Confucian society had already assumed asignificant social service function�which was later eroded owing to developments we have discussed atlength. Each of these substantially slowed down the demand for social welfare in the early stage ofdevelopment.
However, a delayed social welfare system led to legacies associated with welfare politics and theproliferation of unfunded social welfare payments. Under the authoritarian regime that ruled until 1987,social welfare was considered as an act of benevolence offered by the leader or the government. Theinstitutionalization of comprehensive social welfare, which generates benefits for all eligible people,would not mesh with such leaders� own interests. Not surprisingly, benevolent social welfare policy underthe authoritarian regime resulted in substantial damage caused by the piecemeal expansions of socialwelfare without funded revenues.
Interestingly, the repressed demand for social welfare turned full-swing in the other direction oncedemocratization gained momentum. Under competitive multiparty election politics, welfare became a toolfor buying votes. In this type of situation, unless the majority of the voters are mature enough to realize theeventual insolvency of unfunded welfare programs, the proliferation of unfunded entitlements couldpossibly become a long-term catastrophe for government finance.
Unlike Singapore where paternalistic democracy is able to require the entire working population tojoin the Central Provident Fund as a condition of retirement, populist pressure in Taiwan has caused theproliferation of unfunded social welfare schemes such as monthly benefits for the elderly population in

40 Peter C. Y. Chow
some local jurisdictions. This development might be a disincentive for the working population to join theproposed national annuity program in the future. The long tradition of nonsystemic, piecemeal expansionsof social welfare has affected Taiwan�s reputable record of social equity as well. In the past, governmentsubsidy of insurance premiums based on occupational status had blurred the line between the risk-sharingprinciple with entitlement to social welfare. It also undercut the redistributive effect of transfer paymentsand became detrimental to social equity. Moreover, operating deficits of various insurance programs weremainly compensated by general tax revenues rather than raising insurance premiums. The risk-sharingprinciple of social insurance was entangled with the entitlement of public assistance for the needy (in thecase of subsidies for middle- and low-income households) and welfare services (in the case of subsidiesfor farmers� insurance). In particular, the provisions of monthly living allowances for the aged farmers arechallenged by critics in terms of their economic rationale and with regard to social justice. Hence,government transfer payments deserve public scrutiny.
Next, the lack of a national consensus on the distinctions among social insurance, welfare services,and social assistance led to program proliferation without sustainable revenue sources. The centralgovernment adopted the principle of piecemeal expansions of social welfare whereas local governmentsunder the command of opposition parties (and independents�those not affiliated with the ruling party)seized the opportunity to generate voters� support by locally liberalizing entitlement, as discussedearlier. This development of free rides from piecemeal expansions of various social welfare schemescould lead to an endless increase of entitlement programs without funding revenues, and could possiblyaffect the social acceptability of the proposed national annuity program. Hence, welfare clientelism inthis immature democracy could possibly affect the social acceptance and eventual implementation of thenational annuity program in the future. Moreover, until the comprehensive income security system isinitiated, the tendency of welfare clientelism could lead to a groundswell of resentment as the turnoverof government leadership occurs.
Taiwan�s experience offers an important lesson for other developing economies. The establishment ofa sustainable social welfare system requires government leadership with a long-term vision. Sincedemocracy and strong government leadership is not always compatible, a sustainable social welfaresystem requires mature public servants and intelligent voters in their constituencies. None of these isreadily available in most developing economies.
Moreover, an important lesson to derive from the Taiwan case is that a long tradition of equitableincome distribution could be jeopardized by a sudden shift of trade regimes. The destructive legacy ofmismanagement in the wake of the trade surplus has darkened Taiwan�s enviable record of growth alongwith equity. Trade liberalization in the second half of the 1980s without an accompanying, appropriatetaxing policy to eliminate windfall profits of nontradable goods substantially undermined social equity.The redistribution of assets had generated a new class of urban poor by the end of the mid-1980s.
In spite of Sun Yat-sen�s teachings of socializing real estate profits from land speculation in urbanareas, which had indoctrinated the KMT leaders in the past, the government faced political constraints ofredistributing urban landownership in the 1980s. Consequently social resentment emerged among theurban poor after decades of development. An important lesson in this for a developing economy with anaccumulated trade surplus is that a transition of trade regime from protection to liberalization must beaccompanied by appropriate taxing policy to maintain social equity.
In terms of income security for the elderly, recipients in Taiwan are allowed to withdraw theirpensions in the form of a lump-sum payment rather than annuity. Their economic security could beaffected by either unanticipated inflation or individual financial mismanagement. Meanwhile, the lack of atransferring mechanism among various pension schemes could also generate a �lock-in effect� in the labor

Social Expenditures in Taiwan (China) 41
market. An integration of various existing income security programs into a unified, comprehensive onesuch as the proposed National Annuity System is long overdue.
The political pressure to grant benefits to the elderly was reinforced by the demographic transition ofaccelerated population aging. Similar to what had happened to Japan and other OECD economies, Taiwanfaced an aging population as its economic growth started to decelerate. The percentage of people aged 65and over in the total population was only 5.1 percent in 1985; it reached 7.81 percent in 1996, and isprojected to be 10 percent in 2010. According to various population projections by the government, thispercentage will be doubled by 2031. The trend of population aging in Taiwan is much faster than in Japanand other OCED economies.93
The growth rate of the economy in Taiwan declined from an average of nearly 8 percent in the 1980sto an average of 6.5 percent during the 1991�97 period. However, unlike Japan and other OECDeconomies�which encountered an aging population after they had enjoyed a long period of higheconomic growth with a per capita income in excess of $30,000�Taiwan faced the same problem whileits per capita income was roughly one-third of that in Japan. This makes welfare reform to deal with thechallenge of demographic transition imperative. Is Taiwan well prepared or ill-prepared for challengesfacing its social welfare system at a time of decelerating economic growth? Another interesting question tobe addressed is how to accommodate the demand for social welfare while maintaining the indigenoussocial system. It has been argued that the erosion of the traditional family system and the Confucianwelfare state of mutual assistance, though not entirely avoidable during a process of modernization, couldpossibly be minimized by appropriately designing a family-oriented, non-Western, if not uniquely EastAsian, social welfare system in the near future.
Health Care: The comprehensive NHI system, which was set up through the gradualist approach, isexpected to be self-sufficient with no government support except for the reimbursement of administrativecosts. However, the government subsidy of health insurance premiums for some segments of the populationaccount for one-third of NHI expenditures. Can government subsidy on health insurance premiums beconsidered as an entitlement program? What is the rationale for government contributions of insurancepremiums to various categories of insured individuals based on their occupations? Obviously, many of thesesubsidies came about owing to the legacy of gradualism and associated piecemeal expansions of the socialwelfare system. (You will remember that the government had already subsidized the operation deficits ofmany existing insurance programs before implementing the NHI scheme.) By increasing the government�sfinancial burden without additional tax revenues, NHI aggravated the overall government budget deficit fromthe day of its implementation�even though it was supposed to be self-sufficient.
Gradualism in implementing the comprehensive NHI was due less to the constraints in medicalfacilities than to the heavy burden of national defense spending prior to the mid-1980s, and the late arrivalof democratization. For other developing economies that have no comparable burden involving nationaldefense, and that have gone from colonization directly to democracy, a prolonged postponement ofcomprehensive health insurance may not be necessary. If the experience of Taiwan�s NHI has anyeducational value for other developing economies, it might be the recognition that health is a public good;there will be no healthy economy unless there are healthy people. However, the cost of this public goodmust be equitably shared by all of its recipients. A comprehensive health insurance system with equitableshares of operating expenses through self-sustaining premiums should be implemented as soon as possible.
93 This is shorter than the periods of 24 years in Japan, and 50 years in Europe. See Chen Shiou Hung (1996).

42 Peter C. Y. Chow
Summary and Conclusions: Are There Any Transferable Experiences for OtherDeveloping Economies?
What are the policy implications of all this for other developing economies? Are there any transferableexperiences from the development of social expenditures in Taiwan? To transfer any developmentalexperience from any model economy to others, we must, at a minimum, address three interrelatedquestions:
(1) Is the experience unique? Or is it relevant to other developing economies?
(2) Are there any pushing forces from the model economy or from international developmentinstitutes such as the World Bank?
(3) What are the attitudes of developing economies in emulating the model?
This study can only address the first question by offering assessments based on the experience inTaiwan regarding the development of social spending; the other two are beyond our scope. Taiwan�smodel of developing its social expenditures includes positive and negative experiences, both of which arepotentially useful as lessons.
Positive aspects include the performance of growth without relinquishing equitable incomedistribution, legal protection on the minimum shares of educational expenditures in the budget during theperiod of authoritarian rule, investment in human capital through education and labor force planning,selected social welfare programs for the needy with rigid criteria to minimize abuse, and gradualism inexpanding the comprehensive national health insurance system to achieve the goal of health care for all.
The negative aspects are the unequitable distribution of assets owing to the lack of coordination betweentrade liberalization and taxing policy in dealing with windfall profits accumulated by existing owners ofnontradable goods in the 1980s; the lack of national consensus on the distinctions among social assistance,social insurance, and welfare service; the vote-buying aspect of welfare politics and welfare clientelismwithout funded revenues; the mixing of social insurance for income security with entitlement; the violation ofthe risk-sharing principle by government subsidies on insurance premiums; and the reverse redistributiveeffect of transfer payments through government subsidy insurance premiums based on one�s occupation.
At a time when the government in Taiwan was expected to improve its social infrastructure (forexample, institutionalizing the national annuity programs for the new dynamic industrial society), it faceda radical process of democratization without a compatible political culture. Unlike Singapore�s CentralProvident Fund, which was set up at an earlier date under a paternalistic democracy, the proposed NationalAnnuity System in Taiwan is yet to institutionalize owing to lack of a national consensus on socialwelfare. As a result, a comprehensive social security program for income maintenance is not availableeven though the GNP per capita exceeds $12,000 and the economy is listed as one of the �advancedeconomies� of the world by the International Monetary Fund (as of 1998). We can say, then, inconclusion, that the legacies of Western welfare politics entered Taiwan along with hasty democratization.Other developing economies with immature democracies should be determined to avoid this fate bymapping out their social welfare system at an earlier stage of economic development.

Social Expenditures in Taiwan (China) 43
References
The word processed describes informally reproduced works that may not be commonly available throughlibraries.
Akamatsu, K. 1962. �A Historical Pattern of Economic Growth in Developing Countries.� DevelopingEconomies (1) (March�August): 7�13.
CEPD (Council for Economic Planning and Development). 1994. Social Welfare Indicators�Taiwan-Fukien Area. Taipei: CEPD.
______. 1996, 1998a. Taiwan Statistical Data Book, 1998. Taipei.
______. 1998b, Current Status of Social Welfare and Its Perspective in the Future.(in Chinese). Taipei.
Chen, Shiou-Hung. 1996. �Evaluation and Implementation of Social Welfare Systems.� A project for theCEPD (in Chinese). Processed.
Chen, Shu-Feng. 1991 �A Study of Higher Education Policy in Post-War Taiwan.� In Jeh-Hang Lai andChun-Chieh Huang, eds., The Development Experience of Taiwan in the Post-War Era, pp. 205�37.Taiwan: Sun Yat-sen Institute for Social Sciences and Philosophy, Academia Sinica. (In Chinese).
Chen, Po-chang. 1991. �Retrospect and Re-Assessment of Forty Years of Public School Education inTaiwan .� In Jeh-Hang Lai and Chun-Chieh Huang, eds., The Development Experience of Taiwan inthe Post-War Era, pp. 171�203. Taiwan: Sun Yat-sen Institute for Social Sciences and Philosophy,Academia Sinica.
Cheng, T. J., and Chi Schive. 1996. What Has Democratization Done to Taiwan�s Economy? Taipei:Council for Economic Planning and Development.
Denison, Edward. 1962. �The Sources of Economic Growth in the United States and the AlternativesBefore Us.� New York: Committee for Economic Development.
Department of Health. 1994. Toward the Goal of Health for All: A Health White Paper. Taipei.
______. 1996a. Public Health in the Republic of China. Taipei.
______. 1996b. Health Statistics in Taiwan Area. Taipei.
______. 1997. Health and Vital Statistics. Taipei. September.
DGBAS (Directorate General for Budget, Accounting and Statistics). 1991. Survey of National Wealth1991. Taipei: DGBAS.
______. 1993. Survey of Senior Citizens, 1993. Taipei: DGBAS.
______. 1995. 1996a. Social Indicators in Taiwan Area of the Republic of China, 1995. Taipei: DGBAS.
______. 1996b. Statistical Yearbook of the Republic of China 1996. Taipei: DGBAS.

44 Peter C. Y. Chow
______. 1997. Quarterly National Economic Trends, No. 78 (August). DGBAS, Taipei.
______. (Various years). Quarterly Report of National Income. Various issues. DGBAS, Taipei.
Fei, John, Gustav Ranis, and Shirley W. Y. Kuo. 1979. Growth with Equity: The Taiwan Case. New York:Oxford University Press.
Galenson, Walter.1979. �The Labor Force, Wages, and Living Standards � In Walter Galenson, ed.,Economic Growth and Structural Change in Taiwan: The Post-War Experience of the Republic ofChina, pp. 384�447. Ithaca: Cornell University Press.
Ho, Samuel P. S. 1978. Economic Growth and Structural Change in Taiwan, 1969�1970. New Haven,Conn.: Yale University Press.
Hou, C. M., and Yu-chu Hsu. 1972. �Non Agricultural Employment, Factor Intensity and Growth: TheCase of Taiwan.� Paper presented at the Sino-American Conference on Manpower in Taipei.Processed.
Jiang, Feng-Fuh. 1988. �Educational Achievement and Economic Development.� Conference Series 10,pp. 171�218. Chung Hua Institution for Economic Research, Taipei.
Jones, Catherine. 1993. �The Pacific Challenge: Confucian Welfare States.� In C. Jones, ed., NewPerspectives on the Welfare State in Europe, pp. 198�217. London: Routhledge.
Kojima, K. 1989. �Theory of Internationalization by Multinational Corporations.� Hitotsubashi Journal ofEconomics 30: 65�85.
Kuo, W. Y. Shirley, Gustav Ranis, and John C. H. Fei. 1981. The Taiwan Success Story, Boulder, Colo.:Westview Press.
Kuznet, Simon. 1955. �Economic Growth and Income Inequality.� American Economic Review 45(March): 1�28.
Lee, Annie. 1998. �Poverty and Gender Difference.� Paper presented at the conference on ResourceDistribution in the Family and Society, Academia Sinica, Taipei.
Lee, Joseph. 1995. Welfare Allowances for Elderly Farmers and Their Relationship to Other SocialInsurance Program in Taiwan Taipei: Chung Hua Institution for Economic Research. (In Chinese)
Lin, Wan-I. 1991. �Labor Movement and Taiwan�s Belated Welfare State.� Journal of International andComparative Social Welfare 7(1�2): 31�44.
Lippset, Seymour Martin. 1981. Political Man. Baltimore: The John Hopkins University Press.
Liu, Cheng, Arthur Sakamoto, and W. S. Yang. 1996. �The Marginal Effects of School Years and Scale ofBusiness Enterprises on Wages: The Case of Taiwan.� In Chaonan Chen, Paul K. C. Liu, Te-HsiungSun, and Feng-fuh Jiang, eds., Population, Employment and Welfare, pp. 155�76. Institute ofEconomics, Academia Sinica, Taipei. (In Chinese).
Ministry of Education. 1998a. Education in the Republic of China. Taipei.

Social Expenditures in Taiwan (China) 45
______. 1998b. Educational Statistics in the Republic of China. Taipei.
______. 1997a. Educational Statistics of the Republic of China 1996. Taipei.
______. 1997b. Summary of Educational Statistics. Taipei.
______. 1997c. Educational Statistical Indicators. Taipei.
Ministry of Finance. 1995, 1996. Yearbook of Financial Statistics, 1996. Taipei.
Ministry of the Interior. 1994. Survey of Living Conditions. Taipei.
Rigger, Shelley. 1995. �Electoral Strategies and Political Institutions in the Republic of China on Taiwan.�Harvard Studies on Taiwan Vol. 1: 1�27.
Rodrik, Dani. 1995. �Getting Interventions Right: How South Korea and Taiwan Grew Rich.� EconomicPolicy Vol. 20: 55�107.
Tsiang, S. C. 1984. �Taiwan�s Economic Miracle: Lessons in Economic Development.� In Arnold C.Harberger, ed., World Economic Growth, pp. 301�25. San Francisco: Institute for ContemporaryStudies.
Tsai, Wen-hui. 1993. In Making China Modernized: Comparative Modernization Between MainlandChina and Taiwan. Occasional Papers/Reprint Series in Contemporary Asian Studies. University ofMaryland School of Law, Baltimore.
UNDP (United Nations Development Programme). Various years. Human Development Report. NewYork: Oxford University Press.
Wang, Fang. 1994. �The Political Economy of Authoritarian Clientelism.� In Louis Roniger and AyseGunes-Ayata, eds., Democracy, Clientelism, and Civil Society, pp. 181�206. Boulder, Colo.: LynneRienner Publishers.
______. 1997. �What Kinds of Social Welfare Policy Do People Really Want?� Hsen Chi Monthly(October): 38�44. (In Chinese).
Wang, Ping, and Ellis W. Tallman. 1994. �Human Capital and Endogenous Growth: Evidence fromTaiwan.� Journal of Monetary Economics (34): 101�24.
Woo, Jennie Hay. 1991. �Education and Economic Growth in Taiwan: A Case of Successful Planning.�World Development 19(8): 1029�44.
Wu, Huoying. 1997. �Demographic Change and Income Inequality in Taiwan, 1976�1995.� Institute ofEconomics, Academia Sinica, Taipei.
Yang, Yi-rong. 1991. �Education and National Development: A Reflection of Taiwan�s Experience.� InJeh-Hang Lai and Chun-Chieh Huang, eds., The Development Experience of Taiwan in the Post-WarEra, pp. 133�70. Taiwan: Sun Yat-sen Institute for Social Sciences and Philosophy, Academia Sinica.(In Chinese).

46 Peter C. Y. Chow
Zveglich, Jr., Joseph, Yana Van Der Meulen Rodgers, and William Rodgers III. 1996. �Education andEarnings: Gender Differential in Taiwan, 1978�92.� A paper presented at the annual meeting of theSouthern Economic Association in Washington, D.C.
Appendix
Diagram 1-A. Infant Mortality Rate 1996�96
Source: Department of Health, Executive Yuan.
Diagram 1-B. Maternal Mortality Rate 1996�96
Source: Department of Health, Executive Yuan.
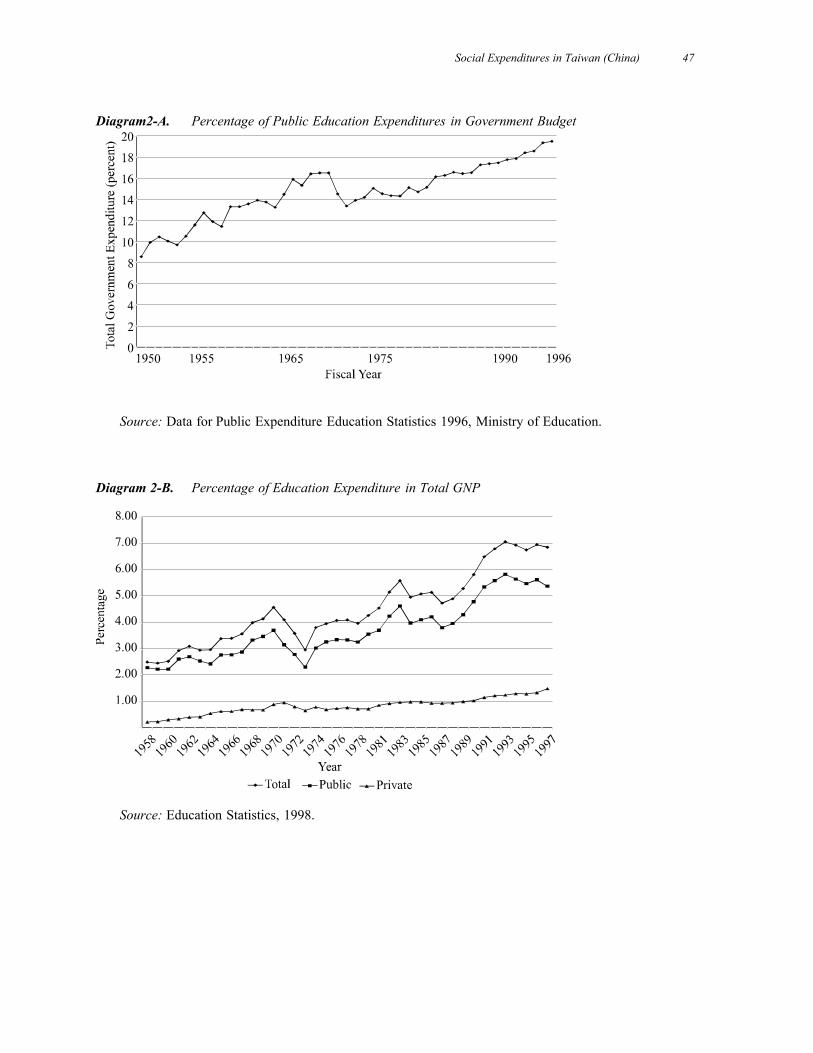
Social Expenditures in Taiwan (China) 47
Diagram2-A. Percentage of Public Education Expenditures in Government Budget
Source: Data for Public Expenditure Education Statistics 1996, Ministry of Education.
Diagram 2-B. Percentage of Education Expenditure in Total GNP
Source: Education Statistics, 1998.

48 Peter C. Y. Chow
Diagram 3-A. Net Enrollment Rates by School-age Population Group
Source: Education Statistics, 1998.
Diagram 3-B. Gross Enrollment Rates by School-age Population Group
Source: Education Statistics, 1998.

Social Expenditures in Taiwan (China) 49
Diagram 4. Composition of Education Expenditure by Levels of Education
Source: Education Statistics, 1998.
Diagram 5. Education Attainment of Population (Aged 6 and over)
Source: Education Statistics, 1998.

Social Expenditures in Taiwan (China) 50
Diagram 6. Educational Attainment of Population (Aged 15 and over)
Source: Education Statistics, 1998.
Diagram 7. Structure of Household Consumption Expenditure
Source: Social Indicators, 1996.