
Social Engagement, Behavioural Risks and Cognitive ... · Social Engagement, Behavioural Risks and...
48
Social Engagement, Behavioural Risks and Cognitive Functioning Among the Aged Henriette Engelhardt Isabella Buber Vegard Skirbekk Alexia Prskawetz Henriette Engelhardt is Professor at the Department of Population Studies, Otto Friedrich University Bamberg, Bamberg, Germany. Isabella Buber is deputy head of the Research Group on Demography of Austria at the Vienna Institute of Demography, Austrian Academy of Sciences, Vienna, Austria. Vegard Skirbekk is a researcher in the World Population Program at the Institute for Applied Systems Analysis (IIASA), Laxenburg, Austria. Alexia Prskawetz is Professor at the Institute for Mathematical Methods in Economics, Research Unit Economics, Vienna University of Technology, and deputy director of the Vienna Institute of Demography, Austrian Academy of Sciences, Vienna, Austria.
-
Upload
trinhtuyen -
Category
Documents
-
view
214 -
download
0
Transcript of Social Engagement, Behavioural Risks and Cognitive ... · Social Engagement, Behavioural Risks and...

Social Engagement, Behavioural Risks and Cognitive Functioning Among the Aged
Henriette Engelhardt
Isabella Buber
Vegard Skirbekk Alexia Prskawetz
Henriette Engelhardt is Professor at the Department of Population Studies, Otto Friedrich University Bamberg, Bamberg, Germany. Isabella Buber is deputy head of the Research Group on Demography of Austria at the Vienna Institute of Demography, Austrian Academy of Sciences, Vienna, Austria. Vegard Skirbekk is a researcher in the World Population Program at the Institute for Applied Systems Analysis (IIASA), Laxenburg, Austria. Alexia Prskawetz is Professor at the Institute for Mathematical Methods in Economics, Research Unit Economics, Vienna University of Technology, and deputy director of the Vienna Institute of Demography, Austrian Academy of Sciences, Vienna, Austria.

2
Abstract
In this study we analyse the relationship between cognitive performance, social participation and behavioural risks taking into account the influence of age and educational attainment. We use individual data from twelve mainly European countries collected in the first wave of SHARE. The methodology proposed, a stochastic frontier approach, allows us to identify the effects of the different sources of plasticity on cognitive functioning while explicitly taking into account the age-related decline in cognitive performance. In the pooled sample, the results clearly show that all kinds of social engagement enhance cognitive functions, in particular the continuation of occupational activities. Moreover, behavioural risks such as physical inactivity, obese, smoking or drinking clearly do not benefit cognitive performance. Country-specific results, however, vary with respect to signs for all indicators of social engagement and behavioural risks.
European Demographic Research Papers are working papers that deal with all-European issues or with issues that are important to a large number of countries. All contributions have received only limited review. Editor: Maria Rita Testa Head of the Research Group on Comparative European Demography: Dimiter Philipov
*** This material may not be reproduced without written permission from the authors.

3
1 INTRODUCTION
It is now well accepted that in most industrialised countries the labour force will become smaller and older in the future. A common answer to counteract the shrinkage of the working-age population and to reduce the number of beneficiaries in the social security system at higher ages is to increase labour force participation at older ages. However, the age productivity profile is central in understanding labour force participation at higher ages. Strategies for encouraging older workers to remain longer in the workforce need to be evaluated in tandem with the productivity profile of older workers.
It is well known that workers of different ages may have different levels of productivity (as well as capacities of learning), although the exact quantification is still highly disputed and strongly dependent on the occupation, technological progress and possible cohort effects that work through schooling levels. Studies estimating the influence of age on individual productivity are based on different indices, including supervisors’ evaluations, piece-rate studies, analyses of employer-employee datasets, age-earnings profiles and entrepreneurial activity (cf. Prskawetz et al. 2005, 2007).
An important cause of age-related productivity declines is likely to be age-specific reductions in cognitive abilities. Some abilities, such as perceptual speed, show relatively large decrements already from young ages, while others, like verbal abilities, exhibit only small changes throughout the working life. Experience in a firm or plant boosts productivity up to a point beyond which, however, additional tenure has little effect. Older individuals learn at a slower pace and have reductions in their memory and reasoning abilities. In particular, senior workers are likely to have difficulties in adjusting to new ways of working.
Earlier studies have indicated the plasticity of ageing focusing on the role of behavioural risk factors, social engagement, etc. on individuals’ cognitive reserve in old age (for a survey see Le Carret et al. 2003). Based

4
on the Survey on Health, Ageing and Retirement in Europe (SHARE), we study the role of these intervening factors on cognitive functioning in old age focusing on fluid abilities that are more likely to deteriorate with age. Our approach is to model cognitive abilities as a function of age and education and to study the loss in efficiency depending on behavioural risk factors (like smoking, obesity, etc.) as well as social engagement at old age. Other than in the study by Adams et al. (2006) we study the cognitive decline of a single indicator of fluid abilities which show a clear decline in old age. Moreover, we model the best possible cognitive performance as a function of age and education and perform country-specific analysis as a test of the generality of our results. These results so far indicate that all kinds of social engagement increase cognitive functions. It is in particular the continuation of occupational activities that illustrates the potential effect on personal cognitive functions of reforms trying to encourage aged workers to remain active in most European countries. Moreover, behavioural risks such as physical inactivity, obesity, smoking or drinking clearly do not benefit the cognitive performance. A tentative conclusion of our study is that investing in continued education and fostering social engagement at older ages may indeed help to keep up cognitive abilities at older ages, thus increasing the feasibility and practicability of increasing labour force participation at higher ages.
The setup of our paper is as follows: Theories of cognitive ageing are reviewed in the next section. The data, method and variables are discussed in Section 3. Descriptive univariate and multivariate results based on the stochastic frontier concept are presented in Section 4. Section 5 concludes.

5
2 COGNITIVE AGEING AND COGNITIVE RESERVE
During the last three decades, a great deal of evidence has been accumulated indicating that advancing age is accompanied by cognitive ageing. The term cognitive ageing describes a pattern of age-related impairments in cognitive functioning or cognitive abilities including reasoning, spatial orientation, numerical capabilities, verbal abilities and problem solving which are closely correlated with performance in several areas of life, in particular job performance (Schmidt and Hunter 1998; Dolton and Vignoles 2000; Grogger and Eide 1993).
Some cognitive abilities are relatively robust to age and stable over the entire life cycle (Schaie 1994). Crystallised abilities tend to remain at a high functional level until late in life, while fluid abilities decline substantially over the life span (Horn and Cattell 1966, 1967). Crystallised abilities relate to accumulated knowledge, such as word meaning and vocabulary size – and these tend to be stable or even increase until late in life. The second group, fluid abilities, concerns performance in learning and processing new material – and include perceptual speed and reasoning abilities. Schwartzman et al. (1987) find that verbal skills (crystallised abilities) remain virtually unchanged across the life cycle, while reasoning and speed (fluid abilities) decline with age. In a test-retest study of twins, Blum et al. (1970) provide similar findings: vocabulary size is observed to remain constant from youth to old age, despite a general reduction in other cognitive abilities. Verhaegen and Salthouse (1997) analyse 91 different studies and conclude that important cognitive abilities, such as reasoning, speed and episodic memory, decline significantly by the age of 50.
That cognitive abilities decline with age seems to be a relatively universal phenomenon that holds for both men and women: individuals with high ability levels are subject to the same changes in cognitive function as those with low ability levels and similar patterns are observed in different countries (Park et al. 1999; Deary et al. 2000; Maitland et al. 2000; Schaie 1996). Age-related reductions in memory and learning capabilities have also

6
been documented among several nonhuman species, ranging from fruit flies to primates (Minois and Bourg 1997; Bunk 2000).
The decline in cognitive functioning is associated with structural changes in the brain (Raz 2004). Even early in the ageing process, changes such a cerebral atrophy, ventricular enlargement and hippocampal atrophy may be evident in some, but not all, individuals (Meyer et al. 1999; Coffrey et al. 1992). In addition, the underlying pathologic basis of cognitive decline would be the loss of synapses, neurons, neurochemical inputs and neuronal networks (Honig und Rosenberg 2000).
Nevertheless, the decline of cognitive functioning with age is not inevitable. Nature provides clear examples of elderly people who maintain cognitive vitality, even among the oldest old. Therefore, Fillit et al. (2002) suggested that individuals have varying degrees of functional reserve in their brains. Persons with high functional reserve may have an increased capacity to keep learning and adapting despite age-related changes (Baltes and Baltes 1990).
Scarmeas and Stern (2003) developed this view with the concept of cognitive reserve. In this view, an individual’s cognitive reserve relates back to the fact that innate intelligence or life experience as evidenced by educational or occupational attainment constitute a cognitive reserve that allows to prevent – to certain extent – the cognitive decline associated with normal ageing. The process leading to the formation of this reserve remained unclear.
Therefore, Scarmeas and Stern (2003) explored what might comprise cognitive reserve and proposed that both active and passive components were at work. Active components would include experience shown by a high level of education, complex occupations requiring continuing education and sustained intellectual engagement requiring mental effort. Passive components would comprise brain structures (synaptic density and number of neurons) that added capacity to efficient processing of information, enhanced retrieval of memories and problem solving.

7
Recent studies tried to identify some parameters that contribute to the development of cognitive reserve and influence the cognitive performance of elderly people. Epidemiological studies have established low educational attainment and low occupational status as important risk factors for cognitive functioning and Alzheimer’s disease (Launer et al. 1999; Cullum et al. 2000). A significant effect of education on cognitive ageing was reported by Le Carret et al. (2003) who found that education protected psychological performance in late life and related this to occupational complexity and the acquisition of a lifelong ability to sustain attention and conceptionalise problems. In a longitudinal study of memory decline in Alzheimer’s disease, more rapid decline was detected in Alzheimer patients with higher educational attainment and occupational status. This association suggested that a greater burden of Alzheimer neuropathology was required if highly educated individuals were to develop dementia (Stern et al. 1999). In the study of religious orders by Bennett et al. (2003), education was found to modify the deleterious effect of senile plaque density on cognitive performance. Similarly, lower childhood intelligence (Whalley et al. 2000; Richards et al. 2004) and lower linguistic ability in early life (Snowdon et al. 1996) appeared to be a reliable proxy for cognitive reserve. Moreover, cognitive training is frequently found to improve cognitive functioning among elderly persons (Schaie and Willis 1986; Ball et al. 2002). Katzman (1993) suggests that educational courses can increase synaptic density in the neocortical association cortex and therefore delay the onset of dementia by up to 45 years.
Different studies reported that there is a positive association between participation in intellectual, social and physical activities. Low-skilled occupations have been identified as risk factors for age-related cognitive decline (Capurso et al. 2000). On the other hand, individuals who are/were engaged in complex work, with freedom to decide how to organise their working day, could be expected to experience less of a cognitive decline (Schooler et al. 1999). Salokangas and Joukamaa (1991), Bosse et al. (1987) and Dave et al. (2006) find that working longer in life is associated with a

8
better cognitive functioning. However, as those who experience health impairments retire early (McGarry 2004; Belgrave et al. 1987), it is uncertain to what extent later retirement actually improves health levels. Moreover, Sugisawa et al. (1997) and Midanik et al. (1995) find that the cognitive functions of those who retire do not differ significantly from their age peers who stay in the workforce, while Mein et al. (2003) find that among British civil servants in high employment grades a continued working career actually worsened the cognitive functions relative to those who retired. Adam et al. (2006) study the relationship between cognitive performance and occupational activities, defined in a broad sense that includes professional, leisure, physical and other activities. Their results confirm the positive impact of occupational activities on the cognitive functioning of older persons.
A more active lifestyle was found to be protective of late-life cognitive function in several studies (Elwood et al. 1999; Dik et al. 2003; Newson and Kemps 2005) consistent with a report that cognitive function in mid-life is associated with greater physical activity in childhood (Richards et al. 2003). Leisure pursuits are often chosen because they are mentally effortful and cognitively stimulating. In a religious-order study (Wilson et al. 2002), longitudinal data were collected from 801 elderly Catholic nuns, priests and brothers without dementia. On recruitment, cognitive activities were rated and subsequently shown to be associated with retention of cognitive function and reduced risk of dementia after controlling for age, sex and education. The effect sizes in the subanalysis of cognitive ageing were sufficient to suggest that continuing effortful cognitive activity in later life might reduce decline in global cognition.
Leisure activities, irrespective of the extent of cognitive effort involved, surveyed in a non-demented general population sample were also found to have a cumulative effect on the risk of incident dementia (Scarmeas et al. 2001). In the British 1946 cohort study (Richards et al. 2003), leisure activities were associated with better cognitive performance at age 43 and physical exercise at age 36 was linked to a significantly slower rate of

9
memory decline from age 43 to 53 years. In the Swedish Twin Studies, Crowe et al. (2003) compared leisure activities between same-sex twin pairs discordant for dementia. Factor analyses of activity reports obtained 20 years earlier identified three activity factors: intellectual/cultural, self-improvement and domestic activity. The authors concluded that greater participation in intellectual-cultural leisure activities was associated with a lower risk of Alzheimer’s disease in women, but not men. Studies of physical activity find that regular exercise improves the working memory function among older men (James and Coyle 1998; Elias 2003).
Other risk factors have also been shown to affect cognitive performance among older adults. In a follow-up of Irish smokers and non-smokers, where initial intelligence levels were controlled for, a negative effect of smoking was found (Deary et al. 2003). Excessive alcohol consumption is related to higher morbidity and mortality, but moderate consumption may be weakly positively related to longevity and mental functioning at older ages (Bond et al. 2001; McDougall et al. 2006). Obesity has been found to have negative effects on cognitive performance, net of education, occupation, cigarette smoking, alcohol consumption, total cholesterol and a diagnosis of type II diabetes (Elias et al. 2003).
Living arrangements are a further aspect that might have an influence on cognition as social isolation is related to more rapid decline in cognitive abilities (Wilson et al. 2007). In the more developed countries, the percentage of older persons living alone had generally risen rapidly between 1960 and the late 1970s, a trend that continued through the 1990s in some cases, but slowed or halted around 1980 in others. This holds true both for North America and Europe (Tomassini et al. 2004; UN 2007). In a study of 550 Scottish individuals who were IQ tested in 1932 and retested in 1999–-2001, Gow et al. (2005) find that those living with more people in later life and thus experiencing decreased loneliness were associated with higher cognitive performance. Loneliness accounted for 3 per cent of the variance in later cognition (once prior abilities and sex were controlled for), such that those experiencing increased levels of loneliness displayed poorer cognitive
10
performance in later life. A lack of social interaction, for example caused by isolation following retirement, sets off cognitive function problems (Cohen 2004, Cole et al. 2002, Glass et al. 1999, Melchior et al. 2003). Cognitive decline due to reduced socialisation after retirement is particularly evident among men (Sugisawa et al. 1997). Maier and Klumb (2005) find, for the case of Germany, that in particular spending time with friends improves health and survival at older ages. Bassuk et al. (1999) use longitudinal US data from 1982 to 1994 and find that those who had no social contacts suffered from more severe cognitive decline than the rest of the population. A weakening of the degree of activity is related to stronger decline relative to older individuals who manage to uphold their level of cognitive functioning (Mackinnon et al. 2003).
Beland et al. (2005) find that participation in community activities matters for women in a study of community-dwelling elderly and that its effects were more significant at advanced ages. Barnes et al. (2004) show that the social engagement levels and social network sizes were positively correlated with initial level of cognitive functions but also associated with a reduced rate of cognitive decline. A high number of networks reduced the rate of decline by 39 per cent compared to a low level and high social engagement reduced decline by 91 per cent. These relations remained after controlling for socioeconomic status, cognitive activity, physical activity,
depressive symptoms and chronic medical conditions. Zhang (2006) looked at impairment both at baseline and during 2-year follow-up, controlling for age, activities of daily living disability and rural residence. Women’s disadvantages in social networks and participation in leisure activities partially accounted for gender differentials in cognitive impairment. In a longitudinal study of 4603 Taiwanese from 1989 to 2000, Glei et al. (2005) find that elderly persons who participate in one or two social activities failed 13 per cent fewer cognitive tasks than those with no social activities; while those who engaged in three or more activities failed 33 per cent fewer
cognitive tasks.

11
Nevertheless, findings for the effect of social engagement on cognition are contradictory. McGue and Christensen (2007) found in a study of Danish twins that social activity was significantly and moderately heritable, raising the possibility that late-life cognition functioning might reflect selection processes. Aside from this, social activity did not predict changes in functioning and in monozygotic twin pairs discordant for their levels of social activity, the more socially active twin was not any less susceptible to age decreases in physical and cognitive functioning and increases in depression symptomatology than the other twin who was less socially active.
To summarise, these findings on cognitive reserve may have important implications for the role of continued education, social engagement and structure of retirement at older ages. These factors may indeed help to keep up cognitive abilities at older ages, thus increasing the feasibility and practicability of increasing labour force participation at higher ages.
3 DATA, METHOD AND VARIABLES
The empirical analysis is based on the Survey of Health, Ageing and Retirement in Europe (SHARE) which aims at understanding the ageing process in Europe. SHARE includes detailed cross-national information, among other things on health, well-being, economic circumstances and social networks for the following 12 mainly European countries: Austria, Belgium, Denmark, France, Germany, Greece, Israel, Italy, the Netherlands, Sweden, Switzerland and Spain. The data were collected between 2004 and 2006.
SHARE covers the non-institutionalised population aged 50 and older.1 Since spouses of persons aged 50 and more were also interviewed,
1 Collecting SHARE data was primarily funded by the European Commission within the 5th Framework Programme (project QLK6-CT-2001-00360 in the thematic

12
some persons were younger than 50. “Release 2.0.1” comprised data on 31,115 individuals in 21,176 households, the weighted average response rate was 61.6 per cent (Börsch-Supan and Jürges 2005). Since weights are not available for Israel, we had to drop this country for the pooled analysis. We calculated also country-specific results for Israel with unweighted data though.
Our empirical analysis is restricted to “healthy” respondents aged 50 to 79 years and we excluded those who reported a stroke or cerebral vascular disease, Parkinson or cancer. Anti-cancer drugs decrease cognitive ability levels (Falleti et al. 2006; Wincour et al. 2006), and Parkinson’s disease (Norman et al. 2002; Rasquin et al. 2004), stroke and cerebral vascular disease are associated with lower levels of mental functioning (Schatz and Buzan 2006, Schmidt et al. 1993), therefore persons with one of these diseases are excluded in our analysis. Moreover, we excluded respondents who were taking drugs against anxiety or depression or who had been treated in a mental hospital or psychiatric ward. Our selection criteria are similar to those of Adam et al. (2006) but whereas these authors excluded only persons with brain cancer, we excluded all persons diagnosed with any kind of cancer, medication for cancer being very likely to effect cognitive functioning. Missing or unreliable data for one of the variables retained in the analysis was another criterion for exclusion in the multivariate analyses.
programme area Quality of Life). Additional funding came from the US National Institute on Aging (U01 AG09740-13S2, P01 AG005842, P01 AG08291, P30 AG12815, Y1-AG-4553-01 and OGHA 04-064). Data collection in Austria (through the Austrian Science Foundation, FWF, grant number P-15422), Belgium (through the Belgian Science Policy Office) and Switzerland (through BBW/OFES/UFES) was nationally funded. The SHARE data collection in Israel was funded by the US National Institute on Aging (R21 AG025169), by the German-Israeli Foundation for Scientific Research and Development (G.I.F) and by the National Insurance Institute of Israel. Further support by the European Commission provided within the 6th Framework Programme (projects SHARE-I3, RII-CT-2006-062193 and COMPARE, 028857) is gratefully acknowledged.

13
Our final sample comprised 23,197 persons (11,026 men and 12,171 women). The mean age was 62 years for men and 63 years for women. 3.1 Method
As we applied the stochastic frontier approach, we will start with a short introduction to this method which is rooted in econometric studies of production functions. First of all, there are two ways to estimate a fully efficient production function: (1) Data Envelopment Analysis (DEA), a non-parametric technique which assumes all deviations from the efficient frontier to be a realisation of inefficiency, and (2) Stochastic Frontier Analysis (SFA), a parametric technique which assumes that deviations from the efficient frontier can be either a realisation of inefficiency or a random shock.
Aigner, Lovell and Schmidt (1977) and Meeusen and van den Broeck (1977) simultaneously introduced stochastic production frontier models. These models allow for technical inefficiency but also acknowledge the fact that random shocks outside the control of producers can effect output. The great virtue of stochastic production frontier models is that the impact on output of shocks can at least in principle be separated from the contribution of variation in technical efficiency.
Applying the terminology to our data implies that there is a stochastic frontier function for cognitive functioning which is an “optimal” curve depending on various factors. The basic assumption is that age and years of education are the main variables entering in the analysis as explanatory factors of an individual’s cognitive functions. Therefore, the main “input factors” for cognition are age and education. Not all individuals reach optimal cognition, some are “inefficient” in the way that their cognitive functioning lies below the optimal value. Moreover, we also consider measurement errors (statistical noise and random shocks) such as the daily constitution of a person.

14
Adam et al. (2006) study the relationship between cognitive performances and occupational activities and apply the stochastic frontier approach. They assume age to be the driving factor (input) and the cognitive test score to be the output. In general, we followed their approach but have a different specification of the model. Moreover, we run the models for all countries separately.
Let us consider a production function );( βii xfq = for cognitive functioning of individual i where ix is a vector of inputs (age and education), iq is output (cognitive test score such as “number of words recalled”) and β is a [ ]1×k vector of parameters to be estimated. We can think of efficiency being measured as iς multiplied by a theoretical norm where [ ]1,0∈iς such that
iii xfq ςβ );(= . If 1=iς then individuals are fully efficient and “produce” or recall
the highest number of words they can (according to their age and educational level). If 1<iς then individuals are not fully efficient.
Adding a two-sided error term (Aigner, Lovell and Schmidt, 1977) yields
)exp();( iiii vxfq ςβ=
which is equivalent to
( )( ) ( ) iiii vxfq ++= ςβ ln;lnln .
Defining ( )iiu ςln−= yields
( )( ) iiii uvxfq −+= β;lnln

15
with ( )2;0~ vi iidNv σ , 0≥iu and ( ) 0,cov =ii uv , where v is the two-sided measurement error (random factors like the daily constitution of a person) and u is the one-sided technical inefficiency having a key interpretation in the frontier analysis literature. It corresponds to the distance to best practice as represented by the stochastic frontier ( )( ) ii vxf +β;ln . Hence iu requires an assumption about the distribution of u . In our empirical analysis, we assumed for the inefficiency component a truncated-normal distribution ( )2;~ uiidNu σμ+ . Alternatively, the non-negative disturbance was specified to be half-normally distributed with
( )2;0~ uNu σ+ . The estimated coefficients slightly differed but remained stable and comparable to the truncated-normally distributed inefficiency.
The inefficiency term can be modelled as a function of other covariates. This idea was first introduced by Battese and Ceolli (1995).2 According to their specification, we modelled the inefficiency term iu as
δii Zu = where iZ is a set of variables thought to influence inefficiency. The applied software provided an extension to the truncated normal model by allowing the mean of the inefficiency term to be modelled as a linear function of a set of covariates.3
2 In Stata, this option can only be used with the truncated normal which can have a zero mean. A comparison between the basic model (with age and education only) for half-normally distributed and truncated-normally distributed technical inefficiency reveals almost identical results. Therefore, the results are stable and do not depend on a specific distribution of the inefficiency. Moreover, in the model with half-normally distributed technical inefficiency we also included heteroscedasticity – for the measurement error iv as well as for the technical inefficiency component – based on the log of age in years which implies different variance over age. Both for the error term and technical inefficiency we found heteroscedasticity in our data, therefore the error term and technical inefficiency have no constant variance and cognitive functioning displays a greater variability with increasing age. In the case of truncated-normal distribution, Stata does not allow to specify heteroscedasticity. 3 For estimations we use the Stata 10.0 routine frontier.

16
3.2 Variables
SHARE includes five different measures for cognitive functions: orientation, memory, verbal fluency, numeracy and recall. Orientation as to date, month, year and day of the week is a rather basic cognitive functioning indicator. In the current study, orientation was not included due to a small variation across age and to the fact that it is more appropriate for detecting really severe cognitive deficits. Memory indicates the number of words the interviewee can recall from a list of the following ten items (butter, arm, letter, queen, ticket, grass, corner, stone, book, stick). Recall gives the number of words from this list of ten words which the interviewee can recall after a certain delay of time. The values for memory and recall both range from 0 to 10. Verbal fluency gives the number of different animals the interviewee can name within one minute, with values ranging from 0 to 80 in the current sample. Numeracy measures mathematical performance in percentage calculation.4 Values range from 1 to 5 – the higher the score, the better the numerical knowledge.
In the framework of sources of plasticity, memory and recall measure fluid abilities, whereas verbal fluency and numeracy are indicators for crystallised intelligence. Therefore SHARE allows to analyse different perspectives of cognitive ageing.
Next we selected several indicators that are potential sources of plasticity of cognitive reserve, namely social participation and behavioural risks. Using the notation introduced in the previous section, these indicators correspond to Zi variables. The activities of social participation captured in
4 The exact wording of the four questions is: (1) “If the chance of getting a disease is 10 per cent, how many people out of 1,000 (one thousand) would be expected to get the disease?” (2) “In a sale, a shop is selling all items at half price. Before the sale, a sofa costs 300 euro. How much will it cost in the sale?” (3) “A second hand dealer is selling a car for 6,000 euro. This is two-thirds of what it costs new. (4) “Let’s say you have 2000 euro in a savings account. The account earns ten per cent interest each year. How much would you have in your account at the end of two years?”

17
SHARE include voluntary and charity work, care provided for sick or disabled adults, help provided to family, friends and neighbours, educational training, participation in a sports, social or other kind of club, participation in a religious organisation, participation in a political or community organisation. The corresponding questions refer to activities done within the last month only and do not include information on how long a person has been engaging in these activities. Additionally, SHARE includes information on frequency and also on the motivation for being engaged in the various activities. Our analysis does not consider frequencies which are restricted to the preceding month only but might vary during a year. This restriction of activities to the last month before time of interview is certainly a limitation to the quality of our data. As an example, persons who have been engaged in certain activities for many years except for the preceding month would not be detected in our data.
Additionally, variable Zi includes the following aspects of behavioural risks: being employed, carrying out moderate or vigorous physical activities, being overweight or obese, as well as smoking and drinking habits. If the respondent states to have been engaged in vigorous activity (such as sports, heavy housework or a job that involves physical labour) at least one to three times a month, then we coded the person as engaged in vigorous activities. If the respondent answers “less than once a month”, he/she is coded as not being engaged in vigorous activities. The same definition was applied for moderate activities: Persons who engage in activities that require a low or moderate level of energy (such as gardening, cleaning the car, or doing a walk) a least one to three times a month were categorised as being engaged in moderate activities. A person is overweight or obese if the body mass index (BMI) is greater than 25. A person is coded as smoking if he has ever smoked cigarettes, cigars, cigarillos or a pipe daily for a period of at least one year, and as drinking if he has more than two glasses of any alcohol almost every day of five to six days a week during the last six months.

18
Age and education are input factors of the stochastic frontier function. Age is measured by “age in years”. For education, a relative measure of educational level was used. Comparative studies including education depend on the availability of an indicator on educational attainment which is “truly comparable across nations” (Dourleijn et al. 2002, p. 157). Especially for older cohorts, the distribution of educational attainment shows striking differences. Whereas in southern European countries, most respondents acquired basic education only, this group is relatively small in the Nordic countries. Therefore, neither the International Standard Classification of Education (ISCED) nor the number of years in education, but a relative measure for the years of education was included as a measure for education. Using quartiles for the years of education, three groups can be distinguished: Lower level (lower 25 per cent), medium level (middle 50 per cent) and higher level (upper 25 per cent). Quartiles for the number of years in school were computed for men and women separately as well as for all countries in order to have a relative measure for educational level by sex and country.5 Differentiating also by gender allows to account for differences in educational attainment between men and women, as women of older cohorts are generally lower educated compared to men.
4 RESULTS
4.1 Descriptive results
The empirical analysis is done in two steps: First, we apply linear regressions and plot the corresponding graphs to visualise the relation between cognitive functioning and age with a focus on different sources of
5 In the few cases where two neighbouring quartiles were identical, they were changed in a way that for some countries, e.g., for Spanish men, the lower group now consists not of 25 per cent but of 16 per cent.

19
plasticity. In a next step, we apply a stochastic frontier approach to estimate the effect of sources of plasticity on cognitive functioning.
Figure 1 shows the mean cognitive functions by age and clearly indicates a decline of cognitive functioning with increasing age. The mean number of words remembered declines from 5.5 words at age 50 to 4 words at age 80, the mean number of words recalled drops from 4 to 2. Respondents aged 50 named on average 21 animals, persons aged 80 about 15 animals. Finally, the numerical score decreased from 3.8 to 3.
For all four dimensions the decline with age was almost linear, which allows the application of linear regressions. Since the scales for our four dimensions of cognition were different, we standardised the scores for memory, recall, verbal fluency and numeracy and applied linear regression to be able to compare the decline with age (results not shown here). Our results clearly demonstrate that the crystallised abilities memory and recall decreased more strongly than the fluid abilities verbal fluency and numeracy. The estimated linear regression lines for memory and recall overlapped and were nearly identical. The estimated slopes for the standardised regressions were 0.037 and 0.035 for memory and recall, and 0.031 and 0.027 for verbal fluency and numeracy, respectively.
Since the decline of cognitive functioning was most pronounced for fluid abilities, our further analyses concentrated on those. The decline of the standardised scores was almost identical for memory and recall and we chose to concentrate on recall only. To see whether the association between age and recall was similar in all countries, the mean numbers of words recalled for all countries were plotted separately. Figure 2 depicts the decline with age and shows that the decline was observed in all countries but the magnitude of decline differs within the twelve countries included in SHARE. Moreover, the initial level at age 50 was quite different in the current sample. It was especially low in Italy, Spain and Greece which could be due to the relatively low educational level among elderly persons in these countries.

20
Figure 1 Mean cognitive functioning by age.
Figure 2 Mean number of words recalled by age and country.

21
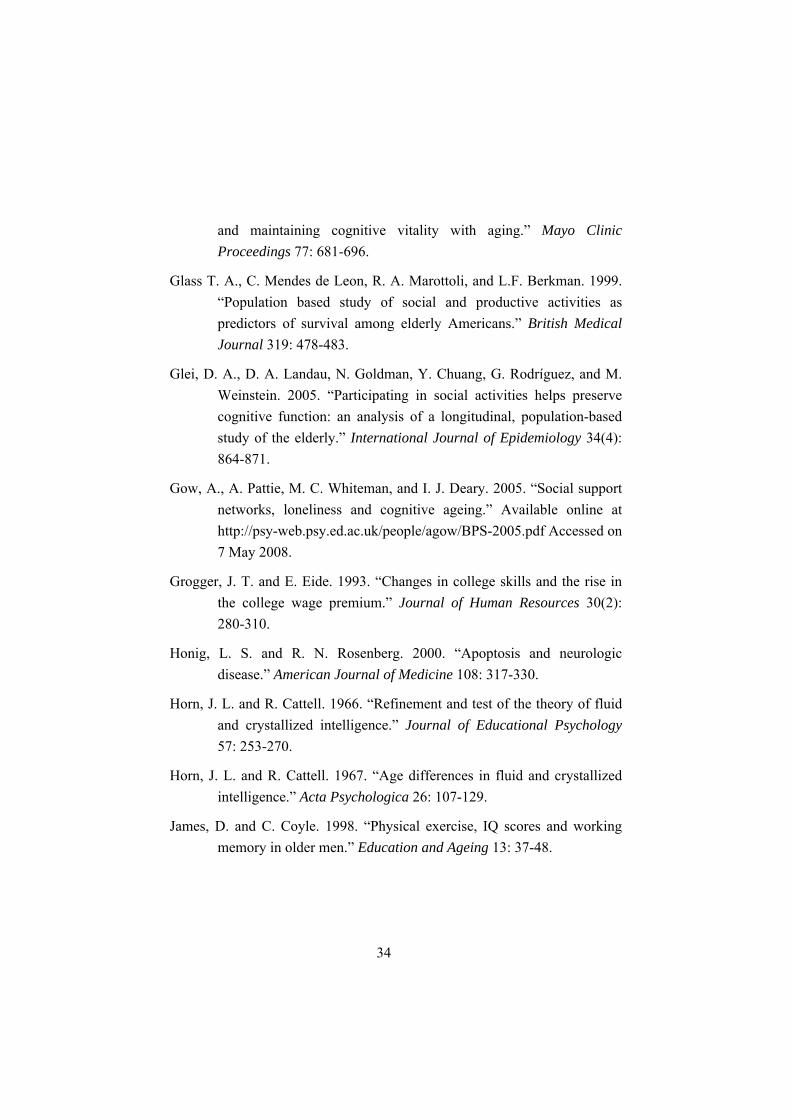
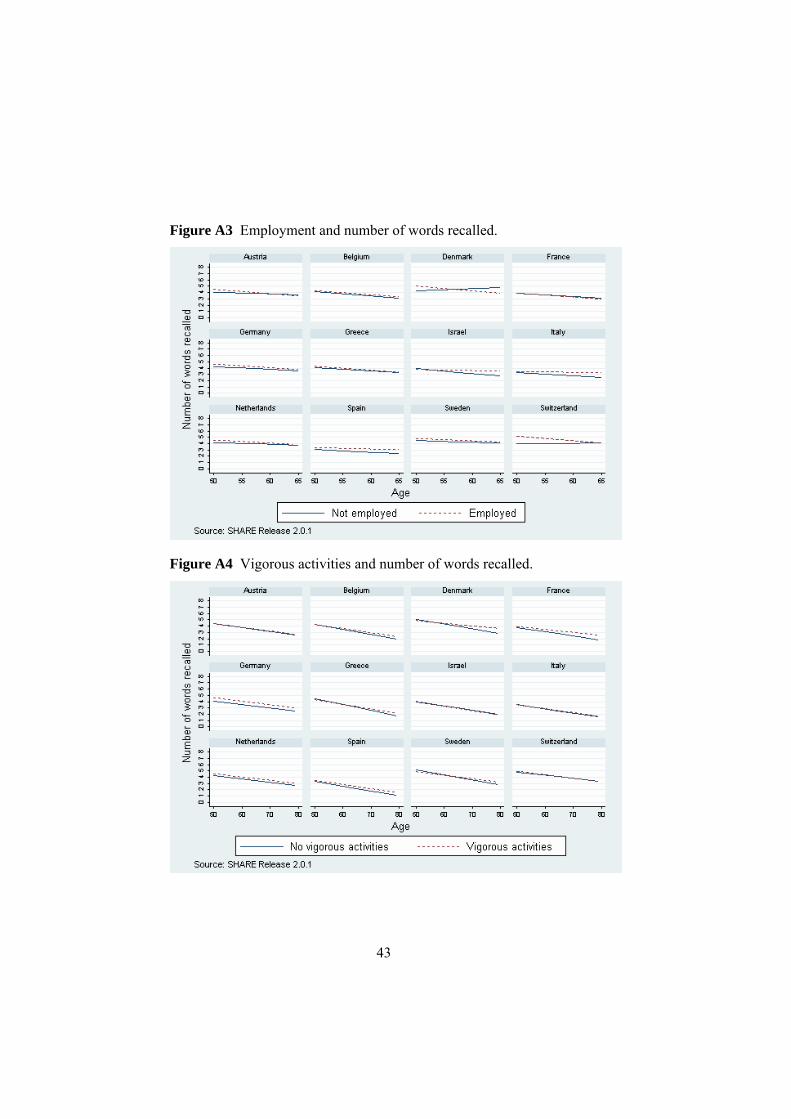
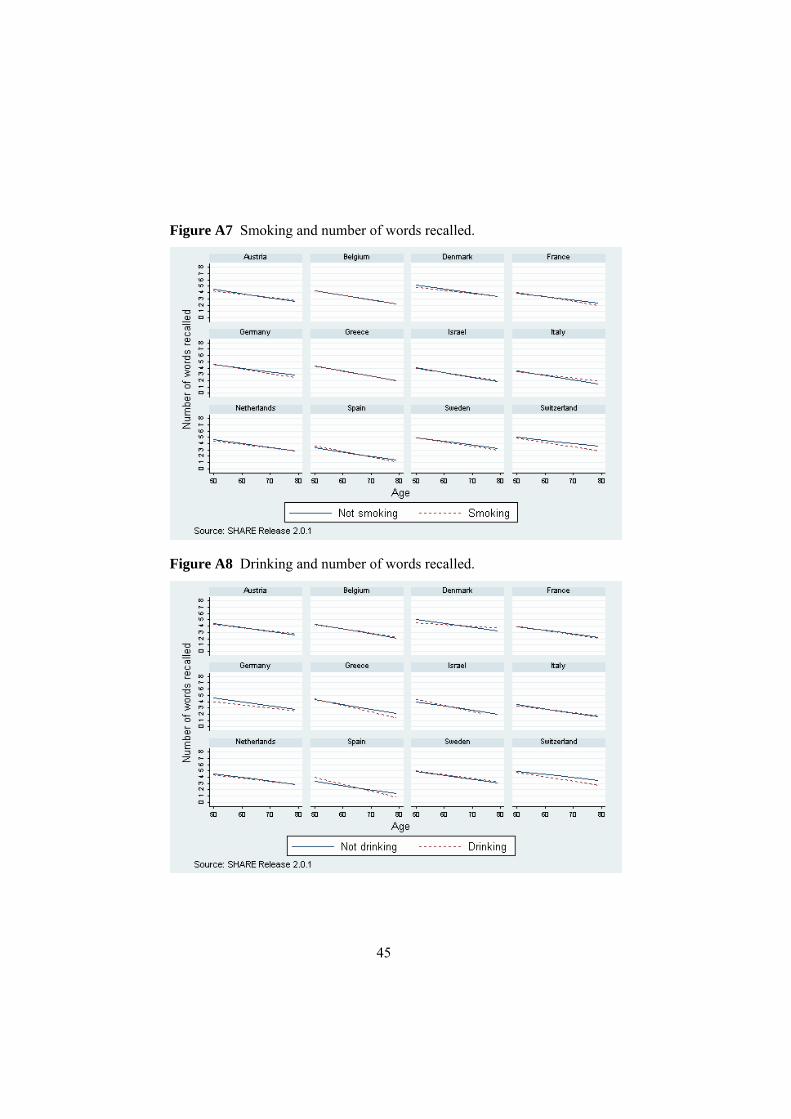
In a next step, linear regressions were applied to visualise the association between various sources of plasticity (as outlined in the previous section) and cognitive performances (cf. Appendix). Better cognitive functions were associated with higher levels of education (Figure A1), attendance in an educational course (Figure A2), employment (Figure A3), vigorous activities (Figure A4), moderate activities (Figure A5), being overweight (Figure A6). The results for the behavioural risks smoking (Figure A7) and drinking (Figure A8) pointed in the expected direction, although the effects were quite small and inverse for some countries. Associations between cognitive functioning and voluntary and charity work (Figure A9), help provided to family, friends and neighbours (Figure A10) as well as participation in a sports or social club (Figure A11), a religious organisation (Figure A12) and a political organisation (Figure A13) were less pronounced but nevertheless existent for some countries.
4.2 Multivariate results
In order to estimate the basic stochastic frontier function for the variable recall, we included in a first step age, age squared and the relative level of education. The estimated coefficients of this first model (Model 1) are listed in Table 1.
Both age and education had a significant effect on the shape of the frontier function. The estimated coefficients of age correspond to a declining function, starting at a value of 6.2 words recalled by respondents aged 50 years and declining to 4.5 words by individuals aged 80 (Figure 3). As expected, education was an important factor for cognitive performance among the aged. The estimated coefficients were highly significant and indicated that the better the cognitive functioning, the higher the educational level. Summing up, the cognitive reserve frontier estimated as a function of age and educational level can be considered as a good benchmark with respect to which individual cognitive performance can be assessed.
22
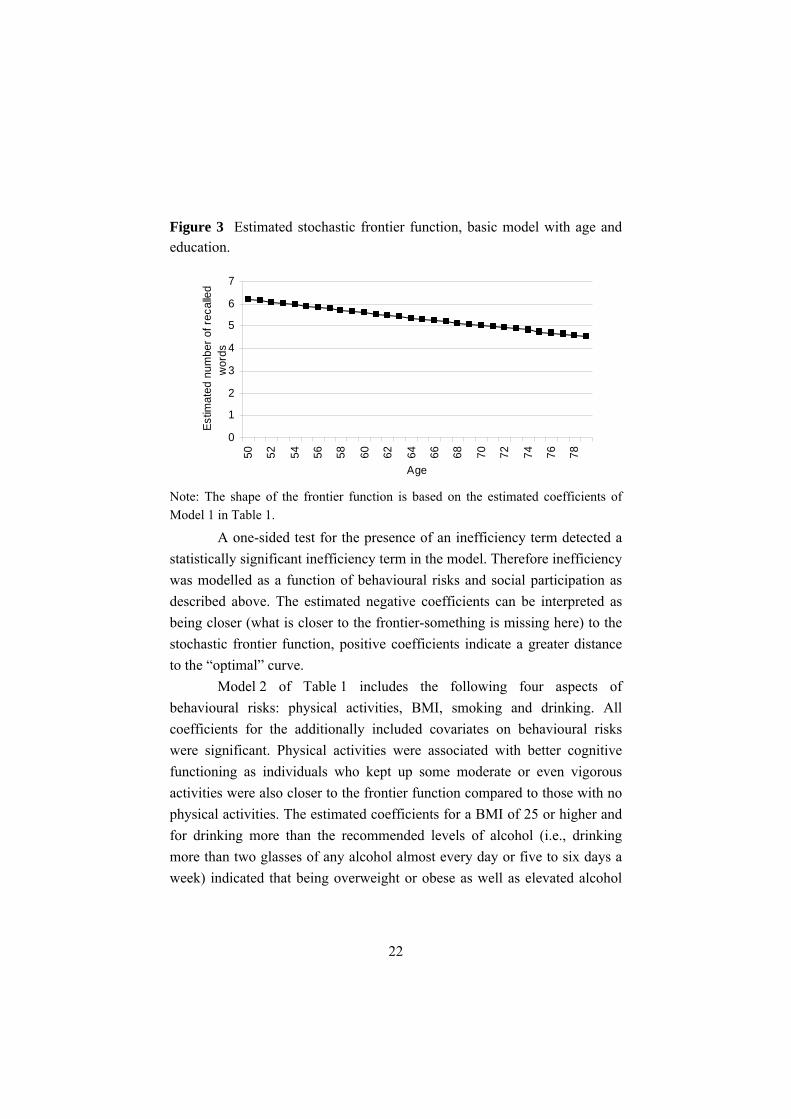
Figure 3 Estimated stochastic frontier function, basic model with age and education.
0
1
2
3
4
5
6
7
50 52 54 56 58 60 62 64 66 68 70 72 74 76 78
Age
Estim
ated
num
ber o
f rec
alle
dw
ords
Note: The shape of the frontier function is based on the estimated coefficients of Model 1 in Table 1.
A one-sided test for the presence of an inefficiency term detected a statistically significant inefficiency term in the model. Therefore inefficiency was modelled as a function of behavioural risks and social participation as described above. The estimated negative coefficients can be interpreted as being closer (what is closer to the frontier-something is missing here) to the stochastic frontier function, positive coefficients indicate a greater distance to the “optimal” curve.
Model 2 of Table 1 includes the following four aspects of behavioural risks: physical activities, BMI, smoking and drinking. All coefficients for the additionally included covariates on behavioural risks were significant. Physical activities were associated with better cognitive functioning as individuals who kept up some moderate or even vigorous activities were also closer to the frontier function compared to those with no physical activities. The estimated coefficients for a BMI of 25 or higher and for drinking more than the recommended levels of alcohol (i.e., drinking more than two glasses of any alcohol almost every day or five to six days a week) indicated that being overweight or obese as well as elevated alcohol

23
consumption increased the distance to the frontier function of optimal cognitive functioning. Surprisingly, smoking had a slightly positive effect on cognition, which was even highly significant. This result may be due to selection bias in the cross-sectional dataset. Selection could be caused by an increasingly higher mortality of smokers with age and a positive selection of the smokers in the survey with respect to cognition.
Finally, different dimensions of social engagement were added. More exactly, we included indicators for being employed, attending educational courses, doing voluntary or charity work, providing help to family, friends or neighbours, participating in a sports, social or other club, participating in a religious organisation and participating in a political or community organisation. The estimated coefficients of the seven dimensions of social engagement were significantly negative and therefore indicated that individuals engaged in social engagement were closer to the optimal frontier curve as compared to those not engaged (Table 1, Model 3).
In addition the estimates for the standard deviations of the two error components 2
vσ and 2uσ indicated that most of the variation was through
technical inefficiency u , not measurement error v , as the corresponding standard deviation 74.02 =uσ was higher than 05.02 =vσ . In other words, most of the variation was through systematic inefficiency and not due to measurement errors.
In order to detect possible gender differences in the association between behavioural risks as well as social engagement and the variable recall, models for men and women were run separately (Table 2). The association between attending an educational course, engagement in a sports or other social club and participation in a religious or political organisation on the one hand and the number of words recalled on the other hand, was stronger among women than among men. In general, the association between social engagement and cognition was stronger among women than among men. Turning to behavioural risks, the estimates indicate that physical activities were more strongly correlated with cognition among men than among women, whereas overweight and smoking showed a stronger

24
association with the variable recall among women. Interestingly, smoking decreased the distance to the frontier among women while increasing it among men. With other words, smoking was associated negatively with the variable recall among men and positively among women.
Table 1 Stochastic frontier model including behavioural risks and social engagement.
Model 1 Model 2 Model 3 ln(age) 2.22*** 2.03*** 2.75*** (ln(age))² -0.35*** -0.32*** -0.40*** Median level of education 0.10*** 0.09*** 0.09*** High level of education 0.22*** 0.20*** 0.18*** Constant -1.50*** -1.21*** -2.88*** Factors explaining the distance Behavioural risks Moderate activities -0.31*** -0.22*** Vigorous activities -0.69*** -0.47*** BMI ≥ 25 0.27*** 0.22*** Smoking -0.07*** -0.02*** Drinking 0.28*** 0.23*** Social engagement Employed -0.25*** Educational course -0.43*** Voluntary or charity work -0.10*** Help to family, friends or neighbours -0.30*** Sports or other social club -0.35*** Religious organisation -0.07*** Political organisation -0.09*** Constant -0.17*** 0.09*** ln(σ2) -0.01*** -0.13*** -0.23*** N 18,929 18,703 18,678 Notes: Reference categories: Not employed; Hardly ever or never vigorous or moderate activities; Not smoking; Drinking less than two glasses of alcohol almost every day or 5-6 days a week; Not attending an educational course; not engaged in voluntary or charity work; no provision of help to family, friends or neighbours; no engagement in sports or other social club; no participation in a religious organisation; no participation in a political organisation. * significant at the 5 per cent level, ** significant at the 1 per cent level, *** significant at the 0.1 per cent level. Source: SHARE Release 2.0.1; pooled sample without Israel.

25
Finally, the stochastic frontier approach was run for all countries separately (Table 3). Unfortunately, the models did not converge for Denmark, the Netherlands and Switzerland. For these three countries, already the basic frontier function with ln(age) either did not find an initial starting point or did not converge. Nevertheless, the graphs representing the mean number of words recalled (Figure 3) show for Denmark and the Netherlands a pattern similar to the other countries. For Switzerland, the graph is strongly fluctuating which might be the reason for the lack of convergence.
Despite the different signs of the coefficients for age and education, we find for all countries a decline in cognitive performance with age. The estimated effects are significant for all countries, the only exception being Israel. Moreover, we find the expected higher cognitive performance with higher educational levels. In all countries these coefficients are highly significant.
Concerning the potential factors affecting individuals’ misperformance, or distances to the estimated frontier, we find for all countries with the exception of France significant negative effects for being employed. Thus, in almost all countries, being employed reduces the individual distance from the best possible performance given a certain age and educational level. Also the exercise of physical activities, whether vigorously or moderately, has a positive effect on cognitive reserve.
As regards being overweight or obese, smoking and drinking, the country-specific results do not confirm the general expectations. In Austria, both a high BMI and drinking appear to significantly favour the cognitive performance. As for smoking, only for France, Germany and Spain do we find a significantly reduced cognitive performance while it appeared significantly increased in almost all other countries.

26
Table 2 Stochastic frontier model, by gender.
Model 2 Men
Model 2 Women
Model 3 Men
Model 3 Women
ln(age) -2.20*** 5.85*** -1.47*** 6.36***(ln(age))² 0.19*** -0.79*** 0.12*** -0.84***Median level of education 0.10*** 0.07*** 0.10*** 0.07***High level of education 0.22*** 0.17*** 0.20*** 0.15***Constant 7.46*** -9.04*** 5.70*** -10.23***Factors explaining the distance Behavioural risks Moderate activities -0.34*** -0.29*** -0.26*** -0.19***Vigorous activities -0.72*** -0.66*** -0.50*** -0.45***BMI ≥ 25 0.14*** 0.33*** 0.12*** 0.25***Smoking 0.04*** -0.29*** 0.06*** -0.22***Drinking 0.26*** 0.19*** 0.20*** 0.15***Social engagement Employed -0.32*** -0.20***Educational course -0.24*** -0.58***Voluntary or charity work -0.13*** -0.07***Help to family, friends or neighbours -0.24*** -0.32***
Sports or other social club -0.33*** -0.42***Religious organisation 0.00* -0.10***Political organisation -0.10*** -0.20***Constant -0.14*** -0.15*** 0.14*** 0.13***ln(σ2) -0.16*** -0.09*** -0.26*** -0.21***N 8,899 9,804 8,884 9,794 Notes: Reference categories: Not employed; Hardly ever or never vigorous or moderate activities; Not smoking; Drinking less than two glasses of alcohol almost every day or 5-6 days a week; Not attending an educational course; not engaged in voluntary or charity work; no provision of help to family, friends or neighbours; no engagement in sports or other social club; no participation in a religious organisation; no participation in a political organisation. * significant at the 5 per cent level, ** significant at the 1 per cent level, *** significant at the 0.1 per cent level. Source: SHARE Release 2.0.1; pooled sample without Israel.

Table 3 Stochastic frontier approach by countries. ALL Austria Belgium France Germany Greece Israel Italy Spain Sweden
Ln(age) 2.75*** -2.41*** 1.79*** 1.25*** -3.42*** 13.80*** 8.91 11.19*** 14.96*** 4.91***(ln(age))² -0.40*** 0.22*** -0.29*** -0.22*** 0.36*** -1.77*** -1.17+ -1.45*** -1.93*** -0.64***Median level of education 0.09*** 0.09*** 0.12*** 0.11*** 0.08*** 0.09*** 0.04+ 0.09*** 0.11*** 0.09***High level of education 0.18*** 0.19*** 0.21*** 0.18*** 0.21*** 0.22*** 0.14*** 0.21*** 0.29*** 0.16***Constant -2.88*** 7.92*** -0.84** 0.28* 9.67*** -25.22***-15.19 -19.94*** -27.35*** -7.72***Factors explaining the distance Behavioural risks Moderate activities -0.22*** -1.69*** -0.38*** -0.07*** -0.98*** -0.20*** 0.15 0.08*** -0.16*** -0.79***Vigorous activities -0.47*** -1.20*** -0.35*** -0.15*** -1.55*** -0.23*** 0.10 -0.08*** -0.27*** -0.68***BMI ≥ 25 0.22*** -0.19*** 0.10*** 0.28*** 0.59*** 0.37*** 0.09 0.11*** 0.11*** 0.10***Smoking -0.02*** -0.07*** -0.15*** 0.14*** 0.12*** -0.04*** 0.01 -0.07*** 0.02*** -0.06***Drinking 0.23*** -0.03*** 0.06*** 0.04*** 0.60*** 0.26*** -0.22 0.04*** -0.00 0.04**Social Engagement Employed -0.25*** -0.03*** -0.33*** 0.02*** -0.42*** -0.37*** -0.28** -0.09*** -0.08*** -0.42***Educational course -0.43*** -0.20*** -0.49*** -0.15*** -0.30*** 0.21*** -0.60** -0.41*** -0.33*** -0.75***Voluntary or charity work -0.10*** 0.36*** -0.28*** -0.09*** 0.26*** 0.45*** -0.10 -0.04*** -0.02*** 0.11***Help to family, friends or neighbours
-0.30*** 0.05*** -0.01* -0.15*** -0.61*** -0.14*** -0.24+ -0.20*** -0.05*** -0.29***
Sports or social club -0.35*** -0.14*** -0.44*** -0.18*** -0.27*** -0.40*** -0.40** -0.40*** 0.31*** -0.25***Religious organisation -0.07*** 0.10*** -0.57*** -0.36*** -0.36*** -0.05*** -0.05 -0.16*** 0.08*** -0.15***Political organisation -0.09*** -0.24*** 0.06*** -0.21*** 0.57*** -1.14*** -0.48+ 0.13*** -1.05*** -0.07***Constant 0.09*** 0.20*** -0.23*** -0.80*** -1.07*** -0.66*** -0.18 0.15*** 0.60*** -0.38***ln(σ2) -0.23*** 0.21*** -0.01 0.02*** 0.32*** -0.19*** -0.34+ -0.54*** -0.67*** 0.00 N 18,678 1,343 2,363 1,819 2,184 1,985 1,761 1,692 1,404 2,115
Notes: Reference categories: Not employed; Hardly ever or never vigorous or moderate activities; Not smoking; Drinking less than two glasses of alcohol almost every day or 5-6 days a week; Not attending an educational course; not engaged in voluntary or charity work; no provision of help to family, friends or neighbours; no engagement in sports or other social club; no participation in a religious organisation; no participation in a political organisation. + significant at the 10 per cent level, * significant at the 5 per cent level, ** significant at the 1 per cent level, *** significant at the 0.1 per cent level. Source: SHARE Release 2.0.1.
28
Also the different forms of social engagement do not uniformly yield the expected results: Further training does not produce a reduction in cognitive performance in Greece. Voluntary or charity work does not bring about the expected results in Austria, Germany, Greece and Sweden. Giving help to family, friends or neighbours has no positive effect on cognitive reserve in Austria. Taking part in a sports or social club does not seem to help in Spain and being active in a religious organisation is linked with a significant misperformance in Austria and in Spain. Finally, being active in a political organisation increases the distance to the cognitive frontier in Belgium, Germany and in Italy. Thus although we obtained the expected signs for the pooled sample, the country-specific results are problematic and need further consideration.
5 DISCUSSION
Emerging research has resulted in a growing understanding of the potentially modifiable factors associated with cognitive decline in late life and several interventions are being evaluated in research studies for preventing cognitive decline and dementia in older persons: early detection, lifestyle factors, management of medical morbidities as well as pharmaceutical approaches (Filit et al. 2002). The idea of lifestyle management is to promote brain reserve via lifelong learning, social engagement and occupational complexity. Social disengagement is an independent risk factor for cognitive decline among cognitively intact older persons (Bassuk et al. 1999). Berkman (2000) suggests that social engagement most likely challenges individuals to communicate and participate in exchanges that stimulate cognitive capacities. Maintenance of social engagement and avoidance of social isolation may be important in maintaining cognitive vitality in old age.
In this paper we use a parametric stochastic frontier approach to estimate the impact of social engagement as well as behavioural risk factors

29
on cognitive reserve and vitality in ageing among persons aged 50 and more in twelve mainly European countries. For this purpose we use the individual data collected during the first wave of SHARE in 2004.
In the pooled sample, the results clearly show that individuals’ cognitive reserve is driven mainly by age and by educational level. At the same time, all different forms of social engagement increase cognitive functions, in particular the continuation of occupational activities. Moreover, behavioural risks such as physical inactivity, being overweight or obese, smoking or drinking clearly do not favour cognitive performances. Country-specific results, however, vary with respect to signs for all indicators of social engagement and behavioural risks.
Due to the cross-sectional framework of our study, we have to be careful with causal statements. Thus we can not say whether socially more active persons have better cognitive performance or whether persons with better cognitive performance are socially more active. Longitudinal studies, however, clearly indicate that the relationship between social participation and cognitive capabilities works in the former way. SHARE is a longitudinal project and further waves will enable us to produce a causal statement regarding social participation and cognitive ageing. Further longitudinal analysis may also help us to disentangle some of the puzzling country-specific results.

30
References
Adam, S., C. Bay, E. Bonsang, S. Germain, and S. Perelman. 2006. “Occupational activities and cognitive reserve: a frontier approach applied to the Survey of Health, Ageing and Retirement in Europe (SHARE).” CREPP Working Paper 2006/05.
Aigner, D., K. Lovell, and P. Schmidt. 1977. “Formulation and estimation of stochastic frontier production function models.” Journal of Econometrics 6: 21-37.
Ball, K., D. B. Berch, K. F. Helmers, J. B. Jobe, M. D. Leveck, M. Marsiske, J. N. Morris, G. W. Rebok, D. M. Smith, S. L. Tennstedt, F. W. Unverzagt, and S. L. Willis. 2002. “Effects of cognitive training interventions with older adults.” Journal of the American Medical Association 288(18): 2271-2281.
Baltes, P. B. and M. M. Baltes. 1990. “Psychological perspectives on successful aging: The model of selective optimization with compensation.” In: P. B. Baltes and M. M. Baltes. (eds.) Successful Aging: Perspectives from the Behavioral Sciences. Cambridge, England, Cambridge University, pp. 1-34.
Barnes, L. L., C. F. Mendes de Leon, R. S. Wilson, J. L. Bienias, and D. A. Evans. 2004. “Social resources and cognitive decline in a population of older African Americans and whites.” Neurology 63(12): 2322-2326.
Bassuk, S., T. A. Glass, and L. F. Berkman. 1999. “Social disengagement and incident cognitive decline in community-dwelling elderly persons.” Annals of Internal Medicine 131(3): 165-173.
Battese, G. E. and T. J. Coelli. 1995. “A model for technical inefficiency effects in a stochastic frontier production function for panel data.” Empirical Economics 20: 325-332.

31
Beland, F., M.-V.Zunzunegui, B. Alvarado, A. Otero, and T. del Ser. 2005. “Trajectories of cognitive decline and social relations.” The Journals of Gerontology Series B: Psychological Sciences and Social Sciences 60: 320-330.
Belgrave, L. L., M. R. Haug, and F. X. Gomez-Bellenge. 1987. “Gender and race differences in effects of health and pension on retirement before 65.” Comprehensive Gerontology [B] 1(3): 109-117.
Bennett, D. A., R. S. Wilson, J. A. Schneider, D. A. Evans, C. F. Mendes de Leon, S. E. Arnold, L. L. Barnes, and J. L. Bienias. 2003. “Education modifies the relation of AD pathology to level of cognitive function in older persons.” Neurology 60: 1909-1915.
Blum, J. E., L. F. Jarvik, and E. T. Clark. 1970. “Rate of change on selective tests of intelligence. A twenty-year longitudinal study of aging.” Journal of Gerontology 25: 171-176.
Börsch-Supan, A. and H. Jürges (eds.) 2005. The Survey of Health, Ageing and Retirement in Europe – Methodolgy. Mannheim, MEA Eigenverlag.
Bond, G. E., R. Burr, S. M. McCurry, A. Borenstein Graves, and E. B. Larson. 2001. “Alcohol, aging and cognitive performance in a cohort of Japanese Americans aged 65 and older: The Kame Project.” International Psychogeriatrics 13: 207-223.
Bosse, R., C. M. Aldwin, M. R. Levenson, and D. J. Ekerdt. 1987. “Mental health differences among retirees and workers: findings from the Normative Aging Study.” Psychology and Aging 2(4): 383-389.
Buber, I. 2007. SHARE Codebook. Release 2. Research Report 30a. Vienna, Vienna Institute of Demography.
Bunk, S. 2000. “Cognition and aging. A rare colony of old macaques gives clues to age impairment.” The Scientist 14: 18-19.

32
Capurso, A., F. Panza, V. Solfrizzi, C. Capurso, F. Mastroianni, and A. Del Parigi. 2000. “Age-related cognitive decline: Evaluation and prevention strategy.” Recenti Progressi in Medicina 91: 127-134.
Coffey, C. E., W. E. Wilkinson, I. A. Parashos, S. A. Soady, R. J. Sullivan, L. J. Patterson, G. S. Figiel, M. C. Webb, C. E. Spritzer, and W. T. Djang. 1992. “Quantitative cerebral anatomy of the aging human brain: A cross-sectional study using magnetic resonance imaging.” Neurology 42: 527-536.
Cohen, S. 2004. “Social relationships and health.” American Psychologist Nov: 676-684.
Cole, M. S., W. S. Schaninger, and S. G. Harris. 2002. “The workplace social exchange network: a multilevel, conceptual examination.” Group and Organizational Management 27(1): 142-167.
Cullum, S., F. A. Huppert, M. McGee, T. Dening, A. Ahmed, E. S. Paykel, and C. Brayne. 2000. “Decline across different domains of cognitive function in normal ageing: results of a longitudinal population-based study using CAMCOG.” International Journal of Geriatric Psychiatry 15: 853-862.
Dave, D., I. Rashad, and J. Spasojevic. 2006. “The effects of retirement on physical and mental health outcomes.” NBER WP 12123.
Deary, I. J., A. Pattie, M. D. Taylor, M. C. Whiteman, J. M. Starr, and L. J. Whalley. 2003. “Smoking and cognitive change from age 11 to age 80.” Journal Neurology, Neurosurgery and Psychiatry 74: 1006-1007.
Deary, I. J., L. J. Whalley, H. Lemmon, J. R. Crawford, and J. M. Starr. 2000. “The stability of individual differences in mental ability from childhood to old age. Follow-up of the 1932 Scottish mental survey.” Intelligence 28(1): 49-55.
33
Dik, M. G., D. J. H. Deeg, M. Visser, and C. Jonker. 2003. “Early life physical activity and cognition at old age.” Journal of Clinical and Experimental Neuropsychology 25: 643-653.
Dolton, P. J. and A. F. Vignoles. 2000. “The pay-off to mathematics A-level.” In: C. Tikly and A. Wolf (eds.) The maths we need now. London, UK, The Institute of Education, pp. 52-73.
Dourleijn, E., A. C. Liefbroer, and G. C. N. Beets. 2002. “Comparing the 1988 International Standard Classification of Education (ISCED) with retrospective information from educational histories.” In: E. Klijzing and M. Corijn (eds.) Dynamics of Fertility and Partnership in Europe: Insights and Lessons from Comparative Research, Volume 2. Geneva/New York, United Nations, pp. 157-172.
Elias, M. F., P. K. Elias, L. M. Sullivan, P. A. Wolf, and R.B. D’Agostino. 2003. “Lower cognitive function in the presence of obesity and hypertension: the Framingham heart study.” International Journal of Obesity 27: 260-268.
Elwood, P. C., J. E. J. Gallacher, C. A. Hopkinson, J. Pickering, P. Rabbitt, B. Stollery, C. Brayne, F. A. Huppert, and A. Bayer. 1999. “Smoking, drinking and other life style factors and cognitive function in men in the Caerphilly cohort.” Journal of Epidemiology and Community Health 53: 9-14.
Falleti M., A. Sanfilippo, P. Maruff, L. Weih, and K.-A. Phillips. 2006. “The nature and severity of cognitive impairment associated with adjuvant chemotherapy in women with breast cancer: A meta-analysis of the current literature.” Brain and Cognition 59: 60-70.
Fillit, H. M., R. N. Butler, A. W. O’Connell, M. S. Albert, J. E. Birren, C. W. Cotman, W. T. Greenough, P. E. Gold, A. F. Kramer, L. H. Kuller, T. T. Perls, B.G. Sahagan, and T. Tully. 2002. “Achieving
34
and maintaining cognitive vitality with aging.” Mayo Clinic Proceedings 77: 681-696.
Glass T. A., C. Mendes de Leon, R. A. Marottoli, and L.F. Berkman. 1999. “Population based study of social and productive activities as predictors of survival among elderly Americans.” British Medical Journal 319: 478-483.
Glei, D. A., D. A. Landau, N. Goldman, Y. Chuang, G. Rodríguez, and M. Weinstein. 2005. “Participating in social activities helps preserve cognitive function: an analysis of a longitudinal, population-based study of the elderly.” International Journal of Epidemiology 34(4): 864-871.
Gow, A., A. Pattie, M. C. Whiteman, and I. J. Deary. 2005. “Social support networks, loneliness and cognitive ageing.” Available online at http://psy-web.psy.ed.ac.uk/people/agow/BPS-2005.pdf Accessed on 7 May 2008.
Grogger, J. T. and E. Eide. 1993. “Changes in college skills and the rise in the college wage premium.” Journal of Human Resources 30(2): 280-310.
Honig, L. S. and R. N. Rosenberg. 2000. “Apoptosis and neurologic disease.” American Journal of Medicine 108: 317-330.
Horn, J. L. and R. Cattell. 1966. “Refinement and test of the theory of fluid and crystallized intelligence.” Journal of Educational Psychology 57: 253-270.
Horn, J. L. and R. Cattell. 1967. “Age differences in fluid and crystallized intelligence.” Acta Psychologica 26: 107-129.
James, D. and C. Coyle. 1998. “Physical exercise, IQ scores and working memory in older men.” Education and Ageing 13: 37-48.

35
Katzman, R. 1993. “Education and the prevalence of dementia and Alzheimer’s disease.” Neurology 43: 13-20.
Launer, L. J., K. Andersen, M. E. Dewey, L. Letenneur, A. Ott, L. A. Amaducci, C. Brayne, J. R. Copeland, J. F. Dartigues, P. Kragh-Sorensen, A. Lobo, J. M. Martinez-Lage, T. Stijnen, and A. Hofman. 1999. “Rates and risk factors for dementia and Alzheimer’s disease: results from EURODEM pooled analyses. EURODEM Incidence Research Group and Work Groups. European Studies of Dementia.” Neurology 52: 78-84.
Le Carret, N., S. Lafont, W. Mayo, and C. Fabrigoule. 2003. “The effect of education on cognitive performances and its implication for the constitution of the cognitive reserve.” Developmental Neuropsychology 23: 317-337.
Mackenzie, C. S., M. C. Smith, L. Hasher, L. Leach, and P. Behl. 2007. “Cognitive functioning under stress: evidence from informal caregivers of palliative patients.” Journal of Palliative Medicine 10(3): 749-758.
Mackinnon, A., H. Christensen, S. M. Hofer, A. E. Korten, and A. F. Jorm. 2003. “Use it and still lose it? The association between activity and cognitive performance established using latent growth techniques in a community sample.” Aging, Neuropsychology and Cognition, 10(3): 215-229.
Maier, H. and P. L. Klumb. 2005. “Social participation and survival at older ages: is the effect driven by activity content or context?” European Journal of Ageing 2(1): 31-39.
Maitland, S. B., R. C. Intrieri, W. K. Schaie, and S. L. Willis. 2000. “Gender differences and changes in cognitive abilities across the adult life span.” Aging, Neuropsychology and Cognition 7(1): 32-53.

36
McDougall, G. J., H. Becker. and K. L. Areheart. 2006. “Older males, cognitive function and alcohol consumption.” Issues in Mental Health Nursing 27(4): 337-353.
McGarry, K. 2004. “Health and retirement: do changes in health affect retirement expectations?” Journal of Human Resources 39(3): 624-648.
McGue, M. and K. Christensen. 2007. “Social activity and healthy aging: a study of aging Danish twins.” Twin Research and Human Genetics 10(2): 255-265.
Meeusen, W. and J. van den Broeck. 1977. “Efficiency estimation from Cobb-Douglas production functions with composed error.” International Economic Review 18: 435-444.
Mein, G., P. Martikainen, H. Hemingway, S. Stansfeld, and M. Marmot. 2003. “Is retirement good or bad for mental and physical health functioning? Whitehall II longitudinal study of civil servants.” Journal of Epidemiology and Community Health 57: 46-49.
Melchior, M., L. F. Berkman, I. Niedhammer, M. Chea, and M. Goldberg. 2003. “Social relations and self-reported health: a prospective analysis of the French Gazel cohort.” Social Science and Medicine 56: 1817-1830.
Meyer, J. S., G. M. Rauch, K. Crawford, R. A. Rauch, S. Konno, H. Akiyama, Y. Terayama, and A. Haque. 1999. “Risk factors accelerating cerebral degenerative changes, cognitive decline and dementia.” International Journal of Geriatric Psychiatry 14: 1050-1061.
Midanik L. T., K. Soghikian, L. J. Ransom, and I. S. Tekawa. 1995. “The effect of retirement on mental health and health behaviors: the Kaiser Permanente Retirement Study.” Journals of Gerontology

37
Series B, Psychological Sciences and Social Sciences 50(1): S59-S61.
Minois, N. and E. Le Bourg. 1997. “Hypergravity and aging in drosophila melonagaster. Conditioned suppression and habituation of the proboscis extension response.” Aging, Experimental and Clinical Research 9(4): 1-11.
Murnane, R. J., J. B. Willett, and F. Levy. 1995. “The growing importance of cognitive skills in wage determination.” Review of Economics and Statistics LXXVII (2): 251-266.
Newson, R. S. and E. B. Kemps. 2005. “General lifestyle activities as a predictor of current cognition and cognitive change.” Journals of Gerontology: Psychological Sciences 60B(3): 113-21.
Norman, S., A. I. Tröster, J. A. Fields, and R. Brooks. 2002. “Effects of depression and Parkinson’s disease on cognitive functioning.” Journal of Neuropsychiatry & Clinical Neurosciences 14: 31-36.
Park, D. C., R. E. Nisbett, and T. Hedden. 1999. “Culture, cognition and aging.” Journal of Gerontology 54B: 75-84.
Prskawetz, A., B. Mahlberg, V. Skirbekk, I. Freund, M. Winkler-Dworak, T. Lindh, B. Malmberg, A.-C. Jans, O. S. Nordström, and F. Andersson. 2005. “The impact of population ageing on innovation and productivity growth in Europe. (Report for Tender VT/2004/454).” Forschungsbericht 28, Vienna Institute of Demography.
Prskawetz, A., B. Mahlberg, and V. Skirbekk. 2007. “Firm productivity, workforce age and educational structure in Austrian industries in 2001.” In: R. L. C. Clark, N. Ogawa, and A. Mason. (eds.) Population Aging, Intergenerational Transfers and the Macroeconomy. Cheltenham, UK, Edward Elgar Publishing, pp. 38-66.

38
Rasquin, S. J., R. Lodder, I. Ponds, J. Winkens, J. Jolles, and F. R. J. Verhey. 2004. “Cognitive functioning after stroke: a one-year follow-up study.” Dementia and Geriatric Cognitive Disorders 18(2): 138-144.
Raz, N. 2004. “The aging brain: Structural changes and their implications for cognitive aging.” In: R. A. Dixon, L. Bäckman, and L.-G. Nilsson. (eds.) New Frontiers in Cognitive Aging. Oxford, University Press, pp. 115-133.
Richards, M., R. Hardy, , and M. E. Wadsworth. 2003. “Does active leisure protect cognition? Evidence from a national birth cohort.” Social Science and Medicine 56: 785-792.
Richards, M., B. Shipley, R. Fuhrer, and M. E. Wadsworth. 2004. “Cognitive ability in childhood and cognitive decline in mid-life: longitudinal birth cohort study.” BMJ 328: 552-557.
Salokangas, R. K. and M. Joukamaa. 1991. “Physical and mental health changes in retirement age.” Psychotherapy and Psychosomatics 55: 100-107.
Scarmeas, N., G. Levy, M. X. Tang, J. Manly, and Y. Stern. 2001. “Influence of leisure activity on the incidence of Alzheimer’s disease.” Neurology 57: 2236-2242.
Scarmeas, N. and Y. Stern. 2003. “Cognitive reserve and lifestyle.” Journal of Clinical and Experimental Neuropsychology 25(5): 625-633.
Schaie, K. W. and S. L. Willis. 1986. “Can decline in intellectual functioning be reversed?” Developmental Psychology 22(2): 223-232.
Schaie, K. W. 1994. “The course of adult intellectual development.” American Psychologist 49: 304-313.
Schaie, K. W. 1996. Intellectual Development in Adulthood. The Seattle Longitudinal Study. New York, Cambridge University Press.

39
Schatz, J. and R. Buzan. 2006. “Decreased corpus callosum size in sickle cell disease: relationship with cerebral infarcts and cognitive functioning.” Journal of the International Neuropsychological Society 12: 24-33.
Schmidt, F. L. and J. E. Hunter. 1998. “The validity and utility of selection methods in personnel psychology: practical and theoretical implications of 85 years of research findings.” Psychological Bulletin 124(2): 262-274.
Schmidt, R., L. Mechtler, P. R. Kinkel, F. Fazekas, W. R. Kinkel, and W. Freidl. 1993. “Cognitive impairment after acute supratentorial stroke: a 6-month follow-up clinical and computed tomographic study.” European Archives of Psychiatry and Clinical Neuroscience 243(1): 11-15.
Schooler, C., M. S. Mulatu, and G. Oates. 1999. “The continuing effects of substantively complex work in the intellectual functioning of older workers.” Psychology and Aging 14(3): 483-506.
Schwartzman, A. E., D. Gold, D. Andres, T. Y. Arbuckle, and J. Chaikelson. 1987. “Stability of intelligence. A 40 year follow-up.” Canadian Journal of Psychology 41: 244-256.
Snowdon, D. A., S. J. Kemper, J. A. Mortimer, L. H. Greiner, D. R. Wekstein, and W. R. Markesbery. 1996. “Linguistic ability in early life and cognitive function and Alzheimer’s disease in later life.” Journal of the American Medical Association 275: 528-532.
Stern, Y., S. Albert, M. X. Tang, and W.Y. Tsai. 1999. “Rate of memory decline in AD is related to education and occupation: cognitive reserve?” Neurology 53: 1942-1947.
Sugisawa, A., H. Sugisawa, Y. Nakatani, and H. Shibata. 1997. “Effect of retirement on mental health and social well-being among elderly Japanese.” Nippon Koshu Eisei Zasshi 44(2): 123-130.

40
Tomassini, C., K. Glaser, D. A. Wolf, M. I. Broese van Groenou, and E. Grundy. 2004. “Living arrangements among older people: an overview of trends in Europe and the USA.” Population Trends 115: 24-34.
UN. 2007. World Population Prospects: The 2006 Revision. New York, United Nations.
Verhaegen, P. and T. A. Salthouse. 1997. “Meta-analyses of age-cognition relations in adulthood. Estimates of linear and nonlinear age effects and structural models.” Psychological Bulletin 122(3): 231-249.
Vitaliano, P., D. Echeverria, J. Yi, P. E. M. Phillips, H. Young, and I. C. Siegler. 2005. “Psychophysiological mediators of caregiver stress and differential cognitive decline.” Psychology and Aging 20(3): 402-411.
Whalley, L. J., J. M. Starr, R. Athawes, D. Hunter, A. Pattie, and I. J. Deary. 2000. “Childhood mental ability and dementia.” Neurology 55: 1455-1459.
Wilson, R. S., C. F. Mendes De Leon, L. L. Barnes, J. A. Schneider, J. L. Bienias, D. A. Evans, and D. A. Bennett. 2002. “Participation in cognitively stimulating activities and risk of incident Alzheimer disease.” Journal of the American Medical Association 287: 742-748.
Winocur, G., J. Vardy, M. A. Binns, L. Kerr, and I. Tannock. 2006. “The effects of the anti-cancer drugs, methotrexate and 5-fluorouracil, on cognitive function in mice.” Pharmacology Biochemistry and Behavior 85(1): 66-75.
Wilson, R., K. R. Krueger, S. E. Arnold, J. A. Schneider, J. F. Kelly, L.L. Barnes, Y. Tang, and D. A. Bennett. 2007. “Loneliness and risk of Alzheimer disease.” Archives of General Psychiatry 64(2): 234-240.

41
Zhang, Z. 2006. “Gender differentials in cognitive impairment and decline of the oldest old in China.” The Journals of Gerontology Series B: Psychological Sciences and Social Sciences 61: 107-S115.

42
APPENDIX Figure A1 Education and number of words recalled.
Figure A2 Educational training during last month and number of words recalled.
43
Figure A3 Employment and number of words recalled.
Figure A4 Vigorous activities and number of words recalled.

44
Figure A5 Moderate activities and number of words recalled.
Figure A6 Being overweight (BMI ≥ 25) and number of words recalled.
45
Figure A7 Smoking and number of words recalled.
Figure A8 Drinking and number of words recalled.

46
Figure A9 Voluntary and charity work during last month and number of words recalled.
Figure A10 Help to family, friends and neighbours provided during last month and number of words recalled.
47
Figure A11 Participation in a sports or social club during last month and number of words recalled.
Figure A12 Participation in a religious organisation during last month and number of words recalled.

48
Figure A13 Participation in a political organisation during last month and number of words recalled.


