Social Determinants of Health and Diabetes Care
55
Social Determinants of Health and Diabetes Care UNIVERSITY OF NEBRASKA MEDICAL CENTER DIABETES SYMPOSIUM CYNTHIA HERRICK, MD, MPHS, FACP OCTOBER 15, 2021
Transcript of Social Determinants of Health and Diabetes Care

Social Determinants of
Health and Diabetes CareUNIVERSITY OF NEBRASKA MEDICAL CENTER DIABETES SYMPOSIUM
CYNTHIA HERRICK, MD, MPHS, FACP
OCTOBER 15, 2021

Financial Disclosures
Spouse consults for Merck and Eli Lilly.
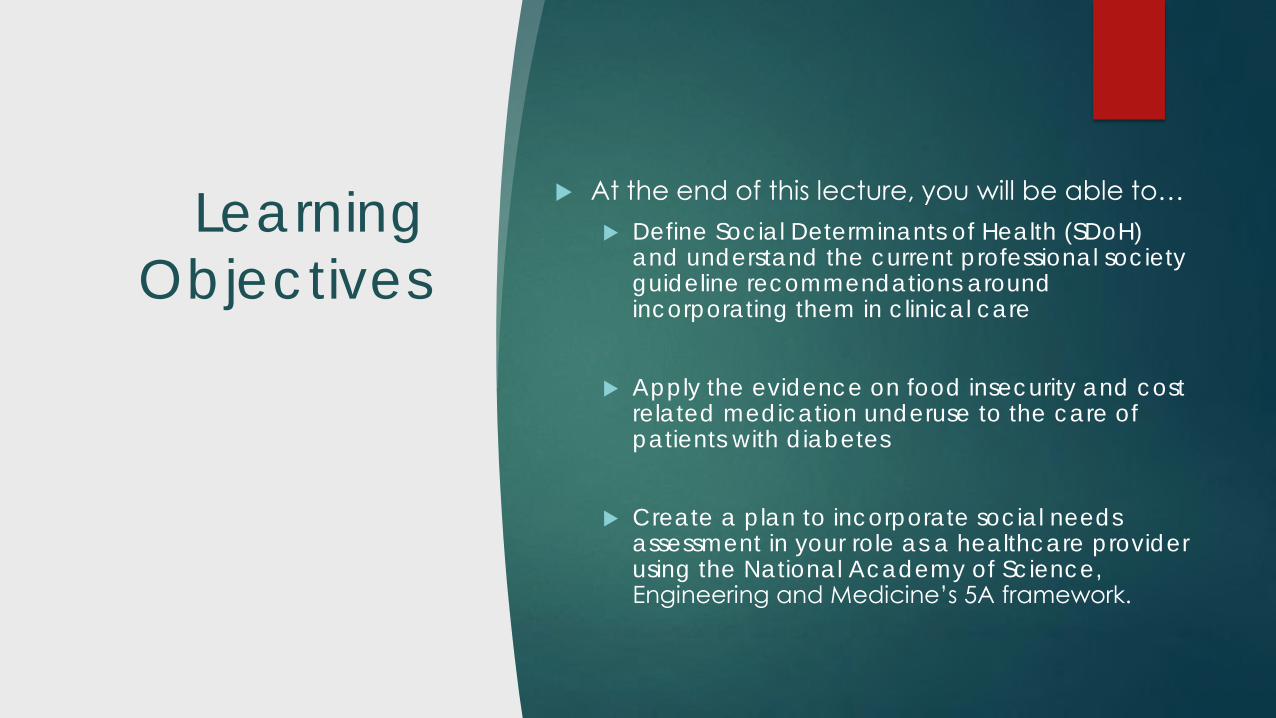
Learning
Objectives
At the end of this lecture, you will be able to…
Define Social Determinants of Health (SDoH) and understand the current professional society guideline recommendations around incorporating them in clinical care
Apply the evidence on food insecurity and cost related medication underuse to the care of patients with diabetes
Create a plan to incorporate social needs assessment in your role as a healthcare provider using the National Academy of Science, Engineering and Medicine’s 5A framework.

What are the Social Determinants
of Health?
Conditions in which people are
born, grow, live, work and age
Shaped by distribution of
Money, power, resources
Global, national and local
levels
Social need → health inequities
Healthy People 2020

https://www.barhii.org/barhii-framework

Professional Society Guidelines
ACP (2018)
Recommends increased screening and collection of social determinants
of health data to aid in health impact assessments and support
evidence-driven decision making
AAFP (2019):
Recommends knowing how patients are affected by SDoH and helping
address their needs to improve their health

Professional Society Guidelines
ADA (2019-2021):
Providers should assess food insecurity, housing instability, financial
barriers, social capital/social community support and apply to
treatment decisions.
Refer to local resources and incorporate self-management support from
lay health coaches, community health workers where possible.
ACC/AHA (2019):
Clinicians should evaluate the social determinants of health that affect
individuals to inform treatment decisions

Clinical Case
43 yo woman with class 3 obesity (BMI 50), Type 2
diabetes (A1C 11), hypertension, hyperlipidemia presents
for initial evaluation.
She has been uninsured since her last pregnancy 5
years ago.
She infrequently checks blood sugars but notes some
as high as 400s and others as low as 50.
She is on metformin and Humulin 70/30 that she is able
to get for $25 at Walmart.

Calorie and
carbohydrate
restricted diet
Physical
activity
Medication
management
Eye exams
Self-monitoring
of blood
glucose
Foot care
Outpatient
visits at least
2-4 times per
year
Sufficient income Safe employment
Health literacy/numeracyEducation Food security
Adequate housing
Health insurance
Poverty
Walkable neighborhoods
Structural Racism
ChildcareSocial support
Freedom from discrimination
Lack of environmental
exposuresSafe, convenient transportation

UpstreamUNDERSTANDING THE CONTEXT

All of these are inter-related and impact the patient’s health
Point of care intervention is less feasible, but they influence how a
person is able to manage their conditions
Socioeconomic status
Income, Education, Occupation
Social context
Structural racism, discrimination
Physical environment
Neighborhood, Housing

National Center for Chronic Disease Prevention and Health Promotion
Division of Diabetes Translation
Diabetes Indicator: Diagnosed Diabetes; Year: 2018
Disclaimer: This is a user-generated report. The findings and conclusions are those of the user and do not necessarily represent the views of the CDC.www.cdc.gov/diabetes/dataSource:
Percentage
SVI Theme: Overall SVI; SVI Variable: Overall SVI; Natural Breaks; Year: 2018Overall Social Vulnerability Index; Year: 2018

National Center for Chronic Disease Prevention and Health Promotion
Division of Diabetes Translation
Diabetes Indicator: Diagnosed Diabetes; Nebraska; Natural Breaks; Year: 2018
Disclaimer: This is a user-generated report. The findings and conclusions are those of the user and do not necessarily represent the views of the CDC.
www.cdc.gov/diabetes/dataSource:
Percentage
SVI Theme: Overall SVI; SVI Variable: Overall SVI; Natural Breaks; Year: 2018


SES interventions and Diabetes
Outcomes
No clear literature examining change in income,
education, employment on diabetes outcomes
No diabetes outcomes reported from interventions
targeting wage, early childhood
education/access/quality
Difficult studies to do, but these are the upstream factors
that require system level intervention
Hill-Briggs et al, Diabetes Care Nov 2020, https://doi.org/10.2337/dci20-0053

https://dsl.richmond.edu/panorama/redlining/#loc=12/38.635/-90.393&mapview=graded
https://www.cityhealthdashboard.com/ne/omaha/
Structural Racism and Chronic Disease
2018 City health Dashboard:
Omaha Diabetes Prevalence
1937 HOLC Map
A: Best, B: Desirable, C: Declining, D: Hazardous
2018 City health Dashboard:
Omaha Population Distribution

https://ncrc.org/holc-health/
Structural
Racism
and
Chronic
Disease

Housing/Built Environment and
Diabetes Outcomes Moving to Opportunity Study (HUD demonstration project)
4498 women with children, 5 cities, high poverty census tracts
Randomized to 1 of 3 arms
10 y f/u: Reduction in prevalence of diabetes by -4.3% (95% CI -8.5, -0.7) in arm moving to low poverty census tract
Systematic Reviews and Meta-analyses demonstrate
Areas with more green space had
lower incidence of diabetes [OR diabetes high v low greenspace 0.72 (0.61-0.85)]
Objectively measured walkability was associated with
Lower rates of obesity, diabetes and hypertension
https://www.huduser.gov/Publications/pdf/MTOFullReport.pdf
Twohig-Bennet and Jones, 2018 Env Res, 166, 628-637.
Chandrabose et al., 2019 Obesity Reviews, 20, 41-54.

Community level data don’t necessarily
predict individual level need
36,577 patients screened for social risks during a clinic visit in a community
health center 2016-2018
Majority from California, Massachusetts, Oregon
48% White, 30% Black, 23% Hispanic; 58% Female
Individual risk
derived from screening questions on food, housing, financial resource strain
Community level risk
defined by census tract social deprivation index using geocoded address data
Cottrell et al, JAMA Netw Open 2020; 3(10):e2016852

Overall, 30% of population screened positive for 1 or more social risks
Using community level SDI data as a ‘diagnostic test’ to predict
individual level social risk screen
Sensitivity: 60%
Specificity: 43%
Accuracy: 48%
High SDI Low SDI Total
Social risk screen + 6516 4342 10858
Social risk screen - 14681 11038 25719
21197 15380 36577
Cottrell et al, JAMA Netw Open 2020; 3(10):e2016852

DownstreamINTERVENTION AT THE POINT OF CARE

Easily screened in a clinical setting,
Have the potential to directly influence management,
Can provide a window to additional needs and an
opportunity for more immediate intervention
Food insecurity
Cost related medication underuse

Medical Care 57:S133-S139, June 2019.
70% of eligible patients screened
82% of screened patients with ICD10 code recorded
86% of patients requesting resources received referral guide

Food Insecurity

Food Insecurity Screening Tools
USDA Food security module (most commonly used in studies)
Versions: 18 (household), 10 (adult), 6 (short form) questions
10 item scale can be stratified as follows, according to positive answers
high food security(0),
marginal food security (1-2),
low food security (3-5),
very low food security (6-10)
6 item scale is a positive screen if answered 2 or more questions positively
Questions cover worry about food running out, food not lasting, inability
to afford balanced meals, frequency of skipped meals, eating less,
hunger, weight loss, frequency of not eating for a whole day
Food secure
Food insecure

Food Insecurity Screening Tools
The Hunger Vital Sign (derived from USDA food security module and
validated)
Most commonly used in clinical screening
Affirmative answer (often true or sometimes true) on one or both
statements can constitute a positive screen
97% sensitivity, 93% specificity, 93% accuracy
Gunderson et al., Public Health Nutrition, 2017, 20(8), 1367-71

Food insecurity and Diabetes
Several studies have examined relationship between
Food insecurity and risk for diabetes
Food insecurity and diabetes control

Food insecurity and risk for diabetes Cross sectional
NHANES 1999-2002
10 question USDA food security module
4423 [3088 food secure (0 + responses), 1005 mild food insecurity (1-5
+ responses), severe food insecurity (6-10 + responses)]
Seligman et al., J Gen Intern Med, 2007 Jul;22(7):1018-23.

Food insecurity and diabetes control
Cross sectional
NHANES 1999-2008
2557 adults with diabetes all income levels, 12.2% food insecure
In adjusted logistic regression model
Individuals with food insecurity were 50% more likely to have A1C >9%
aOR 1.53 (95% CI 1.07-2.19)
Of note, not having health insurance was among the strongest predictors of poor diabetes control
aOR 2.49 (95%CI 1.41-4.40) [ref: private]
Medicare, Medicaid and other public showed no difference v. private
insurance
Berkowitz et al., Diabetes Care, 2013, 36:3093-3099

Food insecurity and diabetes control Prospective cohort 2013-2016
391 individuals – random sample from primary care network
Evaluation of relative effect of individually reported food insecurity and community
level defined food access
21% reported food insecurity, 31% resided in area with low food access
Berkowitz et al, Diabetes Care 2018,
41: 1188-1195

Food insecurity and diabetes
control in low-income populations Cross-sectional survey and chart review
711 patients in Chicago, San Francisco safety net clinics (46% with food insecurity)
➢ 28% reported > 1 severe hypoglycemic event in the last year
➢ aOR of hypoglycemia (1.95, 95% CI 1.48-5.91)
➢ Adjusted for age, race, language, education, income, tobacco use, insulin, BMI, renal disease, monitoring, medication adherence, problem alcohol use, comorbidities, hypoglycemia knowledge
Seligman et al., Diabetes Care, 2012, 35: 233-238
Seligman et al., Arch Intern Med, 2011, 171:1204-1206.

407 patients in urban safety net setting 2013 (40.5% with food insecurity)
Cross-sectional
Food insecurity was associated with poor glucose control (A1C > 8.0%)
aOR 2.23 (1.22-4.10) AND significant interaction by SNAP participation
Role of SNAP in diabetes control among
low-income patients with food insecurity
Mayer et al, Public Health Nutrition 2015, 19: 1103-1111

Interventions addressing Food
Insecurity in Diabetes
SNAP incentives (policy level)
Programs incentivizing fruit/vegetable purchasing and disincentivizing SSB
purchases change buying behavior
No health outcome data yet
Produce Prescriptions (clinic level)
Patients screened in clinic and given monthly produce voucher for local grocery
Increase fruit and vegetable consumption
May not affect A1C, BMI, SBP
Olsho et al, Am J Clin Nutr,; 2016; 104:423-35
Xie et al, Public Health Nutr, 2021 24 (12): 3945-55

Interventions addressing Food
Insecurity in Diabetes
Food boxes + Recipes (food bank level)
Improvements in diabetes distress, food insecurity, food/supply tradeoffs
Variable effect on A1C
Medically tailored meals (food bank –clinic integration)
Small pilot demonstrating improvement in HEI score, less hypoglycemia,
less food insecurity, improved mental health
Ongoing RCT to examine A1C impact
Seligman et al, Health Affairs, 2015, 34:11
Seligman et al., AJPH, 2018, 108(9)pp. 1227-1234
Berkowitz et al. J Gen Intern Med. 2019 Mar;34(3):396-404.
https://clinicaltrials.gov/ct2/show/NCT04828785

Cost Related Medication Underuse

Cost Related Medication Underuse (CRMU)
(also described as Cost Related Nonadherence (CRN)
14-20% of adults with diabetes report delaying medication due to cost (may be >25% among those on insulin)
2013-2014 BRFSS, N=44,925 with diabetes
CRN: taking less medication than prescribed because of cost
Prevalence: 16.5% among US adults with diabetes
Most dominant factors contributing
<65: Health insurance, household income, general health
>65: Depression, household income, age
Hill Briggs, Diabetes Care, 2020, https://doi.org/10.2337/dci20-0053
Kang et al, Diabetes Res Clin Pract, 2018 143:24-33

Cost Coping
Strategies
Cohen and Cha NCHS Data Brief 2019 Aug; 349: 1-8

Impact of CRN in individuals with
chronic conditions
Among NHIS participants 2000-2014, CRN was associated with
higher all cause mortality across conditions
Diabetes aHR 1.18 (95%CI 1.1-1.3)
Cardiovascular disease aHR 1.15 (95%CI 1.1-1.2)
Hypertension aHR 1.22 (95% CI 1.2-1.3)
Van Alsten and Harris, Prev Chronic Dis 2020; 17:E151

Impact of CRMU/CRN in individuals
with chronic conditions Health and Retirement Survey 1998-2006
6353 individuals with at least one CVD (diabetes, CAD, CHF, stroke)
19.5% reported cutting back on medication because of cost
between 1998-2004
Heisler et al, Med Care. 2010 February ; 48(2): 87–94.

Predicted probability of
hospitalization in the next
survey wave controlling for:
A: respondent’s age, gender,
race, education, living
arrangement, and net worth
in 1998.
B: All A variables +
cardiovascular comorbidities,
indicator of having psychiatric
problems diagnosed and self-
reported health status in 1998.
Heisler et al, Med Care. 2010 February ; 48(2): 87–94.

Measures of Financial Strain and
Cost-related Medication Underuse
General Financial Strain Measure:
During the past 12 months, how often did it happen that you did not have enough money to buy food, clothes, or other things you needed?
Options: Never, not very often, fairly often, very often
Medication Specific Financial Strain:
In the past 12 months, did you use less medication than was prescribed because of cost?
Options: Yes, No

Financial Strain and CRN in Patients
with Diabetes
Retrospective cohort, n=7773 with 11,820 new scripts
Kaiser Permanente Northern California Diabetes Registry
Survey, administrative, and electronic health record data
5% general strain only, 6 % medication specific strain, 2% both
Lyles et al. Health Serv Res 2016 Apr;51(2):610-24

Lyles et al. Health Serv Res 2016 Apr;51(2):610-24

Tradeoffs Between Medication and
Basic Needs 270 individuals in St. Louis 2016-2017
Inclusion criteria:
Age 35-80
English speaking,
at least 1 chronic condition
At least 1 prescription medication
Recruited from FQHCs, local newspaper and tertiary care center
endocrine clinic
Analysis part of a larger mixed-methods study

30% of the sample had diabetes
80% non-Hispanic Black, mean comorbidities 4.5, mean age ~55
Individuals with diabetes were more likely than those without diabetes to have
ever talked with a healthcare professional about medication cost
66.7% v. 49.2% (p=0.008)
Filed for bankruptcy
38.3% v. 21.7% (p=0.005)
Asked for/received samples
51.9% v. 29.1% (p=0.001)
Herrick et al, J Gen Intern Med 2021 Sep;36(9):2867-2869.

Individuals with diabetes were more likely than those without diabetes to
Spend less on basic needs to pay for medications
58% v. 41% (p=0.01) despite being
more likely to be privately insured or on Medicare (40.7% v. 22.8%, p=0.003)
less likely to have lowest income (monthly <$800) (33.8% v. 51.3%, p=0.008)
Of those who spent less on basic needs, ~80% spent less on food/groceries
People with diabetes were 78% more likely to report cutting back on basic
needs to pay for medication
aOR 1.78 (95% CI 1.01-3.14)
Model adjusted for age, # other comorbidities, sex, race/ethnicity, and insurance
status
Herrick et al, J Gen Intern Med, 2021 Sep;36(9):2867-2869.

What happens with adherence and outcomes
when medications are fully covered? Study in US after MI in 5855 patients
Randomized to full coverage of post-MI med v. usual coverage
Median follow-up 394 days
Significant improvement in adherence in full coverage group (4-6%)
Significant reduction in
total fatal/nonfatal vascular events or revascularization [HR 0.89 (95%CI 0.80-0.99)]
first fatal/nonfatal vascular event [HR 0.86 (95% CI 0.74-0.99)]
Study in Ontario 786 primary care patients
Randomized to free distribution of essential meds v. usual care
12 month follow-up
Significant increase in % patients taking all medications [11.6% (95%CI 4.9,18.4)]
Significant decrease in systolic blood pressure [-7.2 mmHg (95%CI -11.7, -2.8)]
A1C not significantly different [-0.38 (95%CI -0.76, 0.00)]
Choudhry et al, N Engl J Med 2011; 365:2088-2097
Persaud et al, JAMA Intern Med, 2020, 180(1): 27-34

Adjustment Assistance
Alignment Advocacy
Awareness
Activities
focused
on
Individuals
Activities
focused
on
Communities
https://www.nationalacademies.org/our-work/integrating-social-needs-care-into-the-delivery-of-health-care-to-improve-the-nations-health

Clinical Case
43 yo woman with class 3 obesity (BMI 50), Type 2 diabetes (A1C 11),
hypertension, hyperlipidemia presents for initial evaluation
She has been uninsured since her last pregnancy 5 years ago
She infrequently checks blood sugars but notes some as high as 400s
and others as low as 50
She is on metformin and Humulin 70/30 that she is able to get for $25 at
Walmart

How can we
begin
addressing
social needs
in the clinic
setting?
Awareness
Develop clinic workflows that allow screening
with standard tools
Document using Z codes (Z55-Z65) – Z59* covers
housing/food/economic circumstances

How can we begin addressing social needs in the clinic setting?
Assistance
Refer to local community-based
organizations
Resources:
Social workers,
The EveryONE Project,
United Way 211
How can we begin addressing social needs in the clinic setting?
Adjustment
Consider social need when
defining a plan using shared
decision making with the patient

How can we begin addressing social needs in the community?
Alignment
Community based participatory
research
Cross-sector data sharing and
intervention
Medical education curricula
incorporating a social
determinants framework

How can we
begin
addressing
social needs
in the
community?
Advocacy
Medicaid expansion – recent MO example
SNAP expansion
Insulin price caps

Acknowledgments
Mentors:
Graham Colditz, MD, DrPH, Aimee James, PhD, MPH, Amy McQueen, PhD, Debra Haire-Joshu, PhD
Current and former trainees:
Oluwatobe Alawode, MS3, Laura Hollar, MD, Ritika Puri, MD, Katrina Han, MD
Statistician: Sarah Humble, MS
Coordinator: Roxann Williams, MPH
Funding:
K23HD096204 (PI: Herrick)
R01MD010445 (PI: James)
T32DK007120 (PI: Semenkovich – funding student work)