Social Democratic Capitalism - WordPress.com...2017/11/10 · Social democratic capitalism 1....
138
Social Democratic Capitalism Lane Kenworthy 2017.11.10 thegoodsociety.net
Transcript of Social Democratic Capitalism - WordPress.com...2017/11/10 · Social democratic capitalism 1....

Social Democratic Capitalism
Lane Kenworthy
2017.11.10 thegoodsociety.net
What institutions and policies are most conducive to human flourishing in an affluent democratic society?
My answer: capitalism + big welfare state + high employment

My prior research has looked at some key pieces of this puzzle


I'm revisiting my earlier analyses and adding a host of additional outcomes
The good society
Community Freedom Democracy Good government Economic equality Happiness Economic opportunity Health Economic prosperity Housing Economic security Inclusion Economic stability Information Education Law and order Employment Openness and support Environment for other countries Family Privacy Finance Safety

thegoodsociety.net
What is social democratic capitalism?

Social democratic capitalism
1. Capitalism: private ownership, markets
2. Expansive, generous public insurance (big welfare state)
3. Employment-oriented public services: early education, affordable college, retraining, job placement assistance, individualized monitoring and support, lifelong learning
4. Modest regulation of product and labor markets
Social democratic capitalism
The best exemplars are the Nordic countries, especially Denmark and Sweden

Social democratic capitalism
AslAusBel
Can
Fr
GerIre
ItJaKor
NthNZ
PorSpSwi
UK
US
Den
FinNor
Swe
0
5%Em
ploy
men
t-orie
nted
pub
lic s
ervi
ces
11 28%Public insurance (expenditures)
Public insurance: public social expenditures as a share of GDP, adjusted for the size of the elderly population and the unemployment rate. 2000-2010. Data source: OECD. Employment-oriented public services: public expenditures on active labor market policy and family (early education, paid parental leave, child allowances and tax credits) as a share of GDP. 2000-2010. Data source: OECD. "Asl" is Australia; "Aus" is Austria.

Social democratic capitalism
Asl
Aus
Bel
Can
Fr
GerIre
It
Ja
Kor
Nth
NZ
Por
Sp
Swi
UKUS
Den
FinNor
Swe
68
87Ea
se o
f doi
ng b
usin
ess
11 28%Public insurance (expenditures)
Public insurance: public social expenditures as a share of GDP, adjusted for the size of the elderly population and the unemployment rate. 2000-2010. Data source: OECD. Ease of doing business: average score on ease of starting a business, dealing with construction permits, getting electricity, registering property, paying taxes, trading across borders, getting credit, protecting minority investors, enforcing contracts, resolving insolvency, and flexibly employing labor. 2014. Data source: World Bank Group. "Asl" is Australia; "Aus" is Austria.

Social democratic capitalism
Asl
Aus
Bel
Can
Fr
Ger Ire
It
Ja
Kor
Nth
NZ
Por
Sp
Swi
UKUS
Den
FinNor
Swe
68
87Ea
se o
f doi
ng b
usin
ess
0 5%Employment-oriented public services
Ease of doing business: average score on ease of starting a business, dealing with construction permits, getting electricity, registering property, paying taxes, trading across borders, getting credit, protecting minority investors, enforcing contracts, resolving insolvency, and flexibly employing labor. 2014. Data source: World Bank Group. Employment-oriented public services: public expenditures on active labor market policy and family (early education, paid parental leave, child allowances) as a share of GDP. 2000-2010. Data source: OECD. "Asl" is Australia; "Aus" is Austria.

Social democratic capitalism
51
87%Em
ploy
men
t rat
e
9 28%Public insurance
1980-2015. Solid red lines: Denmark and Sweden. Dashed red lines: Finland and Norway. The lines are loess curves. Public insurance: public social expenditures as a share of GDP, adjusted for the size of the elderly population and the unemployment rate. Data source: OECD. Employment rate: Employed persons as a share of all persons. Age 25-64. Data source: OECD. "Asl" is Australia; "Aus" is Austria.

Social democratic capitalism
Expenditures aren't an ideal indicator of the expansiveness and generosity of public insurance programs
The best alternative uses replacement rates for public insurance programs aimed at risks during childhood, working age, and old age
It too has drawbacks
It includes only transfers, not services
Data not available for Kor, Por, Sp

Social democratic capitalism
AslAusBel
Can
Fr
GerIre
ItJa
NthNZ
Swi
UK
US
Den
FinNor
Swe
0
5%Em
ploy
men
t-orie
nted
pub
lic s
ervi
ces
30 89%Public insurance (replacement rate)
Public insurance: average replacement rate for public insurance programs aimed at risks during childhood, working age, and old age. 2000-2010. Data source: Simon Birnbaum et al, The Generational Social Contract, using data from the Social Policy Indicators (SPIN) database. Employment-oriented public services: public expenditures on active labor market policy and family (early education, paid parental leave, child allowances and tax credits) as a share of GDP. 2000-2010. Data source: OECD. "Asl" is Australia; "Aus" is Austria.
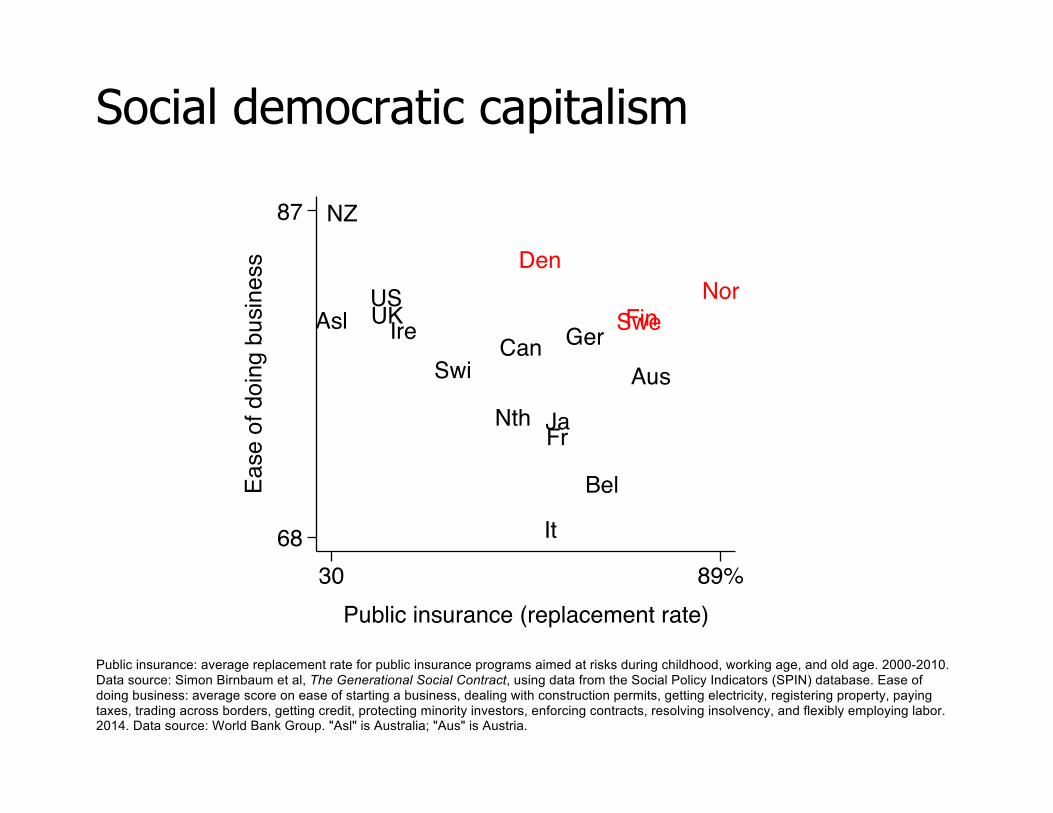
Social democratic capitalism
Asl
Aus
Bel
Can
Fr
GerIre
It
JaNth
NZ
Swi
UKUS
Den
FinNor
Swe
68
87Ea
se o
f doi
ng b
usin
ess
30 89%Public insurance (replacement rate)
Public insurance: average replacement rate for public insurance programs aimed at risks during childhood, working age, and old age. 2000-2010. Data source: Simon Birnbaum et al, The Generational Social Contract, using data from the Social Policy Indicators (SPIN) database. Ease of doing business: average score on ease of starting a business, dealing with construction permits, getting electricity, registering property, paying taxes, trading across borders, getting credit, protecting minority investors, enforcing contracts, resolving insolvency, and flexibly employing labor. 2014. Data source: World Bank Group. "Asl" is Australia; "Aus" is Austria.

My analytical strategy

My analytical strategy
Data: country-level
Preferred test: difference in differences
But data for many outcomes don't go back very far in time, and much of the change in public insurance generosity occurred in the 1960s and 1970s
So I use second-best analytical strategies
Comparison across countries at a single point in time
Comparison over time in individual countries

Economic security

Economic security
Decent income and living-standards floor
Protection against large income declines and large unexpected expenses
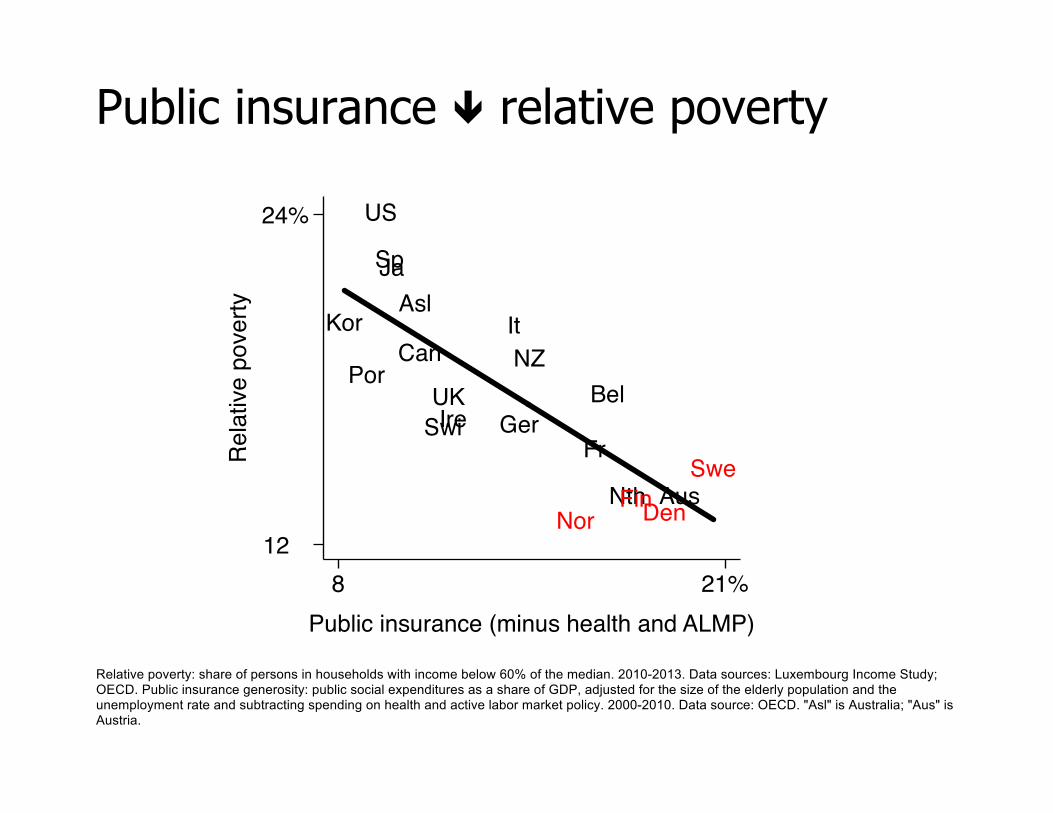
Public insurance ê relative poverty
Asl
Aus
BelCan
FrGerIre
It
Ja
Kor
Nth
NZPor
Sp
SwiUK
US
DenFinNor
Swe
12
24%R
elat
ive
pove
rty
8 21%Public insurance (minus health and ALMP)
Relative poverty: share of persons in households with income below 60% of the median. 2010-2013. Data sources: Luxembourg Income Study; OECD. Public insurance generosity: public social expenditures as a share of GDP, adjusted for the size of the elderly population and the unemployment rate and subtracting spending on health and active labor market policy. 2000-2010. Data source: OECD. "Asl" is Australia; "Aus" is Austria.
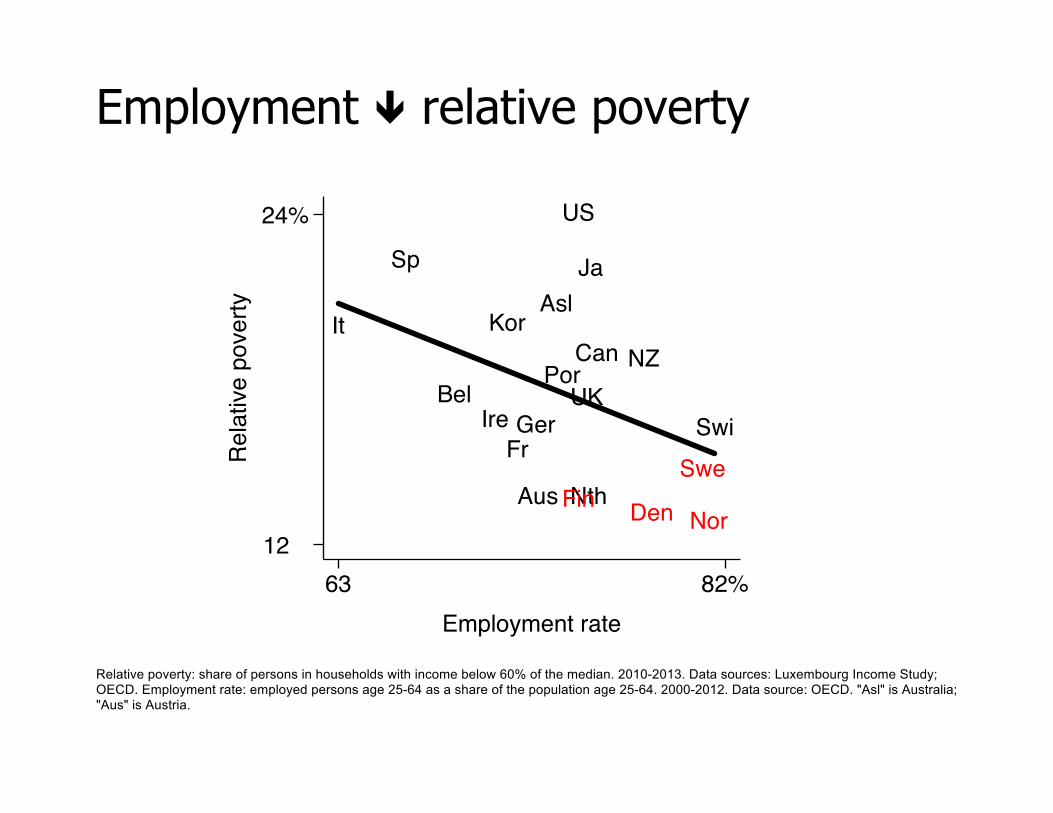
Employment ê relative poverty
Asl
Aus
BelCan
FrGerIre
It
Ja
Kor
Nth
NZPor
Sp
SwiUK
US
DenFinNor
Swe
12
24%R
elat
ive
pove
rty
63 82%Employment rate
Relative poverty: share of persons in households with income below 60% of the median. 2010-2013. Data sources: Luxembourg Income Study; OECD. Employment rate: employed persons age 25-64 as a share of the population age 25-64. 2000-2012. Data source: OECD. "Asl" is Australia; "Aus" is Austria.

Public insurance ê material hardship
Asl
Aus
Bel FrGerIre
It
Ja
Nth
Por
Sp
UK
US
DenFinNor Swe5
19%M
ater
ial d
epriv
atio
n
16 28%Public insurance
Material deprivation: share of households experiencing one or more of the following: arrears in mortgage or rent payment, arrears in payment of utility bills, inability to adequately heat home, constrained food choices, overcrowding, poor environmental conditions (e.g., noise, pollution), difficulty in making ends meet. 2005. Public insurance generosity: public social expenditures as a share of GDP, adjusted for the size of the elderly population and the unemployment rate. 2000-2010. Data source: OECD. "Asl" is Australia; "Aus" is Austria.

Employment ê material hardship
Asl
Aus
Bel FrGer Ire
It
Ja
Nth
Por
Sp
UK
US
DenFin NorSwe5
19%M
ater
ial d
epriv
atio
n
62 81%Employment rate
Material deprivation: share of households experiencing one or more of the following: arrears in mortgage or rent payment, arrears in payment of utility bills, inability to adequately heat home, constrained food choices, overcrowding, poor environmental conditions (e.g., noise, pollution), difficulty in making ends meet. 2005. Data source: OECD. Employment rate: employed persons age 25-64 as a share of the population age 25-64. 2000-2007. Data source: OECD. "Asl" is Australia; "Aus" is Austria.
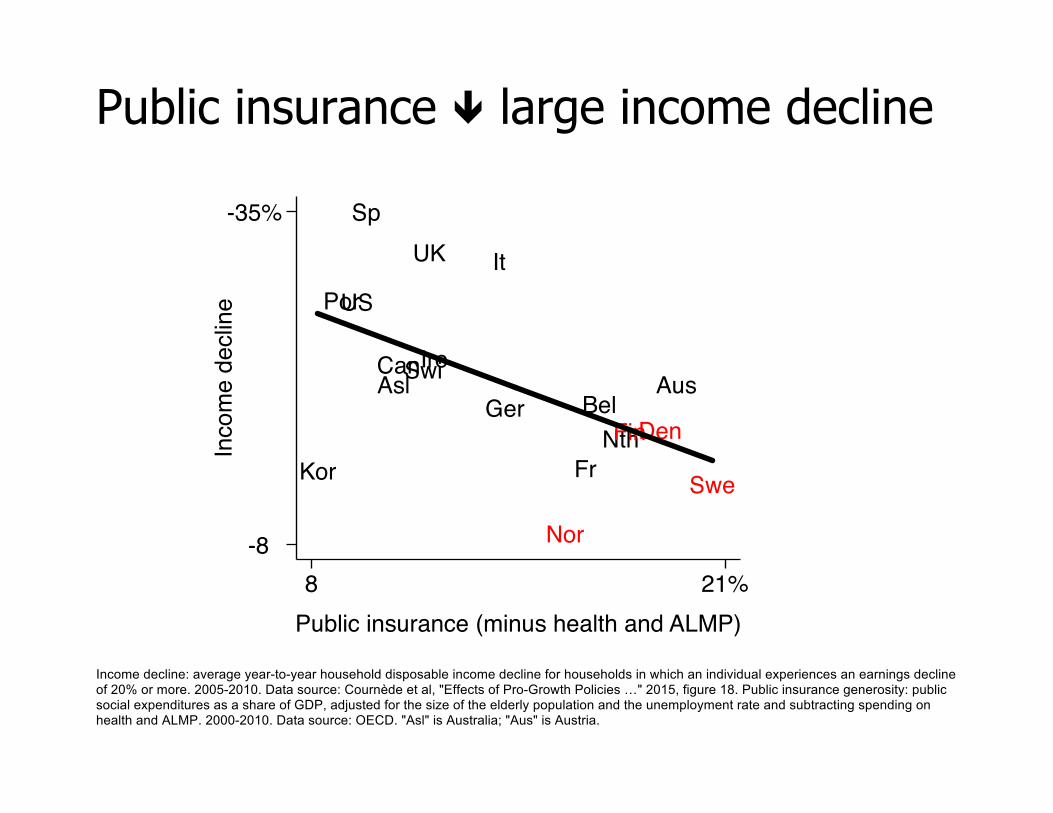
Public insurance ê large income decline
Asl AusBel
Can
Fr
Ger
Ire
It
KorNth
Por
Sp
Swi
UK
US
DenFin
Nor
Swe
-8
-35%In
com
e de
clin
e
8 21%Public insurance (minus health and ALMP)
Income decline: average year-to-year household disposable income decline for households in which an individual experiences an earnings decline of 20% or more. 2005-2010. Data source: Cournède et al, "Effects of Pro-Growth Policies …" 2015, figure 18. Public insurance generosity: public social expenditures as a share of GDP, adjusted for the size of the elderly population and the unemployment rate and subtracting spending on health and ALMP. 2000-2010. Data source: OECD. "Asl" is Australia; "Aus" is Austria.

Employment ê large income decline
AslAusBel
Can
Fr
Ger
Ire
It
KorNth
Por
Sp
Swi
UK
US
DenFin
Nor
Swe
-8
-35%In
com
e de
clin
e
62 81%Employment rate
Income decline: average year-to-year household disposable income decline for households in which an individual experiences an earnings decline of 20% or more. 2005-2010. Data source: Cournède et al, "Effects of Pro-Growth Policies …" 2015, figure 18. Employment rate: employed persons age 25-64 as a share of the population age 25-64. 2000-2007. Data source: OECD. "Asl" is Australia; "Aus" is Austria.

Equality of opportunity

Early educ é intergenerational mobility
AslCan
Fr
Ger
It
UK
US
Den
FinNor Swe
.1
.5
Inte
rgen
erat
iona
l mob
ility
0 1.5%Early education expenditures
Intergenerational mobility: correlation between the earnings of parents and those of their children, with axis values reversed. Data source: John Ermisch et al, eds., From Parents to Children, Russell Sage Foundation, 2012, figure 1.1. Early education expenditures: share of GDP. 1980-95. Data source: OECD, Social Expenditures Database. "Asl" is Australia.

Social democratic capitalism seems to be superior at producing an "expanded
Rawlsian" result
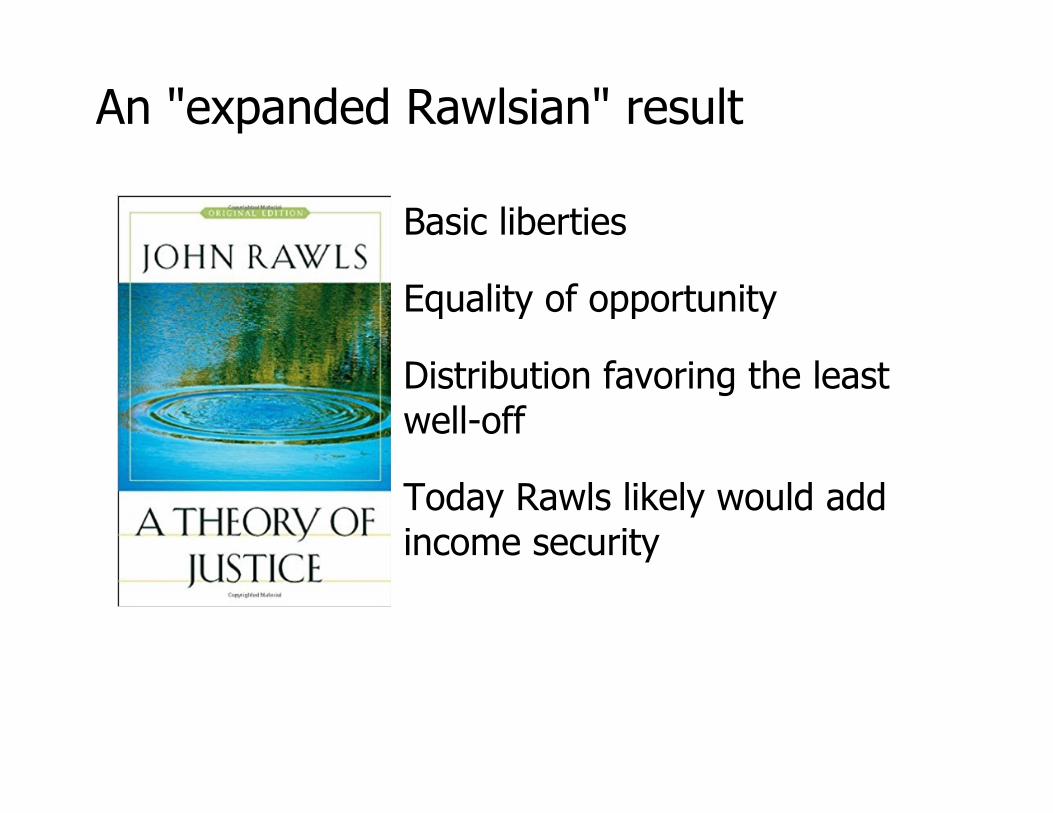
An "expanded Rawlsian" result
Basic liberties
Equality of opportunity
Distribution favoring the least well-off
Today Rawls likely would add income security

Tradeoffs?

We want more than "expanded Rawls"
Community Freedom Democracy Good government Economic equality Happiness Economic opportunity Health Economic prosperity Housing Economic security Inclusion Economic stability Information Education Law and order Employment Openness and support Environment for other countries Family Privacy Finance Safety

Tradeoffs?
Here I will use the Nordic countries as stand-ins for social democratic capitalism
I'll compare across countries, rather than look at associations between variables

Services and fairness instead of income
Rich and upper-middle-class households forgo cash income in favor of
Services for themselves: early education, free college, retraining, job placement
Fairness: higher wages and more transfers and services for the least well-off

Services and fairness instead of income
P75 household income
US
Swi, Nor, Asl, Can
Den, Aus, Ja, Ger, NthUK, Fin, Ire, FrKor, BelSwe, It, Sp
0
48
$80k
1960 70 80 90 2000 10Year
Posttransfer-posttax household income. The incomes are adjusted for household size and then rescaled to reflect a three-person household, adjusted for inflation, and converted to US dollars using purchasing power parities. "k" = thousand. The lines are loess curves. Data sources: Luxembourg Income Study; OECD. "Asl" is Australia; "Aus" is Austria.

Freedom
Personal freedom
DenAus, Nor, Nth, GerFin, Swi, SweIre, Asl, UK, Bel, CanPorIt, NZ
Fr, USJaKor, Sp
8
10
1960 70 80 90 2000 10Year
Average score for legal protection, security, freedom of movement, freedom of religion, freedom of association/assembly/civil society, freedom of expression, and freedom in relationships. Scale is 0 to 10. The vertical axis doesn't begin at zero. Data source: Ian Vasquez and Tanja Porcnik, The Human Freedom Index, Cato Institute. "Asl" is Australia; "Aus" is Austria.

Freedom
Perceived freedom to make life choices
Nor, Fin, DenSwi, NZ, Asl, SweCan, NthAus, Ire, Ger, BelPor, Ja, UKFrSp, US
It, Kor
50
100%
1960 70 80 90 2000 10Year
Share responding "satisfied" to the question "Are you satisfied or dissatisfied with your freedom to choose what you do with your life?" The vertical axis doesn't begin at zero. Data source: Gallup World Poll, via the World Happiness Report 2017, online appendix. "Asl" is Australia; "Aus" is Austria.

Freedom
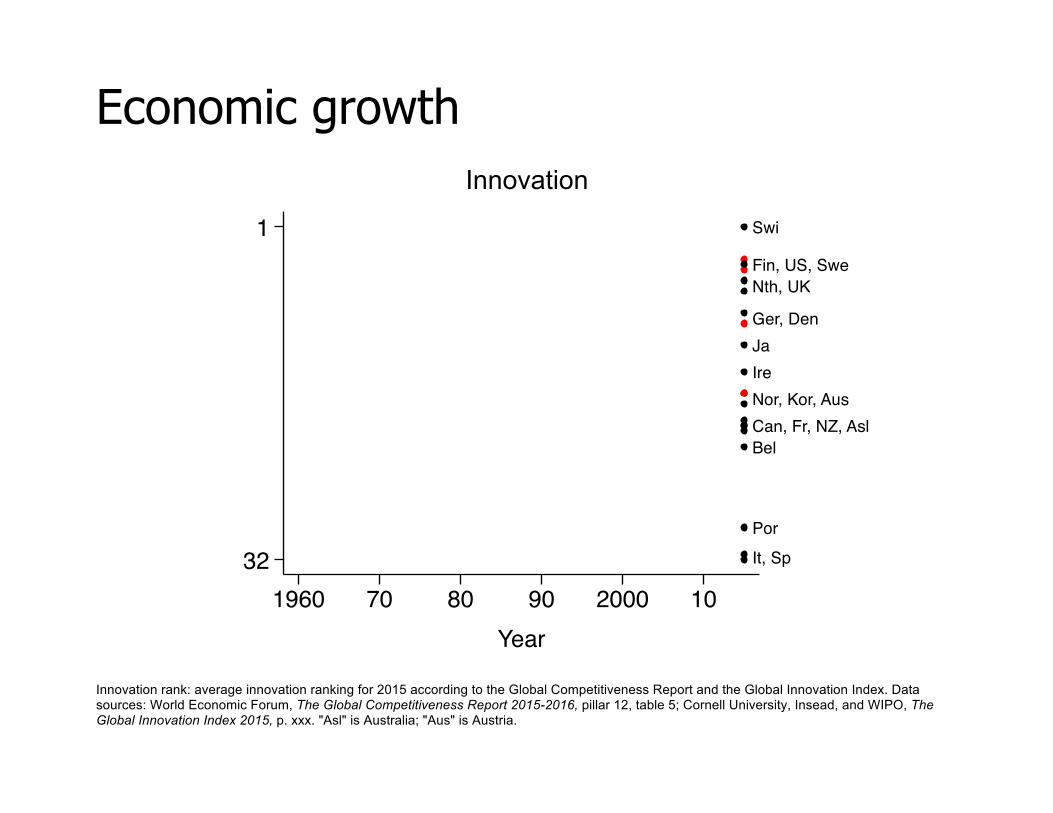
Economic growth
Innovation
Swi
Fin, US, SweNth, UK
Ger, DenJaIreNor, Kor, AusCan, Fr, NZ, AslBel
PorIt, Sp
1
321960 70 80 90 2000 10
Year
Innovation rank: average innovation ranking for 2015 according to the Global Competitiveness Report and the Global Innovation Index. Data sources: World Economic Forum, The Global Competitiveness Report 2015-2016, pillar 12, table 5; Cornell University, Insead, and WIPO, The Global Innovation Index 2015, p. xxx. "Asl" is Australia; "Aus" is Austria.

Economic growth
GDP per capita (log)
NorSwi, USIre, Nth, Asl, SweAus, Ger, Can, DenBel, UK, Fin, FrJa, NZIt, Sp
Por
15
30
$60k
1960 70 80 90 2000 10Year
Adjusted for inflation and converted to US dollars using purchasing power parities. The vertical axis doesn't begin at zero. Data source: OECD. "Asl" is Australia; "Aus" is Austria.
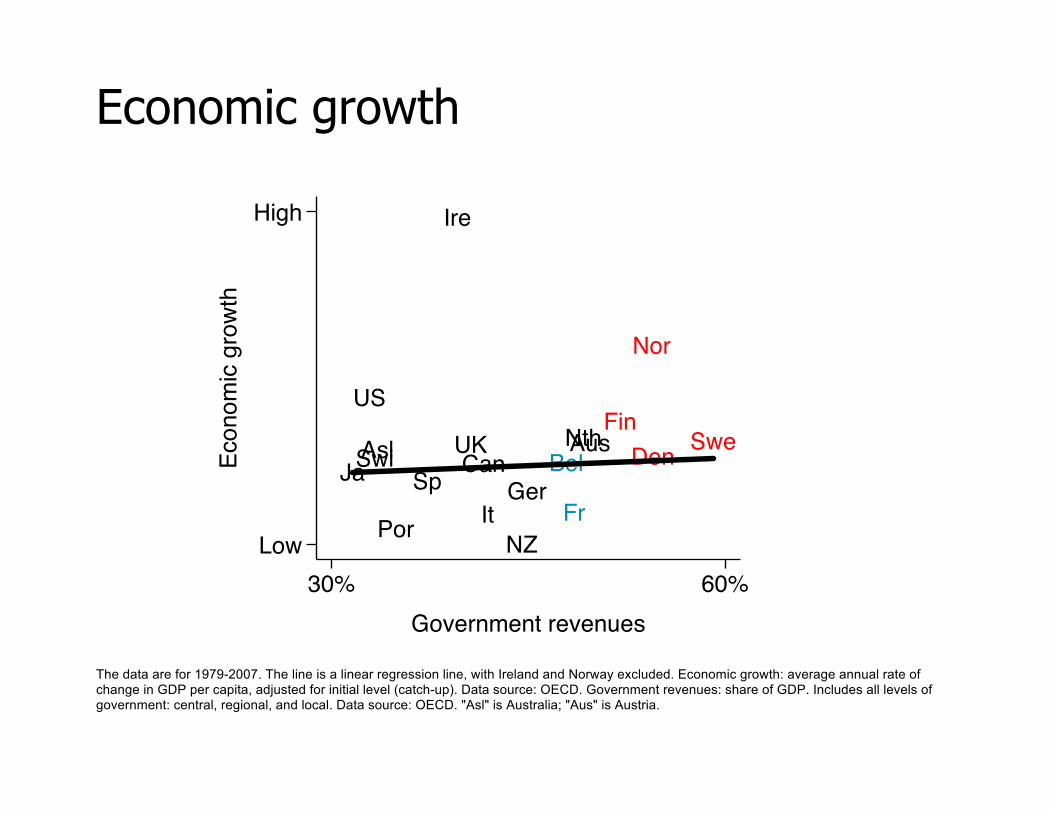
Economic growth
Asl AusCan
Ger
Ire
ItJa
Nth
NZPor
SpSwi UK
US
DenFin
Nor
SweBel
FrLow
HighEc
onom
ic g
row
th
30% 60%Government revenues
The data are for 1979-2007. The line is a linear regression line, with Ireland and Norway excluded. Economic growth: average annual rate of change in GDP per capita, adjusted for initial level (catch-up). Data source: OECD. Government revenues: share of GDP. Includes all levels of government: central, regional, and local. Data source: OECD. "Asl" is Australia; "Aus" is Austria.

Economic growth
Denmark
Government revenues: share of GDP. Includes all levels of government: federal, state, and local. The line is a loess curve. Data sources: for 1960-2007, OECD; for 1913-60, Vito Tanzi, Government versus Markets, Cambridge University Press, 2011, pp. 9, 92 (with a minor adjustment). GDP per capita: natural log of inflation-adjusted GDP per capita. A log scale is used to focus on rates of change. The vertical axis does not begin at zero. The line is a linear regression line; it represents a constant rate of economic growth. Data source: Angus Maddison, "Statistics on World Population, GDP, and Per Capita GDP," ggdc.net/maddison/oriindex.htm.
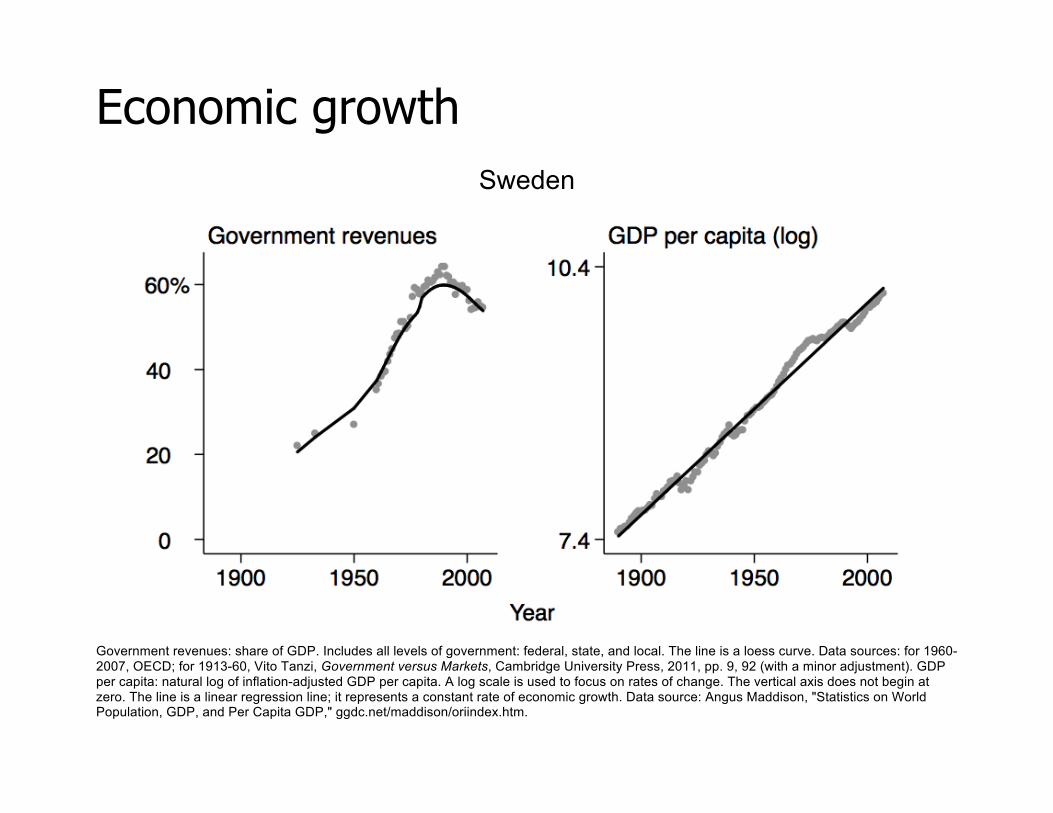
Economic growth
Sweden
Government revenues: share of GDP. Includes all levels of government: federal, state, and local. The line is a loess curve. Data sources: for 1960-2007, OECD; for 1913-60, Vito Tanzi, Government versus Markets, Cambridge University Press, 2011, pp. 9, 92 (with a minor adjustment). GDP per capita: natural log of inflation-adjusted GDP per capita. A log scale is used to focus on rates of change. The vertical axis does not begin at zero. The line is a linear regression line; it represents a constant rate of economic growth. Data source: Angus Maddison, "Statistics on World Population, GDP, and Per Capita GDP," ggdc.net/maddison/oriindex.htm.

Economic growth
United States
Government revenues: share of GDP. Includes all levels of government: federal, state, and local. The line is a loess curve. Data sources: for 1960-2007, OECD; for 1946-55, Economic Report of the President, 2011, tables B-79, B-86; for 1913-25, Vito Tanzi, Government versus Markets, Cambridge University Press, 2011, pp. 9, 92 (with a minor adjustment). GDP per capita: natural log of inflation-adjusted GDP per capita. A log scale is used to focus on rates of change. The vertical axis does not begin at zero. The line is a linear regression line; it represents a constant rate of economic growth. Data source: Angus Maddison, "Statistics on World Population, GDP, and Per Capita GDP," ggdc.net/maddison/oriindex.htm.
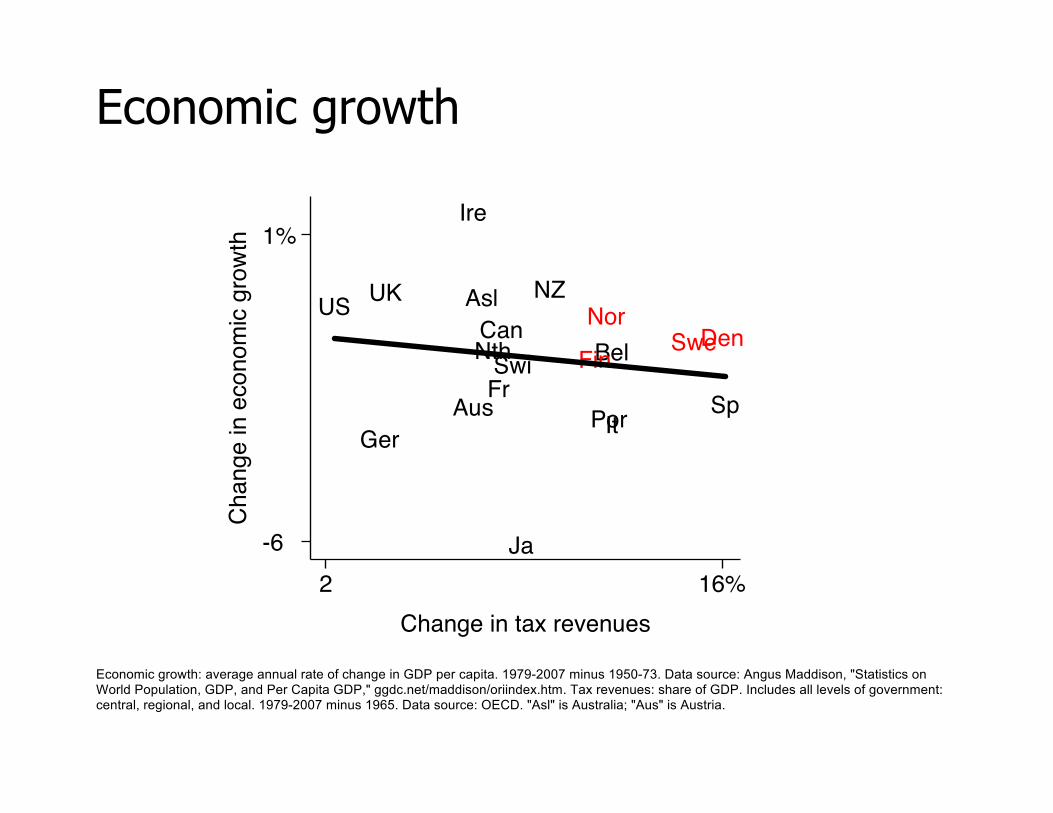
Economic growth
Asl
Aus
BelCan
Fr
Ger
Ire
It
Ja
Nth
NZ
Por SpSwi
UKUSDen
Fin
NorSwe
-6
1%C
hang
e in
eco
nom
ic g
row
th
2 16%Change in tax revenues
Economic growth: average annual rate of change in GDP per capita. 1979-2007 minus 1950-73. Data source: Angus Maddison, "Statistics on World Population, GDP, and Per Capita GDP," ggdc.net/maddison/oriindex.htm. Tax revenues: share of GDP. Includes all levels of government: central, regional, and local. 1979-2007 minus 1965. Data source: OECD. "Asl" is Australia; "Aus" is Austria.

Economic growth
Is social democratic capitalism better for economic growth?
Encourages entrepreneurship
Facilitates employment by women and those from less-advantaged backgrounds
Allows unemployed workers more time to reskill and choose a productive job
Limits income inequality
But I don't see support for this hypothesis in the cross-country or over-time data

Employment
Employment rate
Swe, SwiNZ, Nor, Ja, GerDen, UK, NthCan, Asl, Aus, FinUS, Kor, Por, FrIre, Bel
SpIt
50
64
84%
1960 70 80 90 2000 10Year
Employed persons as a share of all persons. Age 25-64. The vertical axis doesn't begin at zero. Data source: OECD. "Asl" is Australia; "Aus" is Austria.
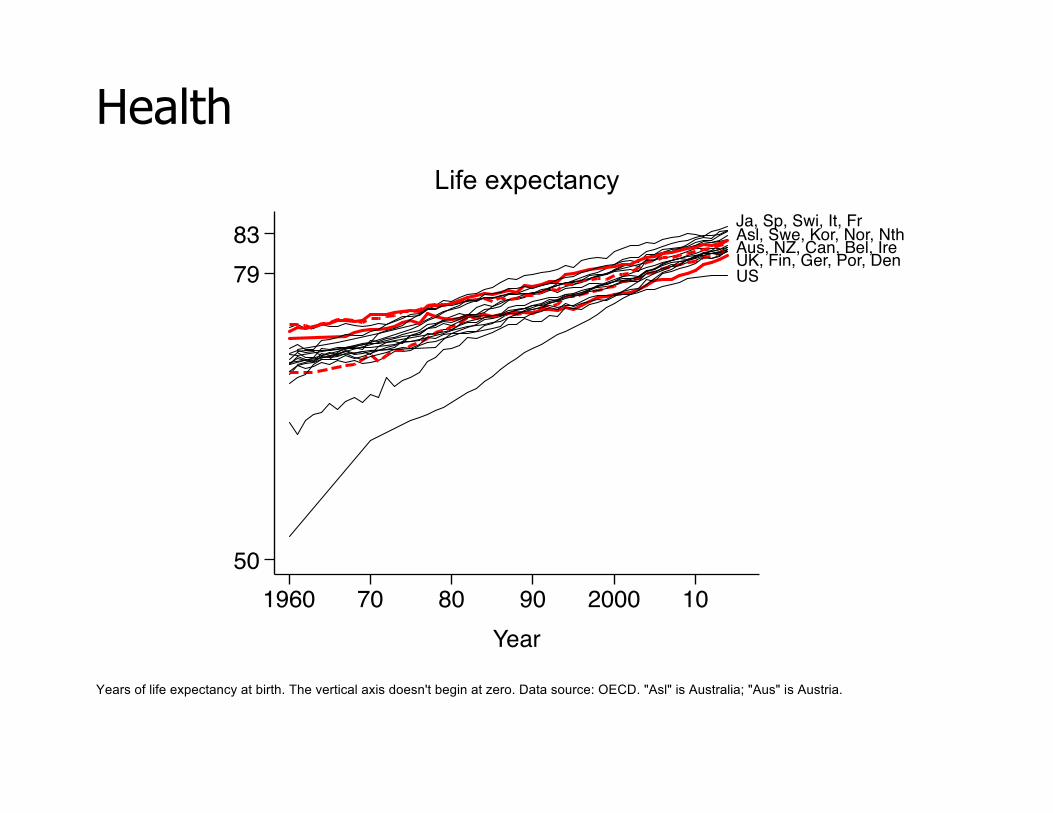
Health
Life expectancy Ja, Sp, Swi, It, FrAsl, Swe, Kor, Nor, NthAus, NZ, Can, Bel, IreUK, Fin, Ger, Por, DenUS
50
7983
1960 70 80 90 2000 10Year
Years of life expectancy at birth. The vertical axis doesn't begin at zero. Data source: OECD. "Asl" is Australia; "Aus" is Austria.

Health
Healthy life expectancy SweNor
UK, IreSwiBel, Sp, FrItDenNthAusFinPor, Ger
50
58
70
1960 70 80 90 2000 10Year
Expected years of life without limitations on usual activities. At birth. The vertical axis doesn't begin at zero. Data source: OECD, Health at a Glance: Europe, 2012. "Aus" is Austria.

Education
PISA scores, 15-year-olds
JaCan, FinKor
Ire, Ger, Nth, Swi, NZDen, Nor, Bel, AslUK, Por, Swe, FrAus, SpUS, It485
530
1960 70 80 90 2000 10Year
Average student score on PISA reading, math, and science tests. 15-year-olds. The PISA tests ask students to solve problems they haven’t seen before, to identify patterns that aren't obvious, and to make compelling written arguments. The vertical axis doesn't begin at zero. Data source: OECD. "Asl" is Australia; "Aus" is Austria.

Education
College degree
US
NorNth, UKKor, FinDen, Asl
NZ, JaSwe, Can, IreSwi, PorFr, SpBel, ItAusGer
0
20
40%
1960 70 80 90 2000 10Year
Ages 25 to 34. Bachelor's (or bachelor's equivalent) or more. Data sources: National Center for Education Statistics, Digest of Education Statistics, table 603.30, using OECD data; OECD, Education at a Glance 2015, table A1.3a, p. 41. "Asl" is Australia; "Aus" is Austria.

Safety
Homicides
US
Fin, NZ, CanPor, Asl, Bel, Nth, Swe, UKFr, Den, Ire, It, Nor, SpGer, Aus, Swi, Ja0
5
10
1960 70 80 90 2000 10Year
Homicides per 100,000 population. Data source: OECD. "Asl" is Australia; "Aus" is Austria.
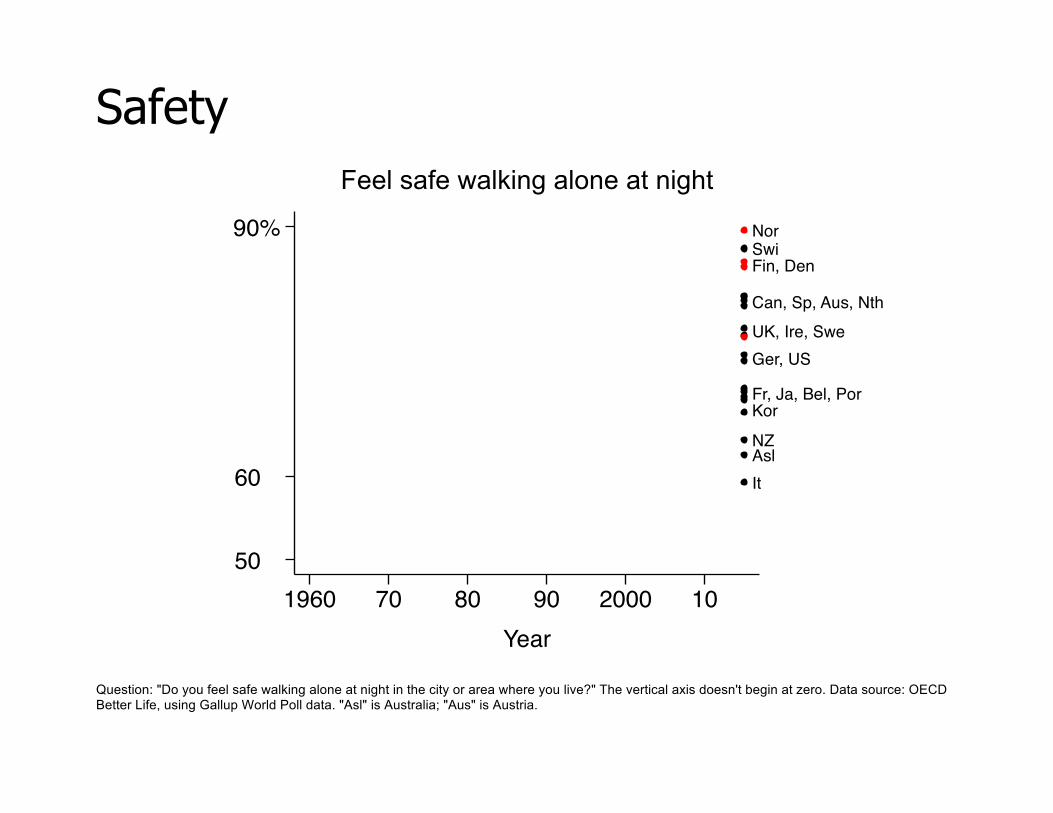
Safety
Feel safe walking alone at night
NorSwiFin, Den
Can, Sp, Aus, NthUK, Ire, SweGer, US
Fr, Ja, Bel, PorKor
NZAslIt
50
60
90%
1960 70 80 90 2000 10Year
Question: "Do you feel safe walking alone at night in the city or area where you live?" The vertical axis doesn't begin at zero. Data source: OECD Better Life, using Gallup World Poll data. "Asl" is Australia; "Aus" is Austria.

Shared prosperity
Median household income
Nor, Swi
USAsl, Can, AusDen, Swe, FinGer, Bel, Nth, FrKorJa, Ire, It, UK
Sp
Por
0
23
$58k
1960 70 80 90 2000 10Year
Posttransfer-posttax household income. The incomes are adjusted for household size and then rescaled to reflect a three-person household, adjusted for inflation, and converted to US dollars using purchasing power parities. "k" = thousand. The lines are loess curves. Data sources: Luxembourg Income Study; OECD. "Asl" is Australia; "Aus" is Austria.
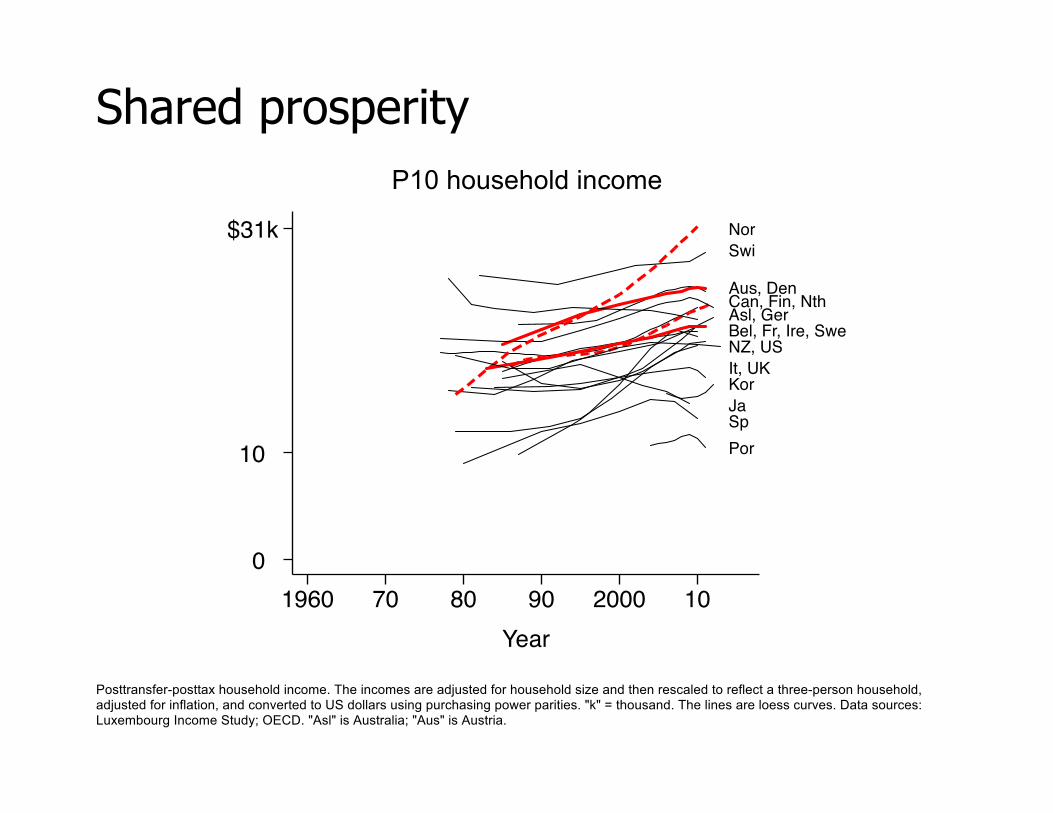
Shared prosperity
P10 household income
NorSwi
Aus, DenCan, Fin, NthAsl, GerBel, Fr, Ire, SweNZ, USIt, UKKorJaSpPor
0
10
$31k
1960 70 80 90 2000 10Year
Posttransfer-posttax household income. The incomes are adjusted for household size and then rescaled to reflect a three-person household, adjusted for inflation, and converted to US dollars using purchasing power parities. "k" = thousand. The lines are loess curves. Data sources: Luxembourg Income Study; OECD. "Asl" is Australia; "Aus" is Austria.

Income inequality
Top 1%'s income share
US
UK, CanGerKorIre, Swi, JaPor, It, Asl, NZ, SpSwe, Fr, Nor, FinDen, Nth
0
6
22%
1960 70 80 90 2000 10Year
Pretax income. Excludes capital gains. Data source: World Wealth and Income Database. "Asl" is Australia.

Wealth inequality
Top 1%'s wealth share
US
Ger, Aus, NthPor
Nor, Fr, UKCan Sp, ItAsl, Bel, Fin
0
12
37%
1960 70 80 90 2000 10Year
Wealth = assets minus liabilities. Data source: OECD. "Asl" is Australia; "Aus" is Austria.
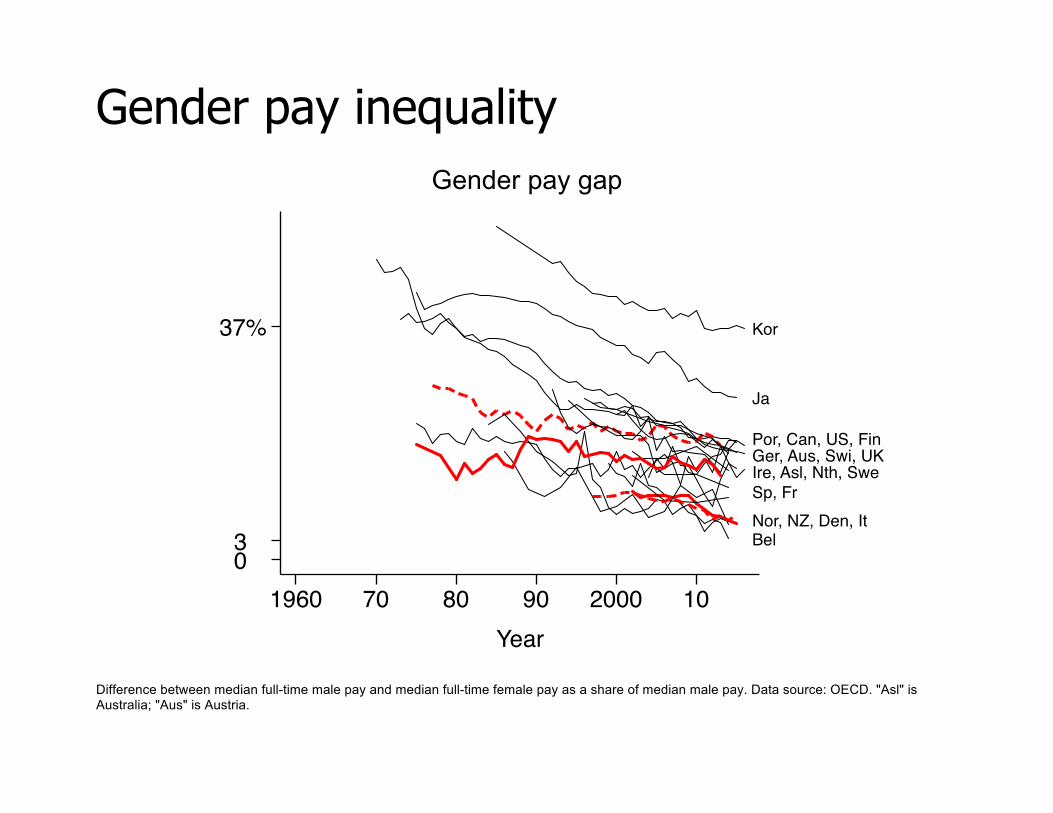
Gender pay inequality
Gender pay gap
Kor
Ja
Por, Can, US, FinGer, Aus, Swi, UKIre, Asl, Nth, SweSp, FrNor, NZ, Den, ItBel
0 3
37%
1960 70 80 90 2000 10Year
Difference between median full-time male pay and median full-time female pay as a share of median male pay. Data source: OECD. "Asl" is Australia; "Aus" is Austria.
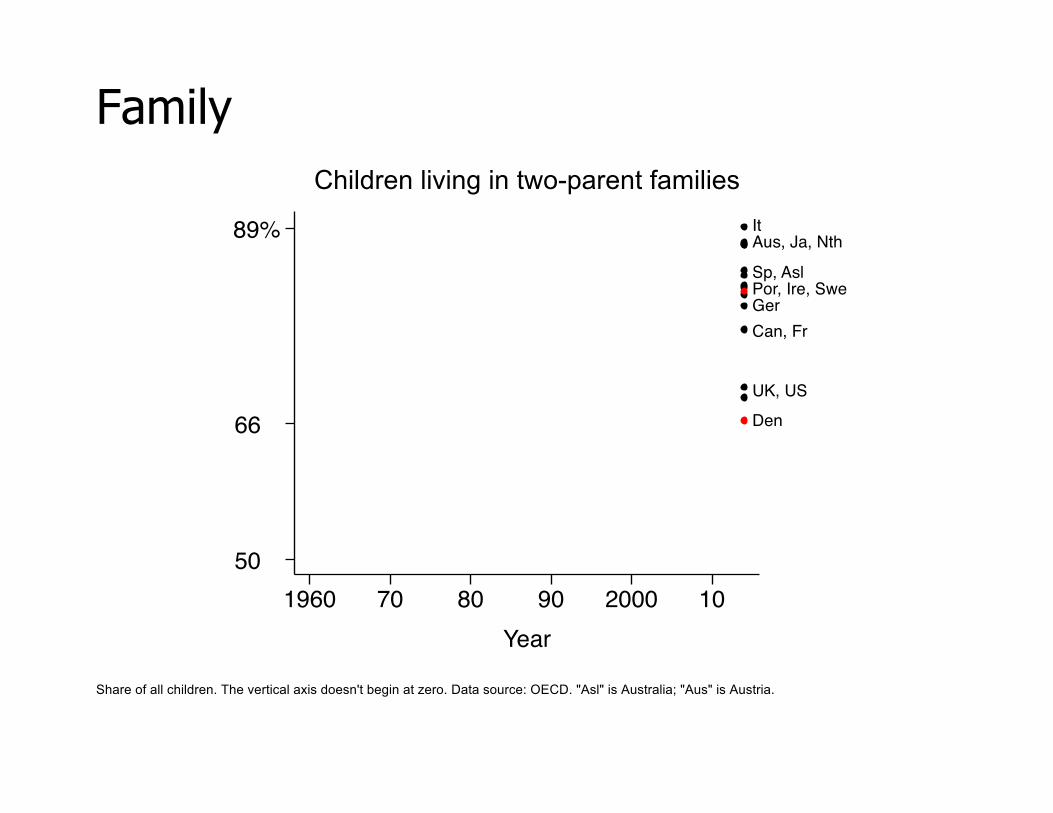
Family
Children living in two-parent families ItAus, Ja, Nth
Sp, AslPor, Ire, SweGerCan, Fr
UK, US
Den
50
66
89%
1960 70 80 90 2000 10Year
Share of all children. The vertical axis doesn't begin at zero. Data source: OECD. "Asl" is Australia; "Aus" is Austria.

Family
Fertility rate
NZ, Ire, FrSwe, US, Asl, UKNor, Den, BelNth, Fin, CanSwi, Ger, Aus, JaIt, Sp, Por, Kor
1
2
3
1960 70 80 90 2000 10Year
Average number of children born per woman. The vertical axis doesn't begin at zero. Data source: OECD. "Asl" is Australia; "Aus" is Austria.
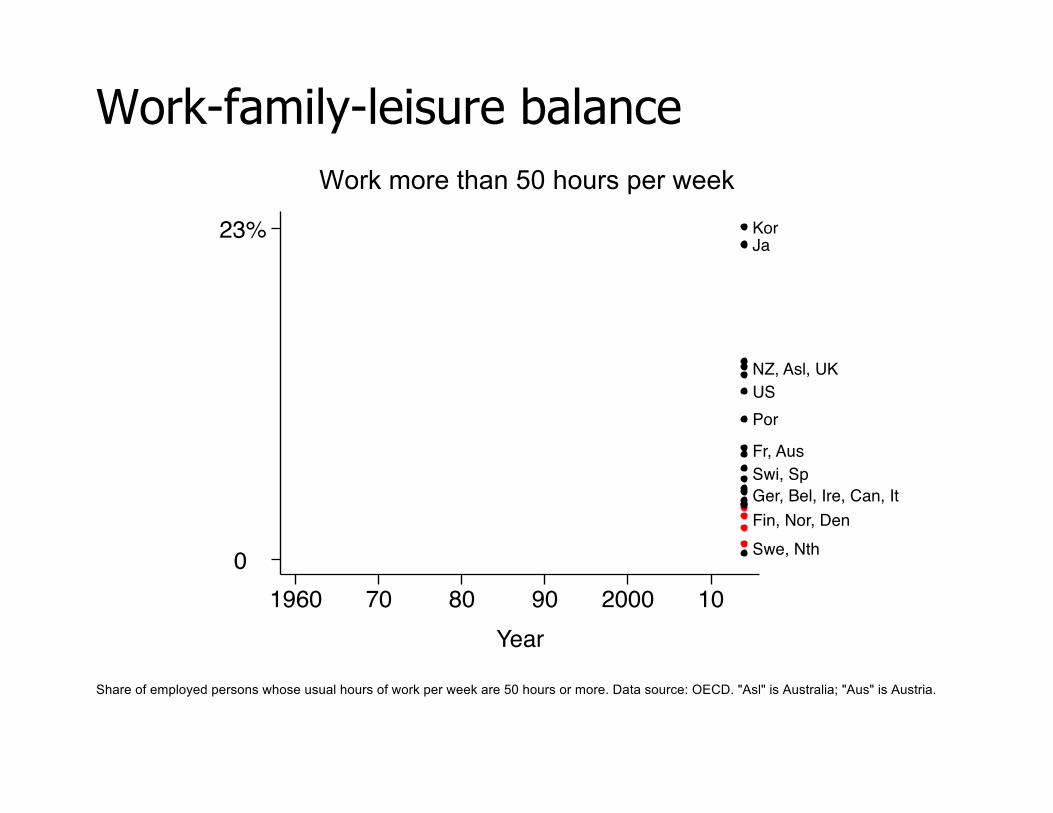
Work-family-leisure balance
Work more than 50 hours per week
US
KorJa
NZ, Asl, UK
Por
Fr, AusSwi, SpGer, Bel, Ire, Can, ItFin, Nor, DenSwe, Nth0
23%
1960 70 80 90 2000 10Year
Share of employed persons whose usual hours of work per week are 50 hours or more. Data source: OECD. "Asl" is Australia; "Aus" is Austria.

Civic engagement
Active member of a voluntary organization CanNZ
UKSwiAsl, US
Nth, NorSwe, FinFrGer, ItKorJaSp
0
18%
1960 70 80 90 2000 10Year
Average for 8 types of organization: sports-recreation, religious, art-music-education, charitable, professional, labor union, environment, consumer. Question: “Now I am going to read off a list of voluntary organizations. For each organization, could you tell me whether you are an active member, an inactive member, or not a member of that type of organization?” Data source: World Values Survey, worldvaluessurvey.org. “Asl” is Australia.

Environment
Carbon dioxide emissions per capita
US, Asl
CanKor, NorNth, JaGer, Fin, BelIre, NZ, Aus, UK, DenItFr, Sp, Swi, Swe, Por
0
4
16
1960 70 80 90 2000 10Year
Metric tons per person. Data source: World Bank. “Asl” is Australia; “Aus” is Austria.

Openness to other peoples
Trade
Swi, NorDen, Fin, Swe, othersUS, Asl, NZ
Fr, Ja
Kor
60
73
90
1960 70 80 90 2000 10Year
Scale of 0 to 100, with higher scores indicating greater freedom. The score is based on a country’s average tariff rate and the extensiveness of non-tariff barriers to imports. The vertical axis doesn't begin at zero. Data source: Heritage Foundation, heritage.org/index. "Asl" is Australia; "Aus" is Austria.
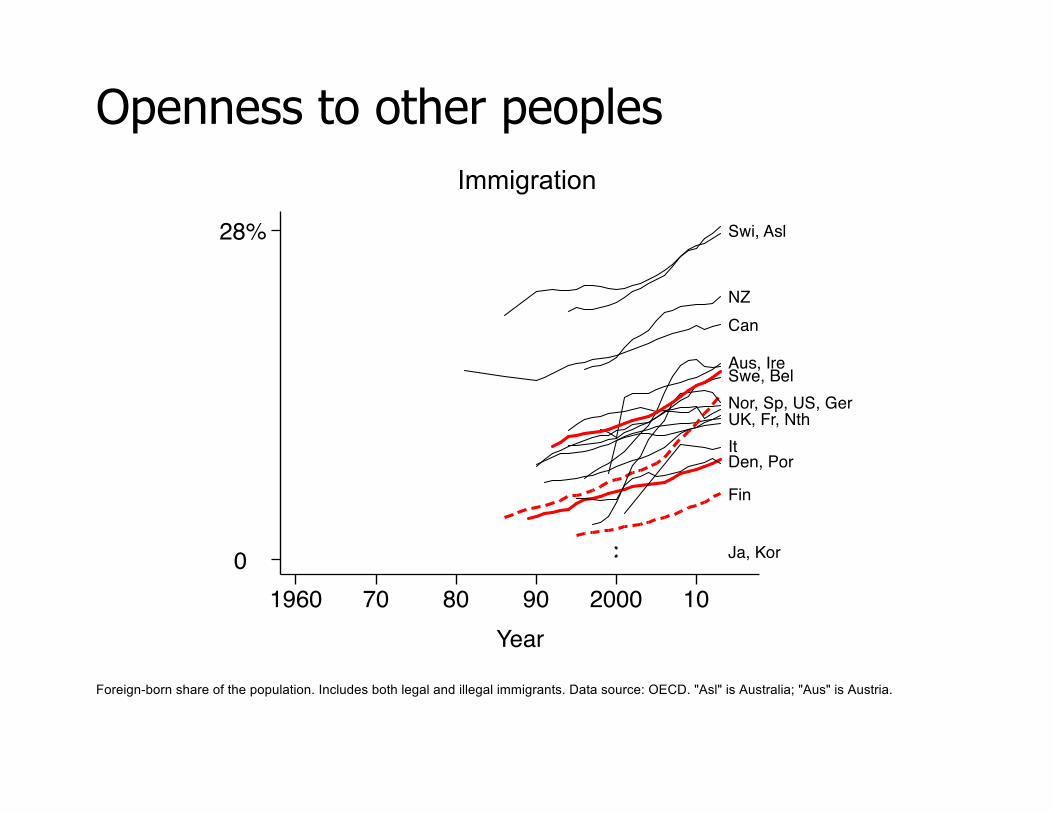
Openness to other peoples
Immigration
Swi, Asl
NZCan
Aus, IreSwe, BelNor, Sp, US, GerUK, Fr, NthItDen, Por
Fin
Ja, Kor0
28%
1960 70 80 90 2000 10Year
Foreign-born share of the population. Includes both legal and illegal immigrants. Data source: OECD. "Asl" is Australia; "Aus" is Austria.
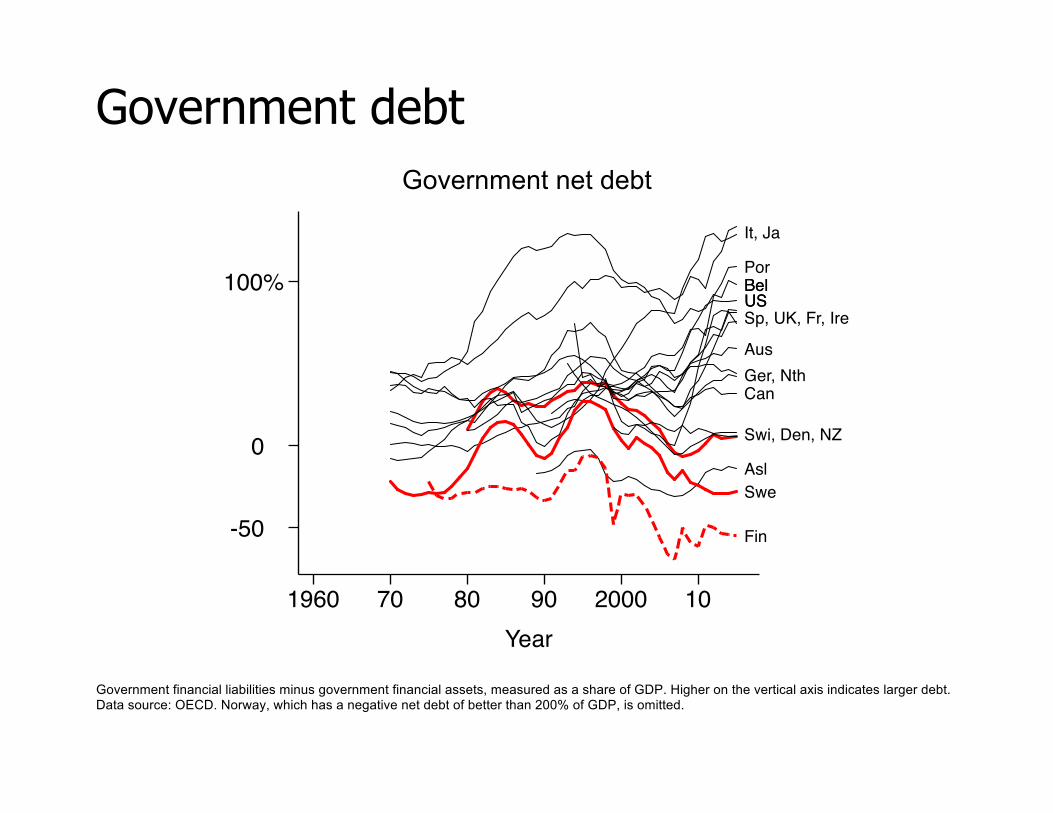
Government debt
Government net debt
It, Ja
US
PorBelUSSp, UK, Fr, Ire
AusGer, NthCan
Swi, Den, NZ
Bel
AslSwe
Fin-50
0
100%
1960 70 80 90 2000 10Year
Government financial liabilities minus government financial assets, measured as a share of GDP. Higher on the vertical axis indicates larger debt. Data source: OECD. Norway, which has a negative net debt of better than 200% of GDP, is omitted.

Happiness
Suicides
Kor
JaBelFr, Fin, Aus, USNZ, Asl, Swi, SweCan, Ire, Ger, DenNor, Nth, PorSp, UK, It
0
8
29
1960 70 80 90 2000 10Year
Suicides per 100,000 population. Data source: OECD. "Asl" is Australia; "Aus" is Austria.
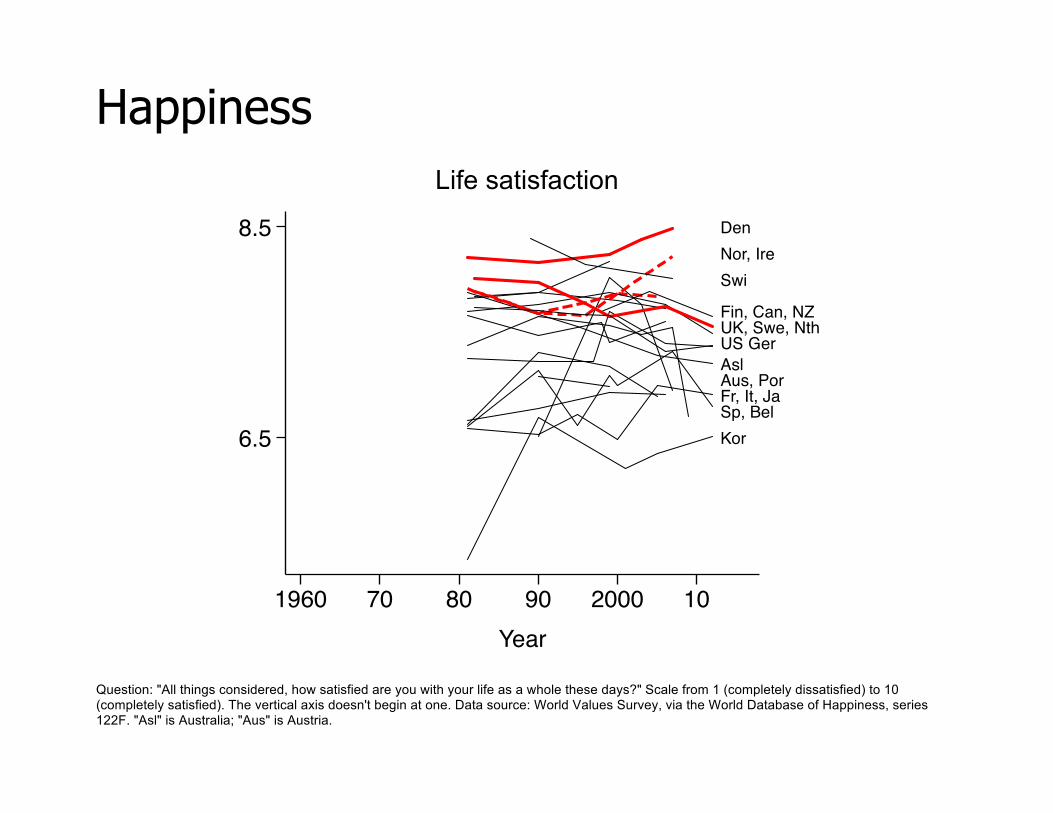
Happiness
Life satisfaction
US
DenNor, IreSwi
Fin, Can, NZUK, Swe, Nth
GerAslAus, PorFr, It, JaSp, BelKor6.5
8.5
1960 70 80 90 2000 10Year
Question: "All things considered, how satisfied are you with your life as a whole these days?" Scale from 1 (completely dissatisfied) to 10 (completely satisfied). The vertical axis doesn't begin at one. Data source: World Values Survey, via the World Database of Happiness, series 122F. "Asl" is Australia; "Aus" is Austria.

Tradeoffs?
Conclusion: The Nordic countries have done as well as other rich democratic nations on nearly all outcomes, and better on some
Is the model's success generalizable?

Is the model's success generalizable?
Are the Nordic countries uniquely able to avoid tradeoffs?
In other words, is the Nordics' ability to use social democratic policies (and thereby achieve "expanded Rawlsian" outcomes) while avoiding tradeoffs nonreplicable?
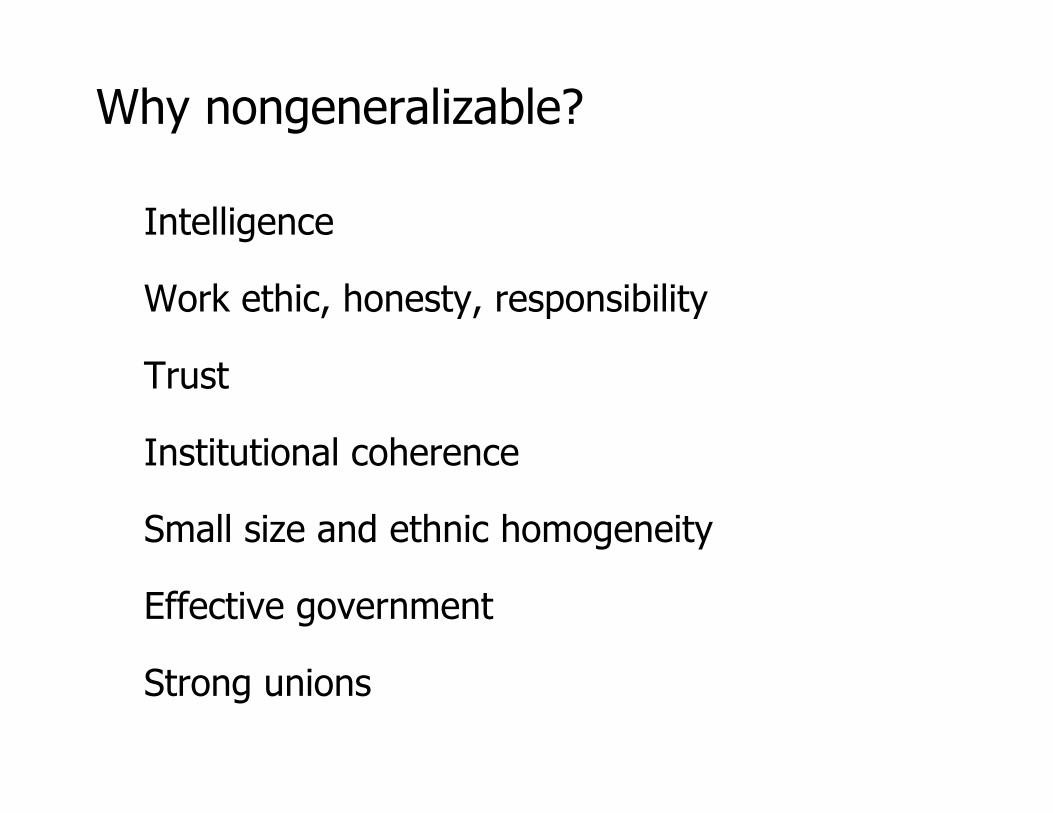
Why nongeneralizable?
Intelligence
Work ethic, honesty, responsibility
Trust
Institutional coherence
Small size and ethnic homogeneity
Effective government
Strong unions

Intelligence
PISA scores, 15-year-olds
JaCa, FinKor
Ire, Ger, Nth, Swi, NZDen, Nor, Bel, AslUK, Por, Swe, FrAus, SpUS, It485
530
1980 90 2000 10Year
Average student score on PISA reading, math, and science tests. 15-year-olds. The PISA tests ask students to solve problems they haven’t seen before, to identify patterns that aren't obvious, and to make compelling written arguments. Data source: OECD. "Asl" is Australia; "Aus" is Austria.

Work ethic, honesty, responsibility
"The uniquely strong norms associated with personal responsibility and work in the Nordics made these societies particularly well suited for avoiding the moral hazard of generous welfare systems."

Work ethic, honesty, responsibility
"Wrongly claiming government benefits is never justified"
NthDenUK, SwiIt, AslNZCan, Ger, IreUS, Ja, FinBel, SpNor, Por, Swe, Aus
Kor
Fr30
90%
1980 90 2000 10Year
Question: "Please tell me for each of the following actions whether you think it can always be justified, never be justified, or something in between: claiming government benefits to which you are not entitled." The lines show the share responding "never be justified." The vertical axis doesn't begin at zero. Data sources: World Values Survey and European Values Survey. "Asl" is Australia; "Aus" is Austria.
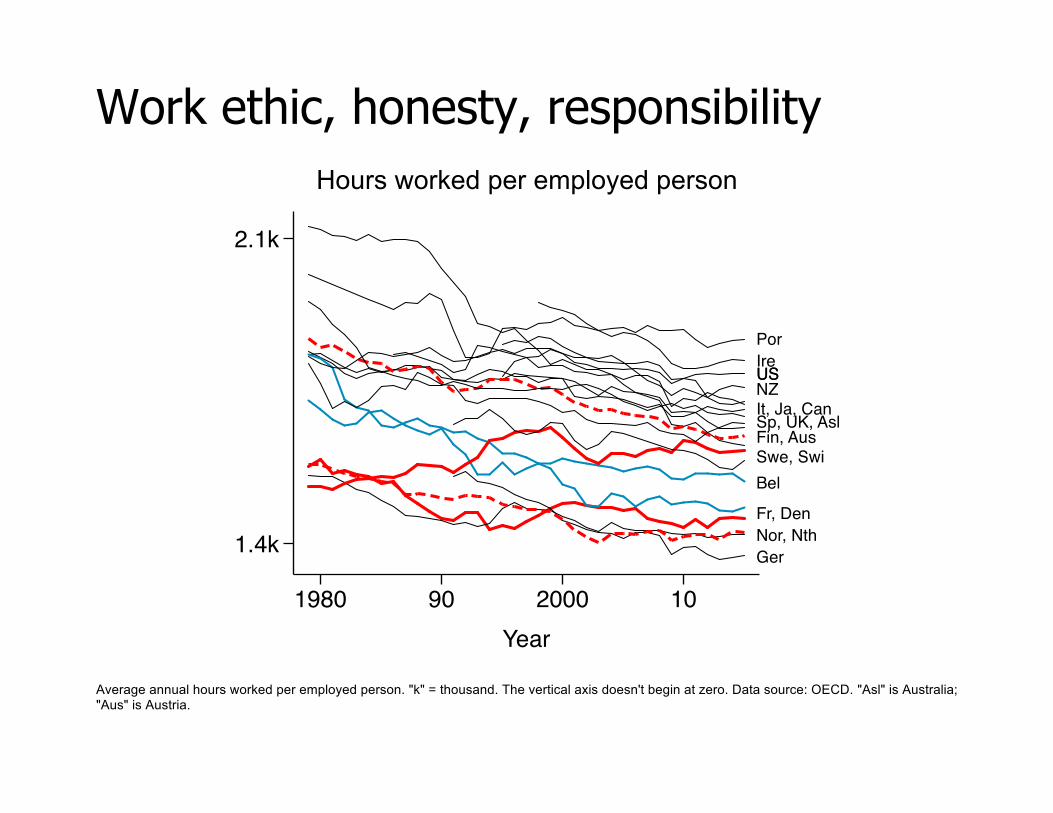
Work ethic, honesty, responsibility
Hours worked per employed person
USUS
PorIreNZIt, Ja, CanSp, UK, AslFin, AusSwe, SwiBel
Fr, DenNor, NthGer1.4k
2.1k
1980 90 2000 10Year
Average annual hours worked per employed person. "k" = thousand. The vertical axis doesn't begin at zero. Data source: OECD. "Asl" is Australia; "Aus" is Austria.
Work ethic, honesty, responsibility
Response to work disincentives: In the late 1980s, when sickness insurance benefits were very generous and easy to qualify for, Swedes missed work due to "sickness" an average of 25 days per year (Americans average 5 days)

Trust
"Most people can be trusted"
US
Den, Nor
NthSwe, FinNZAsl, SwiGerCan
Ire, Ja
UK, Bel, It, Kor
Fr, Sp
0
75%
1980 90 2000 10Year
Share of adults who believe most people can be trusted. Question: "Generally speaking, would you say that most people can be trusted or that you need to be very careful in dealing with people?" Data source: World Values Survey. "Asl" is Australia; "Aus" is Austria.

Trust
Some conclude trust is key to good outcomes (Fukuyama 1995; Putnam 2000)
But supportive evidence is thin (Kenworthy 2001)

Trust
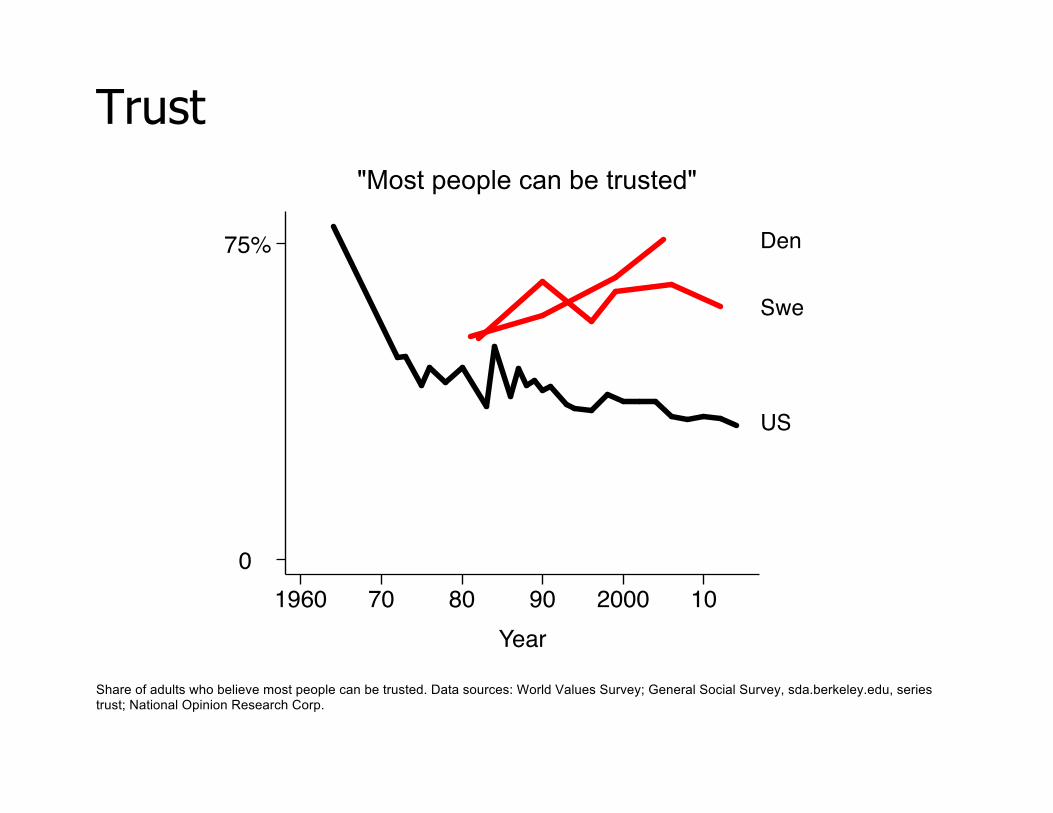
In any event, trust isn't set in stone
Trust
"Most people can be trusted"
Den
Swe
US
0
75%
1960 70 80 90 2000 10Year
Share of adults who believe most people can be trusted. Data sources: World Values Survey; General Social Survey, sda.berkeley.edu, series trust; National Opinion Research Corp.

Trust
The key determinant seems to be confidence/ trust in government

Trust
Trust: Share of adults saying “most people can be trusted.” The other response option is “You can never be too careful when dealing with others.” Data source: World Values Survey. Confidence in government question: “Do you have confidence in the national government: yes or no?” Data source: Gallup World Poll, via the OECD. The correlation is +.76. “Asl” is Australia; “Aus” is Austria.
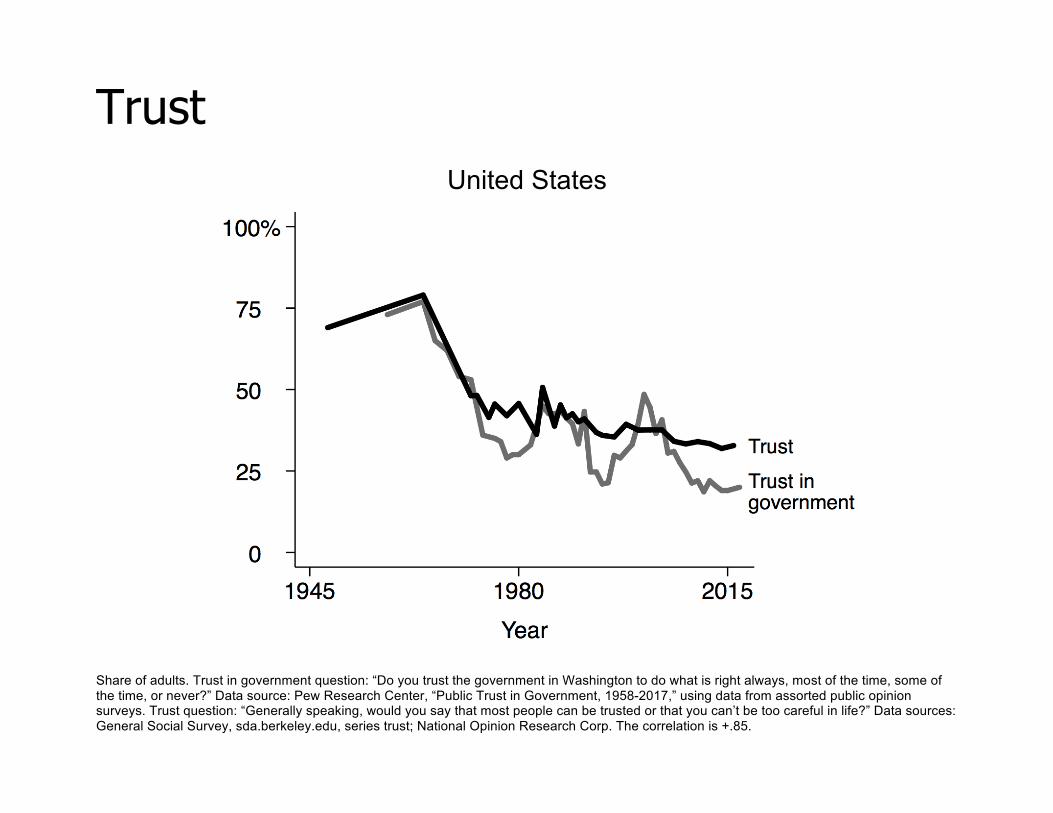
Trust
United States
Share of adults. Trust in government question: “Do you trust the government in Washington to do what is right always, most of the time, some of the time, or never?” Data source: Pew Research Center, “Public Trust in Government, 1958-2017,” using data from assorted public opinion surveys. Trust question: “Generally speaking, would you say that most people can be trusted or that you can’t be too careful in life?” Data sources: General Social Survey, sda.berkeley.edu, series trust; National Opinion Research Corp. The correlation is +.85.

Trust
How to increase trust in government?
A big welfare state
Institutional coherence
The Nordic countries' configuration of institutions and policies hasn't been more coherent than those of Germany, Japan, the US, and some others
The Nordics' policies and institutions have changed over time
There is no empirical association between coherence and economic success (Kenworthy 2006)

Small size and ethnic homogeneity
These features likely helped the Nordic countries adopt social democratic policies
But it isn't clear why they would contribute directly to successful outcomes
Effective government
Nordic governments have been good at experimenting and adjusting ("The streets of Stockholm are awash with the blood of sacred cows")
Yet they've made plenty of mistakes: excessive generosity in some social programs, Sweden's rapid reduction of capital controls coupled with austerity in the early 1990s, Denmark's failure to prevent a housing bubble pre-2008, and more

Strong unions
Unionization
Fin, Swe, Den
Bel, Nor
It, IreCan, Aus, UKNZ, Por, Nth, JaGer, Asl, Sp, SwiUS, Kor, Fr
0 10
70%
1960 70 80 90 2000 10Year
Union members as a share of all employees. Data source: Jelle Visser, "ICTWSS: Database on Institutional Characteristics of Trade Unions, Wage Setting, State Intervention, and Social Pacts," version 5.1, 2016, Amsterdam Institute for Advanced Labour Studies, series ud, ud_s.
Strong unions
Unions, like small population size and ethnic homogeneity, increase the likelihood that a country will adopt social democratic policies
The key question is whether, and if so to what extent, unions contribute directly to successful outcomes
Strong unions
In the 1970s and 1980s, coordinated wage bargaining encouraged wage moderation and thereby contributed to healthy macroeconomic performance
But in the era of independent central banks and restrictive monetary policy, wage coordination is no longer needed to achieve this outcome

Strong unions
They're probably one of the reasons why the Nordic countries have had a moderate rather than large rise in income inequality
Solidaristic wage policy compresses earnings
Unions push against skyrocketing executive pay (top 1%)
Strong unions
They contribute to economic security and shared prosperity by boosting wages
Potential alternatives
Wage extension practices (Nth, Ger)
Extension laws (France)
Tribunals (Australia)

Strong unions
Collective bargaining coverage
Aus, Fr, BelFin, SweNth, DenIt, Sp
Nor, PorAsl, Ger
SwiIre
UK, Can
Ja, NZKor, US
0 12
98%
1960 70 80 90 2000 10Year
Share of employees whose wages are determined by a collective agreement. Data source: Jelle Visser, "ICTWSS: Database on Institutional Characteristics of Trade Unions, Wage Setting, State Intervention, and Social Pacts," version 5.1, 2016, Amsterdam Institute for Advanced Labour Studies, series adjcov.
Strong unions
If a country like the US with very weak unions and no mechanism to compensate adopts social democratic capitalism, wage growth (in the middle and below) will be slower and income inequality will be higher than in the Nordics
Other outcomes should be similar

Have the Nordic countries moved away from the social
democratic model?

Have the Nordics abandoned the model?
Benefit reductions: stricter eligibility criteria, lower replacement rates, shorter duration, heavier tax clawbacks
Changes to services: more user fees, more private supplements
At the same time, some benefits and services have become more generous: parental/family leave, early education, child allowance

Have the Nordics abandoned the model?
More risks are now covered ("old" plus "new")
Some are covered less generously than before
More targeting within universalism
Enhanced emphasis on employment

Have the Nordics abandoned the model?
Public transfer replacement rates
Aus, Nor
Bel, Fin, GerSwe, JaIt, CanFr, DenNthIreSwiUK, USNZ, Asl
0
32
92%
1960 70 80 90 2000 10Year
Average replacement rate for public insurance programs aimed at risks during childhood, working age, and old age. 2000-2010. Data source: Simon Birnbaum, Tommy Ferrarini, Kenneth Nelson, and Joakim Palme, The Generational Social Contract, Edward Elgar, 2017, using data from the Social Policy Indicators (SPIN) database. "Asl" is Australia; "Aus" is Austria.
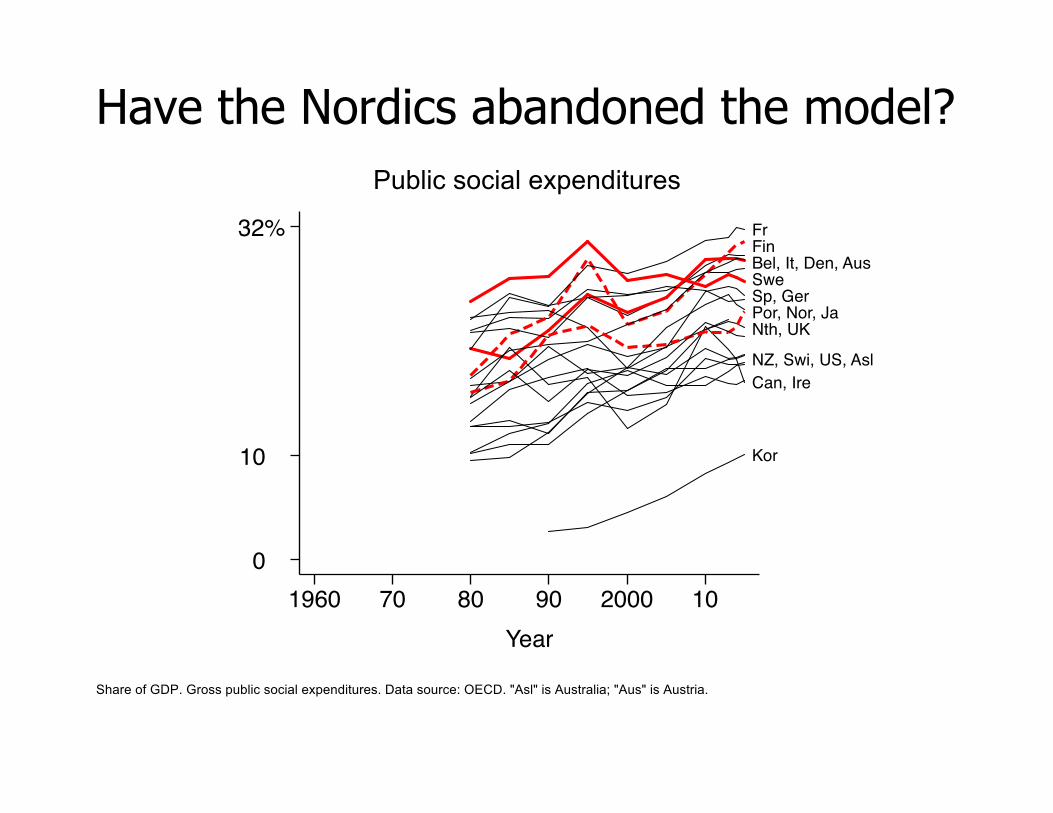
Have the Nordics abandoned the model?
Public social expenditures
FrFinBel, It, Den, AusSweSp, GerPor, Nor, JaNth, UK
NZ, Swi, US, AslCan, Ire
Kor
0
10
32%
1960 70 80 90 2000 10Year
Share of GDP. Gross public social expenditures. Data source: OECD. "Asl" is Australia; "Aus" is Austria.

Have the Nordics abandoned the model?
Government revenues
Nor, Fin, Fr, DenSwe, BelAusItGerNth, Por
Can, NZ, UKSpJa, SwiKor, Aus, US
Ire26
54%
1960 70 80 90 2000 10Year
Share of GDP. Total government revenues. Includes all levels of government. The vertical axis doesn't begin at zero. Data source: OECD. "Asl" is Australia; "Aus" is Austria.

Have the Nordics abandoned the model?
Continental European countries are moving toward the social democratic model — more early education, more ALMP, easing of product and labor market regulations

Challenges the model is equipped to deal with
Capital mobility
How to avoid a race to the bottom in taxation: offer firms a skilled workforce, good services, product and labor market flexibility
More flexible/precarious jobs
Transfers and services are paid for mainly by government (taxes) rather than by employers
Extensive supports for work-family balance

Consumer desire for greater choice
Recent experimentation with enhanced choice in services
Choice within public services
Private supplements to public services

Social democratic capitalism isn't a cure-all
It isn't a cure-all
1. Finance-driven crises
2. Wage stagnation
3. Decline of good jobs in small cities/towns
4. Unaffordable housing in large cities
5. Economic and social exclusion of less-skilled immigrants
1. Finance-driven crises
Many 1990s progressives were willing to keep hands off the financial sector, but that proved disastrous in 2008
Preventing future crises requires significant regulation

2. Wage stagnation
Wages in the United States
Hourly wage at the fiftieth (median) and tenth percentiles of the wage distribution. 2012 dollars; inflation adjustment is via the CPI-U-RS. Data source: Economic Policy Institute, “Wages Deciles,” The State of Working America, using Current Population Survey (CPS) data.

2. Wage stagnation
Slow household income growth in the US
Each series is displayed as an index set to equal 1 in 1947. The family income data are posttransfer-pretax. Inflation adjustment for each series is via the CPI-U-RS. Data sources: Bureau of Economic Analysis, “National Income and Product Accounts Tables,” table 1.1.5; Census Bureau, “Historical Income Data,” tables F-1 and F-5..

2. Wage stagnation
Unions can solve this, but unionization rates have been declining in most rich nations
Collective bargaining extension (Fr, Nth) or wage-setting by tribunals (Australia) can substitute
Another potential substitute: an EITC that rises in sync with GDP per capita
3. Loss of jobs in small cities/towns
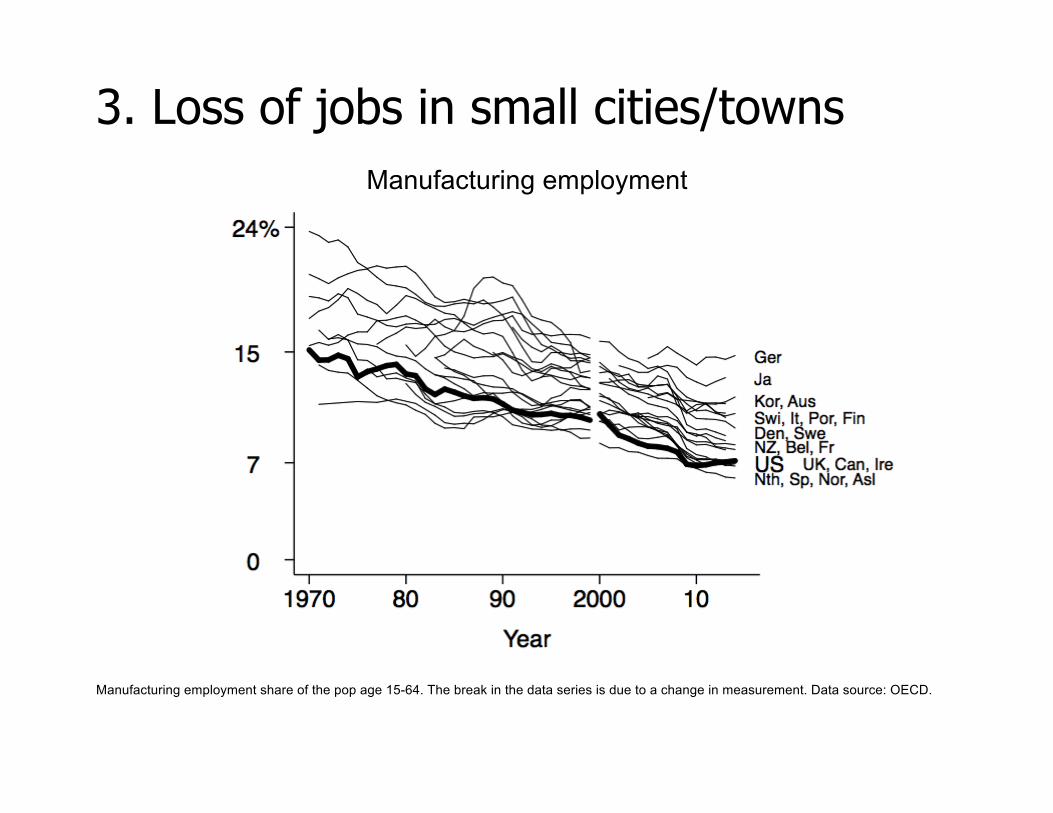
Manufacturing employment
Manufacturing employment share of the pop age 15-64. The break in the data series is due to a change in measurement. Data source: OECD.

3. Loss of jobs in small cities/towns
This may be a key cause of populism's rise in many rich countries
It's surely part of the reason why Donald Trump in 2016 won among whites without a four-year college degree by almost 40 percentage points (according to exit poll data) and why he won in Ohio, Pennsylvania, Michigan, and Wisconsin

3. Loss of jobs in small cities/towns
What to do?
Education, (re)training
Support for investment Government investment in infrastructure
Place-specific investment funds
Regional employer consortiums
Temporary wage subsidy for new jobs
Assistance with moving out or incentives for others to move in (including immigrants)
4. Unaffordable housing in large cities
It reportedly is as hard to find affordable housing in Stockholm as in San Francisco

4. Unaffordable housing in large cities
What to do?
Increase housing supply via fewer or different regulations
Support for affordable rental units

5. Exclusion of less-skilled immigrants
Immigrant-nativeborn employment rate gap
US
It
SwiUK, Por
Sp, Aus, GerFin, Can, IreAsl, FrNZ, DenNor, NthBel
Swe-18
0
17%
1980 90 2000 10Year
Employment rate for immigrants with less than secondary education minus employment rate for native-born persons with less than secondary education. Age 15-64. Data source: OECD, Settling In: OECD Indicators of Immigrant Integration, 2012, figure 6.2. "Asl" is Australia; "Aus" is Austria.

5. Exclusion of less-skilled immigrants
What to do?
Support for education (including language)
Incentives for geographical integration
Perhaps a lower wage floor (with an EITC)
Immigrant inclusion often takes two or three generations

Even if my conclusion is correct, it gives no guidance on important policy details

Details, details
Should early education be universal or targeted to the poor, or to the poor plus middle?
Should paid parental leave be for six months or one year? Should it include a "daddy quota"?
Should there be a statutory minimum wage? If so, how high?
Supplement low wages with a tax credit?
Etc, etc …

Are there better alternatives?

Are there better alternatives?
Might other institutions and policies do even better than social democratic capitalism?
Libertarianism Conservatism (modest welfare state plus strong families and civil society) The Swiss, German, and Australian models Basic income Hyperdemocracy
I'm skeptical, but open to argument and evidence

Social democratic capitalism in the United States?

Social democratic capitalism in the US?
I predict yes
America's social democratic future
As people and countries get richer, they're willing to spend more on insurance and fairness
While America's veto-point-laden government makes policy advance difficult, occasionally advances do come
Once in place, public insurance programs seldom get reversed, because Americans like them and because veto points make it easy to block reversals
America's social democratic future
The US has been traveling along the path toward social democracy since the 1930s
In public insurance, today's America is closer to today's Sweden and Denmark than it is to 1917 America

America's social democratic future
0 12 38 48%Korea
SwitzerlandAustralia
UNITED STATESJapan
IrelandNew Zealand
CanadaSpain
NorwayUnited Kingdom
NetherlandsGermanyPortugal
ItalyBelgiumAustriaFinland
SwedenFrance
Denmark
19202000-142065
Government expenditures as a share of GDP

America's social democratic future
Formidable but surmountable obstacles
1. Americans don't like big government
2. The rhetoric of reaction
3. Can the left continue to attract the voters and money needed to win elections?
4. The balance of power among organized interests has shifted to the right
5. Veto-point-laden government plus polarized parties plus Republican obstructionism

America's social democratic future
California shows the way forward
Aggressive Medicaid (MediCal) expansion (since
2010); it now covers one-third of Californians
Paid parental leave: 6 weeks, 55% replacement rate (2004)
Paid sickness leave, 8 days/year (2015)
Supplemental defined-contribution pension program with automatic enrollment (2016)

America's social democratic future
California shows the way forward
$15/hour minimum wage by 2022 (2016)
More generous EITC at the low end (2015)
Commitment to reduce greenhouse gas emissions by 40% below 1990 levels (2015)
America's social democratic future
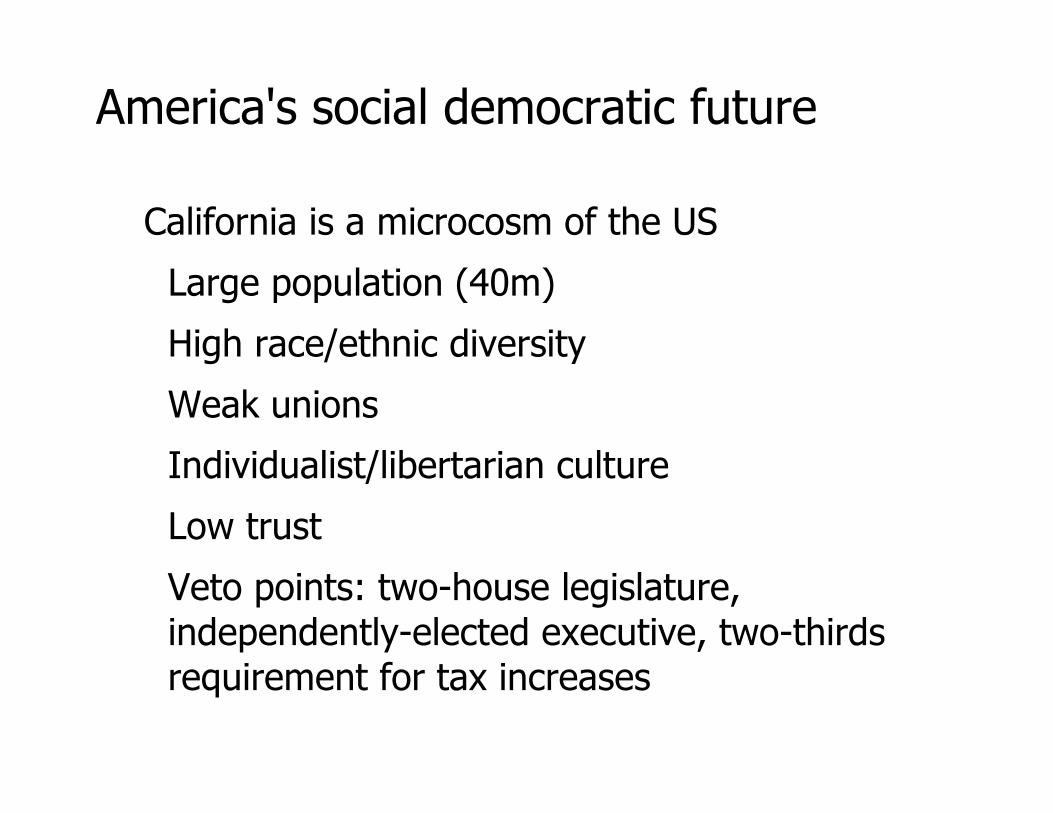
California is a microcosm of the US
Large population (40m)
High race/ethnic diversity
Weak unions
Individualist/libertarian culture
Low trust
Veto points: two-house legislature, independently-elected executive, two-thirds requirement for tax increases

America's social democratic future
So how has California enacted so much progressive policy?
Left (Democratic Party) control of government
Policy makers' willingness to look at evidence and listen to popular movements ("Fight for $15")
America's social democratic future
Hillary Clinton's 2016 campaign platform pledged a large expansion of US social programs
California + Medicare eligibility at age 55 + early education + tuition-free college + increased child allowance (tax credit) + large increase in infrastructure spending

America's social democratic future
Will Americans tolerate higher taxes?
Recently there's been some success in raising taxes on the rich
2010 new Medicare taxes above $250k: 0.9% on wages, 3.8% on investment income
2013 lapse of Bush federal income tax cuts for incomes above $450k
2012 and 2016 California additional tax on incomes above $250k (to pay for K-12 schools)

America's social democratic future
But higher taxes on the rich aren't enough
Effective tax rate on the top 5%
Social Democratic Capitalism
Lane Kenworthy