Social and Emotional Learning - Austin Independent … and Emotional Learning (SEL) program from the...
33
December, 2015 Publication Number 14.138 Social and Emotional Learning: Implementation and Program Outcomes, 2010–2011 Through 2014–2015
Transcript of Social and Emotional Learning - Austin Independent … and Emotional Learning (SEL) program from the...
December, 2015
Publication Number 14.138
Social and Emotional Learning: Implementation and Program Outcomes, 2010–2011 Through 2014–2015
PICTURE PLACEHOLDER
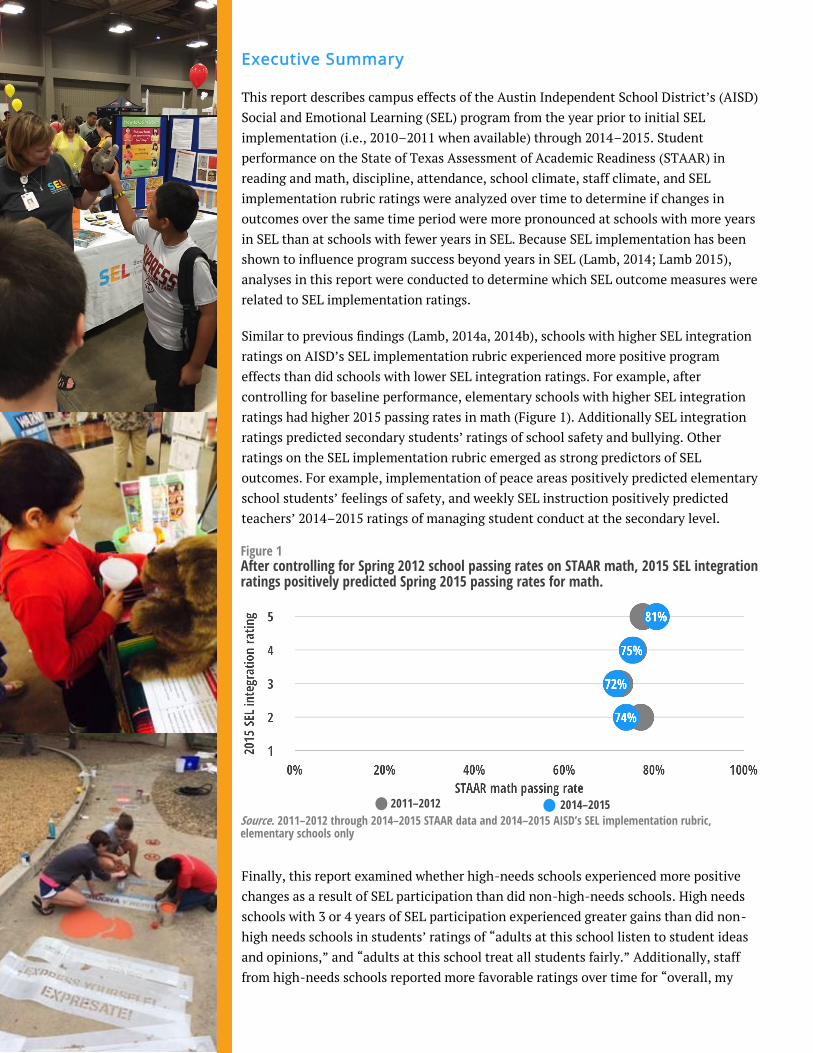
Executive Summary
This report describes campus effects of the Austin Independent School District’s (AISD)
Social and Emotional Learning (SEL) program from the year prior to initial SEL
implementation (i.e., 2010–2011 when available) through 2014–2015. Student
performance on the State of Texas Assessment of Academic Readiness (STAAR) in
reading and math, discipline, attendance, school climate, staff climate, and SEL
implementation rubric ratings were analyzed over time to determine if changes in
outcomes over the same time period were more pronounced at schools with more years
in SEL than at schools with fewer years in SEL. Because SEL implementation has been
shown to influence program success beyond years in SEL (Lamb, 2014; Lamb 2015),
analyses in this report were conducted to determine which SEL outcome measures were
related to SEL implementation ratings.
Similar to previous findings (Lamb, 2014a, 2014b), schools with higher SEL integration
ratings on AISD’s SEL implementation rubric experienced more positive program
effects than did schools with lower SEL integration ratings. For example, after
controlling for baseline performance, elementary schools with higher SEL integration
ratings had higher 2015 passing rates in math (Figure 1). Additionally SEL integration
ratings predicted secondary students’ ratings of school safety and bullying. Other
ratings on the SEL implementation rubric emerged as strong predictors of SEL
outcomes. For example, implementation of peace areas positively predicted elementary
school students’ feelings of safety, and weekly SEL instruction positively predicted
teachers’ 2014–2015 ratings of managing student conduct at the secondary level.
Finally, this report examined whether high-needs schools experienced more positive
changes as a result of SEL participation than did non-high-needs schools. High needs
schools with 3 or 4 years of SEL participation experienced greater gains than did non-
high needs schools in students’ ratings of “adults at this school listen to student ideas
and opinions,” and “adults at this school treat all students fairly.” Additionally, staff
from high-needs schools reported more favorable ratings over time for “overall, my
Figure 1 After controlling for Spring 2012 school passing rates on STAAR math, 2015 SEL integration ratings positively predicted Spring 2015 passing rates for math.
Source. 2011–2012 through 2014–2015 STAAR data and 2014–2015 AISD’s SEL implementation rubric, elementary schools only
2014–2015 2011–2012

school is a good place to work and learn,” and for the subscale managing student
conduct than did staff from non-high-needs schools.
Together, these results suggest that regardless of longevity in SEL, the degree to which
schools integrate SEL and incorporate peace areas is also critical to the program’s
success. Additionally, identifying ways that high-needs schools have made gains over
time will help program staff as they work with schools to help ensure that all students
receive effective SEL instruction.
Table of Contents
Executive Summary ............................................................................................................................... 1
List of Figures ........................................................................................................................................ 5
List of Tables ......................................................................................................................................... 6
Background ............................................................................................................................................ 7
What is Social Emotional Learning? ....................................................................................................... 8
How does AISD implement SEL? ............................................................................................................ 9
How is SEL evaluated? ......................................................................................................................... 10
How did AISD phase in SEL? ................................................................................................................ 11
AISD’s SEL Implementation Rubric...................................................................................................... 12
SEL Implementation and Program Outcomes ...................................................................................... 14
SEL implementation rubric....................................................................................................... 14
Academic Achievement ............................................................................................................ 17
Discipline and Attendance ....................................................................................................... 18
Student Climate ....................................................................................................................... 20
Staff Climate ............................................................................................................................ 24
In what ways did high-needs SEL schools improve after 3 or 4 years in SEL? ....................................... 27
Conclusion ........................................................................................................................................... 30
Future research .................................................................................................................................... 30
Appendix ............................................................................................................................................. 31
References ........................................................................................................................................... 33
List of Figures
Figure 1. After controlling for Spring 2012 school passing rates on STAAR math, 2015 SEL integration
ratings positively predicted Spring 2015 passing rates for math. ........................................................... 1
Figure 2. The five core competencies are integrated in AISD’s curriculum. ........................................... 8
Figure 3. AISD’s Four-Pronged Approach to SEL Implementation. ....................................................... 9
Figure 4. DRE’s Logic Model, Used to Guide the Ongoing Evaluation of SEL ........................................ 10
Figure 5. Elementary schools with more years in SEL received higher integration and implementation
than did schools with fewer years in SEL. ............................................................................................ 14
Figure 6. Secondary schools with more years of SEL experience received higher implementation ratings
in all domains than schools with fewer years of SEL experience. ........................................................ 15
Figure 7. Secondary SEL coaches provided lower SEL implementation ratings than did elementary SEL
coaches. .............................................................................................................................................. 16
Figure 8. After controlling for baseline year, SEL integration ratings predicted 2015 STAAR math
performance, regardless of length of time in SEL. ............................................................................... 17
Figure 9. SEL integration ratings did not predict 2015 STAAR reading performance. .......................... 18
Figure 10. After controlling for 2010–2011 discipline rates, secondary schools with steering
committees that were incorporated into school planning had lower discipline rates in 2014–2015 than
did schools with less incorporated steering committees. .................................................................... 19
Figure 11. After controlling for 2010–2011 chronic absenteeism, secondary schools where more staff
received regular, ongoing professional development activities and training had lower chronic
absenteeism in 2014–2015 than did schools where fewer staff received ongoing SEL professional
development activities. ....................................................................................................................... 19
Figure 12. Secondary schools with higher SEL integration had more favorable 2014–2015 ratings of
“students at my school are bullied (teased, messed with/taunted, threatened by other students)” than
did schools with lower SEL integration ratings. .................................................................................. 22
Figure 13. After controlling for baseline ratings of school safety, schools with high SEL integration
ratings had higher 2014–2015 average school ratings of “I feel safe at my school” than did schools with
lower SEL integration ratings. ............................................................................................................. 22
Figure 14. Elementary schools where peace areas were implemented into most classrooms had students
who provided higher 2014–2015 ratings of “I feel safe at my school” than did schools where peace
areas were implemented with less fidelity. .......................................................................................... 23
Figure 15. Elementary schools with more frequent principal and SEL coach meetings had higher 2014–
2015 average school ratings of managing student conduct than did schools with less frequent principal
and SEL coach meetings. ..................................................................................................................... 25
Figure 16. Elementary schools with more frequent principal and SEL coach meetings had higher ratings
of “overall, my school is a good place to work and learn” than did schools with less frequent principal
and SEL coach meetings. ..................................................................................................................... 25
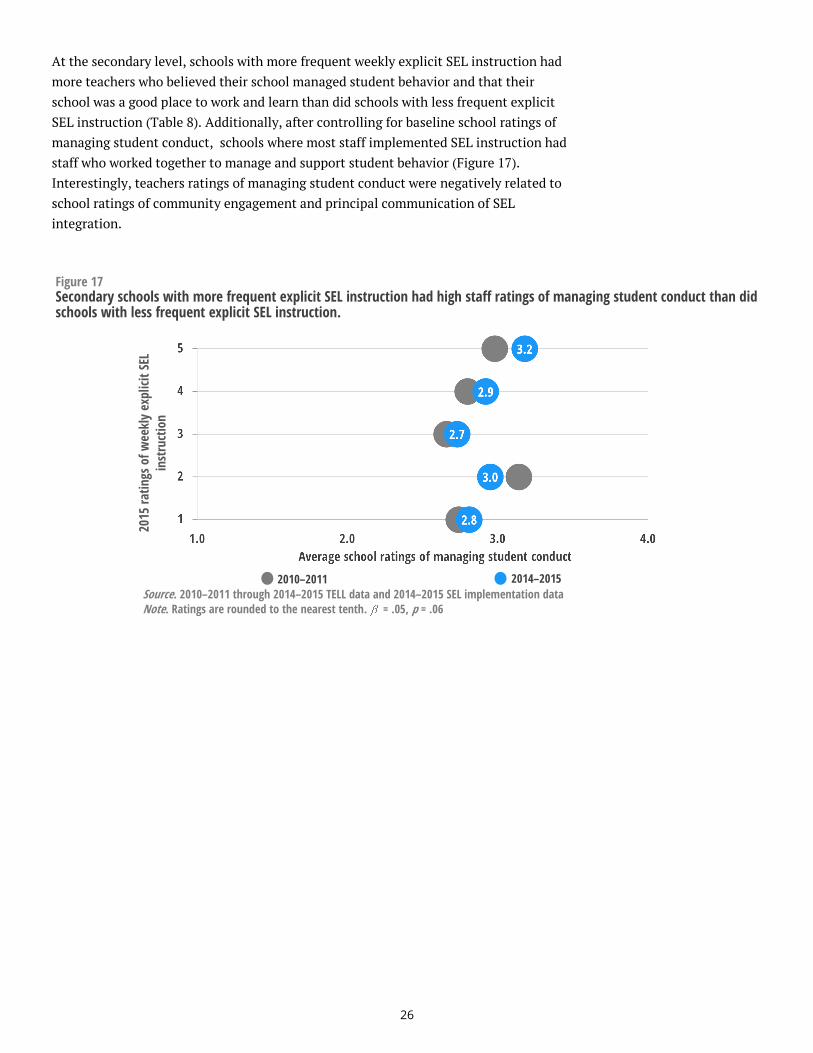
Figure 17. Secondary schools with more frequent explicit SEL instruction had high staff ratings of
managing student conduct than did schools with less frequent explicit SEL instruction. .................... 26
Figure 18. High needs schools experienced greater improvement over time than did non-high-needs
schools with respect to students’ perceptions of their relationships with adults at their school and
school safety. Staff ratings of work environment and managing student behavior at high-needs schools
also improved over time than did staff ratings at non-high-needs schools. ........................................ 27
Figure 19. Improvements in STAAR reading and math from 2011–2012 to 2014–2015 were slightly
higher at high-needs SEL elementary schools than at non-high-needs SEL elementary schools. ........ 28
List of Tables
Table 1. SEL integration was positively related to 2015 passing rates in STAAR math ......................... 17
Table 2. Secondary schools with lower rates of chronic absenteeism and disciplinary infractions had
more frequent meetings between their SEL coach and principal than did schools with higher rates of
chronic absenteeism and disciplinary infractions. ............................................................................... 18
Table 3. Elementary schools with greater implementation of peace areas, SEL integration, principal
communication of SEL integration, and the implementation subscale had more students reporting they
felt safe at school than did schools with lower ratings on these domains. ............................................ 20
Table 4. Secondary schools where the peace-making process was implemented in most classrooms had
higher ratings on nearly all Student Climate Survey items than did schools where the peace-making
process was implemented in fewer classrooms. ................................................................................... 21
Table 5. Elementary schools with more effective principal/SEL coach meetings and secondary schools
with more frequent weekly explicit SEL instruction had more teachers who endorsed high ratings of
managing student conduct and believed their school was a good place to work and learn than did
schools with lower ratings on these domains. . .................................................................................... 24
7
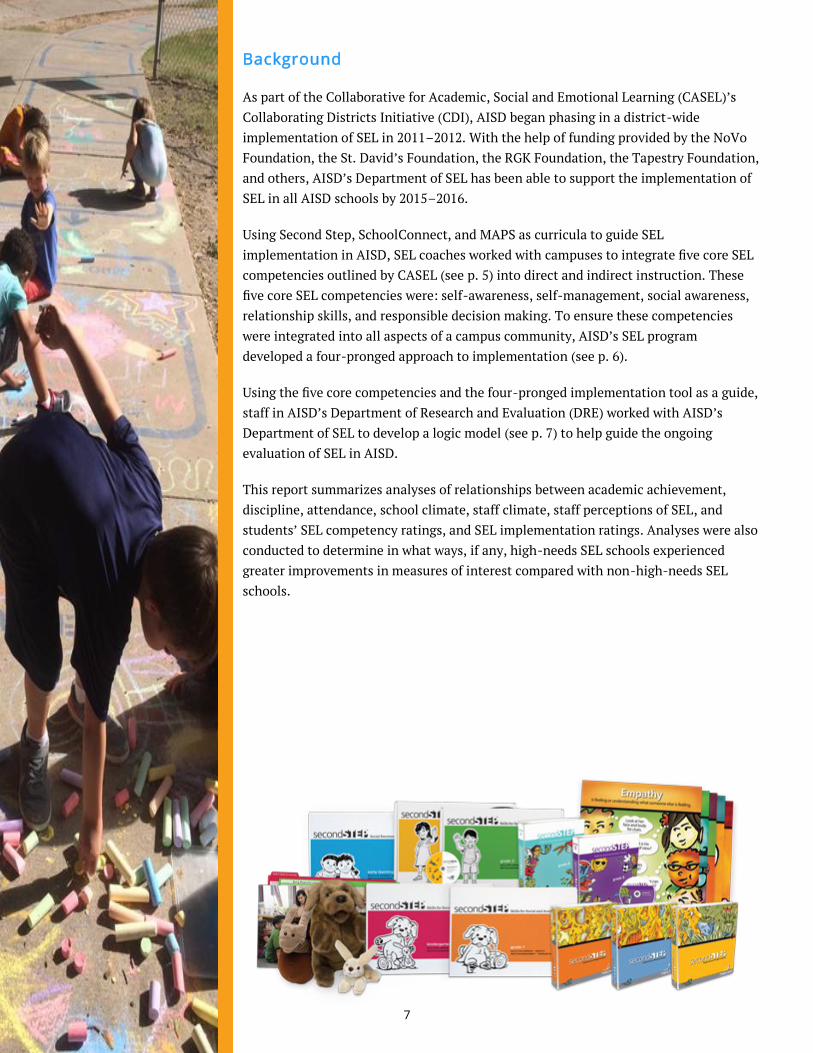
Background
As part of the Collaborative for Academic, Social and Emotional Learning (CASEL)’s
Collaborating Districts Initiative (CDI), AISD began phasing in a district-wide
implementation of SEL in 2011–2012. With the help of funding provided by the NoVo
Foundation, the St. David’s Foundation, the RGK Foundation, the Tapestry Foundation,
and others, AISD’s Department of SEL has been able to support the implementation of
SEL in all AISD schools by 2015–2016.
Using Second Step, SchoolConnect, and MAPS as curricula to guide SEL
implementation in AISD, SEL coaches worked with campuses to integrate five core SEL
competencies outlined by CASEL (see p. 5) into direct and indirect instruction. These
five core SEL competencies were: self-awareness, self-management, social awareness,
relationship skills, and responsible decision making. To ensure these competencies
were integrated into all aspects of a campus community, AISD’s SEL program
developed a four-pronged approach to implementation (see p. 6).
Using the five core competencies and the four-pronged implementation tool as a guide,
staff in AISD’s Department of Research and Evaluation (DRE) worked with AISD’s
Department of SEL to develop a logic model (see p. 7) to help guide the ongoing
evaluation of SEL in AISD.
This report summarizes analyses of relationships between academic achievement,
discipline, attendance, school climate, staff climate, staff perceptions of SEL, and
students’ SEL competency ratings, and SEL implementation ratings. Analyses were also
conducted to determine in what ways, if any, high-needs SEL schools experienced
greater improvements in measures of interest compared with non-high-needs SEL
schools.
8
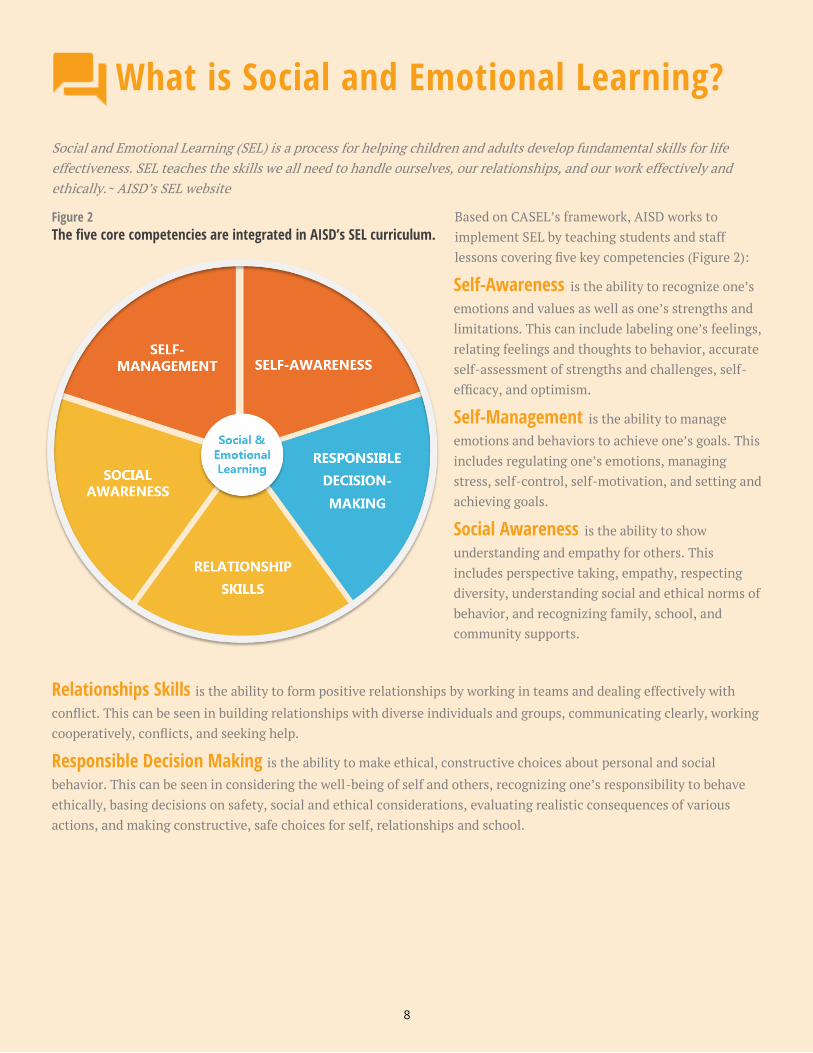
What is Social and Emotional Learning?
Social and Emotional Learning (SEL) is a process for helping children and adults develop fundamental skills for life
effectiveness. SEL teaches the skills we all need to handle ourselves, our relationships, and our work effectively and
ethically.~ AISD’s SEL website
Based on CASEL’s framework, AISD works to
implement SEL by teaching students and staff
lessons covering five key competencies (Figure 2):
Self-Awareness is the ability to recognize one’s
emotions and values as well as one’s strengths and
limitations. This can include labeling one’s feelings,
relating feelings and thoughts to behavior, accurate
self-assessment of strengths and challenges, self-
efficacy, and optimism.
Self-Management is the ability to manage
emotions and behaviors to achieve one’s goals. This
includes regulating one’s emotions, managing
stress, self-control, self-motivation, and setting and
achieving goals.
Social Awareness is the ability to show
understanding and empathy for others. This
includes perspective taking, empathy, respecting
diversity, understanding social and ethical norms of
behavior, and recognizing family, school, and
community supports.
Relationships Skills is the ability to form positive relationships by working in teams and dealing effectively with
conflict. This can be seen in building relationships with diverse individuals and groups, communicating clearly, working
cooperatively, conflicts, and seeking help.
Responsible Decision Making is the ability to make ethical, constructive choices about personal and social
behavior. This can be seen in considering the well-being of self and others, recognizing one’s responsibility to behave
ethically, basing decisions on safety, social and ethical considerations, evaluating realistic consequences of various
actions, and making constructive, safe choices for self, relationships and school.
Figure 2
The five core competencies are integrated in AISD’s SEL curriculum.
8
9
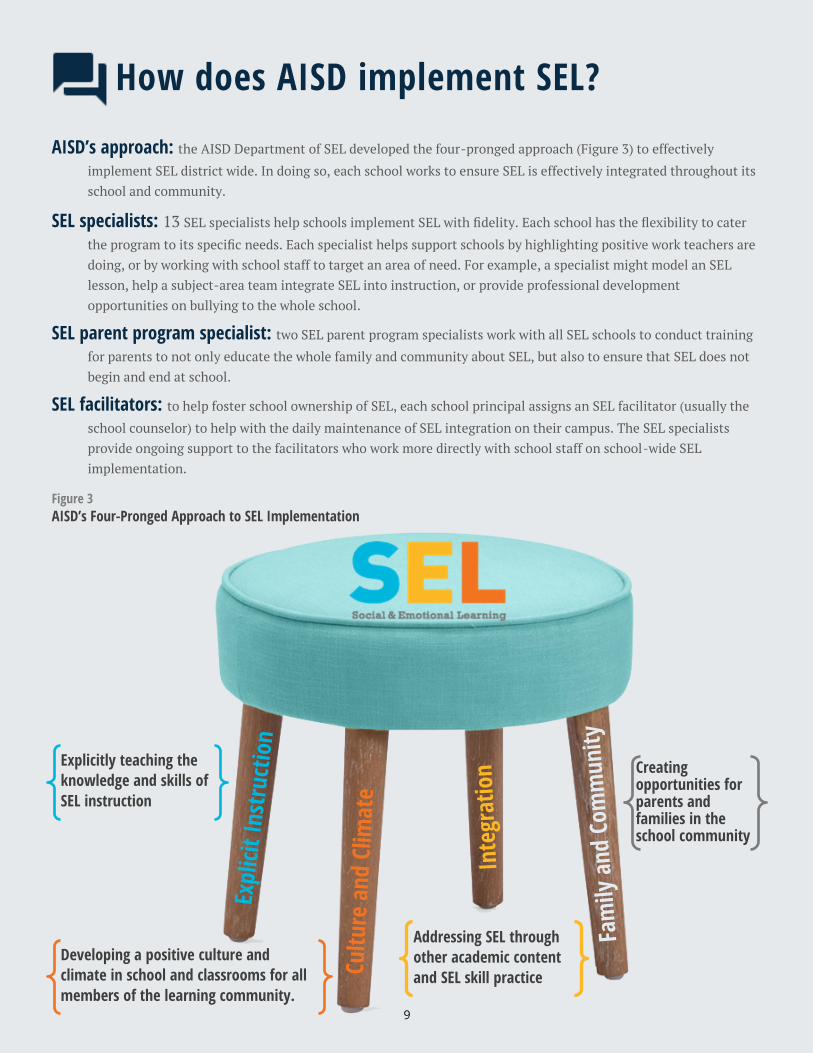
How does AISD implement SEL?
AISD’s approach: the AISD Department of SEL developed the four-pronged approach (Figure 3) to effectively
implement SEL district wide. In doing so, each school works to ensure SEL is effectively integrated throughout its
school and community.
SEL specialists: 13 SEL specialists help schools implement SEL with fidelity. Each school has the flexibility to cater
the program to its specific needs. Each specialist helps support schools by highlighting positive work teachers are
doing, or by working with school staff to target an area of need. For example, a specialist might model an SEL
lesson, help a subject-area team integrate SEL into instruction, or provide professional development
opportunities on bullying to the whole school.
SEL parent program specialist: two SEL parent program specialists work with all SEL schools to conduct training
for parents to not only educate the whole family and community about SEL, but also to ensure that SEL does not
begin and end at school.
SEL facilitators: to help foster school ownership of SEL, each school principal assigns an SEL facilitator (usually the
school counselor) to help with the daily maintenance of SEL integration on their campus. The SEL specialists
provide ongoing support to the facilitators who work more directly with school staff on school-wide SEL
implementation.
Figure 3
AISD’s Four-Pronged Approach to SEL Implementation
Addressing SEL through
other academic content
and SEL skill practice
Explicitly teaching the
knowledge and skills of
SEL instruction
Creating opportunities for parents and families in the school community
Developing a positive culture and
climate in school and classrooms for all
members of the learning community. 9
10
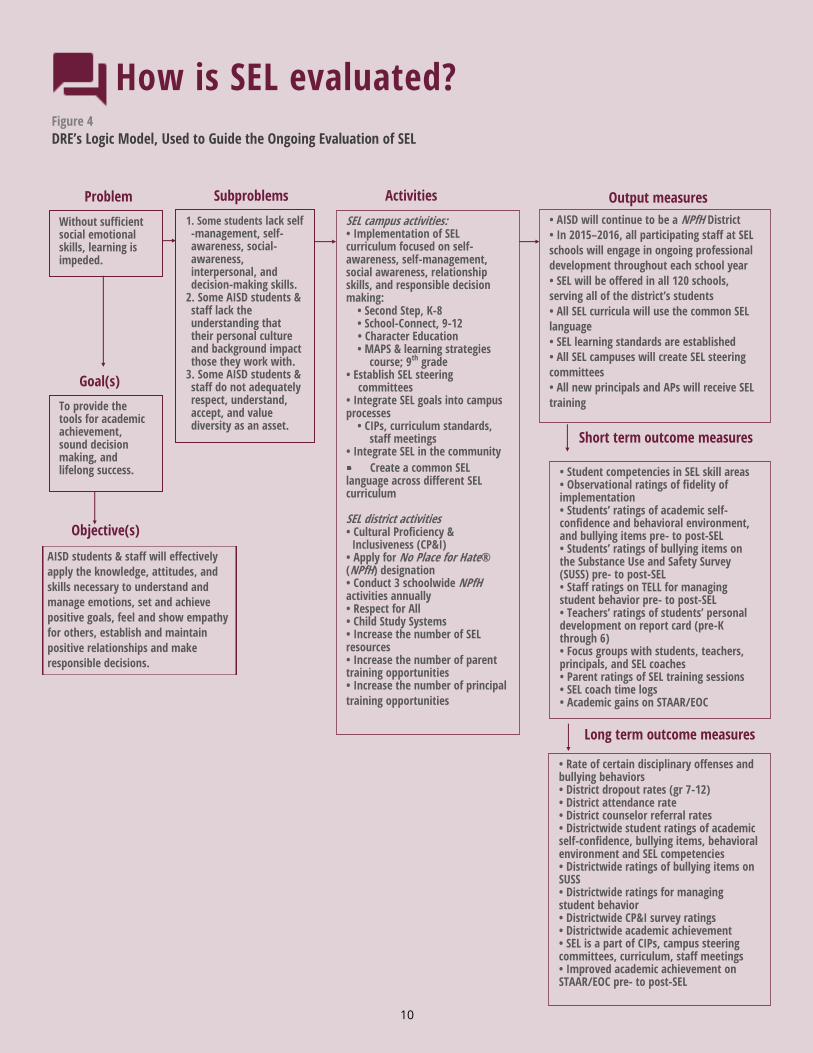
How is SEL evaluated?
Figure 4
DRE’s Logic Model, Used to Guide the Ongoing Evaluation of SEL
To provide the tools for academic achievement, sound decision making, and lifelong success.
• Rate of certain disciplinary offenses and bullying behaviors • District dropout rates (gr 7-12) • District attendance rate • District counselor referral rates • Districtwide student ratings of academic self-confidence, bullying items, behavioral environment and SEL competencies • Districtwide ratings of bullying items on SUSS • Districtwide ratings for managing student behavior • Districtwide CP&I survey ratings • Districtwide academic achievement • SEL is a part of CIPs, campus steering committees, curriculum, staff meetings • Improved academic achievement on STAAR/EOC pre- to post-SEL
Objective(s)
Long term outcome measures
AISD students & staff will effectively
apply the knowledge, attitudes, and
skills necessary to understand and
manage emotions, set and achieve
positive goals, feel and show empathy
for others, establish and maintain
positive relationships and make
responsible decisions.
Goal(s)
Without sufficient social emotional skills, learning is impeded.
1. Some students lack self-management, self-awareness, social-awareness, interpersonal, and decision-making skills.
2. Some AISD students & staff lack the understanding that their personal culture and background impact those they work with.
3. Some AISD students & staff do not adequately respect, understand, accept, and value diversity as an asset.
SEL campus activities: • Implementation of SEL curriculum focused on self-awareness, self-management, social awareness, relationship skills, and responsible decision making:
• Second Step, K-8 • School-Connect, 9-12 • Character Education • MAPS & learning strategies
course; 9th grade • Establish SEL steering
committees • Integrate SEL goals into campus processes
• CIPs, curriculum standards, staff meetings
• Integrate SEL in the community
Create a common SEL language across different SEL curriculum SEL district activities • Cultural Proficiency &
Inclusiveness (CP&I) • Apply for No Place for Hate® (NPfH) designation • Conduct 3 schoolwide NPfH activities annually • Respect for All • Child Study Systems • Increase the number of SEL resources • Increase the number of parent training opportunities • Increase the number of principal
training opportunities
• AISD will continue to be a NPfH District
• In 2015–2016, all participating staff at SEL
schools will engage in ongoing professional
development throughout each school year
• SEL will be offered in all 120 schools,
serving all of the district’s students
• All SEL curricula will use the common SEL
language
• SEL learning standards are established
• All SEL campuses will create SEL steering
committees
• All new principals and APs will receive SEL
training
• Student competencies in SEL skill areas • Observational ratings of fidelity of implementation • Students’ ratings of academic self-confidence and behavioral environment, and bullying items pre- to post-SEL • Students’ ratings of bullying items on the Substance Use and Safety Survey (SUSS) pre- to post-SEL • Staff ratings on TELL for managing student behavior pre- to post-SEL • Teachers’ ratings of students’ personal development on report card (pre-K through 6) • Focus groups with students, teachers, principals, and SEL coaches • Parent ratings of SEL training sessions • SEL coach time logs • Academic gains on STAAR/EOC
Problem Subproblems Activities Output measures
Short term outcome measures
10

11
How did AISD phase in SEL?
4 years of SEL implementation (SEL began in 2011–2012): 26 schools
17 elementary schools
4 middle schools
2 high schools
1 special campus
3 years of SEL implementation (SEL began in 2012–2013): 32 schools
24 elementary schools
5 middle schools
2 high schools
2 years of SEL implementation (SEL began in 2013–2014): 16 schools
12 elementary schools
1 middle school
2 high schools
1 special campus
1 years of SEL implementation (SEL began in 2014–2015): 28 schools
19 elementary schools
6 middle schools
3 high schools
0 years of SEL implementation (SEL began in 2015–2016): 15 schools
11 elementary schools
2 middle schools
2 high schools
11
12
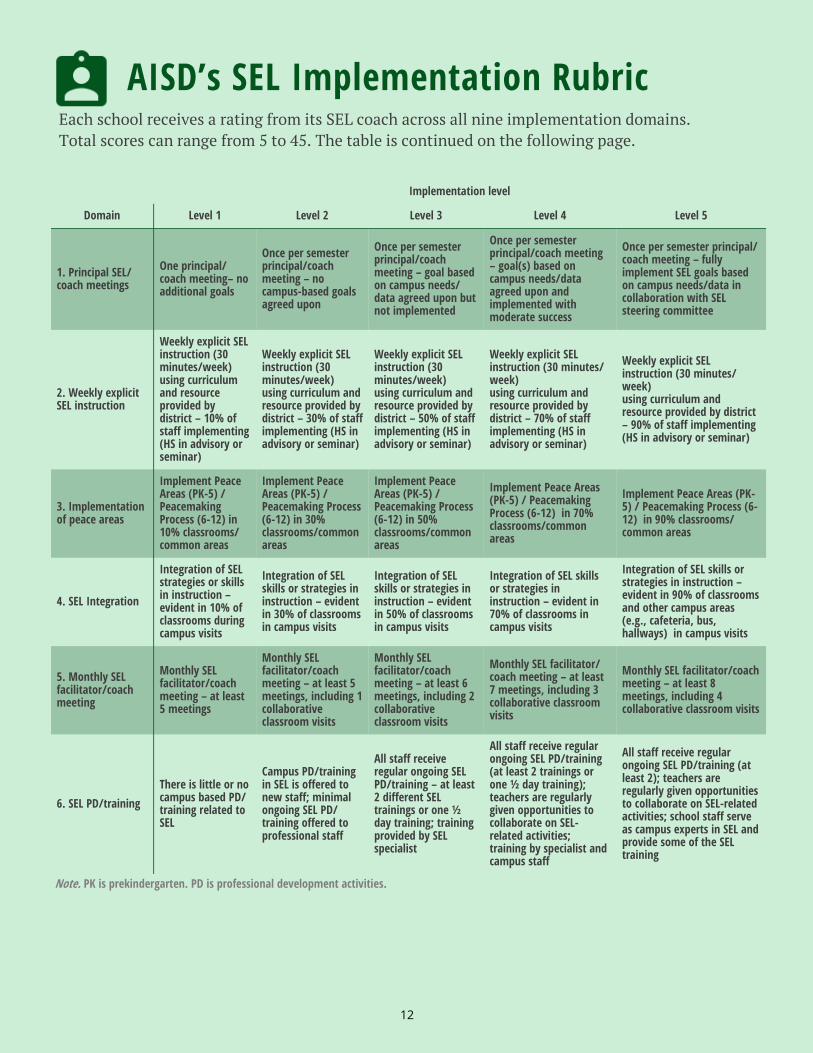
Implementation level
Domain Level 1 Level 2 Level 3 Level 4 Level 5
1. Principal SEL/coach meetings
One principal/coach meeting– no additional goals
Once per semester principal/coach meeting – no campus-based goals agreed upon
Once per semester principal/coach meeting – goal based on campus needs/data agreed upon but not implemented
Once per semester principal/coach meeting – goal(s) based on campus needs/data agreed upon and implemented with moderate success
Once per semester principal/coach meeting – fully implement SEL goals based on campus needs/data in collaboration with SEL steering committee
2. Weekly explicit SEL instruction
Weekly explicit SEL instruction (30 minutes/week) using curriculum and resource provided by district – 10% of staff implementing (HS in advisory or seminar)
Weekly explicit SEL instruction (30 minutes/week) using curriculum and resource provided by district – 30% of staff implementing (HS in advisory or seminar)
Weekly explicit SEL instruction (30 minutes/week) using curriculum and resource provided by district – 50% of staff implementing (HS in advisory or seminar)
Weekly explicit SEL instruction (30 minutes/week) using curriculum and resource provided by district – 70% of staff implementing (HS in advisory or seminar)
Weekly explicit SEL instruction (30 minutes/week) using curriculum and resource provided by district – 90% of staff implementing (HS in advisory or seminar)
3. Implementation of peace areas
Implement Peace Areas (PK-5) / Peacemaking Process (6-12) in 10% classrooms/common areas
Implement Peace Areas (PK-5) / Peacemaking Process (6-12) in 30% classrooms/common areas
Implement Peace Areas (PK-5) / Peacemaking Process (6-12) in 50% classrooms/common areas
Implement Peace Areas (PK-5) / Peacemaking Process (6-12) in 70% classrooms/common areas
Implement Peace Areas (PK-5) / Peacemaking Process (6-12) in 90% classrooms/common areas
4. SEL Integration
Integration of SEL strategies or skills in instruction – evident in 10% of classrooms during campus visits
Integration of SEL skills or strategies in instruction – evident in 30% of classrooms in campus visits
Integration of SEL skills or strategies in instruction – evident in 50% of classrooms in campus visits
Integration of SEL skills or strategies in instruction – evident in 70% of classrooms in campus visits
Integration of SEL skills or strategies in instruction – evident in 90% of classrooms and other campus areas (e.g., cafeteria, bus, hallways) in campus visits
5. Monthly SEL facilitator/coach meeting
Monthly SEL facilitator/coach meeting – at least 5 meetings
Monthly SEL facilitator/coach meeting – at least 5 meetings, including 1 collaborative classroom visits
Monthly SEL facilitator/coach meeting – at least 6 meetings, including 2 collaborative classroom visits
Monthly SEL facilitator/coach meeting – at least 7 meetings, including 3 collaborative classroom visits
Monthly SEL facilitator/coach meeting – at least 8 meetings, including 4 collaborative classroom visits
6. SEL PD/training
There is little or no campus based PD/training related to SEL
Campus PD/training in SEL is offered to new staff; minimal ongoing SEL PD/training offered to professional staff
All staff receive regular ongoing SEL PD/training – at least 2 different SEL trainings or one ½ day training; training provided by SEL specialist
All staff receive regular ongoing SEL PD/training (at least 2 trainings or one ½ day training); teachers are regularly given opportunities to collaborate on SEL-related activities; training by specialist and campus staff
All staff receive regular ongoing SEL PD/training (at least 2); teachers are regularly given opportunities to collaborate on SEL-related activities; school staff serve as campus experts in SEL and provide some of the SEL training
AISD’s SEL Implementation Rubric Each school receives a rating from its SEL coach across all nine implementation domains.
Total scores can range from 5 to 45. The table is continued on the following page.
12
Note. PK is prekindergarten. PD is professional development activities.
13
AISD’s SEL Implementation Rubric, cont.
Implementation level
Domain Level 1 Level 2 Level 3 Level 4 Level 5
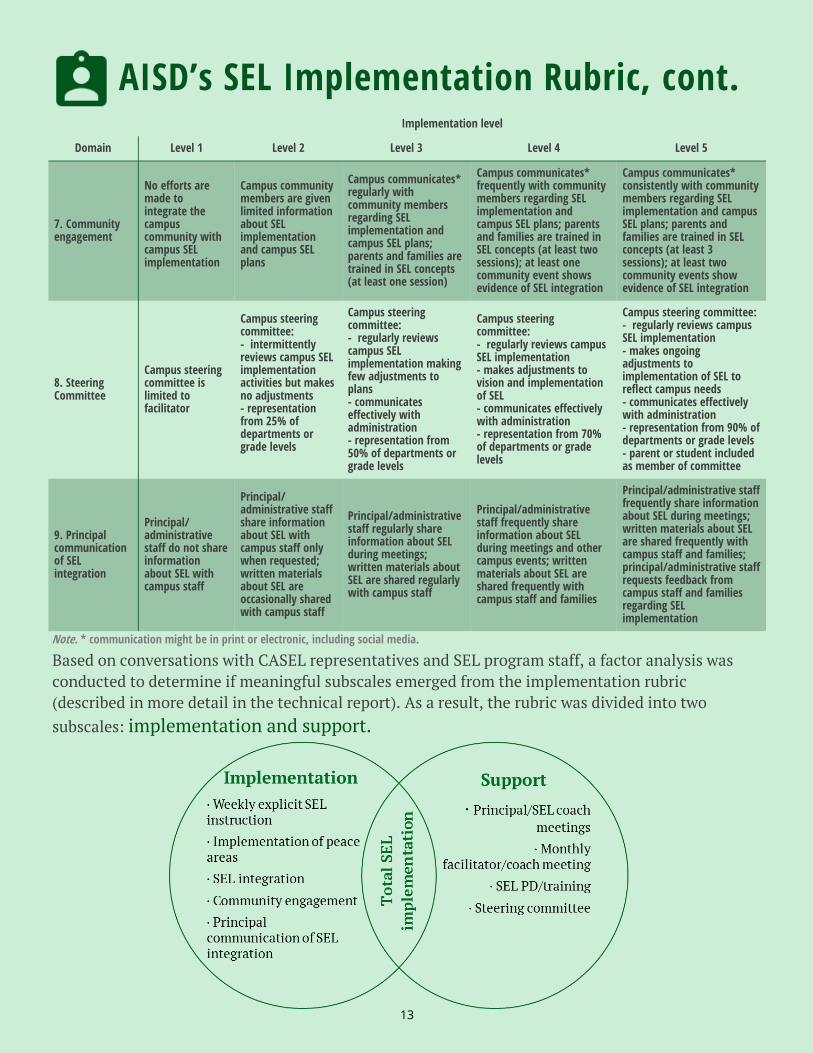
7. Community engagement
No efforts are made to integrate the campus community with campus SEL implementation
Campus community members are given limited information about SEL implementation and campus SEL plans
Campus communicates* regularly with community members regarding SEL implementation and campus SEL plans; parents and families are trained in SEL concepts (at least one session)
Campus communicates* frequently with community members regarding SEL implementation and campus SEL plans; parents and families are trained in SEL concepts (at least two sessions); at least one community event shows evidence of SEL integration
Campus communicates* consistently with community members regarding SEL implementation and campus SEL plans; parents and families are trained in SEL concepts (at least 3 sessions); at least two community events show evidence of SEL integration
8. Steering Committee
Campus steering committee is limited to facilitator
Campus steering committee: - intermittently reviews campus SEL implementation activities but makes no adjustments - representation from 25% of departments or grade levels
Campus steering committee: - regularly reviews campus SEL implementation making few adjustments to plans - communicates effectively with administration - representation from 50% of departments or grade levels
Campus steering committee: - regularly reviews campus SEL implementation - makes adjustments to vision and implementation of SEL - communicates effectively with administration - representation from 70% of departments or grade levels
Campus steering committee: - regularly reviews campus SEL implementation - makes ongoing adjustments to implementation of SEL to reflect campus needs - communicates effectively with administration - representation from 90% of departments or grade levels - parent or student included as member of committee
9. Principal communication of SEL integration
Principal/administrative staff do not share information about SEL with campus staff
Principal/administrative staff share information about SEL with campus staff only when requested; written materials about SEL are occasionally shared with campus staff
Principal/administrative staff regularly share information about SEL during meetings; written materials about SEL are shared regularly with campus staff
Principal/administrative staff frequently share information about SEL during meetings and other campus events; written materials about SEL are shared frequently with campus staff and families
Principal/administrative staff frequently share information about SEL during meetings; written materials about SEL are shared frequently with campus staff and families; principal/administrative staff requests feedback from campus staff and families regarding SEL implementation
13
Note. * communication might be in print or electronic, including social media.
Based on conversations with CASEL representatives and SEL program staff, a factor analysis was
conducted to determine if meaningful subscales emerged from the implementation rubric
(described in more detail in the technical report). As a result, the rubric was divided into two
subscales: implementation and support.
14
STAAR
2011–2012 to 2014–2015 STAAR reading and math performance in grades 3 through 8 were analyzed. Changes to end of course (EOC) exams precluded their use.
AISD Attendance data
AISD attendance data from 2011–2012 to 2014–2015 were used to compute the percentage of students with chronic absenteeism (i.e., 20 or more absences).
AISD Discipline data
The percentage of students with discretionary infractions (excluding mandatory removals) from 2010–2011 through 2014–2015 were analyzed.
AISD Student Climate Survey
Students in grades 3 through 11 participate in the annual AISD Student Climate Survey. SEL related items were analyzed from 2010–2011 through 2014–2015.
Staff Climate and Perceptions of SEL
The annual Teaching, Empowering, Leading, Learning (TELL) Staff Climate Survey is administered annually to all staff.
SEL Implementation Schools participating in SEL are rated by their SEL coach across nine domains considered integral to SEL implementation. Detailed information about the coach log is on p. 9 and 10.
Data Analyzed in This Report
SEL Implementation and Program Outcomes
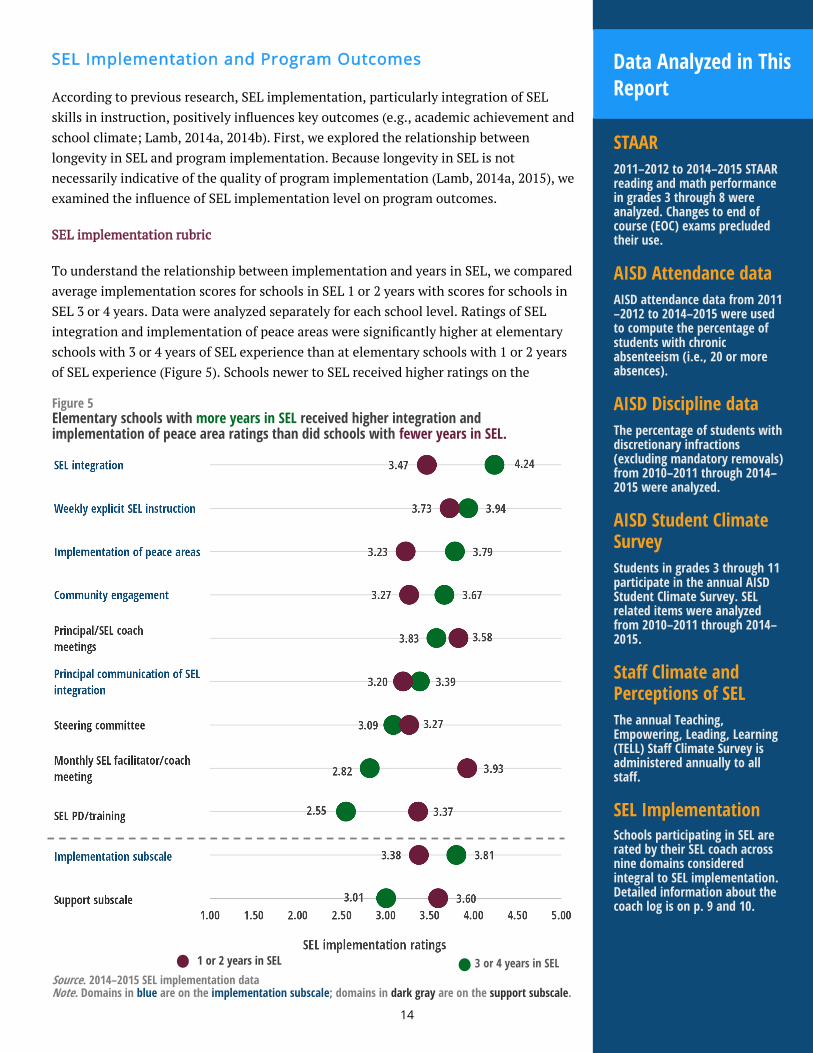
According to previous research, SEL implementation, particularly integration of SEL
skills in instruction, positively influences key outcomes (e.g., academic achievement and
school climate; Lamb, 2014a, 2014b). First, we explored the relationship between
longevity in SEL and program implementation. Because longevity in SEL is not
necessarily indicative of the quality of program implementation (Lamb, 2014a, 2015), we
examined the influence of SEL implementation level on program outcomes.
SEL implementation rubric
To understand the relationship between implementation and years in SEL, we compared
average implementation scores for schools in SEL 1 or 2 years with scores for schools in
SEL 3 or 4 years. Data were analyzed separately for each school level. Ratings of SEL
integration and implementation of peace areas were significantly higher at elementary
schools with 3 or 4 years of SEL experience than at elementary schools with 1 or 2 years
of SEL experience (Figure 5). Schools newer to SEL received higher ratings on the
Source. 2014–2015 SEL implementation data Note. Domains in blue are on the implementation subscale; domains in dark gray are on the support subscale.
3 or 4 years in SEL
Figure 5 Elementary schools with more years in SEL received higher integration and implementation of peace area ratings than did schools with fewer years in SEL.
1 or 2 years in SEL
15
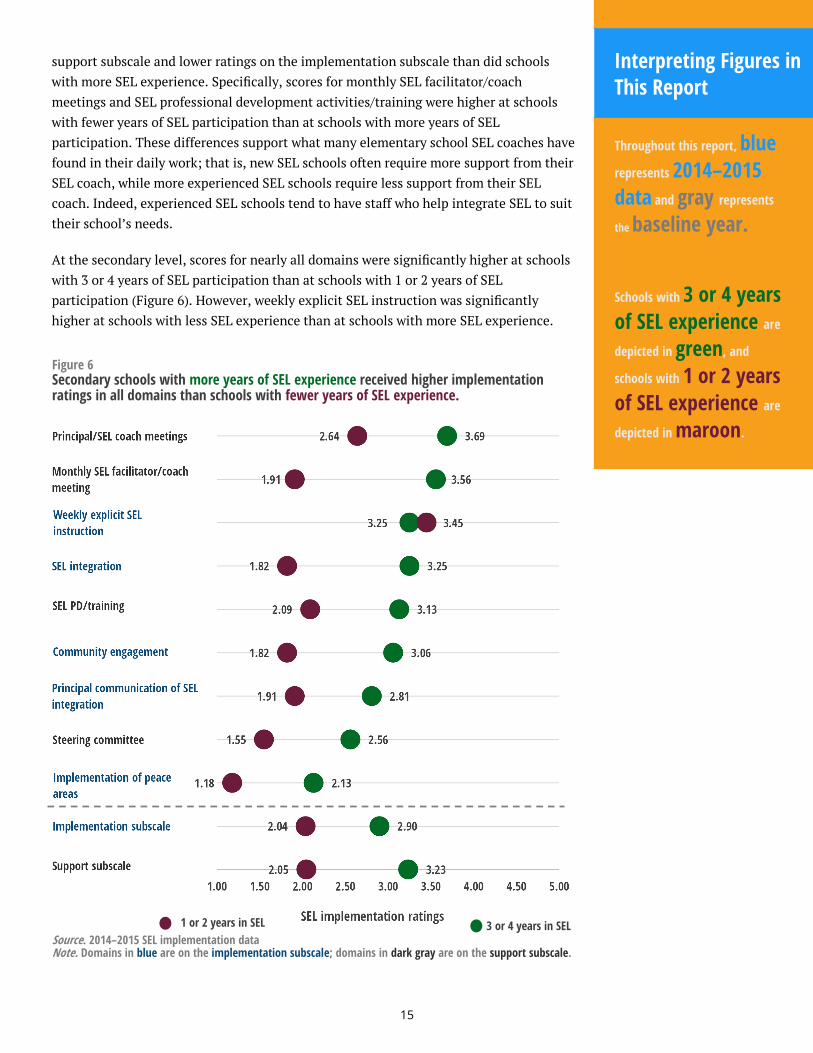
Throughout this report, blue
represents 2014–2015
data and gray represents
the baseline year.
Schools with 3 or 4 years
of SEL experience are
depicted in green, and
schools with 1 or 2 years
of SEL experience are
depicted in maroon.
Interpreting Figures in This Report
support subscale and lower ratings on the implementation subscale than did schools
with more SEL experience. Specifically, scores for monthly SEL facilitator/coach
meetings and SEL professional development activities/training were higher at schools
with fewer years of SEL participation than at schools with more years of SEL
participation. These differences support what many elementary school SEL coaches have
found in their daily work; that is, new SEL schools often require more support from their
SEL coach, while more experienced SEL schools require less support from their SEL
coach. Indeed, experienced SEL schools tend to have staff who help integrate SEL to suit
their school’s needs.
At the secondary level, scores for nearly all domains were significantly higher at schools
with 3 or 4 years of SEL participation than at schools with 1 or 2 years of SEL
participation (Figure 6). However, weekly explicit SEL instruction was significantly
higher at schools with less SEL experience than at schools with more SEL experience.
3 or 4 years in SEL 1 or 2 years in SEL
Figure 6 Secondary schools with more years of SEL experience received higher implementation ratings in all domains than schools with fewer years of SEL experience.
Source. 2014–2015 SEL implementation data Note. Domains in blue are on the implementation subscale; domains in dark gray are on the support subscale.
16
Ratings on the SEL implementation rubric were significantly higher at the elementary
school level than at the secondary school level, regardless of years in SEL, in the
following domains: peace areas, SEL integration, community engagement, steering
committee, principal communication of SEL integration, total SEL implementation
score, and the implementation and support subscales (see Appendix A for a table with
implementation scores, by level).
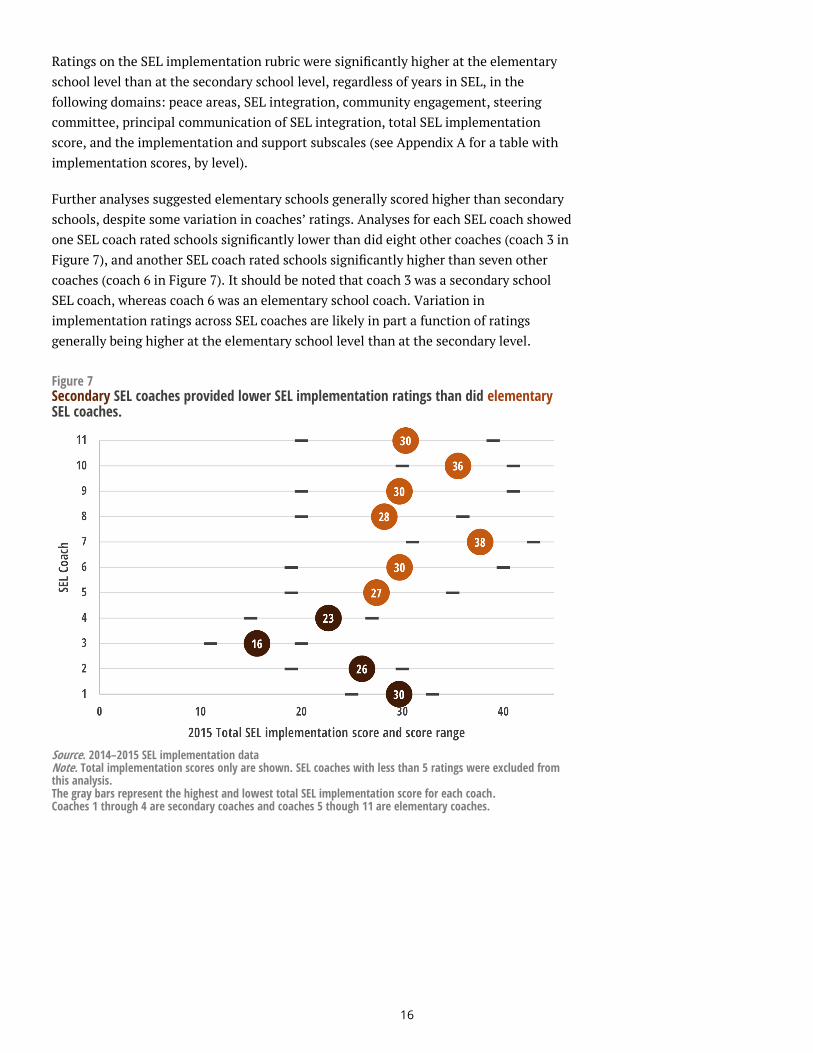
Further analyses suggested elementary schools generally scored higher than secondary
schools, despite some variation in coaches’ ratings. Analyses for each SEL coach showed
one SEL coach rated schools significantly lower than did eight other coaches (coach 3 in
Figure 7), and another SEL coach rated schools significantly higher than seven other
coaches (coach 6 in Figure 7). It should be noted that coach 3 was a secondary school
SEL coach, whereas coach 6 was an elementary school coach. Variation in
implementation ratings across SEL coaches are likely in part a function of ratings
generally being higher at the elementary school level than at the secondary level.
Figure 7 Secondary SEL coaches provided lower SEL implementation ratings than did elementary SEL coaches.
Source. 2014–2015 SEL implementation data Note. Total implementation scores only are shown. SEL coaches with less than 5 ratings were excluded from this analysis. The gray bars represent the highest and lowest total SEL implementation score for each coach. Coaches 1 through 4 are secondary coaches and coaches 5 though 11 are elementary coaches.
17
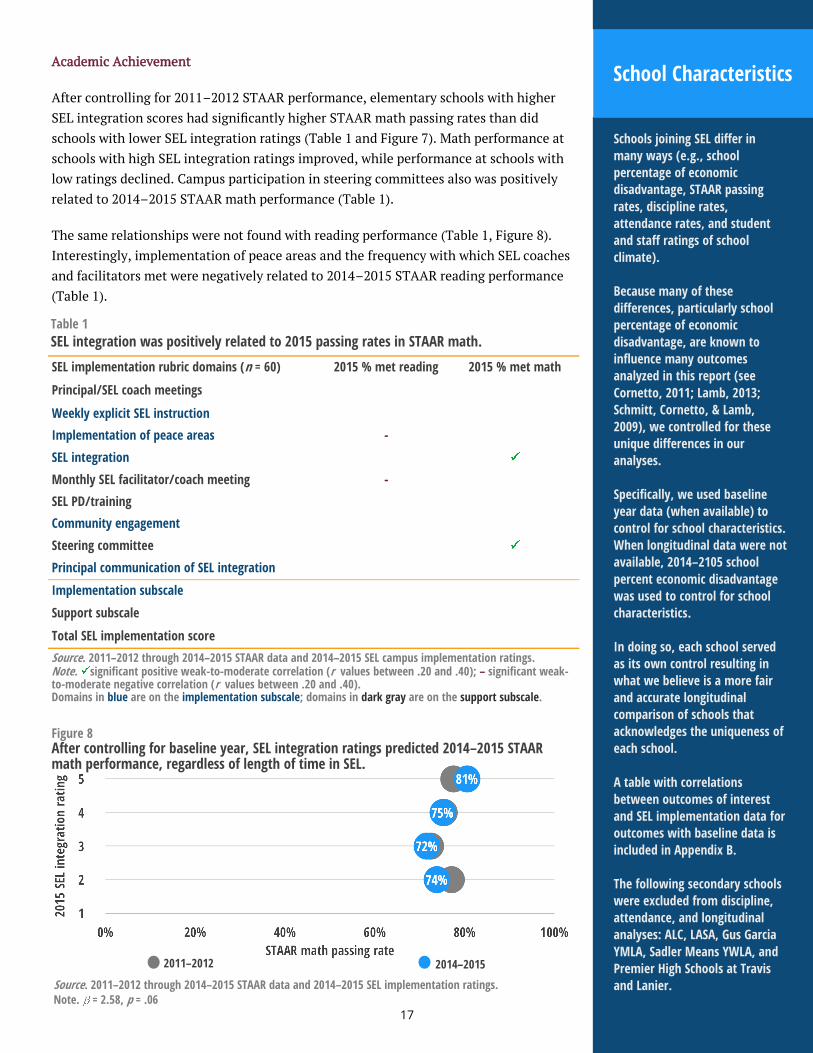
Academic Achievement
After controlling for 2011–2012 STAAR performance, elementary schools with higher
SEL integration scores had significantly higher STAAR math passing rates than did
schools with lower SEL integration ratings (Table 1 and Figure 7). Math performance at
schools with high SEL integration ratings improved, while performance at schools with
low ratings declined. Campus participation in steering committees also was positively
related to 2014–2015 STAAR math performance (Table 1).
The same relationships were not found with reading performance (Table 1, Figure 8).
Interestingly, implementation of peace areas and the frequency with which SEL coaches
and facilitators met were negatively related to 2014–2015 STAAR reading performance
(Table 1).
SEL implementation rubric domains (n = 60) 2015 % met reading 2015 % met math
Principal/SEL coach meetings
Weekly explicit SEL instruction
Implementation of peace areas -
SEL integration
Monthly SEL facilitator/coach meeting -
SEL PD/training
Community engagement
Steering committee
Principal communication of SEL integration
Implementation subscale
Support subscale
Total SEL implementation score
Table 1 SEL integration was positively related to 2015 passing rates in STAAR math.
Source. 2011–2012 through 2014–2015 STAAR data and 2014–2015 SEL campus implementation ratings. Note. significant positive weak-to-moderate correlation (r values between .20 and .40); – significant weak-to-moderate negative correlation (r values between .20 and .40). Domains in blue are on the implementation subscale; domains in dark gray are on the support subscale.
Figure 8 After controlling for baseline year, SEL integration ratings predicted 2014–2015 STAAR math performance, regardless of length of time in SEL.
2011–2012
Source. 2011–2012 through 2014–2015 STAAR data and 2014–2015 SEL implementation ratings. Note. = 2.58, p = .06
2014–2015
Schools joining SEL differ in
many ways (e.g., school
percentage of economic
disadvantage, STAAR passing
rates, discipline rates,
attendance rates, and student
and staff ratings of school
climate).
Because many of these
differences, particularly school
percentage of economic
disadvantage, are known to
influence many outcomes
analyzed in this report (see
Cornetto, 2011; Lamb, 2013;
Schmitt, Cornetto, & Lamb,
2009), we controlled for these
unique differences in our
analyses.
Specifically, we used baseline
year data (when available) to
control for school characteristics.
When longitudinal data were not
available, 2014–2105 school
percent economic disadvantage
was used to control for school
characteristics.
In doing so, each school served
as its own control resulting in
what we believe is a more fair
and accurate longitudinal
comparison of schools that
acknowledges the uniqueness of
each school.
A table with correlations
between outcomes of interest
and SEL implementation data for
outcomes with baseline data is
included in Appendix B.
The following secondary schools
were excluded from discipline,
attendance, and longitudinal
analyses: ALC, LASA, Gus Garcia
YMLA, Sadler Means YWLA, and
Premier High Schools at Travis
and Lanier.
School Characteristics
18
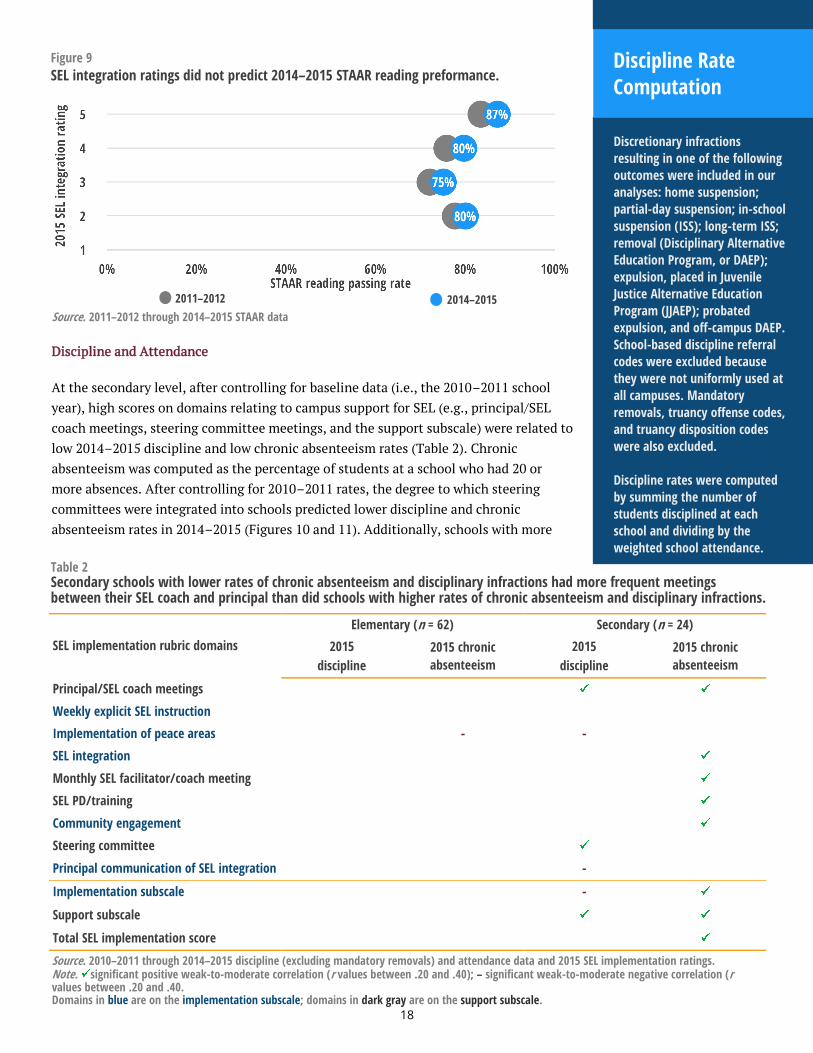
Discipline and Attendance
At the secondary level, after controlling for baseline data (i.e., the 2010–2011 school
year), high scores on domains relating to campus support for SEL (e.g., principal/SEL
coach meetings, steering committee meetings, and the support subscale) were related to
low 2014–2015 discipline and low chronic absenteeism rates (Table 2). Chronic
absenteeism was computed as the percentage of students at a school who had 20 or
more absences. After controlling for 2010–2011 rates, the degree to which steering
committees were integrated into schools predicted lower discipline and chronic
absenteeism rates in 2014–2015 (Figures 10 and 11). Additionally, schools with more
SEL implementation rubric domains
Elementary (n = 62) Secondary (n = 24)
2015
discipline
2015 chronic
absenteeism
2015
discipline
2015 chronic
absenteeism
Principal/SEL coach meetings
Weekly explicit SEL instruction
Implementation of peace areas - -
SEL integration
Monthly SEL facilitator/coach meeting
SEL PD/training
Community engagement
Steering committee
Principal communication of SEL integration -
Implementation subscale -
Support subscale
Total SEL implementation score
Table 2 Secondary schools with lower rates of chronic absenteeism and disciplinary infractions had more frequent meetings between their SEL coach and principal than did schools with higher rates of chronic absenteeism and disciplinary infractions.
Source. 2010–2011 through 2014–2015 discipline (excluding mandatory removals) and attendance data and 2015 SEL implementation ratings. Note. significant positive weak-to-moderate correlation (r values between .20 and .40); – significant weak-to-moderate negative correlation (r values between .20 and .40. Domains in blue are on the implementation subscale; domains in dark gray are on the support subscale.
Figure 9 SEL integration ratings did not predict 2014–2015 STAAR reading preformance.
Source. 2011–2012 through 2014–2015 STAAR data
2014–2015 2011–2012
Discretionary infractions
resulting in one of the following
outcomes were included in our
analyses: home suspension;
partial-day suspension; in-school
suspension (ISS); long-term ISS;
removal (Disciplinary Alternative
Education Program, or DAEP);
expulsion, placed in Juvenile
Justice Alternative Education
Program (JJAEP); probated
expulsion, and off-campus DAEP.
School-based discipline referral
codes were excluded because
they were not uniformly used at
all campuses. Mandatory
removals, truancy offense codes,
and truancy disposition codes
were also excluded.
Discipline rates were computed
by summing the number of
students disciplined at each
school and dividing by the
weighted school attendance.
Discipline Rate Computation
19
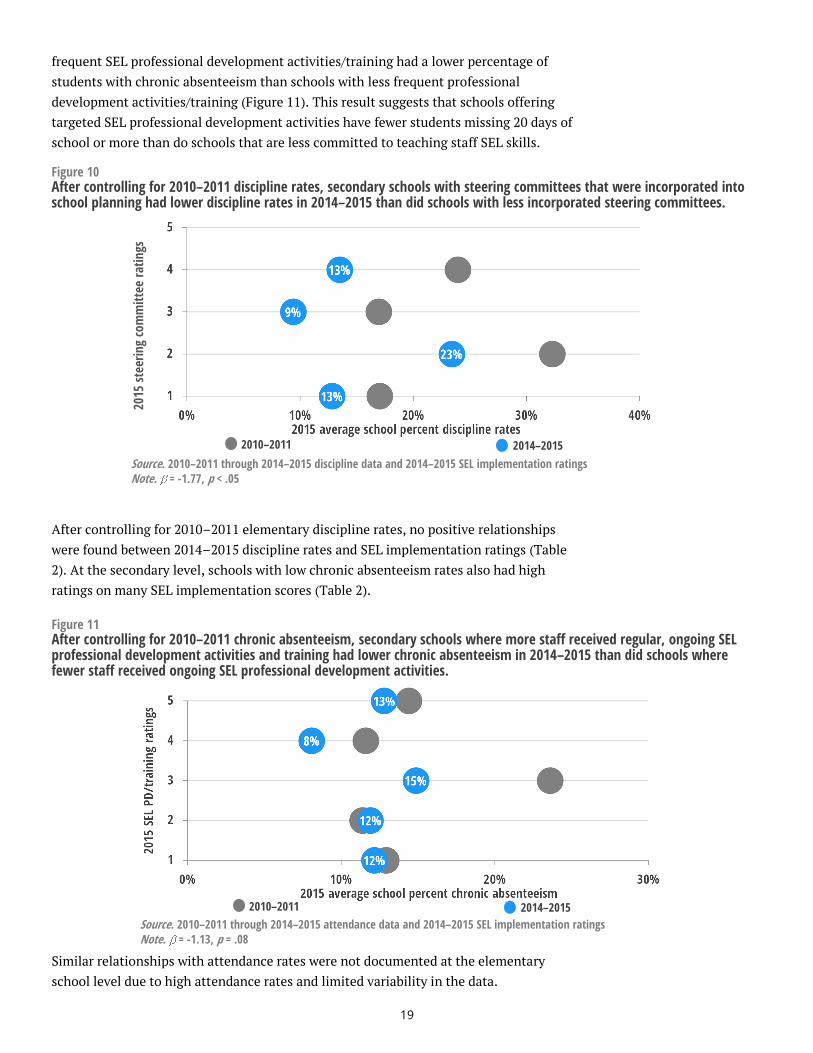
frequent SEL professional development activities/training had a lower percentage of
students with chronic absenteeism than schools with less frequent professional
development activities/training (Figure 11). This result suggests that schools offering
targeted SEL professional development activities have fewer students missing 20 days of
school or more than do schools that are less committed to teaching staff SEL skills.
After controlling for 2010–2011 elementary discipline rates, no positive relationships
were found between 2014–2015 discipline rates and SEL implementation ratings (Table
2). At the secondary level, schools with low chronic absenteeism rates also had high
ratings on many SEL implementation scores (Table 2).
Similar relationships with attendance rates were not documented at the elementary
school level due to high attendance rates and limited variability in the data.
Figure 10 After controlling for 2010–2011 discipline rates, secondary schools with steering committees that were incorporated into school planning had lower discipline rates in 2014–2015 than did schools with less incorporated steering committees.
Source. 2010–2011 through 2014–2015 discipline data and 2014–2015 SEL implementation ratings Note. = -1.77, p < .05
2014–2015 2010–2011
2015
ste
erin
g co
mm
itte
e ra
tin
gs
Source. 2010–2011 through 2014–2015 attendance data and 2014–2015 SEL implementation ratings Note. = -1.13, p = .08
Figure 11 After controlling for 2010–2011 chronic absenteeism, secondary schools where more staff received regular, ongoing SEL professional development activities and training had lower chronic absenteeism in 2014–2015 than did schools where fewer staff received ongoing SEL professional development activities.
2014–2015 2010–2011
20
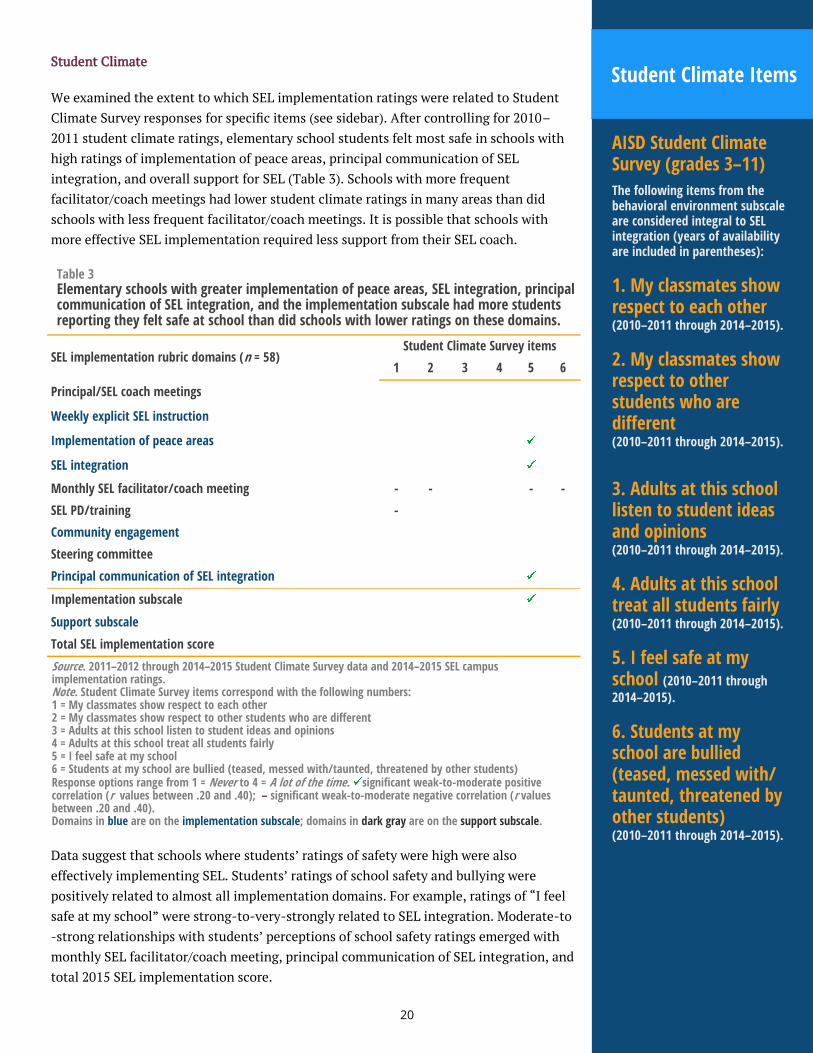
AISD Student Climate Survey (grades 3–11)
The following items from the behavioral environment subscale are considered integral to SEL integration (years of availability are included in parentheses):
1. My classmates show respect to each other (2010–2011 through 2014–2015).
2. My classmates show respect to other students who are different (2010–2011 through 2014–2015).
3. Adults at this school listen to student ideas and opinions (2010–2011 through 2014–2015).
4. Adults at this school treat all students fairly (2010–2011 through 2014–2015).
5. I feel safe at my school (2010–2011 through 2014–2015).
6. Students at my school are bullied (teased, messed with/taunted, threatened by other students) (2010–2011 through 2014–2015).
Student Climate Items Student Climate
We examined the extent to which SEL implementation ratings were related to Student
Climate Survey responses for specific items (see sidebar). After controlling for 2010–
2011 student climate ratings, elementary school students felt most safe in schools with
high ratings of implementation of peace areas, principal communication of SEL
integration, and overall support for SEL (Table 3). Schools with more frequent
facilitator/coach meetings had lower student climate ratings in many areas than did
schools with less frequent facilitator/coach meetings. It is possible that schools with
more effective SEL implementation required less support from their SEL coach.
Data suggest that schools where students’ ratings of safety were high were also
effectively implementing SEL. Students’ ratings of school safety and bullying were
positively related to almost all implementation domains. For example, ratings of “I feel
safe at my school” were strong-to-very-strongly related to SEL integration. Moderate-to
-strong relationships with students’ perceptions of school safety ratings emerged with
monthly SEL facilitator/coach meeting, principal communication of SEL integration, and
total 2015 SEL implementation score.
SEL implementation rubric domains (n = 58) Student Climate Survey items
1 2 3 4 5 6
Principal/SEL coach meetings
Weekly explicit SEL instruction
Implementation of peace areas
SEL integration
Monthly SEL facilitator/coach meeting - - - -
SEL PD/training -
Community engagement
Steering committee
Principal communication of SEL integration
Implementation subscale
Support subscale
Total SEL implementation score
Source. 2011–2012 through 2014–2015 Student Climate Survey data and 2014–2015 SEL campus implementation ratings. Note. Student Climate Survey items correspond with the following numbers: 1 = My classmates show respect to each other 2 = My classmates show respect to other students who are different 3 = Adults at this school listen to student ideas and opinions 4 = Adults at this school treat all students fairly 5 = I feel safe at my school 6 = Students at my school are bullied (teased, messed with/taunted, threatened by other students) Response options range from 1 = Never to 4 = A lot of the time. significant weak-to-moderate positive correlation (r values between .20 and .40); – significant weak-to-moderate negative correlation (r values between .20 and .40). Domains in blue are on the implementation subscale; domains in dark gray are on the support subscale.
Table 3 Elementary schools with greater implementation of peace areas, SEL integration, principal communication of SEL integration, and the implementation subscale had more students reporting they felt safe at school than did schools with lower ratings on these domains.
21
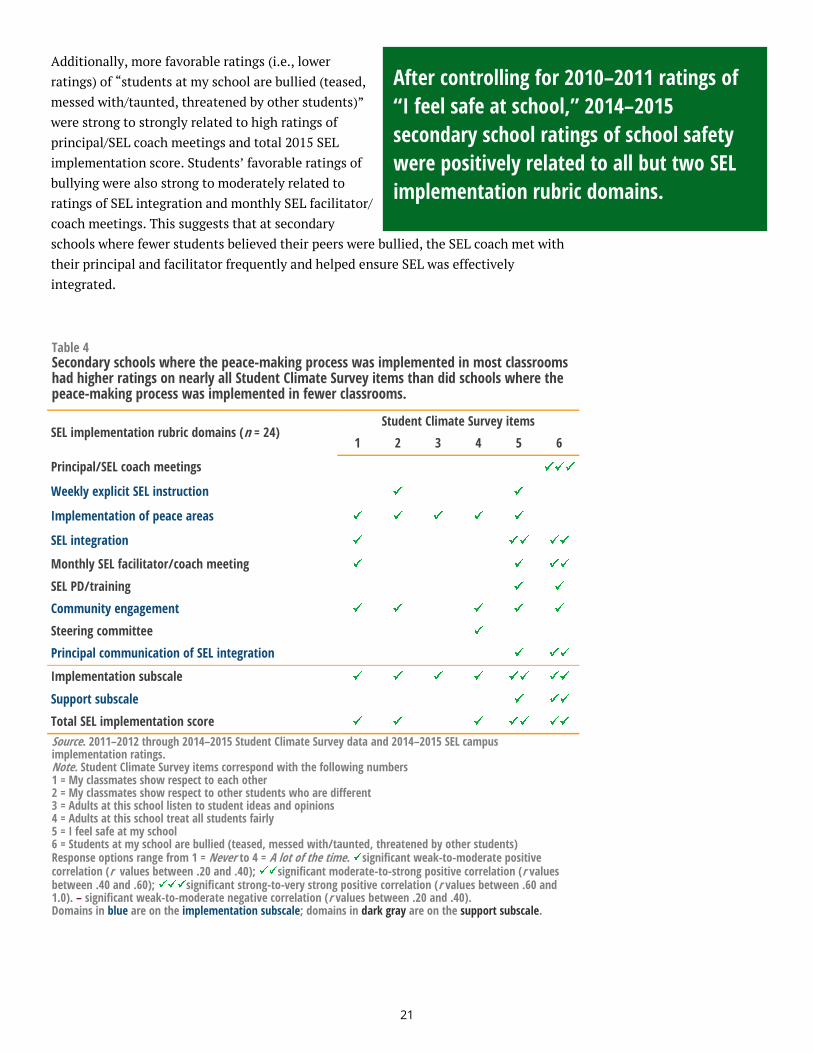
Additionally, more favorable ratings (i.e., lower
ratings) of “students at my school are bullied (teased,
messed with/taunted, threatened by other students)”
were strong to strongly related to high ratings of
principal/SEL coach meetings and total 2015 SEL
implementation score. Students’ favorable ratings of
bullying were also strong to moderately related to
ratings of SEL integration and monthly SEL facilitator/
coach meetings. This suggests that at secondary
schools where fewer students believed their peers were bullied, the SEL coach met with
their principal and facilitator frequently and helped ensure SEL was effectively
integrated.
SEL implementation rubric domains (n = 24) Student Climate Survey items
1 2 3 4 5 6
Principal/SEL coach meetings
Weekly explicit SEL instruction
Implementation of peace areas
SEL integration
Monthly SEL facilitator/coach meeting
SEL PD/training
Community engagement
Steering committee
Principal communication of SEL integration
Implementation subscale
Support subscale
Total SEL implementation score
Table 4 Secondary schools where the peace-making process was implemented in most classrooms had higher ratings on nearly all Student Climate Survey items than did schools where the peace-making process was implemented in fewer classrooms.
Source. 2011–2012 through 2014–2015 Student Climate Survey data and 2014–2015 SEL campus implementation ratings. Note. Student Climate Survey items correspond with the following numbers 1 = My classmates show respect to each other 2 = My classmates show respect to other students who are different 3 = Adults at this school listen to student ideas and opinions 4 = Adults at this school treat all students fairly 5 = I feel safe at my school 6 = Students at my school are bullied (teased, messed with/taunted, threatened by other students) Response options range from 1 = Never to 4 = A lot of the time. significant weak-to-moderate positive correlation (r values between .20 and .40); significant moderate-to-strong positive correlation (r values between .40 and .60); significant strong-to-very strong positive correlation (r values between .60 and 1.0). – significant weak-to-moderate negative correlation (r values between .20 and .40). Domains in blue are on the implementation subscale; domains in dark gray are on the support subscale.
After controlling for 2010–2011 ratings of
“I feel safe at school,” 2014–2015
secondary school ratings of school safety
were positively related to all but two SEL
implementation rubric domains.
22
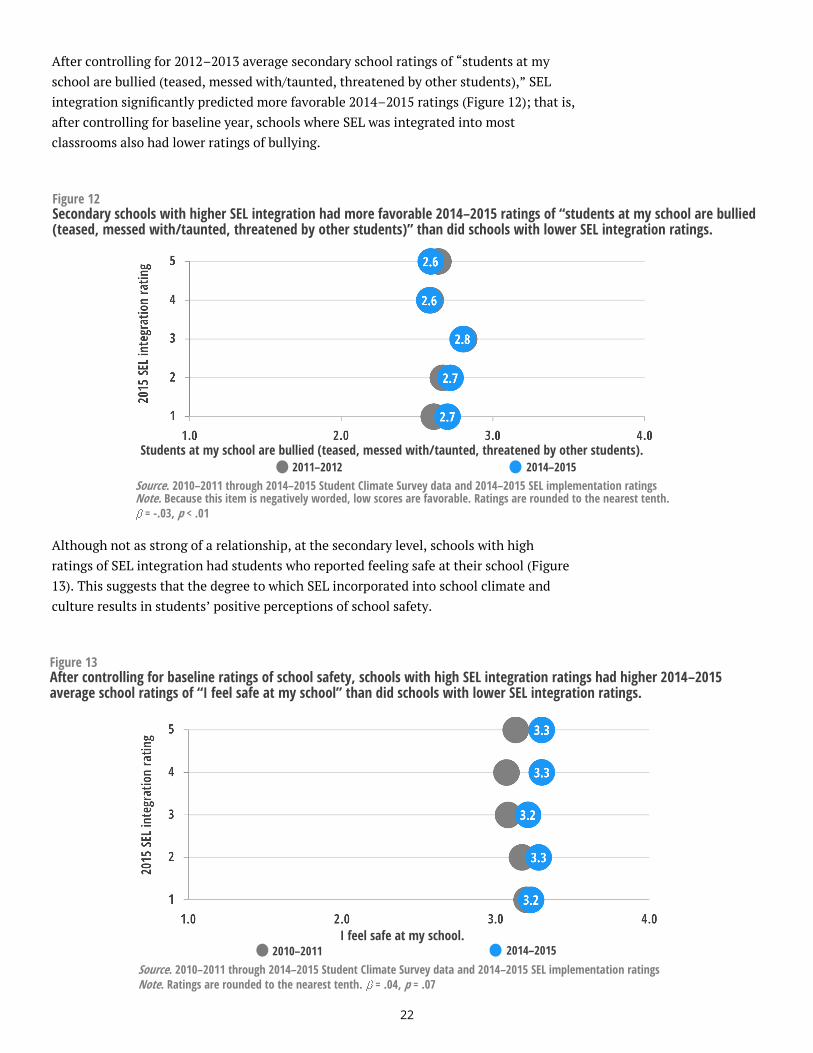
After controlling for 2012–2013 average secondary school ratings of “students at my
school are bullied (teased, messed with/taunted, threatened by other students),” SEL
integration significantly predicted more favorable 2014–2015 ratings (Figure 12); that is,
after controlling for baseline year, schools where SEL was integrated into most
classrooms also had lower ratings of bullying.
Although not as strong of a relationship, at the secondary level, schools with high
ratings of SEL integration had students who reported feeling safe at their school (Figure
13). This suggests that the degree to which SEL incorporated into school climate and
culture results in students’ positive perceptions of school safety.
Figure 12 Secondary schools with higher SEL integration had more favorable 2014–2015 ratings of “students at my school are bullied (teased, messed with/taunted, threatened by other students)” than did schools with lower SEL integration ratings.
2014–2015 2011–2012
Students at my school are bullied (teased, messed with/taunted, threatened by other students).
Source. 2010–2011 through 2014–2015 Student Climate Survey data and 2014–2015 SEL implementation ratings Note. Because this item is negatively worded, low scores are favorable. Ratings are rounded to the nearest tenth.
= -.03, p < .01
Source. 2010–2011 through 2014–2015 Student Climate Survey data and 2014–2015 SEL implementation ratings Note. Ratings are rounded to the nearest tenth. = .04, p = .07
Figure 13 After controlling for baseline ratings of school safety, schools with high SEL integration ratings had higher 2014–2015 average school ratings of “I feel safe at my school” than did schools with lower SEL integration ratings.
2010–2011 2014–2015 I feel safe at my school.
23
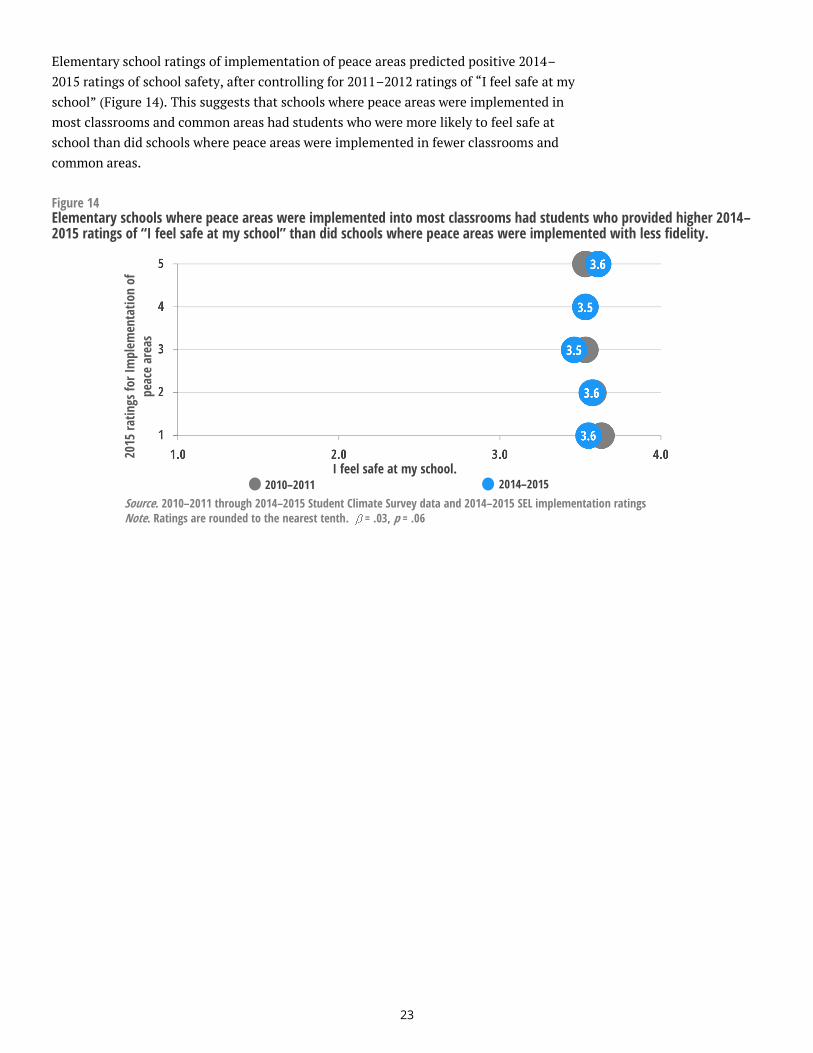
Elementary school ratings of implementation of peace areas predicted positive 2014–
2015 ratings of school safety, after controlling for 2011–2012 ratings of “I feel safe at my
school” (Figure 14). This suggests that schools where peace areas were implemented in
most classrooms and common areas had students who were more likely to feel safe at
school than did schools where peace areas were implemented in fewer classrooms and
common areas.
Source. 2010–2011 through 2014–2015 Student Climate Survey data and 2014–2015 SEL implementation ratings Note. Ratings are rounded to the nearest tenth. = .03, p = .06
2010–2011 2014–2015 I feel safe at my school.
Figure 14 Elementary schools where peace areas were implemented into most classrooms had students who provided higher 2014–2015 ratings of “I feel safe at my school” than did schools where peace areas were implemented with less fidelity.
2015
rat
ings
for
Im
plem
enta
tion
of
peac
e ar
eas
24
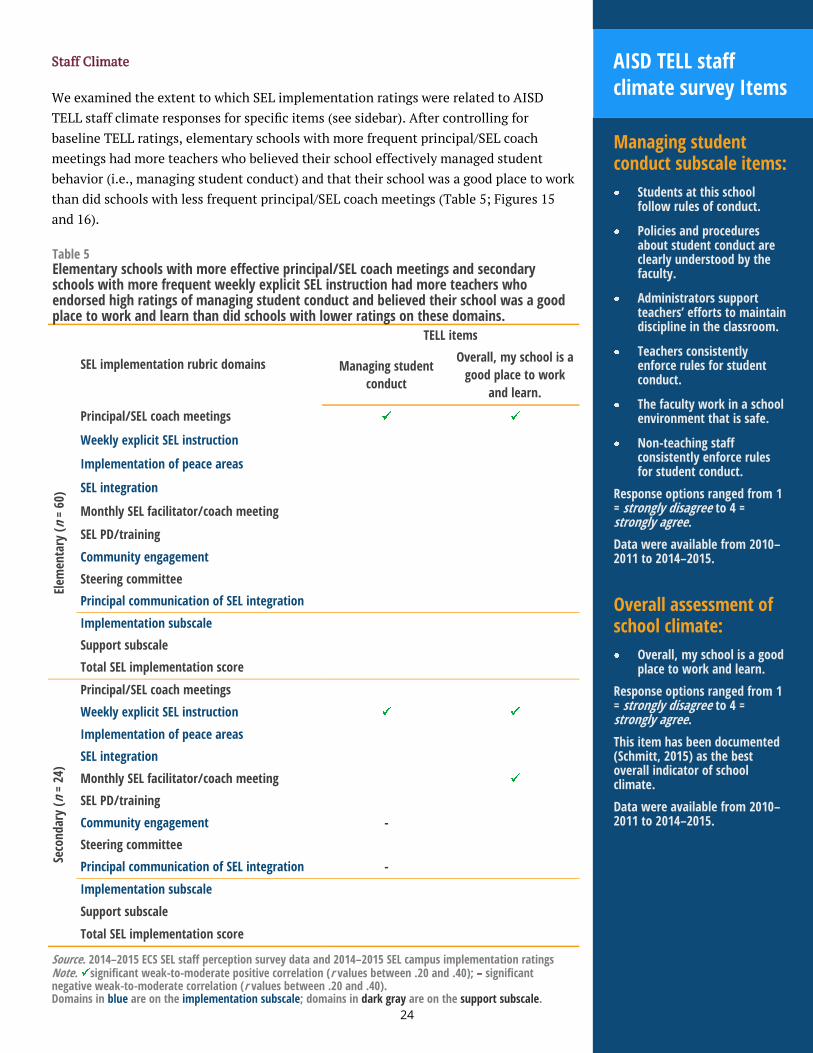
Staff Climate
We examined the extent to which SEL implementation ratings were related to AISD
TELL staff climate responses for specific items (see sidebar). After controlling for
baseline TELL ratings, elementary schools with more frequent principal/SEL coach
meetings had more teachers who believed their school effectively managed student
behavior (i.e., managing student conduct) and that their school was a good place to work
than did schools with less frequent principal/SEL coach meetings (Table 5; Figures 15
and 16).
SEL implementation rubric domains
TELL items
Managing student
conduct
Overall, my school is a
good place to work
and learn.
Principal/SEL coach meetings
Weekly explicit SEL instruction
Implementation of peace areas
SEL integration
Monthly SEL facilitator/coach meeting
SEL PD/training
Community engagement
Steering committee
Principal communication of SEL integration
Implementation subscale
Support subscale
Total SEL implementation score
Principal/SEL coach meetings
Weekly explicit SEL instruction
Implementation of peace areas
SEL integration
Monthly SEL facilitator/coach meeting
SEL PD/training
Community engagement -
Steering committee
Principal communication of SEL integration -
Implementation subscale
Support subscale
Total SEL implementation score
Table 5 Elementary schools with more effective principal/SEL coach meetings and secondary schools with more frequent weekly explicit SEL instruction had more teachers who endorsed high ratings of managing student conduct and believed their school was a good place to work and learn than did schools with lower ratings on these domains.
Elem
enta
ry (
n =
60)
Seco
nda
ry (
n =
24)
Source. 2014–2015 ECS SEL staff perception survey data and 2014–2015 SEL campus implementation ratings Note. significant weak-to-moderate positive correlation (r values between .20 and .40); – significant negative weak-to-moderate correlation (r values between .20 and .40). Domains in blue are on the implementation subscale; domains in dark gray are on the support subscale.
Managing student conduct subscale items:
Students at this school follow rules of conduct.
Policies and procedures about student conduct are clearly understood by the faculty.
Administrators support teachers’ efforts to maintain discipline in the classroom.
Teachers consistently enforce rules for student conduct.
The faculty work in a school environment that is safe.
Non-teaching staff consistently enforce rules for student conduct.
Response options ranged from 1 = strongly disagree to 4 = strongly agree.
Data were available from 2010–2011 to 2014–2015.
Overall assessment of school climate:
Overall, my school is a good place to work and learn.
Response options ranged from 1 = strongly disagree to 4 = strongly agree.
This item has been documented (Schmitt, 2015) as the best overall indicator of school climate.
Data were available from 2010–2011 to 2014–2015.
AISD TELL staff climate survey Items

25
That is, schools where the principal worked closely with their SEL coach to establish
clear SEL goals for their school seemed to have students and staff who worked together
to manage students’ behavior.
Additionally, elementary schools with more frequent principal/SEL coach meetings had
more favorable ratings of overall school climate than did schools with less frequent
principal/SEL coach meetings (Figure 16). In discussions with SEL coaches, many
believed that the degree to which the principal supported the program, modeled SEL
skills, and worked with SEL program staff to integrate SEL into daily activities was
integral to effective SEL implementation.
Figure 16 Elementary schools with more frequent principal and SEL coach meetings had higher ratings of “overall, my school is a good place to work and learn” than did schools with less frequent principal and SEL coach meetings.
Figure 15 Elementary schools with more frequent principal and SEL coach meetings had higher 2014–2015 average school ratings of managing student conduct than did schools with less frequent principal and SEL coach meetings.
2014–2015
Source. 2010–2011 through 2014–2015 TELL data and 2014–2015 SEL implementation data Note. Ratings are rounded to the nearest tenth. = .04, p < .05
2010–2011
2015
rat
ings
of
prin
cipa
l/SE
L co
ach
mee
tin
gs
Source. 2010–2011 through 2014–2015 TELL data and 2014–2015 SEL implementation data Note. Ratings are rounded to the nearest tenth. = .06, p < .05
2010–2011 2014–2015
Overall, my school is a good place to work and learn.
2015
rat
ings
of
prin
cipa
l/SE
L co
ach
mee
tin
gs
26
At the secondary level, schools with more frequent weekly explicit SEL instruction had
more teachers who believed their school managed student behavior and that their
school was a good place to work and learn than did schools with less frequent explicit
SEL instruction (Table 8). Additionally, after controlling for baseline school ratings of
managing student conduct, schools where most staff implemented SEL instruction had
staff who worked together to manage and support student behavior (Figure 17).
Interestingly, teachers ratings of managing student conduct were negatively related to
school ratings of community engagement and principal communication of SEL
integration.
Figure 17 Secondary schools with more frequent explicit SEL instruction had high staff ratings of managing student conduct than did schools with less frequent explicit SEL instruction.
Source. 2010–2011 through 2014–2015 TELL data and 2014–2015 SEL implementation data Note. Ratings are rounded to the nearest tenth. = .05, p = .06
2010–2011 2014–2015
2015
rat
ings
of
wee
kly
expl
icit
SEL
inst
ruct
ion
27
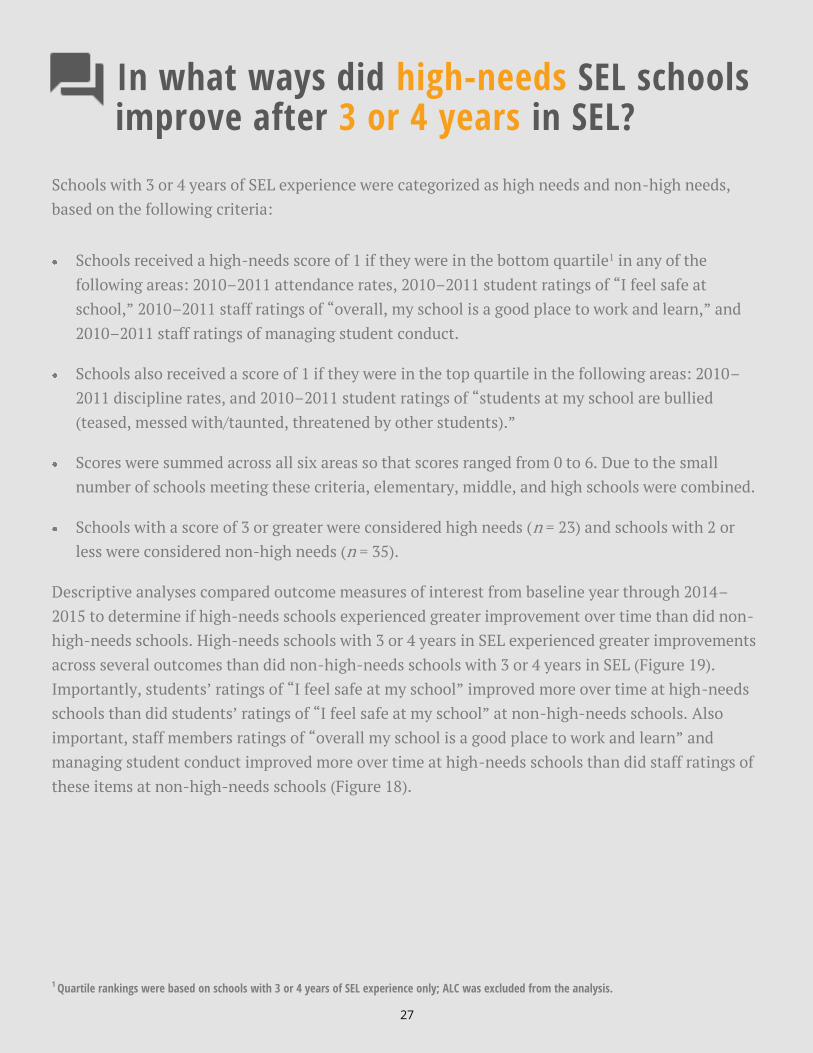
In what ways did high-needs SEL schools improve after 3 or 4 years in SEL?
Schools with 3 or 4 years of SEL experience were categorized as high needs and non-high needs,
based on the following criteria:
Schools received a high-needs score of 1 if they were in the bottom quartile1 in any of the
following areas: 2010–2011 attendance rates, 2010–2011 student ratings of “I feel safe at
school,” 2010–2011 staff ratings of “overall, my school is a good place to work and learn,” and
2010–2011 staff ratings of managing student conduct.
Schools also received a score of 1 if they were in the top quartile in the following areas: 2010–
2011 discipline rates, and 2010–2011 student ratings of “students at my school are bullied
(teased, messed with/taunted, threatened by other students).”
Scores were summed across all six areas so that scores ranged from 0 to 6. Due to the small
number of schools meeting these criteria, elementary, middle, and high schools were combined.
Schools with a score of 3 or greater were considered high needs (n = 23) and schools with 2 or
less were considered non-high needs (n = 35).
Descriptive analyses compared outcome measures of interest from baseline year through 2014–
2015 to determine if high-needs schools experienced greater improvement over time than did non-
high-needs schools. High-needs schools with 3 or 4 years in SEL experienced greater improvements
across several outcomes than did non-high-needs schools with 3 or 4 years in SEL (Figure 19).
Importantly, students’ ratings of “I feel safe at my school” improved more over time at high-needs
schools than did students’ ratings of “I feel safe at my school” at non-high-needs schools. Also
important, staff members ratings of “overall my school is a good place to work and learn” and
managing student conduct improved more over time at high-needs schools than did staff ratings of
these items at non-high-needs schools (Figure 18).
1 Quartile rankings were based on schools with 3 or 4 years of SEL experience only; ALC was excluded from the analysis.
27
28
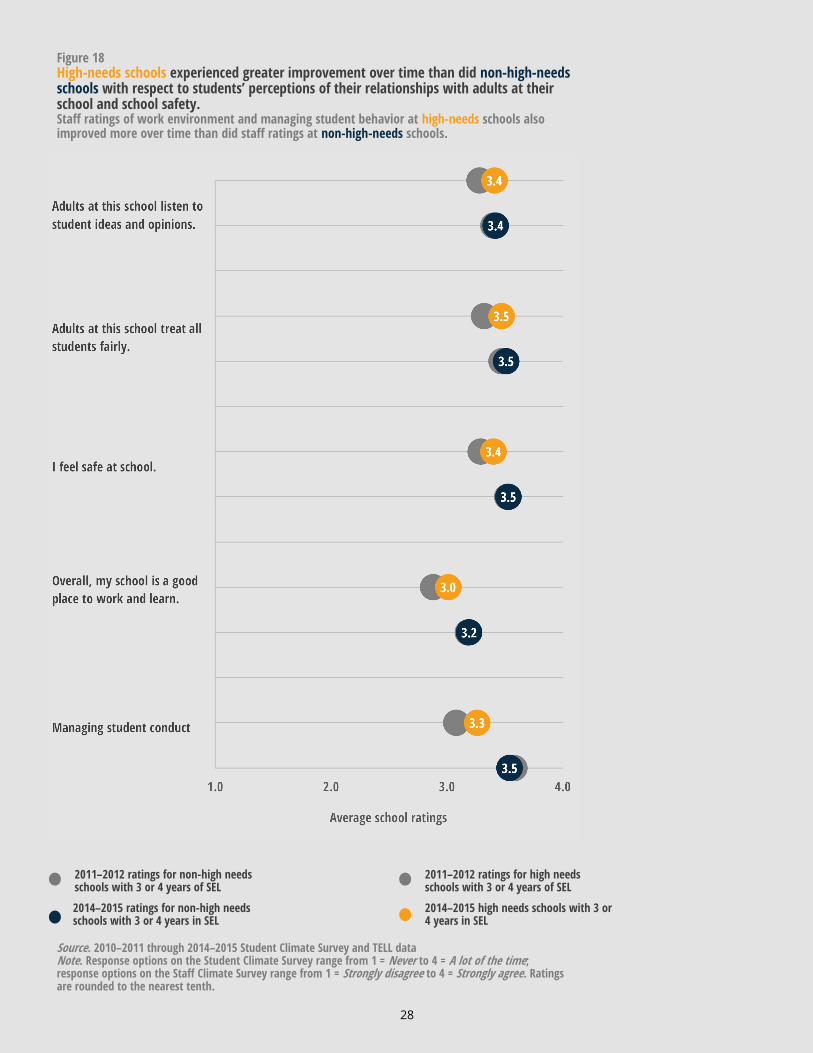
Source. 2010–2011 through 2014–2015 Student Climate Survey and TELL data Note. Response options on the Student Climate Survey range from 1 = Never to 4 = A lot of the time; response options on the Staff Climate Survey range from 1 = Strongly disagree to 4 = Strongly agree. Ratings are rounded to the nearest tenth.
2014–2015 ratings for non-high needs schools with 3 or 4 years in SEL
2014–2015 high needs schools with 3 or 4 years in SEL
Figure 18 High-needs schools experienced greater improvement over time than did non-high-needs schools with respect to students’ perceptions of their relationships with adults at their school and school safety. Staff ratings of work environment and managing student behavior at high-needs schools also improved more over time than did staff ratings at non-high-needs schools.
2011–2012 ratings for non-high needs schools with 3 or 4 years of SEL
2011–2012 ratings for high needs schools with 3 or 4 years of SEL
28
29
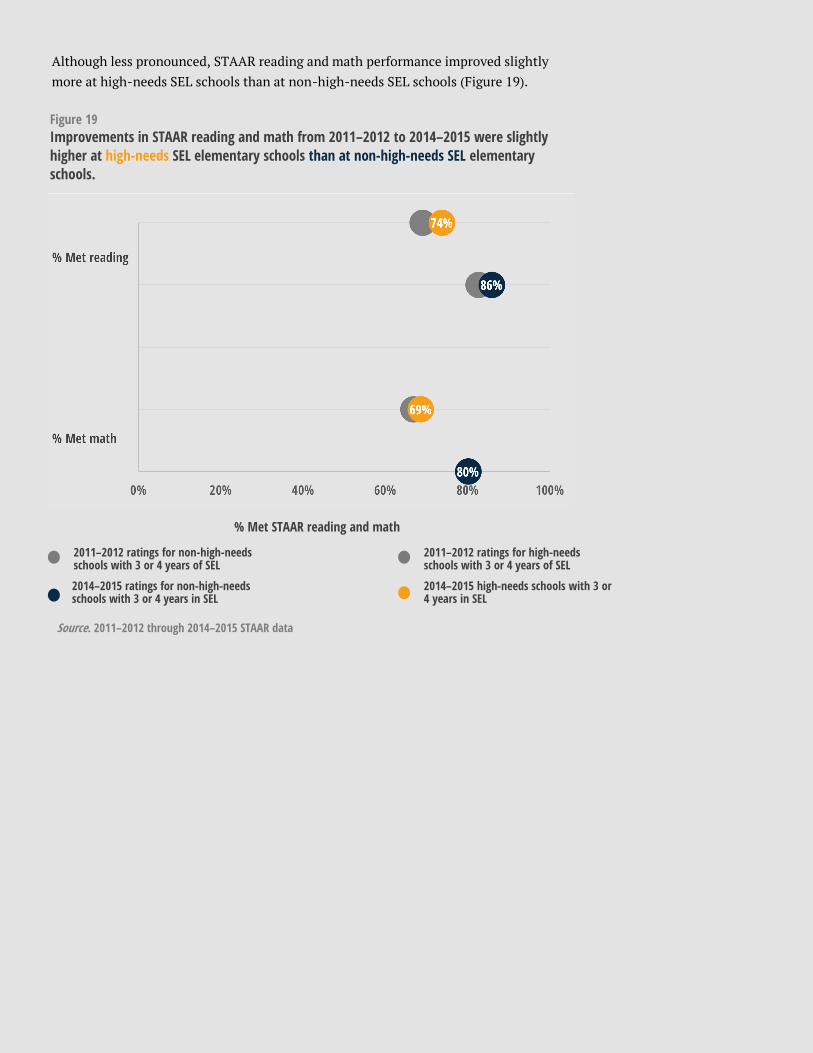
Although less pronounced, STAAR reading and math performance improved slightly
more at high-needs SEL schools than at non-high-needs SEL schools (Figure 19).
Source. 2011–2012 through 2014–2015 STAAR data
2014–2015 ratings for non-high-needs schools with 3 or 4 years in SEL
2014–2015 high-needs schools with 3 or 4 years in SEL
2011–2012 ratings for non-high-needs schools with 3 or 4 years of SEL
2011–2012 ratings for high-needs schools with 3 or 4 years of SEL
% Met STAAR reading and math
Figure 19 Improvements in STAAR reading and math from 2011–2012 to 2014–2015 were slightly
higher at high-needs SEL elementary schools than at non-high-needs SEL elementary
schools.

30
Conclusion
Collectively, these results reflect the hard work that SEL program staff have been doing
to implement SEL districtwide. Importantly, the degree to which schools integrated
SEL skills and implemented peace areas were related to several positive outcomes,
regardless of their length of time in SEL. For example, SEL integration predicted
elementary school students’ 2014-2015 performance in math and secondary students’
ratings of school safety and bullying. Implementation of peace areas was also
positively related to secondary students’ SEL skills in areas related to conflict
management. Additionally, implementation of peace areas predicted elementary
school students’ feelings of safety. SEL integration and implementation of peace areas
are elements of SEL that schools can target, regardless of their length of time in SEL, to
begin to see the positive effects of SEL. Finally, the results highlighting the gains made
by high-needs SEL schools further suggest that schools can make positive
improvements on their campus in areas related to SEL (e.g., school climate), regardless
of where they started or what background characteristics define their school. This
knowledge will help program staff work with schools in the coming years as the
program expands districtwide.
These results suggest that schools where teachers spend more time integrating SEL
into their daily lesson plans have teachers who believe their students follow the school
rules, and that school staff work together to enforce school rules. These two results
highlight a key area of SEL programming: creating a positive school climate that
teaches students how to manage their behaviors so teachers can focus more time on
teaching than on managing students’ behavior. Indeed, many SEL coaches believed
that once SEL skills are mastered in the classroom, teachers spend less time redirecting
students’ behavior and managing students’ problems and more time on actively
teaching their lessons. So, for example, students who can work out a problem on their
own in a peace area allow teachers to continue teaching the lesson and let those
students who are having a problem resolve it on their own, rather than stopping the
lesson for the entire class to intervene. Given that SEL has been implemented
districtwide, the degree to which campuses integrate SEL skills will become more
important to consider when examining program effects instead of longevity in the
program.
Future research
Forthcoming reports include an analysis of these same outcome variables over time,
and an analysis of students’ perceptions of their own SEL competencies and how they
relate to other outcomes of interest (e.g., student achievement data, attendance,
student report card data, student climate data).
PICTURE PLACEHOLDER
31
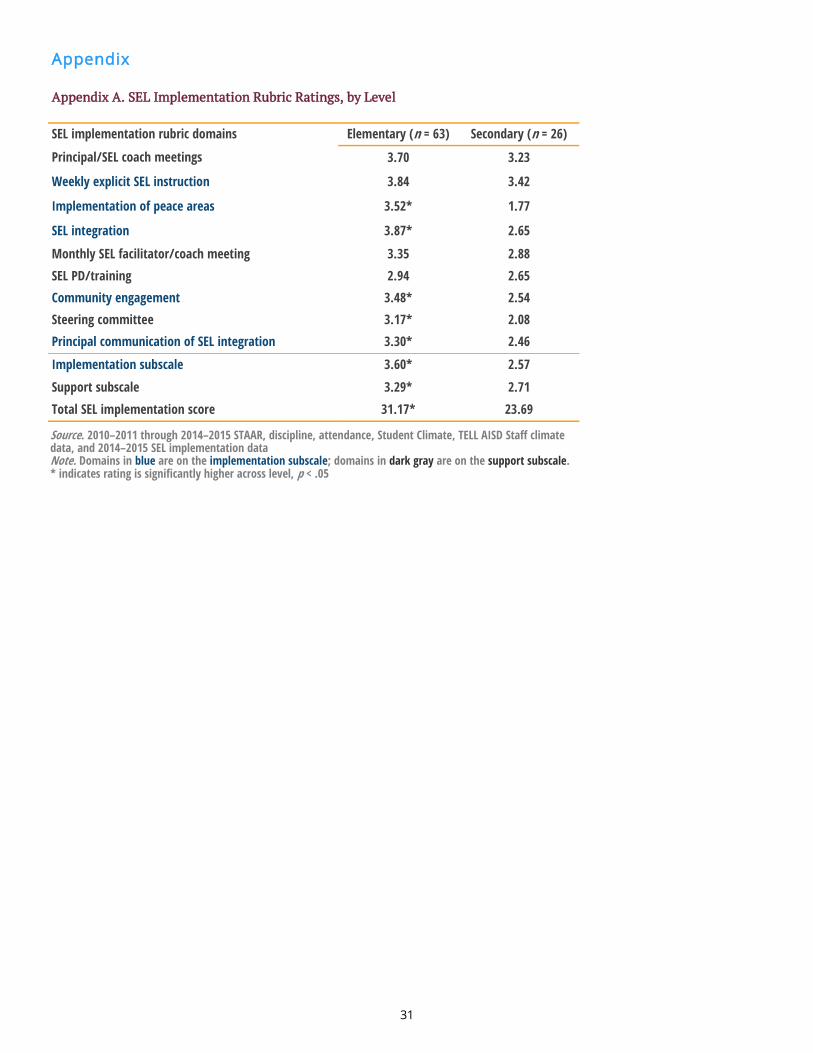
Appendix
Appendix A. SEL Implementation Rubric Ratings, by Level
Source. 2010–2011 through 2014–2015 STAAR, discipline, attendance, Student Climate, TELL AISD Staff climate data, and 2014–2015 SEL implementation data Note. Domains in blue are on the implementation subscale; domains in dark gray are on the support subscale. * indicates rating is significantly higher across level, p < .05
SEL implementation rubric domains Elementary (n = 63) Secondary (n = 26)
Principal/SEL coach meetings 3.70 3.23
Weekly explicit SEL instruction 3.84 3.42
Implementation of peace areas 3.52* 1.77
SEL integration 3.87* 2.65
Monthly SEL facilitator/coach meeting 3.35 2.88
SEL PD/training 2.94 2.65
Community engagement 3.48* 2.54
Steering committee 3.17* 2.08
Principal communication of SEL integration 3.30* 2.46
Implementation subscale 3.60* 2.57
Support subscale 3.29* 2.71
Total SEL implementation score 31.17* 23.69
32
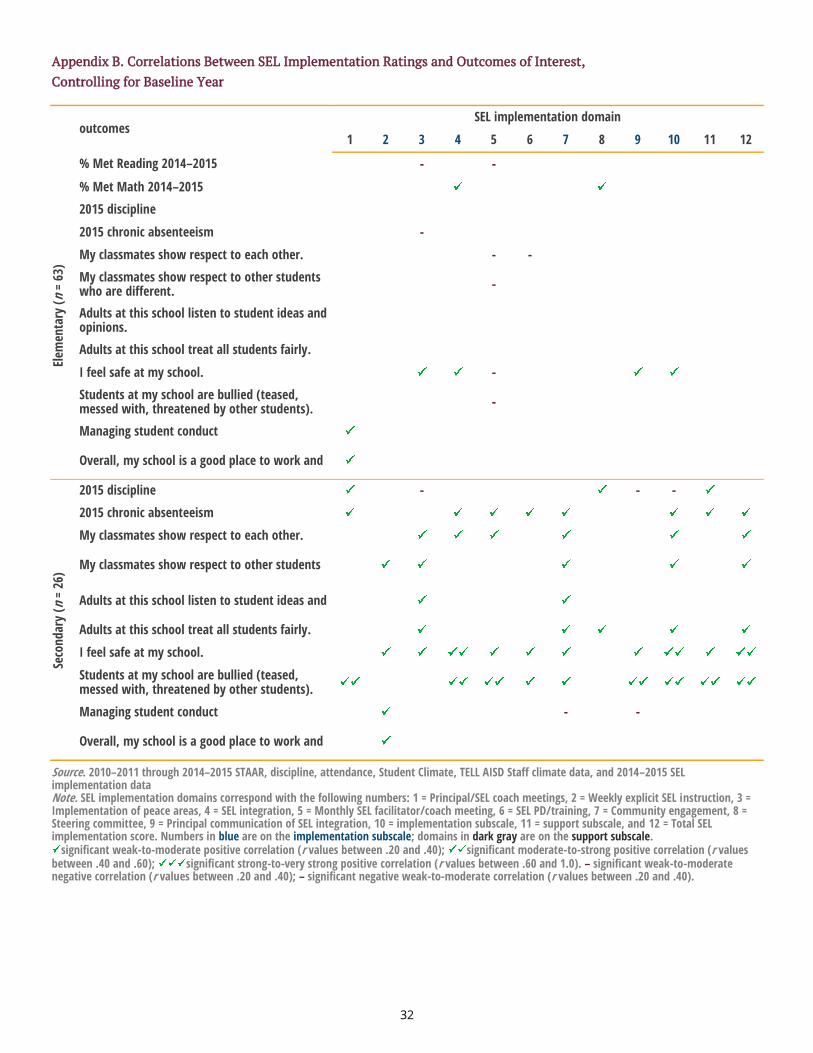
Appendix B. Correlations Between SEL Implementation Ratings and Outcomes of Interest,
Controlling for Baseline Year
outcomes SEL implementation domain
1 2 3 4 5 6 7 8 9 10 11 12
% Met Reading 2014–2015 - -
% Met Math 2014–2015
2015 discipline
2015 chronic absenteeism -
My classmates show respect to each other. - -
My classmates show respect to other students who are different.
-
Adults at this school listen to student ideas and opinions.
Adults at this school treat all students fairly.
I feel safe at my school. -
Students at my school are bullied (teased, messed with, threatened by other students).
-
Managing student conduct
Overall, my school is a good place to work and
2015 discipline - - -
2015 chronic absenteeism
My classmates show respect to each other.
My classmates show respect to other students
Adults at this school listen to student ideas and
Adults at this school treat all students fairly.
I feel safe at my school.
Students at my school are bullied (teased, messed with, threatened by other students).
Managing student conduct - -
Overall, my school is a good place to work and
Seco
nda
ry (
n =
26)
Source. 2010–2011 through 2014–2015 STAAR, discipline, attendance, Student Climate, TELL AISD Staff climate data, and 2014–2015 SEL implementation data Note. SEL implementation domains correspond with the following numbers: 1 = Principal/SEL coach meetings, 2 = Weekly explicit SEL instruction, 3 = Implementation of peace areas, 4 = SEL integration, 5 = Monthly SEL facilitator/coach meeting, 6 = SEL PD/training, 7 = Community engagement, 8 = Steering committee, 9 = Principal communication of SEL integration, 10 = implementation subscale, 11 = support subscale, and 12 = Total SEL implementation score. Numbers in blue are on the implementation subscale; domains in dark gray are on the support subscale.
significant weak-to-moderate positive correlation (r values between .20 and .40); significant moderate-to-strong positive correlation (r values between .40 and .60); significant strong-to-very strong positive correlation (r values between .60 and 1.0). – significant weak-to-moderate negative correlation (r values between .20 and .40); – significant negative weak-to-moderate correlation (r values between .20 and .40).
Elem
enta
ry (
n =
63)
33
References
Cornetto, K. (2011). 2011 TELL AISD Staff Climate Survey district report: Teaching,
empowering, leading and learning (DRE publication No. 10.62). Austin, TX:
Austin Independent School District.
Lamb, L. M. (2013). 2012-2013 Austin Independent School District (AISD) climate
update (DRE publication No. 12.94RB). Austin, TX: Austin Independent School
District.
Lamb, L. M. (2014a). Social Emotional Learning (SEL) Program update (DRE publication
No. 13.82). Austin, TX: Austin Independent School District.
Lamb, L. M. (2014b). 2013-2014 Social Emotional Learning (SEL) Update: Analysis of the
tri-Level program implementation rubric (DRE publication No. 13.91). Austin,
TX: Austin Independent School District.
Lamb, L. M. (2015). Social Emotional Learning (SEL): Key outcomes, 2010–2011 through
2014–2015 (DRE publication No. 14.139). Austin, TX: Austin Independent
School District.
Schmitt, L., Cornetto, K., & Lamb, L. (2009). Austin ISD 2008-2009 board level reports
(DRE publication No. 08.86, 08.87, 08.88). Austin TX: Austin Independent
School District.
Schmitt, L. (2015). Which Staff TELL AISD survey items best reflect school climate?
What are the longitudinal results for these items? (DRE publication No. 15.02
RB). Austin, TX: Austin Independent School District.
Funding
AISD supports SEL with a blend of public and private funding. Since 2010–
2011, approximately $3.8 million has been donated by individuals, foundations and
other external partners including the St. David's Foundation, NoVo Foundation, Buena
Vista Foundation, Jeanne and Michael Klein, Tapestry Foundation, W.K. Kellogg
Foundation, RGK Foundation, Lowe Foundation, Stratus Properties, Mary & Howard
Yancy, MFI Foundation, Sandy & Lisa Gottesman, Allergan Foundation, AK Reynolds
Foundation, and One Skye Foundation. In addition, SEL has been selected as a signature
initiative of the Austin Ed Fund.
AUSTIN INDEPENDENT SCHOOL DISTRICT
Author
Lindsay M. Lamb, Ph.D.
April 2010
Publication ##.##
December 2015
Publication 14.138
Department of Research and Evaluation 1111 West 6th Street, Suite D-350 | Austin, TX 78703-5338 512.414.1724 | fax: 512.414.1707 www.austinisd.org/dre | Twitter: @AISD_DRE