Social and economic impact of COVID-19
46
Social and economic impact of COVID-19 Eduardo Levy Yeyati Federico Filippini BROOKINGS GLOBAL WORKING PAPER #158 JUNE 2021
Transcript of Social and economic impact of COVID-19

Social and economic impact of COVID-19
Eduardo Levy YeyatiFederico Filippini
BROOKINGS GLOBAL WORKING PAPER #158JUNE 2021

Social and economic impact of COVID-19
Eduardo Levy Yeyati Nonresident Senior Fellow, Global Economy & Development at Brookings Institution
Dean of the School of Government at Universidad Torcuato Di Tella
Federico Filippini Visiting Professor at Universidad Torcuato Di Tella
June 2021 Brookings Global Working Paper #158
Global Economy and Development program at Brookings www.brookings.edu/global
Acknowledgements Prepared for The Independent Panel of the World Health Organization. We are grateful to Mauricio Cárdenas, Ricardo Hausmann, Anders Nordstrom, Rodrigo Valdés, Andrés Velasco, Alejandro Werner, Ernesto Zedillo and members of The Independent Panel for their useful comments, and Joaquin Marandino for excellent research assistance. The usual disclaimers apply.
The Brookings Institution is a nonprofit organization devoted to independent research and policy solutions. Its mission is to conduct high-quality, independent research and, based on that research, to provide innovative, practical recommendations for policymakers and the public. The conclusions and recommendations of any Brookings publication are solely those of its author(s), and do not reflect the views of the Institution, its management, or its other scholars.
Brookings recognizes that the value it provides is in its absolute commitment to quality, independence and impact. Activities supported by its donors reflect this commitment and the analysis and recommendations are not determined or influenced by any donation. A full list of contributors to the Brookings Institution can be found in the Annual Report at www.brookings.edu/about-us/annual-report/.

1. Introduction .......................................................................................................... 1
2. The costs of COVID-19 in 3 stages ........................................................................ 4
2.1 Stage 1: The macroeconomic impact ..................................................................... 4
2.2 Stage 2: The fiscal reaction ..................................................................................... 7
2.3 Stage 3: The recovery .............................................................................................. 9
3. Initial conditions ................................................................................................. 12
3.1 Fiscal space .......................................................................................................... 12
3.2 State capacity ........................................................................................................ 13
3.3 The labor market channel ...................................................................................... 14
3.4 Initial conditions and economic impact ................................................................ 16
4. Dealing with the pandemic ................................................................................... 20
4.1 Cross-country evidence on lockdowns and economic activity ............................. 21
4.2 Fiscal response to the pandemic .......................................................................... 24
5. The role of IFIs .................................................................................................... 31
6. Estimating the economic costs of the pandemic ................................................... 33
7. Final remarks ...................................................................................................... 36
References ............................................................................................................. 38
Brookings Institution 1
1. Introduction
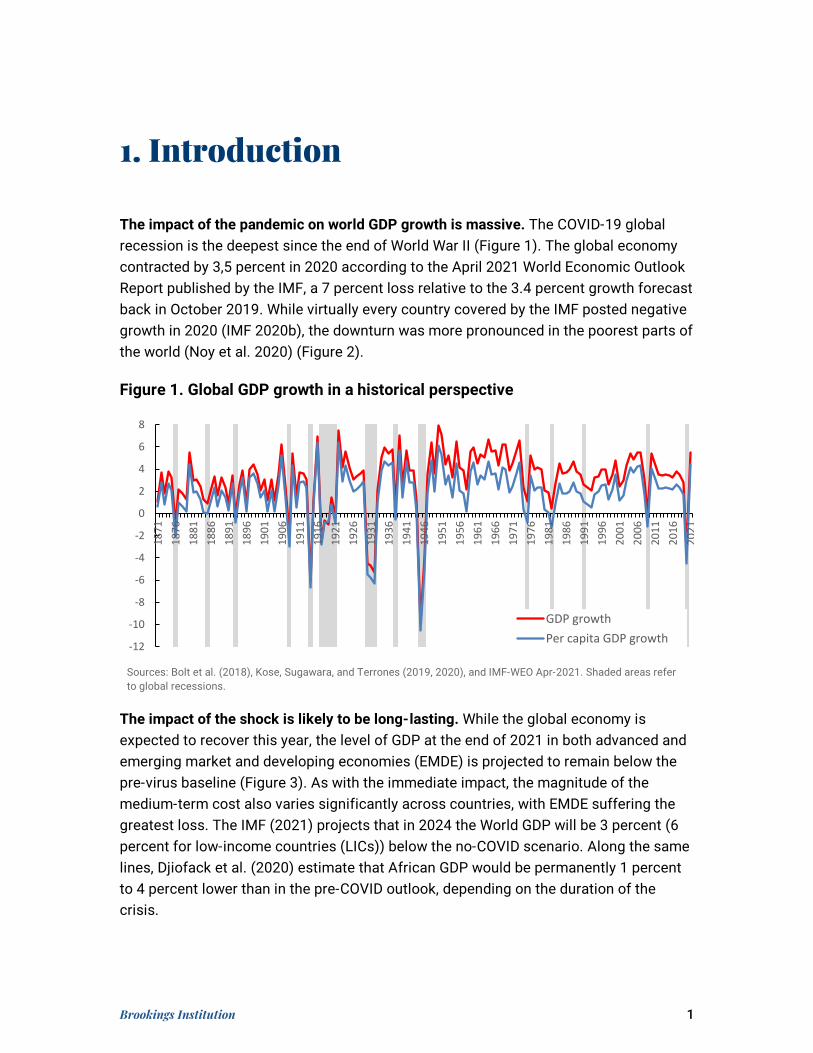
The impact of the pandemic on world GDP growth is massive. The COVID-19 global recession is the deepest since the end of World War II (Figure 1). The global economy contracted by 3,5 percent in 2020 according to the April 2021 World Economic Outlook Report published by the IMF, a 7 percent loss relative to the 3.4 percent growth forecast back in October 2019. While virtually every country covered by the IMF posted negative growth in 2020 (IMF 2020b), the downturn was more pronounced in the poorest parts of the world (Noy et al. 2020) (Figure 2).
Figure 1. Global GDP growth in a historical perspective
Sources: Bolt et al. (2018), Kose, Sugawara, and Terrones (2019, 2020), and IMF-WEO Apr-2021. Shaded areas refer to global recessions.
The impact of the shock is likely to be long-lasting. While the global economy is expected to recover this year, the level of GDP at the end of 2021 in both advanced and emerging market and developing economies (EMDE) is projected to remain below the pre-virus baseline (Figure 3). As with the immediate impact, the magnitude of the medium-term cost also varies significantly across countries, with EMDE suffering the greatest loss. The IMF (2021) projects that in 2024 the World GDP will be 3 percent (6 percent for low-income countries (LICs)) below the no-COVID scenario. Along the same lines, Djiofack et al. (2020) estimate that African GDP would be permanently 1 percent to 4 percent lower than in the pre-COVID outlook, depending on the duration of the crisis.
-12
-10
-8
-6
-4
-2
0
2
4
6
8
1871
1876
1881
1886
1891
1896
1901
1906
1911
1916
1921
1926
1931
1936
1941
1946
1951
1956
1961
1966
1971
1976
1981
1986
1991
1996
2001
2006
2011
2016
2021
GDP growthPer capita GDP growth

Brookings Institution 2
Figure 2. Global GDP growth 2020
Source: IMF-WEO Apr-2021. Note: AE = Advance economies; Emerging Asia ex. CHN = emerging and developing Asia excluding China; EM. Eur = Emerging and developing Europe; LAC = Latin America and the Caribbean; MECA = Middle East and Central Asia; SSA = sub-Saharan Africa.
Figure 3. Quarterly World GDP (GDP forecast in Jan-2020 vs. Jan-2021, 2019 Q1 = 100)
Source: IMF-WEO Jan-2021. Note: dashed lines indicated estimates from Jan-2020 World Economic Outlook Update.
The pandemic triggered a health and fiscal response unprecedented in terms of speed and magnitude. At a global scale, the fiscal support reached nearly $16 trillion (around 15 percent of global GDP) in 2020. However, the capacity of countries to implement such measures varied significantly. In this note, we identify three important pre-existing conditions that amplified the impact of the shock:
-9
-8
-7
-6
-5
-4
-3
-2
-1
0
Em. Asiaex. CHN
LAC SSA MECA EMDE World Em. Eur. AE China UnitedStates
80
85
90
95
100
105
110
115
120
2019
:Q4
2020
:Q1
2020
:Q2
2020
:Q3
2020
:Q4
2021
:Q1
2021
:Q2
2021
:Q3
2021
:Q4
2022
:Q1
2022
:Q2
2022
:Q3
2022
:Q4
China Aes EMDE

Brookings Institution 3
• Fiscal space: The capacity to support household and firms largely depends on access to international financial markets,
• State capacity: Fast and efficient implementation of policies to support household and firms requires a substantial state capacity and well-developed tax and transfer infrastructure; and
• Labor market structure: A large share of informal workers facing significant frictions to adopt remote working, and high levels of poverty and inequality, deepen the deleterious impact of the crisis.
Additionally, the speed and the strength of the recovery will be crucially dependent on the capacity of the governments to acquire and roll out the COVID-19 vaccines.
This paper presents a succinct summary of the existing economic literature on the economic and fiscal impact of the pandemic, and a preliminary estimate of the associated economic cost. It documents the incidence of initial conditions (with a particular focus on the role of the labor market channel) on the transmission of the shock and the speed and extent of the expected recovery, summarizes how countries attempted to attenuate the economic consequences and the international financial institutions assisted countries, reports preliminary accounts of medium-term COVID-related losses, and concludes with some forward-looking considerations based on the lessons learned in 2020.

Brookings Institution 4
2. The costs of COVID-19 in 3 stages
The COVID-19 shock can be interpreted as a combination of supply and demand shocks (Baqaee and Farhi, 2020; Caballero and Simsek, 2020; Guerrieri et al., 2020). The supply shock was mainly driven by the restriction of activities due to lockdowns and distancing measures to contain the spread of the virus, causing sectors to struggle to keep up with demand, while the demand shock reflected both the income effect suffered by workers in restricted activities, as well as the diminished mobility and changes in consumption patterns due to contagion concerns (IMF 2020b).
2.1 Stage 1: The macroeconomic impact
The COVID shock propagated quickly across countries causing a synchronized negative impact. More than 90 percent of the global economy experienced a contraction in per capita GDP, the highest share of countries simultaneously contracting since the Great Depression of 1930-32 (World Bank Global Outlook, 2020). The shock propagated through three key channels: (i) a disruption of global value chains, (ii)` restrictions to international mobility, which affected economies and activities differently, depending on their exposure and preparedness; and (iii) a reduction in cross-country remittances.
Trade experienced a short-lived but deep dive (Figure 4). Goods trade fell rapidly, adding to the economic decline in manufacturing countries, but recovered quickly, reflecting the substitution of demand from contact-intensive services (impaired by COVID-related restriction) to goods, and the considerable resilience of global value chains to transitory disruptions in the first semester (The World Bank, 2021). Predictably, services trade remained below pre-crisis levels due to travel restrictions.

Brookings Institution 5
Figure 4. Trade in Goods and Services (Index, t-1 = 100)
Source: The World Bank (2021). Note: Goods trade is in real terms from the CPB Netherlands Bureau for Economic Policy Analysis, whereas services trade is in values from the WTO. For global financial crisis, t = November 2008; for COVID-19, t = March 2020.
There is a positive correlation between the magnitude of growth revisions and the death toll (Figure 5). The IMF-WEO growth projections have been revised down from pre-COVID levels by 9 percent on (unweighted) average. To be sure, there are extremes cases, such as Peru or India, whose growth was revised downwards by more than 15 percentage points. In the next sections, we discuss some of the factors that allowed countries to fare better economically.
In addition, the death toll has been on average larger for high-income countries. This can be attributed to several reasons, including demographics, the degree of international integration, and the fact that most northern hemisphere countries went through two winters (and two therefore COVID waves).
As a result, there is a weak negative unconditional correlation between income and COVID impact. The finding, highlighted recently by Deaton (2021), is entirely due to the higher circulation of COVID in advanced economies. However, as we show in section 3 below, if the size of the COVID shock is controlled for, developed economies fared better than the rest. Moreover, as we document in section 6, once we measure the economic cost over the full cycle (including the recovery), or (even more so) when we consider a 10-year medium-term window, the correlation between income and economic losses is inverted: poor countries will ultimately face a larger cost.
75
80
85
90
95
100
t-1 t
t+1
t+2
t+3
t+4
t+5
t+6
t-1 t
t+1
t+2
t+3
t+4
t+5
t+6
Goods trade Services trade
Global financial crisisCOVID-19 pandemic

Brookings Institution 6
Figure 5. Growth forecast and income (areas proportional to population; in red, OECD countries)
Source: IMF (2020b) and Our World in Data. Note: Red bubbles refer to OECD countries.
Brazil
-20
-15
-10
-5
06 7 8 9 10 11
Grow
th re
visio
n (IM
F W
EO
Oct
-20
vs O
ct-1
9)
ln( GDP per capita in 2019, PPP)
Brazil
-2
-1
0
1
2
3
4
5
6
7
8
6 7 8 9 10 11Ln( D
eath
s per
o m
illio
n, 1
Apr
il 20
21)
ln( GDP per capita in 2019, PPP)
Bra
-20
-18
-16
-14
-12
-10
-8
-6
-4
-2
0-2 -1 0 1 2 3 4 5 6 7
Grow
th re
visio
n (IM
F W
EO O
ct-2
0 vs
Oct
-19)
ln( Deaths per million, 1 April 2021)

Brookings Institution 7
2.2 Stage 2: The fiscal reaction
The COVID-shock triggers an unprecedented and (very) heterogeneous response from governments across the globe (see section 4.2). The increase of the fiscal deficit in advance economies doubles that of emerging and middle-income countries and was five times larger than that of lower-income economies (Figure 6a). The sizable discretionary fiscal support, along with the contraction in output and fiscal revenues, led to an increase in government debts (Figure 6b).
Figure 6. Fiscal response (as percentage of GDP)
Panel a. Forecasts for General Government Gross Debt and Fiscal Balances, 2020 (Percent of GDP)
Panel b. Government debt (as percentage of GDP)
Source: The World Bank (2021) and IMF Fiscal Monitor Oct-2020
The risks stemming from deterioration of the fiscal front –funded by the issuance of debt or base money – were regarded as secondary for most governments in 2020. Governments focused on providing support for households and struggling companies. Corporate indebtedness will also likely increase as firms are facing an abrupt reduction in sales, particularly in the developing world (Figure 7).
104.7
56.3 45.0
125.5
62.2 48.8
-3.0-5.1 -4.1
-14.4-10.7
-6.2
Advanced Emerging Marketand Middle-
IncomeEconomies
Low-IncomeDevelopingCountries
Gross public debtFiscal balance
Jan-
2020
Oct
-202
0
0
50
100
150
1970 1980 1990 2000 2010 202
World
Advanced economies
EMDEs
Brookings Institution 8
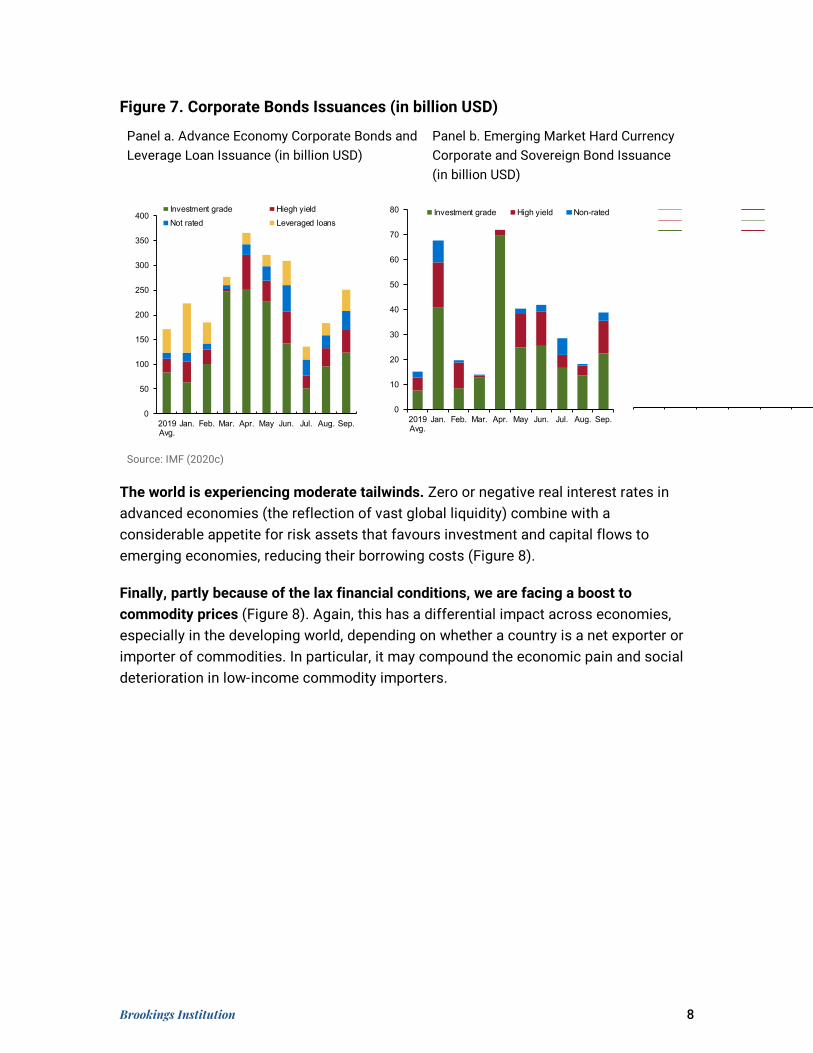
Figure 7. Corporate Bonds Issuances (in billion USD)
Panel a. Advance Economy Corporate Bonds and Leverage Loan Issuance (in billion USD)
Panel b. Emerging Market Hard Currency Corporate and Sovereign Bond Issuance (in billion USD)
Source: IMF (2020c)
The world is experiencing moderate tailwinds. Zero or negative real interest rates in advanced economies (the reflection of vast global liquidity) combine with a considerable appetite for risk assets that favours investment and capital flows to emerging economies, reducing their borrowing costs (Figure 8).
Finally, partly because of the lax financial conditions, we are facing a boost to commodity prices (Figure 8). Again, this has a differential impact across economies, especially in the developing world, depending on whether a country is a net exporter or importer of commodities. In particular, it may compound the economic pain and social deterioration in low-income commodity importers.
0
10
20
30
40
50
60
70
80
2019Avg.
Jan. Feb. Mar. Apr. May Jun. Jul. Aug. Sep.
Investment grade High yield Non-rated
0
50
100
150
200
250
300
350
400
2019Avg.
Jan. Feb. Mar. Apr. May Jun. Jul. Aug. Sep.
Investment grade Hiegh yieldNot rated Leveraged loans

Brookings Institution 9
Figure 8. International Financial Conditions
Source: Fred and Central Bank of Panamá based on JP Morgan, updated from LY-Valdés (2020).
2.3 Stage 3: The recovery
The global economy is recovering slowly from the lockdowns. The recent World Economic Outlook (WEO) update, published in April 2021, estimates a partial recovery in 2021 with a baseline scenario for growth at +5.8%. Economies are expected to operate with excess capacity in the medium term (Figure 9). Both advanced and developing economies are expected to operate below the 2019 level even after the 2021 rebound – pointing to modest growth in 2020–2025.
-1.5-1.0-0.50.00.51.01.52.02.53.03.5
Jan-
03
Jan-
05
Jan-
07
Jan-
09
Jan-
11
Jan-
13
Jan-
15
Jan-
17
Jan-
19
Jan-
21
10-Year US Treasury Inflation-Indexed rates
20
40
60
80
100
Jan-
19
Mar
-19
May
-19
Jul-1
9
Sep-
19
Nov
-19
Jan-
20
Mar
-20
May
-20
Jul-2
0
Sep-
20
Nov
-20
EnergyAgricultureMetals
Commodity price idexes (Index, 100=2010)

Brookings Institution 10
Figure 9. Losses: 2019:21 versus 2019-25
Source: IMF (2020)
At the time of this writing, the path of the post-COVID pandemic and its economic consequences remain uncertain and may be revised. One key source of uncertainty stems from the fact that the intermittent containment efforts could remain in force for longer than expected as the vaccination effort progresses slowly in some advanced countries and a new wave strikes in developing ones. Preliminary high-frequency indicators suggest that the rebound in economic activity may have faded somewhat in the first quarter of 2021 (Figure 10) as the second wave intensifies, both in the northern and southern hemispheres with the U.S. and China the notable exceptions. At any rate, the speed and success of the vaccination efforts will be critical to the timeliness and strength of the recovery.

Brookings Institution 11
Figure 10. High-frequency economic activity indicators
Note: Three-month moving average, annualized percent change; deviations from 50 for manufacturing PMI, unless noted otherwise. Source: IMF WEO Jan-2021
80
85
90
95
100
105
-20
-15
-10
-5
0
5
10
Industrial production
Manufacturing PMI: New orders
Monthly world trade volumes (seasonally adjusted, 2018=100, right scale)

Brookings Institution 12
3. Initial conditions
Initial conditions help explain the heterogenous impact, response, and outlooks across countries. The pandemic highlighted the traditional problems of the differential fiscal space to cope with the crisis through fiscal stimuli. It also revealed other equally critical aspects: the capacity of governments to buffer the health and economic impact of the pandemic, its ability to prioritize and allocate its scarce resources efficiently, and the crucial role played by the labor market structure in inhibiting the government effort to attenuate the impact of the shock. In this section, we address these three aspects.
3.1 Fiscal space
Fiscal stimuli are very heterogeneous across countries (Figure 11a). The fiscal stimulus during the COVID-19 shock was almost three times the amount observed during the Global Financial Crisis (Figure 11a). The amount of the fiscal stimulus was originally calibrated with the assumption that this would be an one-off shock. However, the second/third wave of new cases and the persistence of the economic damage implies that further support is needed for the vulnerable and should be extended in developed economies until relevant treatments and vaccines are made available to all.
Figure 11. Fiscal Stimuli
Panel a. Discretionary fiscal stimulus (as percentage of GDP)
Panel b. International fiscal response to COVID-19 (as percentage of 2019 GDP)
Source: IMF (2020b)
In addition to the fiscal space, an important dimension to understand the capacity of individual governments to cope with the pandemic is their political space. The political space is relevant to understand the interaction between lockdowns and the fiscal response. Specifically, stricter and more persistent lockdowns mean bigger downturns and stronger demands for support for household and firms (see section 4.1). The

Brookings Institution 13
(effectiveness of the) lockdown and the fiscal response are, in turn, conditioned by two aspects. On the one hand, many countries came from a period of increased civil unrest that may detract from the government´s ability to restrict mobility; on the other hand, besides the predictable economic toll of a protracted lockdown, most countries suffer from lockdown fatigue linked to diminished socialization and stressed mental health due to limited mobility or to the combination of working from home and managing virtual schooling for dependents. The diverse degree of compliance with protocols and restrictions also helps explain the heterogeneous efficacy of the fiscal response.
Looking ahead, the question is whether governments can provide additional support without causing renewed financial stress. The risk of financial turmoil has been magnified by the rise in debt levels due to the pandemic (Figure 11b). Less developed countries –running behind the vaccination race– that need more persistent fiscal stimuli to support the vulnerable, with more limited access to cheap finance, will face the toughest test in the months ahead.
3.2 State capacity
The COVID-19 crisis posed a critical challenge for policymakers as they need to quickly reach workers and households during the abrupt economic crisis. To support affected groups, policymakers require sufficient information (e.g. household composition, job status, income) and a reliable delivery framework to ensure that the support reaches the targeted population. These is particularly difficult for emerging and low-income countries with large informal sectors and therefore more limited sources of information on employment and labor income (IMF 2020e) (Figure 12a). Prady et al. (2020) estimate that on average, countries have spent an additional 1 percent of GDP to flex up pre-existing social programs—insurance, assistance, and labor market-related—and to introduce new ones (Figure 12b). Additional fiscal outlays have mainly financed the expansion of social assistance systems to cover over 1.8 billion people worldwide (Gentilini et al. 2020).

Brookings Institution 14
Figure 12. Fiscal Assistance
Panel a. Data availability across government registries (by income group)
Panel b. Existing, additional, and total population coverage of monetary transfers during Covid-19
Source: IMF (2020e) Source: Gentilini et al. (2020). Note: Sample of 57 countries. EAP: East Asia and Pacific; ECA: Europe and Central Asia; LAC: Latin America and Caribbean; MENA: Middle East and North Africa; SA: South Asia; SSA: Sub-Saharan Africa.
There are three key success factors for the rapid and efficient delivery of government responses. First, existing social support infrastructure, the presence of which help manage the support of vulnerable populations immediately and without the need for special response measures. Second, the strength of the digital delivery, considering that these reliefs ought to reach the beneficiaries during lockdowns –some of the quickest delivery vehicles have come from emerging markets (McKinsey 2020). Third, real-time tracking: because traditional monitoring systems based on field surveys cannot do this job (due to the low frequencies and lengthy-time lags of data collection and processing and the mobility restrictions imposed worldwide), policymakers should rely on nontraditional, advanced analytics and data (updated daily or weekly) to check the pulse on households and businesses.
3.3 The labor market channel
The pandemic is having disproportional effects on the most economically vulnerable segments of the population. The COVID-19 shock affected workers and labour income differently, depending on the composition of the workforce in terms of skills, occupation types, infrastructure (particularly, but not exclusively, those lacking connectivity), and type of contractual relations (particularly, informal and self-employed workers).
The precariousness of workforce influenced the economic impact through four distinct channels:

Brookings Institution 15
• The prevalence of informality and self-employment reduced the coverage of job retention and furlough schemes (Escobari and Levy Yeyati, 2020);
• The limited ability to assign resources and attenuate the negative shock to the labor income of precarious workers, in turn, reduced the effectiveness of social distancing (Levy Yeyati and Sartorio 2020) (Figure 13);
Figure 13. Smoothed Change in Employment by Occupation Wage Percentile
Sources: Levy Yeyati and Valdez (2020)
• The fact that lower-income economies have a lower share of jobs that can be done at home (Dingel and Neiman 2020):1 conditions to telework depend on occupation and worker characteristics (Bick et al. 2020) and on the available infrastructure (connectivity, access to digital devices, availability of childcare and school services); and
• The bias of COVID-related restrictions against primarily low-wage, high-contact jobs such as cleaning, hospitality, or health care activities, and the fact that remote jobs often require skills or hardware that low-wage workers may not have (Figure 14).
This pattern, if persistent, does not bode well for developing economies. Due in part to the relative abundance of unskilled labor, the adoption of new, labor-substituting technologies has been so far slower, resulting in the past in less labor market polarization (Busso et al. 2020) and even declining-to-stable inequality (Messina et al. 2020), albeit from very high levels and for varied reasons (Levy Yeyati et al. 2014). But
—
1 For instance, the authors show that, in 13 Latin American countries, the average share of teleworkable jobs is only 20%—ranging from 14% in Honduras to 27% in Uruguay.

Brookings Institution 16
this delay in the introduction of new technologies implies that the acceleration effect of the pandemic may be even more pronounced, as developing economies move swiftly from a labor-intensive production mix to streamlined processes with leaner payrolls. For this reason, the COVID impact on labor markets may be larger and more persistent than in the developed world due to the prevalence of unskilled labor.2
Figure 14. Lockdowns and Labour Market
Sources: Levy Yeyati and Valdez (2020)
3.4 Initial conditions and economic impact
What does the evidence say about the link between pre-existing conditions and the economic impact of the pandemic? Can it be argued that nations with adequate fiscal space, state capacity, and labor formality soften the impact of the COVID shock? Answering this question is not straightforward for several reasons. COVID-19 hit countries with an intensity that is hard to quantify empirically and, importantly, while the three identified pre-existing conditions amplified the impact, there were not more important than the actual disease burden in terms of both the economic and socials costs of coping with the pandemic.
While there is evidence that supports the hypothesis that pre-conditions help to mitigate the economic costs of the pandemic, no comprehensive study addresses all pre-conditions at once. This is in no small part because the economic costs are being continuously reassessed. An exception is The World Bank (2020), which shows that the —
2 When comparing the impact on employment based on unemployment data for 2020, one has to bear in mind that, in the US, the absence of furlough schemes implies that temporarily suspended workers are added to the unemployed; hence, the sharp peak and fast decline in temporary unemployment in the U.S. in the first semester, and the plateauing once labor dynamics start to reflect permanent layoffs.
Brookings Institution 17
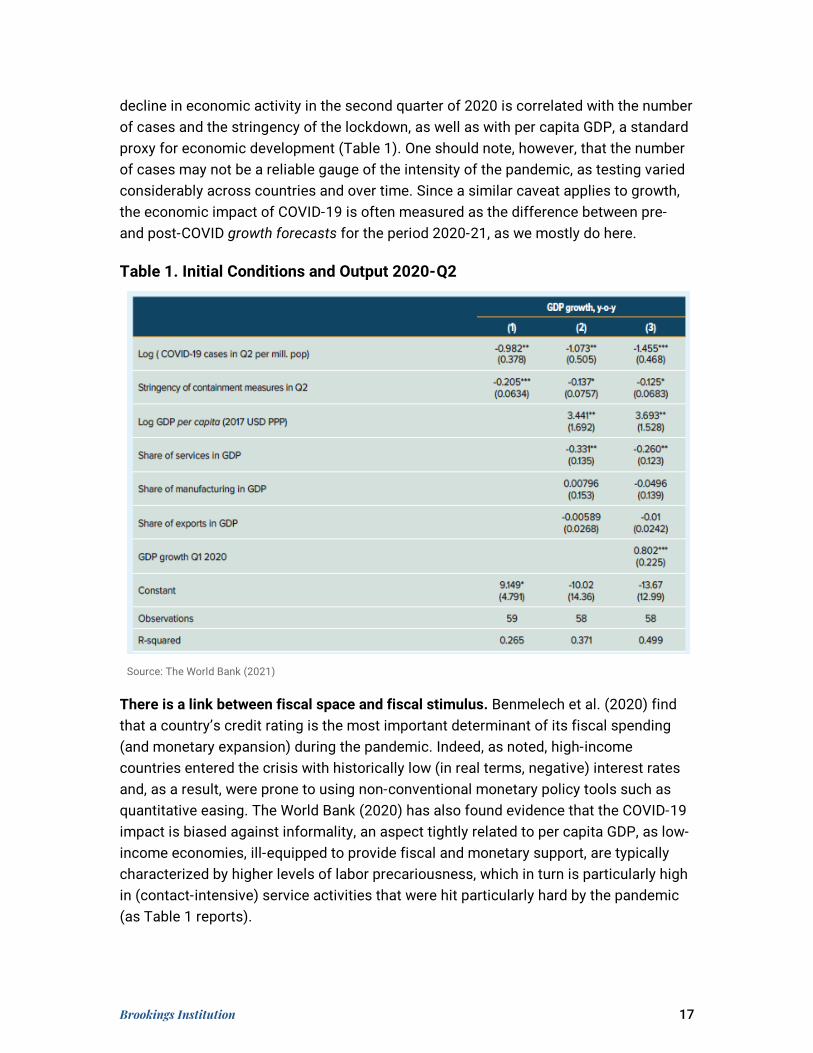
decline in economic activity in the second quarter of 2020 is correlated with the number of cases and the stringency of the lockdown, as well as with per capita GDP, a standard proxy for economic development (Table 1). One should note, however, that the number of cases may not be a reliable gauge of the intensity of the pandemic, as testing varied considerably across countries and over time. Since a similar caveat applies to growth, the economic impact of COVID-19 is often measured as the difference between pre- and post-COVID growth forecasts for the period 2020-21, as we mostly do here.
Table 1. Initial Conditions and Output 2020-Q2
Source: The World Bank (2021)
There is a link between fiscal space and fiscal stimulus. Benmelech et al. (2020) find that a country’s credit rating is the most important determinant of its fiscal spending (and monetary expansion) during the pandemic. Indeed, as noted, high-income countries entered the crisis with historically low (in real terms, negative) interest rates and, as a result, were prone to using non-conventional monetary policy tools such as quantitative easing. The World Bank (2020) has also found evidence that the COVID-19 impact is biased against informality, an aspect tightly related to per capita GDP, as low-income economies, ill-equipped to provide fiscal and monetary support, are typically characterized by higher levels of labor precariousness, which in turn is particularly high in (contact-intensive) service activities that were hit particularly hard by the pandemic (as Table 1 reports).

Brookings Institution 18
We find evidence that preconditions affect the economic response to COVID. Table 2 reports three basic models: columns 1 and 2 regress the growth forecast revision on cumulative deaths per million (a proxy for the intensity of the COVID shock), per capita GDP (alternatively, the labor informality rate), and interactions with the shock. Results are as expected: Per capita income mitigates the shock; informality amplifies it. Column 3 regresses a measure of working hours lost against the shock and the informality rate; the results point in the same direction: Onformality led to a greater hour loss. The findings are by no means definitive but are indicative that these two preconditions may have played amplifying roles.
Table 2. Initial Conditions and Economic Impact of the Covid Shock
(1) (2) (3)
Forecast revision
Forecast revision
Working hours lost
Ln (Deaths per million) 0.126 -5.266*** 0.341
(0.15) (-2.67) (0.35) Labor informality 14.49*** -11.77
(2.02) (-1.18) Ln (Deaths per million) x labor informality -3.181*** 4.788***
(-2.73) (2.73) Ln (GDP per capita) -1.382 (-1.29) Ln (Deaths per million) x Ln (GDP per capita) 0.393** (1.97) Constant -8.212* 13.61 2.917 (-1.46) (1.29) (0.45) Observations 66 65 64 R2 0.222 0.261 0.463
Source: Authors’ estimations based on IMF-WEO, ILO, Ourworldindata.org.
There seems to be a weak link between state capacity and economic performance under COVID. The role of state capacity is more difficult to define and, as a result, less often researched.3 Here, as a proxy for the lack of state capacity, we use the Index of State Weakness in the Developing World, which ranks all 141 developing countries according to their relative performance in four critical spheres: Economic, political, security, and social welfare. We find this index negatively correlated to growth revisions, as expected, but only weakly (Figure 15).
—
3 Serikbayeva et al. (2020) study the link between state capacity and deaths from Covid-19. The state capacity is proxied by the level of democracy, government policy responses, the share of the elderly population, and health system resource capacity. The study presents strong evidence for the critical role of state capacity in achieving positive policy outcomes.

Brookings Institution 19
Figure 15. GDP losses vs. State Weakness
Sources: IMF (2020c) and Rice and Patrick (2016)
In sum, while preconditions played a key part in the welfare impact of the pandemic, they appear to have been also influential in buffering its impact on aggregate economic performance.
AFG
IRQ
SDN
ZWE
-0.2
-0.18
-0.16
-0.14
-0.12
-0.1
-0.08
-0.06
-0.04
-0.02
00 2 4 6 8 10
Grow
th re
visio
n (O
ct 2
019
vs O
ct 2
020
Overall State Weakness

Brookings Institution 20
4. Dealing with the pandemic
While public policy responses varied across countries, we could identify two common features across countries: the speed and the synchronicity of the responses. Indeed, by late March 2020, as much as 25 percent of the world population was under lockdown measures (Hale et al. 2020). Broadly, the policy responses targeted two broad objectives:
(a) Reduce the spread of the virus and strengthen the health systems; and
(b) Support households and firms that faced sudden income/revenue losses due to supply and demand shortages, and the financial system to avert a spike in non-performing loans and defaults.
Policymakers tackled the first objective through quarantines, lockdowns, and social distancing. These policies played a critical role in slowing the transmission of the virus and reducing the stress on the health care system–particularly in less developed countries with modest heath capacity. With large heterogeneity across countries, these measures were complemented with higher health care spending to ensure adequate capacity and resources. Predictably, these policies had a significant economic impact: for instance, Demirgüç-Kunt et al. (2020) estimate that non-pharmaceutical interventions led to a decline of about 10 percent in economic activity across Europe and Central Asia during 2020.
On the other hand, policymakers implemented different fiscal, monetary, and regulatory measures to tackle the second objective. Household support measures were especially relevant in developing economies, where staying at home implied a sudden collapse of income as a larger share of workers are informal and their families depend on their labor income to make ends meet (Loayza and Meza-Cuadra 2018; Busso et al. 2020). Many governments supported households through salary subsidies, relief from contractual obligations and debt, and conditional cash transfers. Governments provided liquidity support through measures such as loans, equity injections, and guarantees to support firms. Some governments also encouraged banks to make use of available capital and liquidity buffers to support lending –at the risk of preserving nonviable “zombie” firms. These policies were complemented by a sharp reduction of monetary policy rates and a sustained quantitative easing by central banks to relax borrowing conditions in financial markets.

Brookings Institution 21
4.1 Cross-country evidence on lockdowns and economic activity
There is consensus that lockdown measures negatively affected economic activity. Several authors point to a substantial role of lockdowns in the United States leading to employment losses, a substantial decline in spending, and deterioration in local economic conditions (Brodeur, and Wright 2020; Coibion, Gorodnichenko, and Weber 2020). Similar effects have been documented across different countries (Carvalho and others 2020; Demirgüç-Kunt et al. 2020). The correlation between lockdown and economic activity is displayed Figure 16 and, in more detail, in Figure 17. The data provides suggestive evidence that the stringency of lockdowns had a short-term economic impact, as measured by the GDP relative to pre-pandemic forecasts. However, this evidence should be interpreted with caution given the large heterogeneity displayed in the sample and the fact that there are important omitted variables (e.g. The dependence on international inputs or capital, or the incidence of demographic, geographical, and seasonal factors) as well as lagged effects.
Figure 16. GDP Forecast Error in 2020 H1 and Lockdown Stringency
Source: IMF WEO Oct-20
-25
-20
-15
-10
-5
00 10 20 30 40 50 60 70
2020
:H1
GDP
Fore
cast
err
or (p
erce
nt)
Lockdown stringency (index, average in 2020:H1)

Brookings Institution 22
Figure 17. Lockdowns and Economic Activity
Source: IMF WEO Oct-20
There is an incipient consensus that, while strict lockdowns helped reduce the circulation of the virus at an early stage, their impact declined over time due to “lockdown fatigue”. Based on studies using the University of Oxford’s Lockdown Stringency Index (and its sub-components) and Google’s Mobility Index for a cross section of more than 100 countries, we can list a few stylized preliminary facts: 1) Lockdowns (particularly, restrictions on public events and private gatherings) have a large effect both on mobility and COVID-19 cases at the initial stage of the pandemic (Askitas et al., 2020; Wong et al., 2020); 2) The early effectiveness of lockdowns on reproduction and related deaths was heterogeneous, depending on country-specific factors such as average daily temperature, population density, health system quality, and age structure (Deb et al., 2020; Li et al., 2020; Goldstein et al, 2020); 3) Compliance (as measured by the response of the Mobility Index to changes in the Stringency Index) declined over time, and was particularly weak in emerging and developing countries where, in part for this reason, lockdowns were particularly stringent and long (Levy Yeyati and Sartorio, 2020; Goldstein at al., 2020; and Figure 18); and 4) The effectiveness of lockdowns declined over time, in part (but not solely) as a result of a weaker compliance (Goldstein et al., 2020; Caselli et al, 2020).

Brookings Institution 23
Figure 18. Impact of Lockdowns and Voluntary Social Distancing
Source: IMF WEO 2020-Oct
Several papers point to the large contribution of voluntary social distancing as a key factor affecting mobility and the economy. Aum, Lee, and Shin (2020), Goolsbee and Syverson (2020), Maloney and Taskin (2020), and Levy Yeyati and Sartorio (2020) show that mobility has been tightly correlated with the spread of COVID-19–mobility declines after a steady increase in daily deaths, and vice versa– even after controlling for government lockdowns. This implies that the pandemic affects the economy beyond the intensity of a lockdown, a pattern that was estimated and reported in the IMF´s WEO (2020) by decomposing variations in mobility into a component explained by official restrictions (again, proxied by the Stringency Index) and a residual, and then modeling changes in economic activity due to each of the two components. As can be seen in Figure 18, there is a considerable portion of the economic impact that could be attributed to voluntary distancing or, more rigorously, to actions that are orthogonal to variations in lockdown intensity, particularly in advanced economies. In addition, compliance with de jure restrictions over time depends on socioeconomic conditions such as per capita income or labor precariousness (Levy Yeyati and Sartorio, 2020) (Figure 19), which suggests that long lockdowns in middle-to low-income countries may lose their impact and –to the extent to which non-compliance extends to social distancing in general– even be counterproductive.

Brookings Institution 24
Figure 19. Correlations between compliance with Real GDP per capital and Urban Labor Precarity, June 22th
Sources: Levy Yeyati and Sartorio (2020) based on Oxford COVID-19 Government Response Tracker (OxCGRT), Google COVID-19 Community Mobility Reports, World Bank and International Labor Organization
4.2 Fiscal response to the pandemic
The size, composition, and evolution of fiscal support have varied widely because of country circumstances. Three stylized facts help to draw some intuition of the drivers behind this diversity. On average, countries that deployed smaller fiscal packages (i) put in place strong containment measures, such as mobility restrictions, early on (before COVID-19 cases peaked), (ii) have lower per capita income (a broad proxy for development), and (iii) have higher borrowing costs (wider sovereign bond spreads) that limit their capacity for on-budget support (Figure 20).

Brookings Institution 25
Figure 20. Discretionary Fiscal Response to the COVID-19 Crisis and Country Preconditions
Panel a. Fiscal Support and Stringency of Early Containment Panel b. Fiscal Support and Initial Income per Capita
Panel c. Fiscal Support and Initial Sovereign Spreads
Sources: OxCGRT Database; IMF, World Economic Outlook database; and IMF staff estimates. Note: Sovereign spreads are computed over 10-year US Treasury bond yields for non-European economies and 10-year German bund yields for European economies. Grey trend lines in panels 1 and 2 refer to both AEs and EMDEs; blue and orange trend lines in panels 3 and 4 refer to AEs and EMDEs, respectively. AEs = advanced economies; EMDEs = emerging market and developing economies; PPP = purchasing power parity; ppt = percentage point.
Debt-funded fiscal stimuli in advanced economies contrast with modest ones in developing countries, where central bank financing has been more prevalent. The main fiscal measures are outlined below (see also Table 3):
• Wage subsidies. Furlough programs for businesses with revenue losses have been particularly effective in preserving employment linkages in advanced economies with a majority of salaried workers (Barrero et al. 2020).4
—
4 The take-up of job retention schemes averaged one-quarter of employees in OECD economies.
0
10
20
30
40
0 20 40 60 80 100Fisca
l pac
kage
(pe
rcent
of GD
P)
Early stringency of mobility restrictions (index 0-100)
AEsEMDEs
0.0
10.0
20.0
30.0
40.0
0 20 40 60 80 100 120Fisca
l pac
kage
(pe
rcent
of GD
P)
GDP per capita, 2019 (thousands of US dollars, PPP)
AEsEMDEs
0
5
10
15
20
-5 0 5 10 15 20
On-b
udge
t sup
port
(per
cent
of GD
P)
10-year sovereign bond spreads, 2019 (ppt)
AEsEMDEs

Brookings Institution 26
• Cash and in-kind transfers5. Particularly effective in protecting the disposable income of the poor when means-tested and targeted to those most likely to spend, existing cash transfer programs coverage were expanded and supplemented with the distribution of food and hygiene items, and other voucher programs. These policies provided complementary coverage to vulnerable households, particularly in developing economies with larger informal sectors where job retention programs had limited impact (Figure 21).
• Loans and guarantees. While governments announced significant programs to provide liquidity to cash-strapped businesses, most programs had a low take-up explained by design issues (large loan size and low coverage of the guarantees), administrative capacity constraints or program conditionality, liquidity buffers in less-affected sectors and firms, the availability of other forms of government support such as grants and wage subsidies (Anderson, Papadia, and Véron 2020), and private debt overhang.
• Equity injections. In some cases (New Zealand, Singapore), governments provided convertible loans to national airlines with options to convert bonds into common equity, which ensured that the risks and rewards are better shared by the state and shareholders (OECD 2020a). In France, airline support was combined with conditionality on cutting emissions, which helps foster a “greener” recovery.
• Tax measures. Many countries extended deadlines and deferred payment of taxes (OECD 2020b; Djankov and Nasr, 2020) to support household and firm liquidity, albeit with a relatively low impact given that tax burdens were already limited by low sales and reduced profits (OECD 2020b)6. Additionally, tax-based support was less effective in emerging and developing economies because of the presence of widespread informality.
• Payment forbearance policies. These policies included moratoriums facilitated by government support or public enterprises on payments of mortgages (United States), utilities (Argentina, Colombia, Japan), rents (China), or loans (Argentina, Turkey) and provided short-term relief to households and businesses, including in informal sectors, to buffer the impact of the crisis on disposable income.
—
5 Bronka et al. 2020 estimates that means-tested universal credit allowance fully offset the adverse impact of the pandemic on poverty in the U.K. On the other hand, Chetty et al. 2020 estimate that in the United States, however, higher-income households that received “stimulus checks” under the Coronavirus Aid, Relief, and Economic Security Act have spent less than lower-income households that received those checks, and on goods less affected by the lockdown, such as durables, limiting the aggregate impact. 6 These measures were implemented through tariff waivers on medical supplies (Colombia, Vietnam), accelerated VAT refunds (France, Indonesia), new and expanded loss carry-back rules (China, New Zealand, Japan), accelerated depreciation deductions (Australia) and reduced social security contributions (Argentina, China, France, Korea).

Brookings Institution 27
Table 3. Fiscal and monetary response to the pandemic
Maintain financial stability
Monetary-policy actions
Provide quantitative easing/liquidity injections
Reduce interest rates
Maintain household economic welfare
Support of critical needs
Maintain household disposable incomes (Cash and in-kind transfers)
Ease household expenses/financial obligations (payment forbearance policies)
Help companies survive the crisis
Liquidity/cash-flow improvements
Postpone government fees/receivables and non-debt obligations (payment forbearance policies)
Balance-sheet interventions
Provide equity interventions (equity injections)
Restructure debt and defer loans (loans)
Guarantee funds (guarantees)
Companies cost reduction
Reduce/eliminate government fees (tax measures)
Compensate/reduce salary costs (wage subsidies)
Source: Author’s elaboration based on McKinsey (2020)

Brookings Institution 28
Figure 21. Increase in the Coverage of Social Assistance (in percentage of the population)
Source: Gentilini et al. (2020). Note: EAP = East Asia and Pacific; ECA = Europe and Central Asia; LAC = Latin America and the Caribbean; ENA = Middle East and North Africa; NA = North America; SA = South Asia; SSA = sub-Saharan Africa.
There are several fiscal risks associated with the duration of the aforementioned policies in the event of a lengthening of the pandemic:
• A protracted economic downturn. The lack of widespread availability of effective therapies or a vaccine implies a considerable risk for recovery. This could mean more bankruptcies, further deterioration in banks’ balance sheets, and a greater need for fiscal resources to support and retrain unemployed workers at a time when debt ratios and base money are already quite stretched in many developing countries.
• Tightening of financial conditions. The rapid growth in sovereign and private debt stocks, particularly among non-financial corporations, and the need to service those debts, has left government budgets and private entities more exposed to changes in financing conditions and potential debt overhangs (depressed investment due to the anticipation of future taxes to pay current debt).
• Commodity market volatility. Commodity price fluctuations impact commodity exporters and importers differently. A sharp fall in oil prices would further undermine the already-stretched budgets of oil exporters but could also provide importers with some relief. Conversely, the ongoing boom in food items could put additional pressure on commodity importers in the developing world.
• Contingent liabilities. Although new guarantees remain largely untapped by firms to date, their use of guarantees may accelerate and could eventually be called in the event of a new fall in economic activity, adding to public indebtedness and fiscal needs.
20
6
2214
2217
2
15
1
13 22
3
7
0
5
10
15
20
25
30
35
40
45
EAP ECA LAC MENA NA SA SSA Global
Cash coverageIn-kind coverage

Brookings Institution 29
To a lesser extent, there are also upside fiscal risks. These include the rapid development and wide distribution of a safe, affordable, and effective vaccine; changes in economic structures that boost productivity through new techniques or technologies; or the normalization that proceeds faster than expected in areas that have reopened without sparking new outbreaks of infections. Realization of these outcomes would imply a faster economic recovery than expected, thereby reducing the necessary fiscal support.
Public investment could play a central role in the post-pandemic scenario. Countries have redirected resources budgeted to public investment to finance the measures discussed above. In this vein, it could help revive economic activity and create new low-skilled jobs in the short term. IMF (2020f) estimates that increasing public investment by 1 percent of GDP could strengthen confidence in the recovery and boost GDP by 2.7 percent, private investment by 10 percent, and employment by 1.2 percent (Figure 22). The impact is magnified due to the uncertainty on the economic outlook that depressed private investment, potentially inducing a crowding-in of private resources. To be sure, these estimates assume that the existing public and private debt burdens do not jeopardize the response of the private sector to the stimulus, which remains a considerable source of risk; because of that, they are more relevant for developed countries under the assumption of the continuation of extremely low interest rates.
Figure 22. Amplifying effects of public investment
Source: IMF (2020f)

Brookings Institution 30
We believe risks are balanced but biased against developing countries. Vaccine rollouts and new mutations may find many developing countries ill-prepared. Because those countries where vaccine supply may be constrained are often low-income ones with limited fiscal space, delays due to production hurdles or competition for jabs will likely translate into wider cross-country inequality. Moreover, remaining risks are still uncertain and likely to affect economies differently. For example, even if vaccines prevent deaths, they may not reduce circulation as expected; vaccine hesitancy, particularly high among young people, may slow down vaccine rollouts (paradoxically, relaxing the supply constraint); and virus mutations may not only feed people´s fears and delay a return to normality but may also require further vaccination (or boosts) down the road. While all this would be especially problematic for developing countries without the resources to cope with a second wave–which, as a result, may see new waves that hinder economic activity in 2022–it also represents a hurdle to the recovery of cross-country transportation and migration, with global consequences. Globally-minded governments and multilateral institutions should anticipate, internalize, and address these risks before they are realized.

Brookings Institution 31
5. The role of IFIs
Global liquidity and capital flight, short-lived as it was (see section 2), affected countries in very different ways. To analyze this, it is useful to distinguish four groups of countries: Advanced (benefited by near-zero interest rates), emerging markets in good standing (where the increase in sovereign risk premiums was largely offset by the decline in risk-free interest rates leaving borrowing costs near pre-COVID levels), emerging markets in crisis (with significant private debt ratios and limited or no access to private refinancing, hence dependent on multilateral lending), and frontier markets (with limited or no private financing, reliant on–mostly concessionary–multilateral and bilateral lenders and donors).
The injection of global liquidity by central banks helped countries selectively. It was positive for the first group and to a lesser extent the second group by enabling the funding of fiscal stimuli, but was at best neutral for the third (rationed from capital markets due to their domestic crises) and the fourth (with no private funding). This exacerbated the long-standing conundrum faced by the international financial community during global crises: Those with access to multilateral support do not need it; those with needs cannot access it.
The IMF created new liquidity windows to help emerging economies cope with capital flight. The Fund has two types of programs: Back-loaded conditional ones (e.g., Stand by agreements) tailored to deal with fundamental macroeconomic misalignments, and front-loaded unconditional ones (e.g., FCL and PCL, as well as the new SLL) aimed at external liquidity shocks to otherwise well-behaved economies. As a result, economies with a less-than-stellar track record hit by an external shock remain unattended. Recognizing this gap, in April 2020 the IMF launched the Rapid Financing Instrument (RFI) that “provides rapid and low-access financial assistance to member countries facing an urgent balance of payments need, without the need to have a full-fledged program in place” (IMF 2020a) and the RCF, a similar line available “only to low-income countries eligible for concessional financing”, in addition to transitorily extending the size of these emergency loans (from 50 to 100 percent of quota). Despite all these efforts, the use of the facilities has been rather modest: About $250 billion out of its $1 trillion lending capacity (as of December 21, 2020), centered on countries without financial constraints. More importantly, this use was concentrated in the unconditional liquidity windows, primarily the RFI, which were used by many as a financial backstop against a persistent increase in borrowing costs, reflecting a well-known reluctance from governments to engage in an IMF program due to reputation and political stigma.

Brookings Institution 32
Another attempt to make up for potential liquidity problems in the developing world was the proposal to issue SDRs, the IMF´s basket currency. Such a move, emulating a similar one in the context of the 2009 global financial crisis, is the international equivalent to a central bank´s transfer to finance the Treasury and would have benefitted all IMF member countries. Advocated by many experts (see, e.g., Gallagher et al., 2020), it was ultimately stalled by the opposition of the U.S. government, but remains a likely outcome under the Biden administration.
A third initiative that also received wide support from experts and multilaterals was a debt relief for low- and middle-income economies to enhance their fiscal space. The proposal is based on the view that, because countries suffered a permanent loss and a persistent impairment of their growth potential, concessionary lending is not enough and a true transfer, in the form of a nominal debt haircut, is needed. In the end, the initiative received a lukewarm response from the private sector and key bilateral lenders, such as China, and was narrowed down to a temporary suspension of debt service under which 73 countries are eligible for a temporary suspension of debt-service payments to official bilateral creditors through June 2021.7
Other ideas to fill in the gaps of the international financial architecture were floated during the year with no success. The creation of a Special Purpose Vehicle (SPV) to be used to leverage countercyclically the investment-grade rating of multilaterals or regional reserve funds in times of historically low interest rates failed to stir the interest of potential beneficiaries that, as noted above, did not perceive liquidity as a relevant restriction. Similarly, calls for a recapitalization of multilateral lending institutions were weakened by the fact that existing multilateral resources were far from exhausted by demand and, overall, by the combination of low financing costs in high- and middle-income economies and solvency, as opposed to liquidity, concerns in low-income ones.
—
7 Note that, since these economies receive grants and concessional loans, any debt service suspension by bilateral official donors is likely to be offset by a smaller amount of new funds from the same source, with limited or no effect on the availability of finance in the short term.

Brookings Institution 33
6. Estimating the economic costs of the pandemic
To complement the previous analysis, in this section we present a back-of-the-envelope, preliminary assessment of the economic cost of COVID-19. As will become clear below, this is an indicative exercise, modelled in blocks so that the reader can decide what to include, and open-ended as the crisis is still ongoing and the numbers used are broad projections under permanent revision.
First, we approximate the output loss over a 10 year window. We accumulate the differences between the realized real GDP in 2020 and the one projected right before the pandemic, and between pre- and post-COVID projections for 2021-2030 (the shaded area in Figure 23 compares pre-Covid real GDP growth forecast from the WEO of October 2019 with the most current, upgraded forecast from the WEO April-2021), discounted at a 0 percent real interest rate. The calculation yields a total equal to 53 percent of the 2019 global GDP (Table 4).
Figure 23. Global GDP Projections (in constant USD, index 2017=100)
Sources: IMF WEO Oct-2019, Oct-2020 and Apr-2021
Second, we add the economic costs of the fiscal stimuli. There are several complex, non-linear channels influencing the realized and future output losses that are not incorporated in the GDP forecasts. In particular, we need to address the 15 percent of
120
125
130
135
140
145
150
155
160
165
170
2017 2018 2019 2020 2021 2022 2023 2024 2025
Oct-19 Oct-20 Apr-21

Brookings Institution 34
GDP global fiscal stimulus without which the output loss in 2020 would have been much steeper. How much of this stimulus should be regarded as a cost? This is a non-trivial exercise for various reasons because almost half of the stimulus was below the line (loans, equity stakes, guarantees) with a cost that is contingent on the speed and composition of economic recovery in each country.8 On the other hand, COVID is estimated to have triggered an additional sovereign issuance equivalent to 8.7 percent of GDP (no estimate is available for private debt). One could assume that the debt plus a fraction of the behind-the-line stimulus would need to be repaid in the future in the form of additional fiscal adjustment (relative to the pre-COVID scenario). If, in addition, we assume that the fiscal multiplier during the stimulus is comparable to that during the adjustment, we could project the output cost of the fiscal packages based on its estimated impact in 2020. Part of the above-the-line fiscal effort is probably already incorporated in the IMF projections. However, we are ignoring episodes of financial stress and possible debt crisis in some heavily indebted countries with limited access to international capital. And we are not considering the additional fiscal stimulus scheduled for 2021, particularly in advanced countries. All things considered, including the full 15 percent of GDP stimulus in the cost seems a reasonable proxy.
A comprehensive calculation of the economic cost of the pandemic cannot ignore the value of the excess in deaths due–directly, or indirectly through health externalities–to COVID-19. There is no simple way to put a value on a human life. For the sake of argument–and with the view of highlighting the magnitude of the pandemic loss to argue for the need to invest in preventing new ones–we adopt the “statistical lives” approach that measures how much people value a reduction in mortality or morbidity risk. Although no single number is universally accepted, the value of a statistical life for the US ranges between $10 million and $7 million per life (Cutler and Summers 2020). If we take a considerably more conservative figure, $5 million per life, acknowledging that the statistical value may vary across countries, the cost related to the global cumulative deaths registered so far equals 16,9 percent of the global GDP.
The pandemic brought significant education losses. Crucially, school closures posed a serious risk to human capital accumulation across the world, both in terms of effective hours of schooling and retention ratios (the increase in dropouts). Moreover, this cost is highly regressive, as richer countries and households were better equipped to cope with distancing restrictions and sacrificed fewer hours of school classes (OECD, 2020). At a global scale, school closures affected 1.6 billion students at the peak of the pandemic
—
8 The economic impact of fiscal stimuli is also hard to appraise, since it depends on the ineffable fiscal multiplier, which in turn varies with the nature of the economic depression and the quality and composition of the package. However, for the purpose of our cost calculation, we can ignore the counterfactual (output losses in the absence of fiscal stimulus).

Brookings Institution 35
(World Bank 2020b). On average, students missed 69 days of instruction in 2020 in LICs, compared with 46 days in emerging market economies and 15 days in advanced economies. Azevedo et al. (2020) estimate the lifetime loss in labour earnings for the affected cohort at $10 trillion—around 12 percent of global GDP.9
Many, harder-to-quantify factors should be added to this account. For instance, the job and firm destruction (with its concomitant loss of job-specific human capital and the firms´ social capital and know-how). Some of these costs can be simulated based on calibrations reported in the existing empirical literature and certainly deserve more detailed analysis. Others, like the cost of untreated/un-diagnosed illnesses or the psychological loss of social distancing, can be only conjectured. At any rate, the estimated total cost of the pandemic that follows from our discussion above, around 100 percent of GDP (Table 4), is likely to be a conservative lower bound.
Table 4. Economic Cost of the Covid-19
Damages from COVID-19 (IMF WEO Apr-2021) As percentage of GDP*
Lost 2020 Global GDP from COVID-19 6.65% Lost 2021-30 Global GDP from COVID-19 Discounted at 0% 48.03% Total GDP loss 2020-30 (discounted at 0%) 54.68%
Memorandum Global fiscal impulse (IMF Fiscal Monitor Apr-2021) Above the line 9.19% Below the line 6.12% Total fiscal impulse 15.31% Change in Gross Government Debt 7.30% Statistical value of deaths related to Covid-19 Total deaths related to Covid-19 2,828,146 Statistical value of a life (lower bound, in bn USD) 0.005 Total value of deaths related to the pandemic 16.87% Education and human capital loss Lifetime loss in labor earnings for the affected cohort 12%
Source: Author’s calculation
—
9 This is a broad estimate, as education losses have persistent consequences that will only be apparent in the long term. For example, Hanushek and Woessmann (2020) estimated the cost equivalent to a half academic year loss to be a 2.2 percent lower annual GDP for the remainder of the century, which depending on the discount rate could yield a larger total than the one we use in our exercise.
Brookings Institution 36
7. Final remarks
One key theme of the post-pandemic debate will likely be the speed and extent of the unwinding of fiscal stimuli and increased indebtedness. The natural reference is the late 2009 debate on fiscal unwinding in the aftermath of the global financial crisis. The contrast between then and now arises from today’s consensus that zero interest rates are here to stay, at least for a while (Blanchard, 2019), despite warnings that a possible inflation revival may lead to an unanticipated interest rate reversal (Summers, 2021; Cochrane, 2021).
While the jury is still out on fiscal unwinding in advanced countries, fiscal concerns are more pressing in the developing world. Indebtedness (including contingent liabilities due to guaranteed loans to the private sector) and the need to reduce spending to manageable levels (deficits skyrocketed and tax hikes look counterproductive during a fragile recovery) are relevant for emerging economies whose currently moderate financing costs are sensitive to market fears or rating downgrades that might trigger capital flight. And, while this is a potential problem in emerging economies, it is a clear and present danger in non-financially integrated economies in need of debt relief to compensate permanent economic losses. Most developing economies lack the fiscal space to renew the support of wages and firms or to cope with a tax revenue fall in 2021. As noted, risks are tilted to the downside, in a context in which psychological and economic fatigue limits the policy space–particularly in countries where the pandemic temporarily froze episodes of political unrest. Moreover, in some cases, the resulting economic stagnation may test the banking sector's resilience. Considering the failure of existing IMF programs to generate demand and contribute to smooth out fiscal restrictions in the post-pandemic, in particular in low-income economies, a discussion of a global emergency budget support facility emerged. This facility could replicate the current liquidity facilities, which lend to central banks to support international reserves, as a direct loan to national Treasuries in the event of a systemic crisis. Such a discussion will likely trigger objections similar to those opposing increases in the volume of current liquidity facilities, based on moral hazard considerations that, in our view, have little empirical support (Cordella & Levy Yeyati, 2005). We believe that the economic cost caused by a premature adjustment–let alone the prospective economic losses associated with systemic crises in general, including one related with a new pandemic in the future–warrant some innovative efforts.
The role of the labor market channel–limiting the coverage of job retention policies and deepening the impact of the accelerated digitization–rekindled the debate on universal income. Besides several design complications, including the political

Brookings Institution 37
difficulties of reconciling existing transfer programs into a new universal scheme, for reasons already noted most economies lack the fiscal space to proceed in this direction. However, we anticipate that the debate will center on a more limited universal minimum income, possibly means-tested and conditional on professional training, to fill in the gaps of the social safety net revealed by the pandemic. Along the same lines, the importance of dual markets behind the regressive social impact of the crisis may pave the way for renewed active labor market policies such as training and reskilling or wage subsidies, as well as flexible labor contracts with portable benefits to ease the creation –or mitigate the destruction–of formal jobs or, more generally, to reduce the precariousness of the self-employed. Investments in training and connectivity (to facilitate telework) should help contain job loss and reduce the economy’s exposure to new COVID waves. This agenda may also incorporate strategies to delay or reorient automation by revising the bias of tax systems and making technology more complementary to labor (Acemoglu, 2019).
All of the above requires funding and technical assistance and calls for a more active, coordinated, and specialized presence of the international community and multilateral institutions. On the one hand, the international financial institutions should strengthen their presence both to smooth out the unwinding of the fiscal efforts (to avoid a sharp fiscal adjustment that may derail the rebound) and provide technical capacity and orientation to the labor, tax, and state reforms needed to minimize the consequences of a protracted convalescence. There are pending assignments such as the IMF´s issuance of SDR that will hopefully resume. Others, like the already mentioned debt relief initiative, deserve a political push. There is also the perennial demand for an international lender of last resort, a part that the IMF plays only selectively–or, through the new RFI, to a limited extent. And there is an urgent need to coordinate the supply and funding of vaccines to low-income countries that may otherwise see the pandemic continuing through 2022 and beyond.
The pandemic macroeconomic crisis, as we argue here, has so far been less about liquidity than it is about permanent fiscal losses and foregone growth opportunities. Again, there is a broad contrast between advanced and developing nations. Whereas in the former, where huge fiscal transfers increased disposable income in the peak of the pandemic, experts recommend new fiscal stimuli to be conducted through infrastructure and productive investments, in the latter, particularly in low-income countries, the new challenges call for a reorientation of long-term official loans from infrastructure project financing to budgetary financing as a way to defer deficit adjustment and foster reforms–a tidal change in the way the international financial community approaches the developing world. As such, it offers the perfect opportunity to reassess how we conceive international cooperation.
Brookings Institution 38
References
Anderson, J., F. Papadia, & N. Véron. 2020. “Government-guaranteed in Europe: Beyond the Headline Numbers.” Realtime Economic Issues Watch (blog), Peterson Institute for International Economics, July 21. https://www.piie.com/blogs/realtime-economic-issueswatch/government-guaranteed-bank-lending-europebeyond-headline.
Askitas, Nikos & Tatsiramos, Konstantinos & Verheyden, Bertrand, 2020. "Lockdown Strategies, Mobility Patterns and COVID-19," IZA Discussion Papers 13293, Institute of Labor Economics (IZA).
Azevedo, João Pedro & Amer Hasan & Diana Goldemberg & Syedah Aroob Iqbal & Koen Geven. 2020. “Simulating the Potential Impacts of COVID-19 School Closure on Schooling and Learning Outcomes: A Set of Global Estimates.” Policy Research Working Paper 9284, World Bank, Washington, DC.
Barrero, Jose Maria & Nicholas Bloom & Steven J. Davis, 2020. "COVID-19 Is Also a Reallocation Shock," Working Papers 2020-60, Becker Friedman Institute for Research In Economics.
Béland, Louis-Philippe & Brodeur, Abel & Wright, Taylor, 2020. "The Short-Term Economic Consequences of COVID-19: Exposure to Disease, Remote Work and Government Response," IZA Discussion Papers 13159, Institute of Labor Economics (IZA).
Benigno, Gianluca & Andrew T. Foerster & Christopher Otrok & Alessandro Rebucci, 2020. "COVID-19: A double whammy of financial and economic sudden stops for emerging economies," Vox eBook Chapters, in Simeon Djankov & Ugo Panizza (ed.), COVID-19 in Developing Economies, edition 1, volume 1, chapter 1, pages 329-341, Centre for Economic Policy Research.
Benmelech, Efraim & Nitzan Tzur-Ilan, 2020. "The Determinants of Fiscal and Monetary Policies During the Covid-19 Crisis," NBER Working Papers 27461, National Bureau of Economic Research, Inc.
Bick, Alexander & Blandin, Adam & Mertens, Karel, 2020. “Work from Home after the Covid-19 Outbreak”. CEPR Discussion Paper No. DP15000, Available a
Blanchard, Olivier, 2019. "Public Debt and Low Interest Rates," American Economic Review, American Economic Association, vol. 109(4), pages 1197-1229, April.

Brookings Institution 39
Bonardi, Jean–Philippe et al. (2020), “Fast and local: How lockdown policies affect the spread and severity of covid-19”, Covid Economics 23: 325–351.
Bronka, Patryk & Collado, Diego & Richiardi, Matteo, 2020. "The Covid-19 crisis response helps the poor: the distributional and budgetary consequences of the UK lock-down," EUROMOD Working Papers EM11/20, EUROMOD at the Institute for Social and Economic Research.
Busso, Matías & Julían Messina. 2020. “The Inequality Crisis: Latin America and the Caribbean at the Crossroads.” Inter-American Development Bank. https://publications.iadb.org/publications/english/document/The-Inequality-Crisis-Latin-America-and-the-Caribbean-at-the-Crossroads.pdf.
Caballero, Ricardo J. & Alp Simsek, 2020. "Asset Prices and Aggregate Demand in a "Covid-19" Shock: A Model of Endogenous Risk Intolerance and LSAPs," NBER Working Papers 27044, National Bureau of Economic Research, Inc.
Carvalho, Vasco M & Hansen, Stephen & Ortiz, Álvaro & Ramón García, Juan & Rodrigo, Tomasa & Rodriguez Mora, Sevi & Ruiz, José, 2020. "Tracking the COVID-19 Crisis with High-Resolution Transaction Data," CEPR Discussion Papers 14642, C.E.P.R. Discussion Papers.
Caselli, Francesca & Francesco Grigoli & Weicheng Lian & Damiano Sandri, 2020. “Protecting Lives and Livelihoods with Early and Tight Lockdowns,” IMF Working Paper 2020/234.
Chetty, Raj & John N. Friedman & Nathaniel Hendren & Michael Stepner & The Opportunity Insights Team, 2020. “The Economic Impacts of COVID-19: Evidence from a New Public Database Built Using Private Sector Data,” NBER Working Papers 27431, National Bureau of Economic Research, Inc.
Coibion, Olivier & Yuriy Gorodnichenko & Michael Weber, 2020. "Labor Markets During the COVID-19 Crisis: A Preliminary View," NBER Working Papers 27017, National Bureau of Economic Research, Inc.
Cochrane, John, 2021. “Inflation and Debt,” National Affairs, Number 46, Winter 2021. https://www.nationalaffairs.com/publications/detail/inflation-and-debt
Cordella, Tito & Eduardo Levy Yeyati, 2005. “Country insurance”, IMF Staff Papers, vol. 52.
Cutler David M. & Lawrence H. Summers, 2020. The COVID-19 Pandemic and the $16 Trillion Virus. JAMA. 2020; 324(15): 1495–1496. doi:10.1001/jama.2020.19759

Brookings Institution 40
Deaton, Angus, 2021. “COVID-19 and Global Income Inequality,” NBER WP #28292
Demirguc-Kunt, Asli & Lokshin, Michael M. & Torre, Ivan, 2020. "The Sooner, the Better: The Early Economic Impact of Non-Pharmaceutical Interventions during the COVID-19 Pandemic," Policy Research Working Paper Series 9257, The World Bank.
Dingel, Jonathan I. & Brent Neiman, 2020. "How Many Jobs Can be Done at Home?," NBER Working Papers 26948, National Bureau of Economic Research, Inc.
Djankov, S., & J. Nasr. 2020. “Tax Relief in a Time of Crisis: What Countries Are Doing to Sustain Business and Household Liquidity.” Let’s Talk Development (blog), World Bank, April 1. https://blogs.worldbank.org/developmenttalk/tax-relief-time-crisis-what-countries-are-doing-sustainbusiness-and-household.
Djiofack, Calvin Z. & Hasan Dudu & Albert G. Zeufack, 2020. "Assessing COVID-19’s economic impact in sub-Saharan Africa: Insights from a CGE model," Vox eBook Chapters, in Simeon Djankov & Ugo Panizza (ed.), COVID-19 in Developing Economies, edition 1, volume 1, chapter 1, pages 53-68, Centre for Economic Policy Research.
Gallagher, Kevin & José Antonio Ocampo & Ulrich Volz, 2020. “Special Drawing Rights: International Monetary Support for Developing Countries in Times of the COVID-19 Crisis”, De Gruyter. DOI: https://doi.org/10.1515/ev-2020-0012
Gentilini,Ugo & Almenfi,Mohamed Bubaker Alsafi & Dale,Pamela & Lopez,Ana Veronica & Mujica Canas,Ingrid Veronica & Cordero,Rodrigo Ernesto Quintana & Zafar,Usama, 2020. “Social Protection and Jobs Responses to COVID-19: A Real-Time Review of Country Measures”. World Bank, Washington DC.
Guerrieri, Veronica & Guido Lorenzoni & Ludwig Straub & Iván Werning, 2020. "Macroeconomic Implications of COVID-19: Can Negative Supply Shocks Cause Demand Shortages?," NBER Working Papers 26918, National Bureau of Economic Research, Inc.
Hale, T. & Angrist, N. & Kira, B. & Petherick, A. & Phillips, T. & S. Webster, 2020. “Variation in government responses to COVID-19”. Blavatnik School of Government, BSG Working Paper, BSG-WP-2020/032.
Hanushek, Eric A. & Ludger Woessmann. 2020. “The Economic Impacts of Learning Losses.” OECD Education Working Paper 225, Organisation for Economic Cooperation and Development, Paris.
Haug, N., Geyrhofer, L., Londei, A. et al. Ranking the effectiveness of worldwide COVID-19 government interventions. Nat Hum Behav 4, 1303–1312 (2020). https://doi.org/10.1038/s41562-020-01009-0
Brookings Institution 41
International Monetary Fund (IMF). 2020a. “World Economic Outlook, April 2020: The Great Lockdown”, Washington, DC.
International Monetary Fund (IMF). 2020b. “World Economic Outlook, October 2020: A Long and Difficult Ascent”, Washington, DC
International Monetary Fund (IMF). 2020c. “Global Financial Stability Report, October 2020: Bridge to Recovery”, Washington, DC
International Monetary Fund (IMF). 2020d. “Outlook for Latin America and the Caribbean, October 2020: Pandemic Persistence Clouds the Recovery”, Annex 1, Washington, DC.
International Monetary Fund (IMF). 2020e. “Special Series on Fiscal Policies to Respond to COVID-19, Reaching Households in Emerging and Developing Economies: Citizen ID, Socioeconomic Data, and Digital Delivery”, Washington, DC.
International Monetary Fund (IMF). 2020f. “Fiscal Monitor, October 2020: Policies for the Recovery”. Washington, DC: International Monetary Fund.
International Monetary Fund (IMF). 2021. “World Economic Outlook, October 2021: After-Effects of the COVID-19 Pandemic: Prospects for Medium-Term Economic Damage”, Chapter 2. Washington, DC: International Monetary Fund.
Levy Yeyati, Eduardo & Samuel Pienknagura (2014), Wage compression and the decline in inequality in Latin America: Good or bad?, VoxEU, June 10, 2014.
Levy Yeyati, Eduardo & Rodrigo Valdes, 2020. "COVID-19 in Latin America: How is it different than in advanced economies?," Vox eBook Chapters, in Simeon Djankov & Ugo Panizza (ed.), COVID-19 in Developing Economies, edition 1, volume 1, chapter 1, pages 100-111, Centre for Economic Policy Research.
Levy Yeyati, Eduardo & Luca Sartorio, 2020. “Take me out: De facto limits on strict lockdowns in developing countries”, Working Paper UTDT #8, Buenos Aires, Argentina.
Loayza, Norman & Claudia Meza-Cuadra. 2018. “A Toolkit for Informality Scenario Analysis.” Washington, DC: The World Bank.
Maloney, William F. & Taskin, Temel, 2020. "Determinants of Social Distancing and Economic Activity during COVID-19: A Global View," Policy Research Working Paper Series 9242, The World Bank.
Messina, Julían, & Joana Silva. 2019. “Twenty Years of Wage Inequality in Latin America.” IDB Working Paper Series No. IDB-WP-1041.

Brookings Institution 42
https://publications.iadb.org/publications/english/document/Twenty_Years_of_Wage_Inequality_in_Latin_America_en_en.pdf.
McKinsey, 2020. The $10 trillion rescue: How governments can deliver impact.
Noy, Ilan & Nguyen Doan & Benno Ferrarini & Donghyun Park, 2020. "The economic risk of COVID-19 in developing countries: Where is it highest?," Vox eBook Chapters, in Simeon Djankov & Ugo Panizza (ed.),C OVID-19 in Developing Economies, edition 1, volume 1, chapter 1, pages 38-52, Centre for Economic Policy Research.
Organizationn for Economic Co-operation and Development (OECD). 2020a. “Equity Injections and Unforeseen State Ownership of Enterprises during the COVID-19 Crisis.” OECD Publishing, Paris.Organizationon for Economic Co-operation and Development (OECD). 2020b. “Tax Administration Responses to COVID-19: Measures Taken to Support Taxpayers.” OECD Publishing, Paris.
Prady, Delphine & Herve Tourpe & Sonja Davidovic & Soheib Nunhuck, 2020. “Beyond the COVID-19 Crisis: A Framework for Sustainable Government-To-Person Mobile Money Transfers”, IMF Working Paper No. 20/198, Washington, DC.
Sangmin Aum & Sang Yoon (Tim) Lee & Yongseok Shin, 2020. "Inequality of Fear and Self-Quarantine: Is There a Trade-off between GDP and Public Health?," NBER Working Papers 27100, National Bureau of Economic Research, Inc.
Serikbayeva, Balzhan & Abdulla, Kanat & Oskenbayev, Yessengali, 2020. "State capacity in responding to COVID-19," MPRA Paper 101511, University Library of Munich, Germany.
Summers, Larry, 2021. “Opinion: The Biden stimulus is admirably ambitious. But it brings some big risks, too,” Washington Post. https://www.washingtonpost.com/opinions/2021/02/04/larry-summers-biden-covid-stimulus/
The World Bank. 2021. Global Economic Prospects, January 2021: Subdued Global Economic Recovery. January. Washington, DC.
The World Bank. 2020. South Asia Economic Focus, October 2020: “Beaten or Broken? Informality and COVID-19,” Washington, DC.
The World Bank. 2020b. The Human Capital Index 2020 Update: Human Capital in the Time of COVID-19. Washington, DC.
Weber, Enzo (2020), “Which measures flattened the curve in Germany”, Covid Economics 24: 205–217.

1775 MASSACHUSETTS AVE NWWASHINGTON, D.C. 20036
brookings.edu/global