Social Accounting Matrices and Extended Input-Output Tables
36
SOCIAL ACCOUNTING MATRICES AND EXTENDED INPUT-OUTPUT TABLES – 313 MEASURING SUSTAINABLE DEVELOPMENT: INTEGRATED ECONOMIC, ENVIRONMENTAL AND SOCIAL FRAMEWORKS – ISBN-92-64-02012-8 © OECD 2004 313 Social Accounting Matrices and Extended Input-Output Tables C. Stahmer Federal Statistics Office Germany Introduction This paper summarises the historical development of Social Accounting Matrices (SAM) related to input-output tables and describes the linkages between SAM and the input-output framework in the European System of National Accounts. After these introductory remarks, an example of a SAM based on input-output analysis is given which might encourage cooperation projects of statisticians working in these two fields. SAM and input-output framework At the end of the forties and beginning of the fifties, Richard Stone already proposed a presentation of the results of national accounting not only in T-accounts but also in a matrix format. 1 He called such matrix a Social Accounting Matrix (SAM) and demonstrated that input-output tables could be interpreted as a special case of a SAM: “I propose to use the term input-output table to mean a statement in current money terms of the flow of goods and non-factor services between the operating accounts of the system and between these and all other accounts combined. All other transactions in the system are aggregated and appear as the elements in the final row of the matrix.” 2 In the sixties, Richard Stone and his team developed the Cambridge Growth Model. 3 In this context, he also published a first SAM for Great Britain 1960 4 and improved the conceptual framework of such matrix presentation. He especially stressed the importance of using different statistical units (e.g. commodities, establishments, institutional units) in the system for describing the variety of economic activities in a most suitable way. According to this concept, it is necessary to link the different parts of the accounting system by special transition matrices from one statistical unit to another. 5 These considerations were the starting point for the concepts of the System of National Accounts (SNA) 1968. 6 The supply and disposition tables of the input-output framework became an integral part of the national accounting matrix. 7 1. See Stone 1949, Stone 1951-52, Stone 1955a and 1955b. Cf. also Stone 1961. Comments to this work were made by Hill 1995, p. 27. See also Stahmer 2002 with further references. 2. Stone 1955b, p. 158 f. 3. See the overview in Stone 1981a, pp. 77-96. 4. Stone 1962b. 5. Stone 1962a. 6. United Nations 1968. 7. United Nations 1968, Chapter II and Chapter III, cf. especially the famous table 2.1 of the complete system, p. 18 passim. See also later comments of Richard Stone in Stone 1979 and Stone 1981b.
Transcript of Social Accounting Matrices and Extended Input-Output Tables

SOCIAL ACCOUNTING MATRICES AND EXTENDED INPUT-OUTPUT TABLES – 313
MEASURING SUSTAINABLE DEVELOPMENT: INTEGRATED ECONOMIC, ENVIRONMENTAL AND SOCIAL FRAMEWORKS – ISBN-92-64-02012-8 © OECD 2004
313
Social Accounting Matrices and Extended Input-Output Tables
C. Stahmer
Federal Statistics Office Germany
Introduction
This paper summarises the historical development of Social Accounting Matrices (SAM) related to input-output tables and describes the linkages between SAM and the input-output framework in the European System of National Accounts. After these introductory remarks, an example of a SAM based on input-output analysis is given which might encourage cooperation projects of statisticians working in these two fields.
SAM and input-output framework
At the end of the forties and beginning of the fifties, Richard Stone already proposed a presentation of the results of national accounting not only in T-accounts but also in a matrix format.1 He called such matrix a Social Accounting Matrix (SAM) and demonstrated that input-output tables could be interpreted as a special case of a SAM: “I propose to use the term input-output table to mean a statement in current money terms of the flow of goods and non-factor services between the operating accounts of the system and between these and all other accounts combined. All other transactions in the system are aggregated and appear as the elements in the final row of the matrix.”2
In the sixties, Richard Stone and his team developed the Cambridge Growth Model.3 In this context, he also published a first SAM for Great Britain 19604 and improved the conceptual framework of such matrix presentation. He especially stressed the importance of using different statistical units (e.g. commodities, establishments, institutional units) in the system for describing the variety of economic activities in a most suitable way. According to this concept, it is necessary to link the different parts of the accounting system by special transition matrices from one statistical unit to another.5 These considerations were the starting point for the concepts of the System of National Accounts (SNA) 1968.6 The supply and disposition tables of the input-output framework became an integral part of the national accounting matrix.7
1. See Stone 1949, Stone 1951-52, Stone 1955a and 1955b. Cf. also Stone 1961. Comments to this work were
made by Hill 1995, p. 27. See also Stahmer 2002 with further references.
2. Stone 1955b, p. 158 f.
3. See the overview in Stone 1981a, pp. 77-96.
4. Stone 1962b.
5. Stone 1962a.
6. United Nations 1968.
7. United Nations 1968, Chapter II and Chapter III, cf. especially the famous table 2.1 of the complete system, p. 18 passim. See also later comments of Richard Stone in Stone 1979 and Stone 1981b.

314 – SOCIAL ACCOUNTING MATRICES AND EXTENDED INPUT-OUTPUT TABLES
MEASURING SUSTAINABLE DEVELOPMENT: INTEGRATED ECONOMIC, ENVIRONMENTAL AND SOCIAL FRAMEWORKS – ISBN-92-64-02012-8 © OECD 2004
In the seventies, the term social accounting matrix changed its meaning. It was now used for a type of national accounting matrix especially describing the interrelationships of income and transfer flows between the different institutional units: “The pattern of these transfers conditions the distribution of income in exactly the same way as the pattern of interindustry transactions conditions the structure of production.”8 Such special emphasis on socio-economic analysis was strongly supported by Richard Stone: “We already have a disaggregation of the productive system in input-output tables and, for a more restricted number of countries, a disaggregation of the financial system in flow-of-funds tables. The missing peace is the disaggregation of income and outlay.”9
In the seventies and eighties, these concepts were especially used in developing countries.10 The promising experiences in these countries encouraged national accountants to propose socio-economic analysis as integral part of the revised concepts of national accounting.11 This strategy has been successful: SNA 1993 as well as ESA 1995 contain chapters on SAM which show its usefulness and the great variety of its applications.12 In the next section, the proposals of the international system of national accounts regarding the linkages between input-output and SAM are described in detail.
Great support for implementing the SAM concepts not only in developing but also in developed countries was given by the work done by Steven Keuning and his team at Statistics Netherlands. They presented the concepts and numerical examples of a System of Economic and Social Accounting Matrices and Extensions (SESAME) which comprises a whole family of SAM modules.13 Table 1 gives an overview on the different parts of the system which is able to describe economic, social and environmental aspects of human activities in an integrated framework. Eurostat together with several European countries is now preparing a handbook on the concepts of SAM especially based on these experiences.14
Linkages of SAM and input-output in the ESA
In the chapter on the sequence of accounts and balancing items (Chapter 8), the ESA also describes different types of matrix presentation of national accounts data (par. 8.100 - 8.155). In the introductory remarks, it is mentioned that the input-output table is a well-known example of such a presentation: “The input-output table is a widely
8. Pyatt 1999, p. 366.
9. Stone 1985, p. 181.
10. See Pyatt, Roe 1977 and Pyatt, Round 1985.
11. Keuning, de Ruijter 1988, Keuning 1991, Pyatt 1985, 1991a and 1991b.
12. Commission of the European Communities et al. 1993, pp. 461-488, Eurostat 1995, pp. 195-206.
13. See the overview in Keuning 2000 and Timmerman, van de Ven 2000 with further references.
14. Eurostat 2002.

SOCIAL ACCOUNTING MATRICES AND EXTENDED INPUT-OUTPUT TABLES – 315
MEASURING SUSTAINABLE DEVELOPMENT: INTEGRATED ECONOMIC, ENVIRONMENTAL AND SOCIAL FRAMEWORKS – ISBN-92-64-02012-8 © OECD 2004
Tab
le 1
. Sys
tem
of
Eco
nom
ic a
nd S
ocia
l Acc
ount
ing
Mat
rice
s an
d E
xten
sion
s (S
ESA
ME
)
mon
etar
y na
tiona
l acc
ount
ing
mat
rix
(NA
M)
mon
etar
y so
cio-
ec
onom
ic
Acc
ount
s
(SE
A)
non-
mon
etar
y so
cio-
dem
ogra
phic
ac
coun
ts
(SD
A)
non-
mon
etar
y
labo
ur a
ccou
nts
(LA
)
time
acco
unts
(T
A)
soci
al
acco
untin
g m
atri
x (S
AM
)
soci
al a
ccou
ntin
g m
atri
x in
clud
ing
envi
ronm
enta
l ac
coun
ts
(SA
ME
A)
natio
nal a
ccou
ntin
g m
atri
x in
clud
ing
envi
ronm
enta
l ac
coun
ts
(NA
ME
A)
link
age
wit
h so
cial
no
n-m
onet
ary
mod
ules
non-
mon
etar
y en
viro
nmen
tal
data
st
ruct
ural
pe
rfor
man
ce
indi
cato
rs

316 – SOCIAL ACCOUNTING MATRICES AND EXTENDED INPUT-OUTPUT TABLES
MEASURING SUSTAINABLE DEVELOPMENT: INTEGRATED ECONOMIC, ENVIRONMENTAL AND SOCIAL FRAMEWORKS – ISBN-92-64-02012-8 © OECD 2004
used matrix framework to supply detailed and coherently arranged information on the flow of goods and services and on the structure of production costs (par. 8.101).”
In the following paragraphs of ESA, it is shown how the full sequence of ESA accounts and balancing items could be presented in a matrix format (8.104 - 8.125 and table 8.19). Each entry in an aggregate matrix can be considered as the grand total of a submatrix which shows detailed information by different types of transactors or other groupings (par. 8.126). A more detailed matrix reveals the economic flows at a meso-level which allows an analysis of the interrelations between the different groups of economic actors. The SAM is described as a special type of matrix presentation which allows a further elaboration on the interrelations between the social and economic aspects of the system. Some information on the SAM is given in the last part of Chapter 8 of the ESA (par. 8.133 – 8.155 and tables 8.20, 8.21).
In the introductory paragraphs of the description of the SAM, the close linkages between SAM and input-output tables are stressed: “The supply and use tables opt for a classification of rows and columns which is most suitable to describe the economic processes under consideration, namely the processes of production and use of products. However, those matrices do not incorporate the interrelations between value added and final expenditure. By extending a supply and use table, or an input-output table, to show the entire circular flow of income at a meso-level, one captures an essential feature of a Social Accounting Matrix (SAM) (par. 8.133).”
According to these considerations, the SAM is defined as a presentation of ESA-accounts in a matrix which elaborates on the linkages between a supply and use table and sector accounts (par. 8.134). Special emphasis is laid on the role of people in the economy which implies a further breakdown of the household sector and a disaggregation of the persons employed. In this context, two parts of the use table of the input-output framework are especially disaggregated: the components of net value added, shown in the third quadrant of the table, and the final uses which are presented in the second quadrant.
Table 8.22 of the ESA gives an example of a detailed matrix of net value added. The compensation of employees is subdivided by resident and non-resident employees. Resident employees are further disaggregated by sex, category of occupation and place of residence. Net operating surplus is shown in a breakdown by the (sub) sector of the enterprises to which the establishment belongs, and net mixed income according to the location of the household enterprises (par. 8.153). Employees could further be subdivided by level of schooling, age and type of job contract (full-time/part-time, permanent/temporary) (par. 8.136). It is recommended that labour income is also decomposed into hours worked and average wage rates per hour (par. 8.138).
In the input-output framework, final uses are shown in a breakdown by product group. The SAM concepts recommend a further breakdown of final consumption expenditures by institutional sectors (e.g. types of households). Changes in inventories should be shown in a cross classification by product group and institutional sector, gross fixed capital formation by product group and investing industries. For socio-economic analysis, the proposed breakdown of final consumption expenditures by product group and household (sub) sectors would have higher priority than the disaggregation of capital formation.

SOCIAL ACCOUNTING MATRICES AND EXTENDED INPUT-OUTPUT TABLES – 317
MEASURING SUSTAINABLE DEVELOPMENT: INTEGRATED ECONOMIC, ENVIRONMENTAL AND SOCIAL FRAMEWORKS – ISBN-92-64-02012-8 © OECD 2004
Example of a SAM based on input-output analysis (SAMIO)
In this section, an example is given for using extended input-output tables and SAM modules to compile a SAM which is based on results of input-output analysis. This matrix is called SAMIO to stress the linkages between SAM and the I-O framework. The example shall encourage common research and analysis of input-output and SAM specialists. Such cooperation is urgently needed for improving the data base for developing strategies towards sustainable development.
By applying input-output models, the SAMIO gives a very condensed picture of the production and consumption activities of certain groupings of the population. The SAM data on value added and labour inputs by socio-economic group are directly linked with the SAM modules on final uses by socio-economic group. Such linkages of labour and consumption were already proposed by Utz-Peter Reich, Philipp Sonntag and Hans-Werner Holub twenty-five years ago.15 They presented a Labour-Consumption Accounting which has several similarities with the approach presented in this section.
The SAMIO concepts allow a new type of operating surplus: Each socio-economic group is not only delivering results of their production activities to themselves or to other persons but also receiving such results from themselves or from others. The balancing items of these flows show for each socio-economic group who is the “net recipient” or “net supplier” of these interrelationships. The total amount of received production values could be treated as a variable of the welfare function of these persons.
Following the concepts of the “magic triangle” of input-output tables, the SAMIO is compiled in time units, in monetary units and in physical term (tons).16 Differing from traditional concepts, the concepts of SAMIO are derived from considerations on the time use of the population. In this context, the pioneering work of Gary Becker and Graham Pyatt was very stimulating for developing suitable concepts.17 A broader approach which is also based on welfare considerations was proposed by Gerhard Scherhorn.18 He also distinguishes welfare caused by goods and services, welfare connected with time use and welfare related to environmental conditions.
Data base for compiling SAMIO
An extended monetary input-output table - similar to the table described in the context of the “magic triangle” - is the starting point for the computation.19 Table 2 shows this table based on 1990 data for Germany. The main differences refer to the treatment of education services, the concepts of household services and the disaggregation of the private consumption.
Education services (column/row 7) are treated in a more conventional way. The gross output does not become part of fixed capital formation but is treated as government consumption. This concept also implies that the consumption of fixed produced assets
15. Reich et al. 1977, see also Horz, Reich 1982 and Reich 1986.
16. See Stahmer 2000.
17. See Becker 1965 and Pyatt 1990. Cf. also Kazemier, Exel 1992.
18. Scherhorn 2002 with further references.
19. See the detailed information in Stahmer et al. 2002 and Stahmer 2000.

318 – SOCIAL ACCOUNTING MATRICES AND EXTENDED INPUT-OUTPUT TABLES
MEASURING SUSTAINABLE DEVELOPMENT: INTEGRATED ECONOMIC, ENVIRONMENTAL AND SOCIAL FRAMEWORKS – ISBN-92-64-02012-8 © OECD 2004
does not include the consumption of educational capital. Furthermore it is not necessary to introduce the margin of education as a balancing item.
The treatment of all household services as production activities has not changed.20 According to this concept, consumer durables are investment goods which are depreciated. Differing from the monetary I-0 table of the “magic triangle”, the labour inputs of household production (defined with the so-called third-person criterion) get no monetary value. Some changes have also been made with regard to the uses of household services. Household services related to employment (column/row 10) are not treated as intermediate consumption but as private consumption. According to this concept, the balancing item of the margin of labour was not necessary. Corresponding with the treatment of education services, the household services related to studying (column/row 11) are not treated as fixed capital formation but as private consumption. No changes have been made in the cases of the use of household production services (column/row 9) and other household services (column/row 12). Household production services are mainly intermediate inputs, other household services represent the main part of private consumption.
The column of private consumption is further subdivided by specific socio-economic groups of the population. The example in table 2 only shows a disaggregation by young people (0 - 17 years old), adults except aged persons (18 - 64 years old) and aged persons (65 years and older). The detailed breakdown of private consumption compiled for Germany 1990 comprises 32 types of households with further subdivisions by the persons living in the households (2 to 5 groups of persons). The basic data only deliver monetary information on the households as a whole. The further breakdown by person could partly be estimated by applying specific weighting procedures and partly by using simplified weighting systems (e.g. equivalent scales). Following this two-stage procedure, the whole population was finally disaggregated by 120 groups of persons. Main emphasis has been laid on the situation of young people in different types of families. These data were compiled in the context of a research project sponsored by the “Deutscher Arbeitskreis für Familienhilfe (German Association for Supporting Families)”, Kirchzarten.
As memorandum items, table 2 also shows the direct time inputs of the different activities. In the case of employment (columns 1 – 8), the time inputs show the hours at the working place.
For socio-economic analysis, it is preferable to endogenize the consumption of fixed produced assets. Finally, the use of fixed assets has also an intermediate character.21 Investment goods are directly or indirectly inputs for producing private or government consumption goods and services, other investment goods or exports. Input-output models can reveal these linkages between inputs and final uses. As a necessary data base for input-output analysis, the depreciation items of the different industries (branches) are subdivided by the type of investment goods. For modelling purposes, these data are treated as additional intermediate inputs. In accordance with this concept, the primary inputs (third quadrant of the I-O table) will only comprise imports for intermediate uses and net value added. An additional correction has to be made in the second resp. fourth quadrant. The columns of fixed capital formation are reduced by the corresponding items of depreciation showing only net capital formation. Thus, the row sums of total uses of depreciation will become zero. Table 3 shows such a matrix for the consumption of
20. See Becker 1964 and Lancaster 1966.
21. See Stahmer, Strassert 2002.

SOCIAL ACCOUNTING MATRICES AND EXTENDED INPUT-OUTPUT TABLES – 319
MEASURING SUSTAINABLE DEVELOPMENT: INTEGRATED ECONOMIC, ENVIRONMENTAL AND SOCIAL FRAMEWORKS – ISBN-92-64-02012-8 © OECD 2004
domestically produced assets and the corresponding corrections. Row 13 of table 3 corresponds with row 19 of table 2.
Socio-economic activities are not only based on the use of domestic product but also directly or indirectly linked with imported goods and services. For analyzing the impacts of foreign trade in the countries of origin it is necessary to endogenize not only the consumption of fixed assets but also the intermediate inputs of imports. A thorough analysis of the production activities abroad would only be possible if input-output tables of all important countries delivering import goods would be available. For getting first estimates, it is possible to apply the domestic input structures also for describing foreign production activities. Of course, such assumption neglects the fact that many imported products are not domestically produced. Table 3 also shows an import matrix which is used for input-output analysis in the following sections. It should be mentioned that this import matrix also contains a depreciation matrix for the imported investment goods with corresponding corrections in the columns of fixed capital formation. The data on imports correspond with the figures in table 2, rows 20, 22 and 23.

320 – SOCIAL ACCOUNTING MATRICES AND EXTENDED INPUT-OUTPUT TABLES
MEASURING SUSTAINABLE DEVELOPMENT: INTEGRATED ECONOMIC, ENVIRONMENTAL AND SOCIAL FRAMEWORKS – ISBN-92-64-02012-8 © OECD 2004
Table 2. Extended monetary Billion Input of
agri- culture, forestry, fishing
mining, water and
energy supply
manu- facturing
con-struc- tion
market services
environ- mental protec-
tion ser-
vices
edu-cation
services
non- market services
house- hold
produc- tion R
ow N
o.
Uses Supply
1 2 3 4 5 6 7 8 9
Product output by product group
1 Products of agriculture, forestry, fishing 7.5 0.1 43.4 0.1 5.9 - 0.1 1.1 6.0
2 Prod.of mining, water and energy supply 1.8 30.8 45.0 0.5 20.7 0.7 1.6 5.7 15.4
3 Products of manufacturing 14.8 13.1 571.1 72.0 109.0 2.4 2.7 41.3 109.1
4 Construction work 0.7 3.9 7.1 4.2 23.4 1.8 1.3 7.2 1.0
5 Market services 8.2 15.9 288.6 39.6 424.5 1.7 7.8 109.1 127.9
6 Environmental protection services 0.1 0.9 5.2 2.0 1.8 4.9 0.5 1.1 2.5
7 Education services - - - - - - - -
8 Non-market services 0.4 0.5 5.8 0.7 4.9 1.3 0.1 66.5 2.8
9 Household production services - - - - - - - - 42.3
10 Househ. services related to employment - - - - - - - - -
11 Household services related to education - - - - - - - - -
12 Other household services - - - - - - - - -
13 Domestic products, totals 33.5 65.1 966.0 119.1 590.1 12.9 14.1 232.1 307.0
14 Compensation of employees 7.0 35.4 486.3 85.4 405.7 6.2 77.8 211.6 -
15 Net operating surplus 21.9 12.3 94.9 34.6 388.1 - 0.7 0.4 - -
Revenues on products
16 Non-deductible value added tax - - - - 11.6 1.0 1.3 14.3 23.3
17 Taxes less subsidies on products - 4.5 - 2.6 54.5 2.3 23.3 - 0.2 0.3 -
18 Net value added 24.4 45.2 635.6 122.3 828.7 6.4 79.7 226.2 23.3
Consumption of fixed produced assets 2)
19 Domestic investment goods 10.3 17.6 61.5 4.6 141.3 6.2 7.5 8.4 22.9
20 Imported investment goods 1.5 2.7 11.4 0.7 18.3 0.3 0.9 0.9 6.8
21 Non-deductible value added tax - - - - 11.2 - - 2.6 3.6
Imports from the rest of the world
22 Goods 5.9 13.4 225.2 13.0 29.5 0.7 0.6 13.6 42.1
23 Services 0.4 0.7 8.6 1.0 22.9 0.0 0.9 5.7 4.8
24 Primary inputs, totals 42.6 79.6 942.3 141.7 1 051.8 13.6 89.5 257.5 103.6
25 Gross output, final uses 76.0 144.7 1 908.3 260.8 1 642.0 26.6 103.6 489.6 410.6
Memorandum item:
26 Time inputs (Mill.hours) 2 035 743 13 821 3 333 17 404 262 1 828 6 841 82 320
1) Including consumption of private non-profit organisations serving households (18.7 Bill..DM). 2) Including consumer durables.

SOCIAL ACCOUNTING MATRICES AND EXTENDED INPUT-OUTPUT TABLES – 321
MEASURING SUSTAINABLE DEVELOPMENT: INTEGRATED ECONOMIC, ENVIRONMENTAL AND SOCIAL FRAMEWORKS – ISBN-92-64-02012-8 © OECD 2004
input-output table - Germany 1990 - Deutsch marks branches Final uses
household services (except household production)
private consumption fixed capital
formation
services related to employ-
ment
services related to studying
other services
totals young
persons
adults (except
aged persons)
aged persons
govern- ment con-
sump- tion1)
fixed assets
(except consumer durables
incl. change in
stocks)
con-sumer
durables
exports to the rest of
the world
totals Total uses
10 11 12 13 14 15 16 17 18 19 20 21 22
Row no.
0.1 0.0 3.2 67.3 - - - - 2.8 - 5.9 8.7 76.0 1
0.4 0.2 18.4 141.3 - - - - - 0.7 - 4.1 3.4 144.7 2
7.6 1.5 116.1 1 060.6 - - - - 184.7 73.3 589.7 847.7 1 908.3 3
0.1 - 2.4 53.1 - - - - 205.1 - 2.5 207.7 260.8 4
20.1 10.1 403.4 1 457.1 - - - - 32.6 40.7 111.6 184.9 1 642.0 5
0.2 0.1 7.2 26.5 - - - 0.1 - - - 0.1 26.6 6
- - - - - - - 103.6 - - - 103.6 103.6 7
0.3 2.2 20.7 106.2 380.6 1.1 - 1.8 383.4 489.6 8
- 5.6 297.7 345.6 32.7 25.2 6.9 - - - - 64.8 410.4 9
- - - - 0.6 51.3 1.1 - - - - 53.0 53.0 10
- - - - 17.0 7.6 1.2 - - - - 25.8 25.8 11
- - - - 97.8 824.8 177.4 - - - - 1 099.9 1 099.9 12
28.7 19.8 869.2 3 257.7 148.1 908.9 186.7 484.2 425.6 114.0 715.6 2 983.0 6 240.7 13
- - - 1 315.5 - 1 315.5 14
- - - 551.4 - 551.4 15
3.0 1.1 50.3 106.0 - - - - 27.7 17.9 3.4 49.0 155.0 16
- - - 73.4 - 73.4 17
3.0 1.1 50.3 2 046.3 - 2 046.3 18
9.6 1.6 53.5 345.1 - - - - - 257.4 - 87.7 - - 345.1 - 19
2.9 0.6 14.4 61.3 - - - - - 36.6 - 24.7 - - 61.3 - 20
1.5 0.3 8.3 27.5 - - - - - 13.8 - 13.7 - - 27.5 - 21
5.0 1.0 70.2 420.1 66.3 31.9 47.4 145.6 565.7 22
2.2 1.4 34.0 82.7 0.1 0.1 0.4 0.6 83.3 23
24.2 6.0 230.6 2 983.0 - - - - - 241.5 - 94.0 47.8 - 287.7 2 695.3 24
53.0 25.8 1 099.8 6 240.7 148.1 908.9 186.7 484.2 184.1 20.0 763.4 2 695.3 25
12 255 15 430 397 824 554 097 26

322 – SOCIAL ACCOUNTING MATRICES AND EXTENDED INPUT-OUTPUT TABLES
MEASURING SUSTAINABLE DEVELOPMENT: INTEGRATED ECONOMIC, ENVIRONMENTAL AND SOCIAL FRAMEWORKS – ISBN-92-64-02012-8 © OECD 2004
Table 3. Additional Billion Input of
agri- culture, forestry, fishing
mining, water and
energy supply
manu- facturing
con-struc- tion
market services
environ- mental protec-
tion ser-
vices
edu-cation
services
non- market services
house- hold
produc- tion
Row No.
Uses Supply 1 2 3 4 5 6 7 8 9
Consumption of fixed domestically produced assets
Product group
1 Products of agriculture, forestry, fishing - - - - 0.2 - - - -
2 Prod.of mining,water and energy supply - - - - - - - - -
3 Products of manufacturing 7.1 11.7 46.4 3.5 56.1 0.7 2.7 2.7 15.0
4 Construction work 2.3 4.9 9.5 0.6 71.7 5.4 4.2 5.2 -
5 Market services 0.9 1.0 5.5 0.5 12.8 0.1 0.5 0.5 7.9
6 Environmental protection services - - - - - - - - -
7 Education services - - - - - - - - -
8 Non-market services - - 0.1 - 0.4 - - - -
9 Household production services - - - - - - - - -
10 Househ. services related to employment - - - - - - - - -
11 Household services related to education - - - - - - - - -
12 Other household services - - - - - - - - -
13 Totals 10.3 17.6 61.5 4.6 141.3 6.2 7.5 8.4 22.9
Imports from the rest of the world
Product group
1 Products of agriculture, forestry, fishing 1.5 0.0 15.6 0.0 1.8 - 0.0 0.7 8.9
2 Prod.of mining,water and energy supply 0.1 9.0 25.6 0.0 0.2 0.0 0.0 0.1 0.2
3 Products of manufacturing 5.8 7.0 195.4 13.7 45.5 0.9 1.4 13.7 39.8
4 Construction work 0.0 0.0 0.0 0.1 0.3 0.0 0.0 0.0 0.0
5 Market services 0.4 0.7 8.7 1.0 22.9 0.0 0.7 4.0 4.6
6 Environmental protection services - - - - - - - - -
7 Education services - - - - - - - - -
8 Non-market services - - - - - - 0.1 1.7 0.2
9 Household production services - - - - - - - - -
10 Househ. services related to employment - - - - - - - - -
11 Household services related to education - - - - - - - - -
12 Other household services - - - - - - - - -
13 Totals 7.8 16.8 245.3 14.8 70.7 1.0 2.3 20.2 53.7
14 Goods 5.9 13.4 225.2 13.0 29.5 0.7 0.6 13.6 42.1
15 Services 0.4 0.7 8.6 1.0 22.9 0.0 0.9 5.7 4.8
16 Consumption of imported fixed produced assets 1)
1.5
2.7
11.4
0.7
18.3
0.3
0.9
0.9
6.8
1) Including consumer durables.
use tables 1990 – Deutsche marks branches Final uses Total Row

SOCIAL ACCOUNTING MATRICES AND EXTENDED INPUT-OUTPUT TABLES – 323
MEASURING SUSTAINABLE DEVELOPMENT: INTEGRATED ECONOMIC, ENVIRONMENTAL AND SOCIAL FRAMEWORKS – ISBN-92-64-02012-8 © OECD 2004
household services (except household production)
private consumption fixed capital
formation
services related to employ-
ment
services related to studying
other services
totals young
persons
adults (except
aged persons)
aged persons
govern- ment con-
sump- tion1)
fixed assets
(except consumer durables
incl. change in
stocks)
con-sumer
durables
exports to the rest of
the world
totals
uses
10 11 12 13 14 15 16 17 18 19 20 21 22
no.
domestic ally produced assets
- - - 0.2 - - - - - 0.2 - - - 0.2 - 1
- - - 0.0 - - - - - - - - - 2
7.4 1.0 33.1 187.6 - - - - - 131.0 - 56.5 - - 187.6 - 3
- - - 103.9 - - - - - 103.9 - - - 103.9 - 4
2.2 0.6 20.4 52.9 - - - - - 21.8 - 31.1 - - 52.9 - 5
- - - - - - - - - - - - - 6
- - - - - - - - - - - - - 7
- - - 0.6 - - - - - 0.6 - - - 0.6 - 8
- - - - - - - - - - - - - 9
- - - - - - - - - - - - - 10
- - - - - - - - - - - - - 11
- - - - - - - - - - - - - 12
9.6 1.6 53.5 345.1 - - - - - 257.4 - 87.7 - - 345.1 - 13
rest of the world
0.1 0.0 4.1 32.8 - - - - 0.8 - 1.1 1.9 34.7 1
0.0 0.0 0.2 35.3 - - - - - 0.1 - 0.0 0.0 35.3 2
7.8 1.6 80.1 412.7 - - - - 28.6 7.3 46.4 82.4 495.0 3
0.0 - 0.0 0.5 - - - - 0.4 - 0.0 0.4 0.9 4
2.2 1.2 32.8 79.3 - - - - 0.0 0.0 0.2 0.2 79.5 5
- - - - - - - - - - - - - 6
- - - - - - - - - - - - - 7
0.0 0.2 1.4 3.6 - - - - - - - - 3.6 8
- - - - - - - - - - - - - 9
- - - - - - - - - - - - - 10
- - - - - - - - - - - - - 11
- - - - - - - - - - - - - 12
10.1 3.0 118.6 564.2 - - - - 29.8 7.4 47.8 84.9 649.1 13
5.0 1.0 70.2 420.1 - - - - 66.3 31.9 47.4 145.6 565.7 14
2.2 1.4 34.0 82.7 - - - - 0.1 0.1 0.4 0.6 83.3 15
2.9 0.6 14.4 61.3 - - - - - 36.6 - 24.7 - - 61.3 - 16
For linking environmental aspects with the socio-economic data base of I-O tables, material balances are used which give a complete description of all physical inputs and

324 – SOCIAL ACCOUNTING MATRICES AND EXTENDED INPUT-OUTPUT TABLES
MEASURING SUSTAINABLE DEVELOPMENT: INTEGRATED ECONOMIC, ENVIRONMENTAL AND SOCIAL FRAMEWORKS – ISBN-92-64-02012-8 © OECD 2004
outputs of the different industries (branches). The data used in the context of describing ecological aspects of the SAMIO in section 3.4 are shown in table 4.
In linking physical flows with the monetary data of the extended I-O table, only parts of the material balances are used. Physical flows, which are not further taken into account, are indicated by italic letters. With regard to the product flows, all intermediate domestic products (rows 2 and 17) will be excluded. Remaining product flows are only the imports of intermediate products (row 3), exports of goods (row 19) and the physical flows of investment goods (row 18). In the case of raw materials and residuals, all throughput materials (rows 8 and 20) are excluded. These materials comprise cooling water or soil excavation for structures which are used as raw materials and which are given back to the nature as residuals without any further economic treatment. Furthermore, residuals which are still treated or re-used for economic purposes (rows 5 and 21), are excluded. The remaining residuals (rows 23 to 28) which are linked with socio-economic data in the model described in section 3.4, are stored in controlled landfills (like waste) or are disposed back into the nature (e.g. air pollution or treated waste water). In the case of natural resources, only those are taken into account in socio-economic modelling which are used as inputs of economic activities (rows 9 to 14).
SAMIO in time units
The social accounting matrix based on input-output analysis (SAMIO) focusses on the activities of the population disaggregated by socio-demographic or socio-economic groups of persons. A very simple disaggregation of the population is used as example in this chapter: The persons are only subdivided according to their age. The chosen three groupings of the population are young people (0 to 17 years old), adults except seniors (18 to 64 years old) and aged persons (65 years and older). In Germany 1990, 11.6 million persons belonged to the young people, 42.0 to the adults except seniors and 9.7 to the aged people. Other possible classifications could be types of households, education levels or sex.

SOCIAL ACCOUNTING MATRICES AND EXTENDED INPUT-OUTPUT TABLES – 325
MEASURING SUSTAINABLE DEVELOPMENT: INTEGRATED ECONOMIC, ENVIRONMENTAL AND SOCIAL FRAMEWORKS – ISBN-92-64-02012-8 © OECD 2004
Tot
als
13
8 82
5 8
438
387
4 59
1
4 56
9 22
41 3
45
8 16
5 19
3 67
3 6
177
810
311 1
62 9
26
9 26
6 8
438
622
206
41 3
45
4 56
9
7 74
6 54
1 4
600
1 56
7 22
6 77
8 34
62 9
26
othe
r
serv
ices
12 2 20
1 2
180 21 2 - 2 -
152 - -
42
110 - -
2 35
4 - - - - -
1 89
6
459 27 3
321 -
99 9
2 35
4
serv
ices
re
late
d to
st
udyi
ng
11
37
36 1 0 - 0 - 5 - - 1 4 - -
42 - - - - -
32
10 0 0 6 - 4 0 42
hous
ehol
d se
rvic
es (
exce
pt
hous
ehol
d pr
oduc
tion)
serv
ices
re
late
d to
em
ploy
- m
ent
10
75
71 4 0 - 0 -
29 - - 1 28 - -
105 - - - - -
60
45 0 0 20 -
24 1
105
hous
e-
hold
pr
oduc
- tio
n 9 802
783 19 1 - 1 -
94 - -
15
79 - -
897
36
36 - - -
660
201 3 1
126 -
68 3
897
non-
m
arke
t se
rvic
es
8 333
331 2 0 0 0 -
90 - 1 77
12 - -
423
17 0 17 - -
299
107 2 -
93 -
12 0
423
educ
atio
n se
rvic
es
7 52
52 0 0 0 0 -
15 - -
13 2 - -
67 - - - - -
49
18 0 -
15 - 2 0 67
envi
ron-
m
enta
l pr
otec
- tio
n se
rvic
es
6
17
17 0
4 46
1
4 46
1 -
3 50
0 10 - - -
10 - -
7 98
8 0 0 - -
3 50
0 13
4 47
5 44
4 39
5 22 -
12 1
7 98
8
mar
ket
serv
ices
5 148
134 13
104
104 0 -
118 - -
28
90 - -
370
99
80 7 13 -
114
157 20
-
54 -
80 4
370
cons
truc
- tio
n 4 618
590 28
9 0 9
113 68
-
56 4 8 - -
808
540 6
534 0
113 80
75
58 - 8 - 7 1
808
man
u-
fact
urin
g
3
2 20
2 1
963
239 13
3 9
5 34
6
1 13
9 -
591
373
175 - -
8 69
9
1 36
1 1
187 18
156
5 34
6
1 23
7
755
116
184
283 -
161 11
8
700
min
ing,
w
ater
and
en
ergy
su
pply
2
2 14
1 2
092 49 1 - 1
32 3
86
5 83
9 19
3 25
5 36
1
258 - 1
40 3
67
6 96
1 6
935 -
27
32 3
86
102
918 18
18
606 -
274 2
40 3
67
In
put o
f br
anch
es
agri
- cu
lture
, fo
rest
ry,
fish
ing
1 In
puts
19
9 18
8 10 - - - -
607 - 1
262 33
311 -
806
Out
puts
25
1 19
4 47
10 -
27
527
253 -
13
226 34
2 80
6
Use
s S
uppl
y
Pro
duct
inpu
ts
D
omes
tic
orig
in
I
mpo
rted
Res
idua
l inp
uts
for
econ
omic
trea
tmen
t or
re-u
se
C
urre
nt p
rodu
ctio
n
Fix
ed p
rodu
ced
asse
ts
Nat
ural
res
ourc
e in
puts
of t
hrou
ghpu
t m
ater
ials
O
ther
nat
ural
res
ourc
e in
puts
Ene
rgy
carr
ies
O
ther
sol
id m
ater
ials
Wat
er r
aise
d
Oxy
gen
C
arbo
n di
oxid
e
Oth
er a
ir c
ompo
nent
s T
otal
s D
omes
tic p
rodu
ct o
utpu
ts
In
term
edia
te p
rodu
cts
G
ross
cap
ital
form
atio
n
Exp
orts
R
esid
ual o
utpu
ts o
f th
roug
hput
mat
eria
ls
Res
idua
l out
puts
for
eco
nom
ic tr
eatm
ent o
r re
-use
O
ther
res
idua
l out
puts
Was
te
W
aste
wat
er
W
ater
vap
oris
ed
O
xyge
n
Car
bon
diox
ide
O
ther
air
em
issi
ons
Tot
als
Tab
le 4
. Mat
eria
l bal
ance
s 19
90
Mill
ion
tons
Row
. N
o.
1 2 3 4 5 6 7 8 9 10
11
12
13
14
15
16
17
18
19
20
21
22
23
24
25
26
27
28
29
326 – SOCIAL ACCOUNTING MATRICES AND EXTENDED INPUT-OUTPUT TABLES
MEASURING SUSTAINABLE DEVELOPMENT: INTEGRATED ECONOMIC, ENVIRONMENTAL AND SOCIAL FRAMEWORKS – ISBN-92-64-02012-8 © OECD 2004
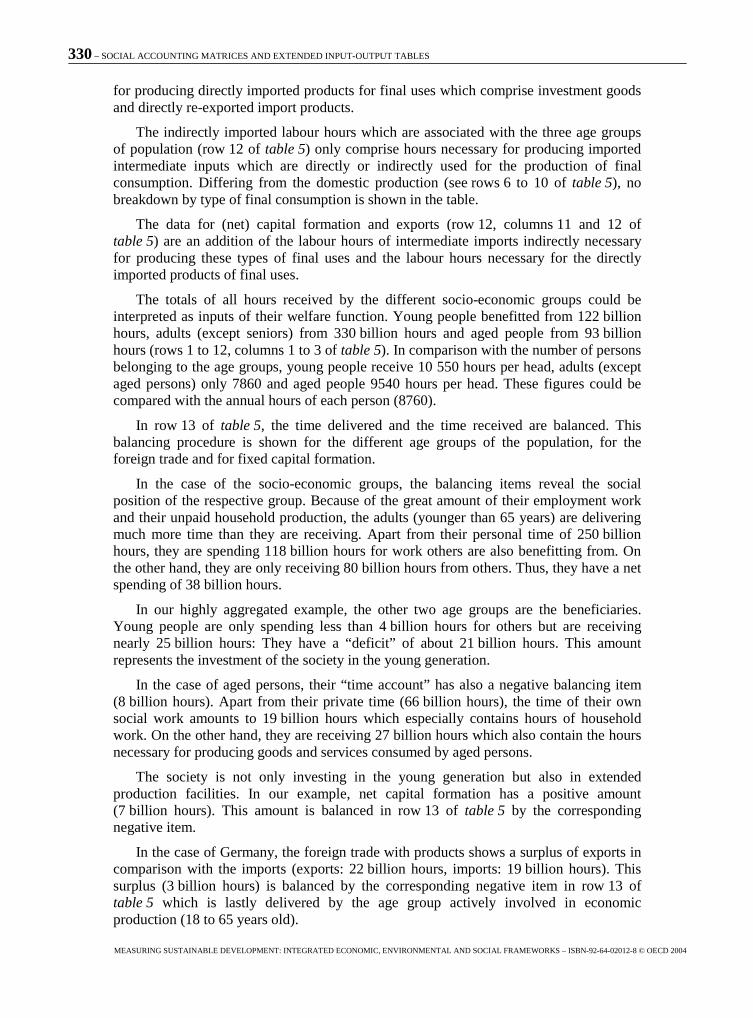
Starting point for constructing a SAMIO is the total amount of hours available in one year to the different groups of population. It is easy to compile these data because the yearly time budget is fixed (8 760 hours per person, in leap years 8 736 hours). In row 14 and columns 1 to 3 of table 5, the available time of the three groups of population is recorded. These figures could be interpreted as the total supply of time.
The use of the time budget of the age groups is shown in the first three rows of table 5. Three different types of time use are distinguished:
• personal activities which are undertaken for own purposes only (columns 1 to 3),
• unpaid household production activities done not only for own purposes but also for other members of the same household or for members of other households (columns 4 to 6) and
• paid employment activities which aim at producing marketed or non-marketed products.
The figures of the first two mentioned categories were estimated using the data of the time budget survey 1991/92. In the case of employment, the totals are also recorded in the time budget survey. The disaggregation of hours worked according to the different types of final uses and the age groups can only be made by input-output analysis. The directly and indirectly necessary labour hours of the different socio-economic groups of the population to produce the different types of final uses can be estimated by the following equations:
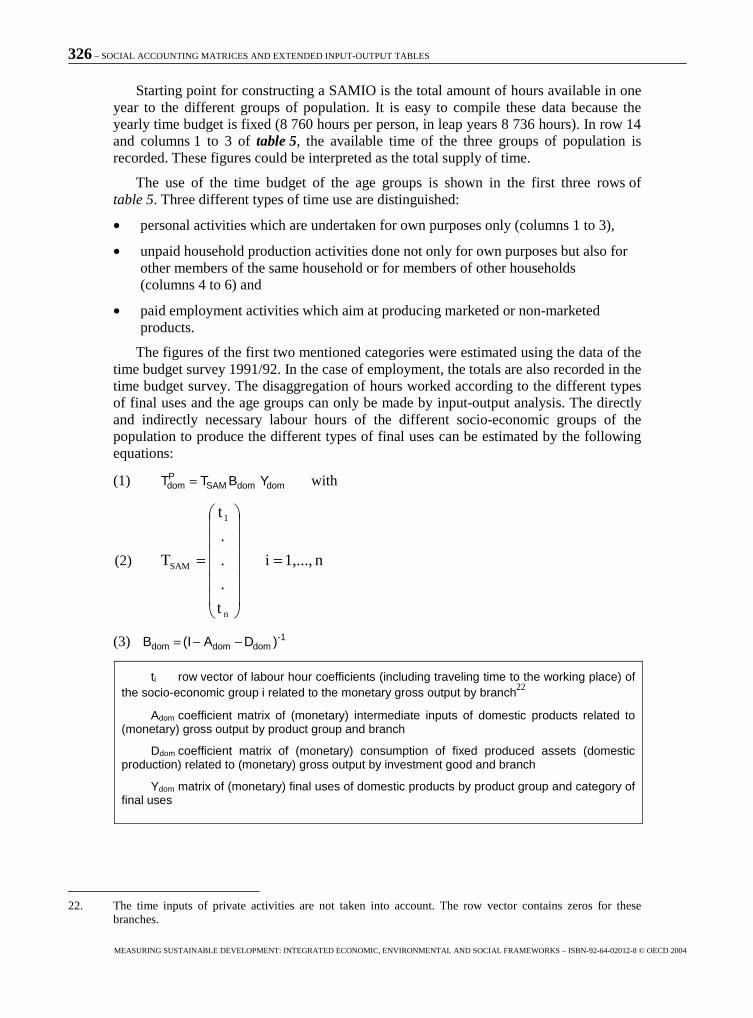
(1) domdomSAMPdom YBTT = with
(2) n1,...,i
t
.
.
.
t
T
n
1
SAM =
=
(3) -1domdomdom )DA(IB −−=
ti row vector of labour hour coefficients (including traveling time to the working place) of the socio-economic group i related to the monetary gross output by branch22
Adom coefficient matrix of (monetary) intermediate inputs of domestic products related to (monetary) gross output by product group and branch
Ddom coefficient matrix of (monetary) consumption of fixed produced assets (domestic production) related to (monetary) gross output by investment good and branch
Ydom matrix of (monetary) final uses of domestic products by product group and category of final uses
22. The time inputs of private activities are not taken into account. The row vector contains zeros for these
branches.

SOCIAL ACCOUNTING MATRICES AND EXTENDED INPUT-OUTPUT TABLES – 327
MEASURING SUSTAINABLE DEVELOPMENT: INTEGRATED ECONOMIC, ENVIRONMENTAL AND SOCIAL FRAMEWORKS – ISBN-92-64-02012-8 © OECD 2004
Tot
al
uses
(13)
101.
2
368.
0
84.9
77.1
5.2
22.8
0.
7 3.
0 4.
0 7.
1 0.
0 18
.9
0.0
63 2
50
Exp
orts
of
pr
oduc
ts
(12)
0.1
16.0
5.
6 -
2.8
18.9
Net
fi
xed
capi
tal
form
a-
tion
(11)
4.9
1.9
- 6.
8 0.
0
Oth
er
gove
rn-
men
t se
rvic
es
(10)
0.1
6.9
0.1
7.1
Hea
lth
serv
ices
(9)
3.9
0.1
4.0
Edu
- ca
tion
serv
ices
(8)
3.0
3.0
Serv
ices
of
N
PISH
1
(7)
0.7
0.7
Em
ploy
men
t
Fina
l con
sum
ptio
n Pr
ivat
e co
n-
sum
p-
tion
(6) 0.
7
21.2
0.9
22.8
Serv
ices
be
twee
n ho
use-
ho
lds
(5) 0.
1
4.1
1.0
5.2
Hou
seho
ld
prod
uctio
n Se
rvic
es
with
in
hous
e-
hold
s (4
) 2.5
57.9
16.7
77
.1
Age
d pe
rson
s
(3)
66.1
16.7
1.8
3.4
0.1
0.1
1.4
1.1
1.8
- 7.
6 84
.9
9 69
3
Adu
lts
(exc
ept
aged
pe
rson
s)
(2)
249.
4
45.2
2.1
16.7
0.
5 1.
1 2.
2 4.
7 8.
2 37
.9
368.
0
42 0
06
Pers
onal
act
iviti
es
You
ng
pers
ons
(1)
97.7
15.2
1.3
2.7
0.1
1.8
0.4
1.3
1.4
-20.
7 10
1.2
11 5
51
U
ses
S
uppl
y
You
ng p
erso
ns (
unti
l 17
year
s ol
d)
Adu
lts (
excl
. age
d pe
rson
s)
(18
to 6
4 ye
ars
old)
Age
d pe
rson
s (6
5 ye
ars
and
olde
r)
Unp
aid
serv
ices
with
in
hous
ehol
ds
Unp
aid
serv
ices
bet
wee
n ho
useh
olds
Priv
ate
cons
umpt
ion
Serv
ices
of
NPI
SH1
Edu
catio
n se
rvic
es
Hea
lth
serv
ices
O
ther
gov
ernm
ent s
ervi
ces
Net
fix
ed c
apita
l for
mat
ion
Impo
rts
of p
rodu
cts
Bal
ance
s T
otal
Sup
ply
Mem
oran
dum
item
: Po
pula
tion
(1 0
00 p
erso
ns)
Tab
le 5
. Soc
ial a
ccou
ntin
g m
atri
x in
tim
e un
its
base
d on
inpu
t-ou
tput
ana
lysi
s (S
AM
IO -
T)
1990
B
illio
ns h
ours
Row
N
o.
1 2 3 4 5 6 7 8 9 10
11
12
13
14
1 Non
-pro
fit i
nsti
tuti
ons
serv
ing
hous
ehod
s.

328 – SOCIAL ACCOUNTING MATRICES AND EXTENDED INPUT-OUTPUT TABLES
MEASURING SUSTAINABLE DEVELOPMENT: INTEGRATED ECONOMIC, ENVIRONMENTAL AND SOCIAL FRAMEWORKS – ISBN-92-64-02012-8 © OECD 2004
It has to be mentioned that the labour hours necessary to produce investment goods are shown in table 5 for net investment only. Labour hours directly and indirectly necessary for reproducing depreciated investment goods are associated with the other final uses (private consumption, government consumption, exports).
The breakdown of labour hours by age group and branch is part of a SAM module describing the paid working hours disaggregated according to different socio-demographic and socio-economic criteria (see the module time accounts (TA) in table 1). In the case of the chosen age groups, it was only necessary to distribute a few labour hours of young and aged persons among the different branches because their participation in paid employment is low. Table 5 reveals the expected result that most of the hours spent for paid employment are associated with persons aged from 18 to 65 years.
The first three columns of table 5 show the beneficiaries of the time spent. The three age groups of the population receive
• hours of personal activities from themselves (rows 1 to 3),
• hours of household production from themselves, from other members of the same household or from members of other households (rows 4 and 5) and
• hours of paid employment activities as far as they consume products which are directly or indirectly produced by these labour hours.
The distribution among the beneficiaries of the hours of household production activities could partly be compiled by the results of specific questions of the time budget survey. In several cases, the distribution could only be roughly estimated using suitable ratios of distribution (e.g. number of persons in the different types of household).
The distribution of the labour hours directly and indirectly necessary for producing consumption goods and services (row 6) for the different age groups of population could be estimated by using equation (4):
(4) SAMdomudom YBtt = with
(5) )ex'inv'C...(CY m1SAM = and i = 1, ...,n
(6) ∑=
=n
1iitt
Ydom and YSAM are related in the following way:
(7) )ex'inv'(CYdom = with
(8) ∑=
=n
1iiCC
Ci matrix of (monetary) final consumption of the socio-economic group i by product group and category of final consumption
inv' column vector of net fixed capital formation by product group
ex' column vector of exports of goods and services by product group

SOCIAL ACCOUNTING MATRICES AND EXTENDED INPUT-OUTPUT TABLES – 329
MEASURING SUSTAINABLE DEVELOPMENT: INTEGRATED ECONOMIC, ENVIRONMENTAL AND SOCIAL FRAMEWORKS – ISBN-92-64-02012-8 © OECD 2004
According to equation (5), the disaggregation of final uses by socio-demographic/economic groups not only contains a breakdown of private consumption (as it is done in table 2 ) but is also extended to the consumption of non-profit institutions serving households (NPISH) and government consumption. For a comprehensive socio-economic analysis, the beneficiaries of non-market services should be identified. These services comprise parts of individual consumption which could be associated with specific groups of persons without greater difficulties and collective consumption which are provided simultaneously to all members of the community (see ESA, par. 3.83).
In our numerical example, private consumption (row 7) can be subdivided by 120 groups of persons in 32 types of households. For calculating table 5, the socio-economic classification was aggregated to the three age groups. The distribution of education services (row 8) among the age groups of pupils was relatively easy. In the input-output table used as data base, ten different types of institutions delivering education services were distinguished (from “kindergarten” up to university)23. The distribution of the other services of government and of the non-profit institutions serving households among the age groups of population was estimated based on quota which was derived from different sources. In the case of health services (row 9), detailed data of the health insurance companies could be used. It should be mentioned that the health services only comprise the non-marketed part. Services directly paid by households are recorded as private consumption. As far as no special key was available, the final consumption items were distributed according to the number of persons in each age group.
The population is not only consuming domestic products but also imported goods and services. Thus, labour hours abroad are necessary to produce directly or indirectly the products which are delivered to the importing country. If no information on the input-output relations in countries producing import products were available, it seems acceptable to use the assumption of same input coefficients for producing domestic and imported products. The results could be interpreted as the opportunity costs of producing in the own country instead of importing these products.
The calculation of the labour hours directly and indirectly necessary to produce imported products abroad follows the following equation:
(9) SAMdomimpimp YBABtt =
impYBt+
with
(10) 1impdomdom )ADA(IB −−−−=
Aimp coefficient matrix of (monetary) intermediate inputs of imported products (including consumption of imported investment goods) related to (monetary) gross output by product group and branch
Yimp matrix of (monetary) final uses of imported products by product group and category of final uses
In equation (9) the first term on the right side comprises the labour hours directly and indirectly necessary to produce imported intermediate products (including also imported products for private consumption). The second term denotes the labour hours necessary
23. See Ewerhart 2001.
330 – SOCIAL ACCOUNTING MATRICES AND EXTENDED INPUT-OUTPUT TABLES
MEASURING SUSTAINABLE DEVELOPMENT: INTEGRATED ECONOMIC, ENVIRONMENTAL AND SOCIAL FRAMEWORKS – ISBN-92-64-02012-8 © OECD 2004
for producing directly imported products for final uses which comprise investment goods and directly re-exported import products.
The indirectly imported labour hours which are associated with the three age groups of population (row 12 of table 5) only comprise hours necessary for producing imported intermediate inputs which are directly or indirectly used for the production of final consumption. Differing from the domestic production (see rows 6 to 10 of table 5), no breakdown by type of final consumption is shown in the table.
The data for (net) capital formation and exports (row 12, columns 11 and 12 of table 5) are an addition of the labour hours of intermediate imports indirectly necessary for producing these types of final uses and the labour hours necessary for the directly imported products of final uses.
The totals of all hours received by the different socio-economic groups could be interpreted as inputs of their welfare function. Young people benefitted from 122 billion hours, adults (except seniors) from 330 billion hours and aged people from 93 billion hours (rows 1 to 12, columns 1 to 3 of table 5). In comparison with the number of persons belonging to the age groups, young people receive 10 550 hours per head, adults (except aged persons) only 7860 and aged people 9540 hours per head. These figures could be compared with the annual hours of each person (8760).
In row 13 of table 5, the time delivered and the time received are balanced. This balancing procedure is shown for the different age groups of the population, for the foreign trade and for fixed capital formation.
In the case of the socio-economic groups, the balancing items reveal the social position of the respective group. Because of the great amount of their employment work and their unpaid household production, the adults (younger than 65 years) are delivering much more time than they are receiving. Apart from their personal time of 250 billion hours, they are spending 118 billion hours for work others are also benefitting from. On the other hand, they are only receiving 80 billion hours from others. Thus, they have a net spending of 38 billion hours.
In our highly aggregated example, the other two age groups are the beneficiaries. Young people are only spending less than 4 billion hours for others but are receiving nearly 25 billion hours: They have a “deficit” of about 21 billion hours. This amount represents the investment of the society in the young generation.
In the case of aged persons, their “time account” has also a negative balancing item (8 billion hours). Apart from their private time (66 billion hours), the time of their own social work amounts to 19 billion hours which especially contains hours of household work. On the other hand, they are receiving 27 billion hours which also contain the hours necessary for producing goods and services consumed by aged persons.
The society is not only investing in the young generation but also in extended production facilities. In our example, net capital formation has a positive amount (7 billion hours). This amount is balanced in row 13 of table 5 by the corresponding negative item.
In the case of Germany, the foreign trade with products shows a surplus of exports in comparison with the imports (exports: 22 billion hours, imports: 19 billion hours). This surplus (3 billion hours) is balanced by the corresponding negative item in row 13 of table 5 which is lastly delivered by the age group actively involved in economic production (18 to 65 years old).

SOCIAL ACCOUNTING MATRICES AND EXTENDED INPUT-OUTPUT TABLES – 331
MEASURING SUSTAINABLE DEVELOPMENT: INTEGRATED ECONOMIC, ENVIRONMENTAL AND SOCIAL FRAMEWORKS – ISBN-92-64-02012-8 © OECD 2004
SAMIO in monetary units
The SAMIO in time units also delivers the basic scheme for the SAMIO in monetary units. For socio-economic analysis, it seems to be preferable to apply specific concepts which do not automatically accept the dominance of economic monetary thinking. The time use data of the population could be used as a suitable starting point.
Starting point of the monetary SAMIO which is presented in table 6 are the figures for net value added (including the value of household work) which are distributed among the three age groups of population according to their participation in the different production activities (row 14, columns 1 to 3). Differing from the SAMIO in time units, these values could only be determined by firstly estimating the uses of the monetary values (rows 1 to 3 in table 6).
The time used for personal activities (rows 1 to 3, columns 1 to 3) does not get a monetary value. The values of household work (rows 1 to 3, columns 4 and 5) are easily compiled by multiplying the figures of time use by a suitable wage rate. In the German case, the wage rate of a domestic servant (the so-called generalist) has been used. Of course, other types of valuation (e.g. the wage rates of specialists) could easily be introduced.
Similar to the procedure in the case of time units, the monetary values of the different final uses associated with the socio-economic groups as employed persons (rows 1 to 3, columns 6 to 12 of table 6) are estimated by linking net value added and final uses within an input-output model:
(11) domdomSAMPdom YBNVA M = with
(12) 1,...ni
nva...
nva
NVA
n
1
SAM =
=
nvai row coefficient vector of net value added produced by the employed persons of socio-economic group
i related to the monetary gross output by branch (with zeros in the case of the branches of private activities)

332 – SOCIAL ACCOUNTING MATRICES AND EXTENDED INPUT-OUTPUT TABLES
MEASURING SUSTAINABLE DEVELOPMENT: INTEGRATED ECONOMIC, ENVIRONMENTAL AND SOCIAL FRAMEWORKS – ISBN-92-64-02012-8 © OECD 2004
Tot
al
uses
(13)
61.2
2 64
0.2
225.
5
794.
9
58.2
912.
2
17.1
97.8
121.
5
200.
9
0.0
649.
0
0.0
63 2
50
Exp
orts
of
pr
oduc
ts
(12)
3.5
556.
3
203.
6
- 11
4.4
649.
0
Net
fi
xed
capi
tal
form
a-
tion
(11)
164.
5
67.1
- 23
1.6
0.0
Oth
er
gove
rnm
ent
serv
ices
(10)
2.9
195.
2
2.8
200.
9
Hea
lth
serv
ices
(9)
117.
6
3.9
121.
5
Edu
- ca
tion
serv
ices
(8)
97.8
97.8
Serv
ices
of
N
PISH
1
(7)
17.1
17.1
Em
ploy
men
t
Fina
l con
sum
ptio
n
Priv
ate
con-
su
mp-
tio
n
(6)
28.1
846.
9
37.2
912.
2
Serv
ices
be
twee
n ho
use-
ho
lds
(5) 1.
3
46.0
10.9
58.2
Hou
seho
ld
prod
uctio
n
Serv
ices
w
ithi
n ho
use-
ho
lds
(4) 25
.4
598.
8
170.
7
794.
9
Age
d pe
rson
s
(3)
0
170.
7
19.9
137.
7
2.6
1.0
42.2
30.8
58.3
- 23
7.7
225.
5
9 69
3
Adu
lts
(exc
ept
aged
pe
rson
s)
(2)
0
465.
4
23.8
666.
0
11.4
35.0
67.5
133.
4
270.
8
966.
9
2 64
0.2
42 0
06
Pers
onal
act
iviti
es
You
ng
pers
ons
(1)
0
158.
8
14.5
108.
5
3.1
61.8
11.8
36.7
49.2
- 38
3.2
61.2
11 5
51
Use
s S
uppl
y
You
ng p
erso
ns (
until
17
year
s ol
d)
Adu
lts
(exc
l. ag
ed p
erso
ns)
(18
to 6
4 ye
ars
old)
Age
d pe
rson
s (6
5 ye
ars
and
olde
r)
Unp
aid
serv
ices
with
in h
ouse
hold
s
Unp
aid
serv
ices
bet
wee
n ho
useh
olds
Priv
ate
cons
umpt
ion
Serv
ices
of
NPI
SH1
Edu
catio
n se
rvic
es
Hea
lth s
ervi
ces
Oth
er g
over
nmen
t ser
vice
s
Net
fix
ed c
apita
l for
mat
ion
Impo
rts
of p
rodu
cts
Bal
ance
s
Tot
al S
uppl
y
Mem
oran
dum
item
: Po
pula
tion
(1 0
00 p
erso
ns)
Tab
le 6
. Soc
ial a
ccou
ntin
g m
atri
x in
mon
etar
y un
its
base
d on
inpu
t-ou
tut
anal
ysis
(SA
MIO
- M
) 19
90
Bill
ions
Deu
tsch
e M
arks
Row
N
o. 1 2 3 4 5 6 7 8 9 10
11
12
13
14
1 Non
-pro
fit i
nstit
utio
ns s
ervi
ng h
ouse
hods
.

SOCIAL ACCOUNTING MATRICES AND EXTENDED INPUT-OUTPUT TABLES – 333
MEASURING SUSTAINABLE DEVELOPMENT: INTEGRATED ECONOMIC, ENVIRONMENTAL AND SOCIAL FRAMEWORKS – ISBN-92-64-02012-8 © OECD 2004
In our example, the contribution of the employed persons of the different socio-economic groups to the production of the branch where they are employed is estimated using the ratios of distribution of the labour hours of the employed persons. Of course, other quota could also be applied.
In the rows 4 and 5 of table 6 the valued hours of household production are distributed among the age groups benefitting from these services. Because of the unique type of monetarization (only “generalists”), the quota of the age groups are very similar to those of table 5.
In the rows 6 to 10 of table 6, the net value added associated with the final uses is distributed among the beneficiaries of these products. The compilation method corresponds with the procedure already described in equation (4):
(13) SAMdomudom YB nva m = with
(14) ∑=
=n
1iinvanva
The monetary values of imported products are linked with the final consumption of the age groups of population, with net capital formation and with exports in row 12 of table 6. In this case, it is not necessary to take into account the production facilities abroad. The imported values are directly associated with the final uses by the following equation (15):
(15) )impSAMdomimpuimp YYB(A(1...1)m +=
The total monetary values received by the different socio-economic groups (rows 1 to 12, columns 1 to 3 of table 6) could be interpreted as a monetary contribution to their welfare functions. The young persons receive 444 billion Deutsche Mark (38 480 DM per head), the adults (except seniors) 1 673 billion Deutsche Mark (39 830 DM per head) and the aged persons 464 billion Deutsche Mark (47 790 DM per head). In the case of young people, the high costs of education within and outside the households are strongly influencing the result. In the case of aged persons, the high amount of care within the households and the high health expenditures are determining the level of total costs.
The balancing items shown in row 13 of table 6 could be interpreted in the same way as already done in the case of time units. The adults (with age from 18 to 65 years) deliver values of 967 billion Deutsche Mark to the other two age groups (383 and 238 billion Deutsche Mark respectively), to future economic activities (net investment: 232 billion Deutsche Mark) and to other countries (export surplus: 114 billion Deutsche Mark).
The description of the compilation methods may have revealed already the close linkages between the SAMIOs in time and monetary units. Apart from the time used for personal activities (rows 1 to 3, columns 1 to 3), monetary and time data could also be interpreted simultaneously: The time data represent the direct and indirect time inputs to produce the monetary values. On the other side, the monetary data can be interpreted as the values given to the time received or spent by the different groups of population.
SAMIO in physical units
Comprehensive studies on possibilities to achieve paths of sustainable development imply an integrated social, economic and environmental analysis. Very similar to the

334 – SOCIAL ACCOUNTING MATRICES AND EXTENDED INPUT-OUTPUT TABLES
MEASURING SUSTAINABLE DEVELOPMENT: INTEGRATED ECONOMIC, ENVIRONMENTAL AND SOCIAL FRAMEWORKS – ISBN-92-64-02012-8 © OECD 2004
concepts applied in SESAME, data on natural resources and residuals could be linked with the social and economic information given in SAMIO.
These linkages are based on the complete material balances which have already been described (see table 4) and the consistent presentation of physical flows in physical input-output tables presented in the context of the “magic triangle”.24 Differing from the approach chosen in these tables, only specific physical flows which belong either to the primary inputs or to the final uses, are chosen for further analysis. These physical flows comprise natural resources which are used as intermediate inputs of economic activities and residuals which are leaving the economic circuit and are stored in controlled landfills (e.g. waste) or disposed again into the nature (e.g. air emissions or treated waste water). In table 4, these physical flows have already been indicated.
Apart from the mentioned flows of natural resources and residuals, specific physical product inputs and outputs could be taken into account: Imported intermediate inputs are part of the primary inputs, investment goods and exports of goods are part of the final uses in physical accounting. Nevertheless, these physical flows were excluded because they are represented in the SAMIO by the natural resources directly or indirectly necessary to produce them. This treatment does not exclude a supplementary analysis of these flows in the context of balancing transboundary flows or accounting the changes of physical assets. For such studies, the figures of table 4 deliver a suitable data base.
The physical flows are associated with the activities of the different age groups of population in the tables 7a and 7b. Table 7a shows the use of natural resources, table 7b the mentioned residuals flows.
24. See Stahmer 2000, pp. 145 - 147.

SOCIAL ACCOUNTING MATRICES AND EXTENDED INPUT-OUTPUT TABLES – 335
MEASURING SUSTAINABLE DEVELOPMENT: INTEGRATED ECONOMIC, ENVIRONMENTAL AND SOCIAL FRAMEWORKS – ISBN-92-64-02012-8 © OECD 2004
Tot
al
uses
(13)
176
7 74
7
242 89
6
4 43
7 37
175
248
510
3 35
5 0
63 2
50
Exp
orts
of
pr
oduc
ts
(12)
12
1 93
0
1 03
3
380
3 34
4
Net
fi
xed
capi
tal
form
a-
tion
(11)
535
280
- 81
5 0
Oth
er
gove
rn-
men
t se
rvic
es
(10)
7
496 7
510
Hea
lth
serv
ices
(9)
240 8
248
Edu
- ca
tion
serv
ices
(8)
175
175
Serv
ices
of
N
PISH
1
(7)
37
37
Em
ploy
men
t
Fina
l con
sum
ptio
n
Priv
ate
con-
su
mp-
tio
n
(6) 13
7
4 11
9
181
4 43
7
Serv
ices
be
twee
n ho
use-
ho
lds
(5)
0 6 0 6
Hou
seho
ld
prod
uctio
n
Serv
ices
w
ithi
n ho
use-
ho
lds
(4) 3 66
20
89
Age
d pe
rson
s
(3)
26
14 3
678 6 3 86
78
314
- 96
6
242
9 69
3
Adu
lts
(exc
ept
aged
pe
rson
s)
(2)
143
57 2
3 22
2 24
64
138
339
1 46
4
2 29
4
7 74
7
42 0
06
Pers
onal
act
iviti
es
You
ng
pers
ons
(1) 17
18 1
537 7
108 24
93
264
- 89
3
176
11 5
51
U
ses
Sup
ply
You
ng p
erso
ns (
until
17
year
s ol
d)
Adu
lts
(exc
l. ag
ed p
erso
ns)
(18
to 6
4 ye
ars
old)
Age
d pe
rson
s (6
5 ye
ars
and
olde
r)
Unp
aid
serv
ices
with
in h
ouse
hold
s
Unp
aid
serv
ices
bet
wee
n ho
useh
olds
Priv
ate
cons
umpt
ion
Serv
ices
of
NPI
SH1
Edu
catio
n se
rvic
es
Hea
lth s
ervi
ces
Oth
er g
over
nmen
t ser
vice
s
Net
fix
ed c
apita
l for
mat
ion
Impo
rts
of p
rodu
cts
Bal
ance
s
Tot
al S
uppl
y
Mem
oran
dum
item
: Po
pula
tion
(1 0
00 p
erso
ns)
Tab
le 7
. Soc
ial a
ccou
ntin
g m
atri
x in
phy
sica
l uni
ts b
ased
on
inpu
t-ou
tut
anal
ysis
(SA
MIO
- P
) 19
90
a) N
atur
al r
esou
rce
inpu
ts -
Mill
ion
tons
Row
N
o. 1 2 3 4 5 6 7 8 9 10
11
12
13
14
1 Non
-pro
fit i
nstit
utio
ns s
ervi
ng h
ouse
hods
.

336 – SOCIAL ACCOUNTING MATRICES AND EXTENDED INPUT-OUTPUT TABLES
MEASURING SUSTAINABLE DEVELOPMENT: INTEGRATED ECONOMIC, ENVIRONMENTAL AND SOCIAL FRAMEWORKS – ISBN-92-64-02012-8 © OECD 2004
Tot
al
uses
(13)
242
7 19
6
308
190 11
4 55
2 18
159
160
403
2 39
5 0
63 2
50
Exp
orts
of
pr
oduc
ts
(12)
9
1 46
3
771
152
2 39
5
Net
fi
xed
capi
tal
form
a-
tion
(11)
267
198
- 46
5 0
Oth
er
gove
rn-m
ent
serv
ices
(10)
6
391 6
403
Hea
lth
serv
ices
(9)
155 5
160
Edu
- ca
tion
serv
ices
(8)
159
159
Serv
ices
of
N
PISH
1
(7)
18
18
Em
ploy
men
t
Fina
l con
sum
ptio
n
Priv
ate
con-
su
mp-
tio
n
(6) 14
0
4 22
6
186
4 55
2
Serv
ices
be
twee
n ho
use-
ho
lds
(5)
1 3 7
11
Hou
seho
ld
prod
uctio
n
Serv
ices
w
ithi
n ho
use-
ho
lds
(4)
38
124 28
190
Age
d pe
rson
s
(3)
76
28 7
695 3 2 56
62
222
- 84
3
308
9 69
3
Adu
lts
(exc
ept
aged
pe
rson
s)
(2)
390
124 3
3 30
3 12
58
89
268
1 02
0
1 92
9
7 19
6
42 0
06
Pers
onal
act
iviti
es
You
ng
pers
ons
(1) 48
38 1
554 3 99
15
73
184
- 77
3
242
11 5
51
Use
s S
uppl
y
You
ng p
erso
ns (
until
17
year
s ol
d)
Adu
lts
(exc
l. ag
ed p
erso
ns)
(18
to 6
4 ye
ars
old)
Age
d pe
rson
s (6
5 ye
ars
and
olde
r)
Unp
aid
serv
ices
with
in h
ouse
hold
s
Unp
aid
serv
ices
bet
wee
n ho
useh
olds
Priv
ate
cons
umpt
ion
Serv
ices
of
NPI
SH1
Edu
catio
n se
rvic
es
Hea
lth s
ervi
ces
Oth
er g
over
nmen
t ser
vice
s
Net
fix
ed c
apita
l for
mat
ion
Impo
rts
of p
rodu
cts
Bal
ance
s
Tot
al S
uppl
y
Mem
oran
dum
item
: Po
pula
tion
(1 0
00 p
erso
ns)
Tab
le 7
a. S
ocia
l acc
ount
ing
mat
rix
in p
hysi
cal u
nits
bas
ed o
n in
put-
outu
t an
alys
is (
SAM
IO -
P)
1990
b)
Res
idua
l out
puts
- M
illio
n to
ns
Row
N
o. 1 2 3 4 5 6 7 8 9 10
11
12
13
14
1 Non
-pro
fit i
nstit
utio
ns s
ervi
ng h
ouse
hods
.

SOCIAL ACCOUNTING MATRICES AND EXTENDED INPUT-OUTPUT TABLES – 337
MEASURING SUSTAINABLE DEVELOPMENT: INTEGRATED ECONOMIC, ENVIRONMENTAL AND SOCIAL FRAMEWORKS – ISBN-92-64-02012-8 © OECD 2004
The input-output models used for estimating these linkages correspond with the models already described in section 3.2 (SAMIO in time units). For calculating the physical flows connected with the groups of population as producers, the following equation can be used:
(16) domdomSAM
SAMpdom YB
RS
NRP
=
with
(17) n1,...,i
NR...
NR
NR
n
1
SAM =
=
and
(18) n1,...,i
RS...
RS
RS
n
1
SAM =
=
NRi coefficient matrix of physical inputs of domestic natural resources used by the socio economic group i related to (monetary) gross output by type of natural resources and branch
RSi coefficient matrix of residuals produced by the socio-economic group i related to (monetary) gross output by type of residuals and branch
Differing from the distribution of time units among the different socio-economic groups, complete matrices of natural resource inputs and residual outputs have to be estimated for each socio-economic group. In our numerical example, the calculation of the distribution of the physical flows among the socio-economic groups as producers is based on very simple assumptions (e.g. quota of labour hours by branch). In the case of private activities, two types of environmental impacts have to be distinguished: Impacts of producing the intermediate inputs of private activities and impacts of the production processes of the private activities themselves. In the first case, households are only ind bvirectly responsible for, in the second case they are immediately producing residuals and using natural resources. In table 7a/b, the direct environmental impacts are shown in the rows 1 to 3 of the columns 1 to 5, the indirect impacts which are connected with employment work, are recorded in the rows 1 to 3 of column 6. For achieving this breakdown, submatrices of NRSAM and RSSAM were used which only contain data on the activities which are intended to be shown separately.
A similar procedure was necessary in the case of identifying the environmental impacts of the socio-economic groups as users. The basic equation has been
(19) SAMdomUdom YB
RS
NRM
=
with

338 – SOCIAL ACCOUNTING MATRICES AND EXTENDED INPUT-OUTPUT TABLES
MEASURING SUSTAINABLE DEVELOPMENT: INTEGRATED ECONOMIC, ENVIRONMENTAL AND SOCIAL FRAMEWORKS – ISBN-92-64-02012-8 © OECD 2004
(20) ∑−
=n
1iiNRNR and
(21) ∑−
=n
1iiRSRS
For separating the direct from the indirect environmental impacts of private activities, submatrices of NR and RS were necessary. The rows 1 to 5 of columns 1 to 3 of table 7a/b show the direct impacts connected with private activities, row 6 of columns 1 to 3 the indirect impacts of private consumption. The rows 7 to 10 of columns 1 to 3 show the environmental impacts of the other final consumption distributed among the age groups of the population as users.
The SAMIO in physical units not only describes the domestic physical flows but also the use of natural resources and the production of residuals abroad which is connected with the production of imported goods and services. In studies of the Wuppertal Institute, these flows are indicated as “rucksacks” of the domestic production. Detailed analysis is necessary for estimating these rucksacks in a suitable manner. For simplifying the compilation procedure, the presented example is based on the assumption that the production processes in the own country and abroad are identical. Following this simple approach, equation (22) could be applied:
(22) SAMdomimpUimp YBAB
RS
NRM
=
+ impYBRS
NR
The results of this calculation of the uses of natural resources are shown in row 12 of table 7a. The data on the production of residuals linked with the socio-economic groups, the net investment and the exports are presented in row 12 of table 7b.
In the tables 8a and b, the information on natural resources and residuals is shown in a breakdown by different types of materials using a simplified version of the tables 7a and 7b. Such differentiation is especially necessary to separate the huge amounts of water raised and waste water from the other flows. Furthermore, detailed information on specific natural resources and emissions is necessary for further analysis of environmental themes as it is proposed in the NAMEA framework mentioned.
The flows of natural resources and residuals are recorded as flows between the domestic economy and the natural environment of the own country and of the rest of the world. The totals of the rows 9 and 11 of the columns 1 to 3 in table 8a correspond with the totals of the rows 1 to 10 and 12 respectively of the columns 1 to 3 in table 7a. In the same way, the totals of the rows 10 and 12 of the columns 1 to 3 in table 8b could be found as totals of the rows 1 to 10 and 12 respectively of the columns 1 to 3 in table 7b.
The balances of natural resources and residuals are shown in row 13 of the tables 7a and table 7b respectively. In the case of physical flows, the imports play a more important role than the exports. Thus, the balance of exports and imports shows a surplus of foreign natural resources (380 million tons) and of foreign residuals (152 million tons).

SOCIAL ACCOUNTING MATRICES AND EXTENDED INPUT-OUTPUT TABLES – 339
MEASURING SUSTAINABLE DEVELOPMENT: INTEGRATED ECONOMIC, ENVIRONMENTAL AND SOCIAL FRAMEWORKS – ISBN-92-64-02012-8 © OECD 2004
Outlook
The concepts of SAMIO presented could only provide a starting point for further discussions. One field of research could be the integration of such data with econometric and general equilibrium models.25 Furthermore, it could be analysed to which extent such tables could be applied for welfare analysis.
Nevertheless, future work has to focus on an improvement of the data base available. The implementation of the SESAME concepts in an increasing number of countries is an important and encouraging step towards this aim. A closer cooperation of the “input-output people” with the statisticians calculating SAM modules will be a further precondition for future progress.
25. See Frohn 2001 and 2002.

340 – SOCIAL ACCOUNTING MATRICES AND EXTENDED INPUT-OUTPUT TABLES
MEASURING SUSTAINABLE DEVELOPMENT: INTEGRATED ECONOMIC, ENVIRONMENTAL AND SOCIAL FRAMEWORKS – ISBN-92-64-02012-8 © OECD 2004
Tot
al
uses
(13)
176
7 74
7
242
8 16
5
194
672
6 17
7
808
312 2
3 35
5
324
329
2 08
8
320
292 2 0
Res
id-
uals
(12)
Exp
orts
of
Nat
ural
re
- so
urce
s
(11)
1 94
2 87
176
1 38
0
212 86
1
1 03
3
102
135
632
109 54
1
380
3 35
5
Res
id-
uals
(10)
Dem
osti
c en
viro
nmen
t
Nat
ural
re
- so
urce
s
(9)
176
7 74
7
242
8 16
5
Exp
orts
of
pr
oduc
ts
(8)
Net
fix
ed
capi
tal
form
a-
tion
(7)
535 3
214
272 37
9 0
280 20
50
172 29
9 0
- 81
5 0
Em
ploy
men
t
Fina
l co
n-
sum
p-
tion
(6)
Serv
ices
be
twee
n ho
use-
ho
lds
(5)
Hou
seho
ld
prod
uctio
n
Serv
ices
w
ithi
n ho
use-
ho
lds
(4)
Age
d pe
rson
s
(3)
894 16
44
714 86
34 0
314 30
22
199 28
35 0
- 96
6
242
Adu
lts
(exc
ept
aged
pe
rson
s)
(2)
3 98
9 73
195
3 17
0
396
154 1
1 46
4
145
102
922
130
164 1
2 29
4
7 74
7
Pers
onal
act
iviti
es
You
ng
pers
ons
(1)
805 15
43
641 77
29 0
264 27
20
163 24
30 0
- 89
3
176
U
ses
Su
pply
You
ng p
erso
ns
Adu
lts
(exc
l. ag
ed p
erso
ns)
Age
d pe
rson
s
Serv
ices
with
in h
ouse
hold
s
Serv
ices
bet
wee
n ho
useh
.
Fina
l con
sum
ptio
n
Net
fix
ed c
paita
l for
mat
ion
Exp
orts
of
prod
ucts
Dom
esti
c na
tura
l res
ourc
es
Ene
rgy
carr
iers
Oth
er s
olid
mat
eria
ls
Wat
er r
aise
d
Oxy
gen
Car
bon
diox
ide
Oth
er a
ir c
ompo
nent
s
Dom
esti
c re
sidu
als
Fore
ign
natu
ral r
esou
rces
Ene
rgy
carr
iers
Oth
er s
olid
mat
eria
ls
Wat
er r
aise
d
Oxy
gen
Car
bon
diox
ide
Oth
er a
ir c
ompo
nent
s
Fore
ign
resi
dual
s
Bal
ance
s
Tot
al s
uppl
y
Tab
le 8
: So
cial
acc
ount
ing
mat
rix
in p
hysi
cal u
nits
bas
ed o
n in
put-
outu
t an
alys
is (
SAM
IO -
P)
1990
a)
Nat
ural
res
ourc
e in
puts
by
type
of
reso
urce
- M
illio
n to
nes
Row
N
o. 1 2 3 4 5 6 7 8 9
10
11
12
13
14

SOCIAL ACCOUNTING MATRICES AND EXTENDED INPUT-OUTPUT TABLES – 341
MEASURING SUSTAINABLE DEVELOPMENT: INTEGRATED ECONOMIC, ENVIRONMENTAL AND SOCIAL FRAMEWORKS – ISBN-92-64-02012-8 © OECD 2004
Tot
al
uses
(13)
242
7 19
6
308
7 74
6
542
4 60
0
1 56
6
225
779 34
2 39
5
366
977
520
213
305 14
0
Res
id-
uals
(12)
1 47
2
152
702
338 62
208 10
771 90
345
187 40
104 5
152
2 39
5
Exp
orts
of
Nat
ural
re
- so
urce
s
(11)
Res
id-
uals
(10)
242
7 19
6
308
7 74
6
Dem
osti
c en
viro
nmen
t
Nat
ural
re
- so
urce
s
(9)
Exp
orts
of
pr
oduc
ts
(8)
Net
fix
ed
capi
tal
form
a-
tion
(7)
267 48
115 59
6 37 2
198 20
90
51 7 29 1
- 46
5
Em
ploy
men
t
Fina
l co
n-
sum
p-
tion
(6)
Serv
ices
be
twee
n ho
use-
ho
lds
(5)
Hou
seho
ld
prod
uctio
n
Serv
ices
w
ithi
n ho
use-
ho
lds
(4)
Age
d pe
rson
s
(3)
929 53
583
184 24
82 3
222 40
85
44
26
26 1
- 84
3
308
Adu
lts
(exc
ept
aged
pe
rson
s)
(2)
4 24
7
243
2 67
7
821
112
378 16
1 02
0
183
388
201
119
123 6
1 92
9
7 19
6
Pers
onal
act
iviti
es
You
ng
pers
ons
(1)
831 46
523
164 21
74 3
184 33
69
37
21
23 1
- 77
3
242
Use
s S
uppl
y
You
ng p
erso
ns
Adu
lts
(exc
l. ag
ed p
erso
ns)
Age
d pe
rson
s
Serv
ices
with
in h
ouse
hold
s
Serv
ices
bet
wee
n ho
useh
.
Fina
l con
sum
ptio
n
Net
fix
ed c
paita
l for
mat
ion
Exp
orts
of
prod
ucts
Dom
esti
c na
tura
l res
ourc
es
Dom
esti
c re
sidu
als
W
aste
W
aste
wat
er
W
ater
vap
oriz
ed
O
xyge
n
C
arbo
n di
oxid
e
O
ther
air
em
issi
ons
Fore
ign
natu
ral r
esou
rces
Fore
ign
resi
dual
s
W
aste
W
aste
wat
er
W
ater
vap
oriz
ed
O
xyge
n
C
arbo
n di
oxid
e
O
ther
air
em
issi
ons
Bal
ance
s
Tot
al s
uppl
y
Tab
le 8
: Soc
ial a
ccou
ntin
g m
atri
x in
phy
sica
l uni
ts b
ased
on
inpu
t-ou
tut
anal
ysis
(SA
MIO
- P
) 19
90
b) R
esid
ual o
utpu
ts b
y ty
p of
res
idua
ls -
Mill
ion
tone
s
Row
N
o. 1 2 3 4 5 6 7 8 9 10
11
12
13
14

342 – SOCIAL ACCOUNTING MATRICES AND EXTENDED INPUT-OUTPUT TABLES
MEASURING SUSTAINABLE DEVELOPMENT: INTEGRATED ECONOMIC, ENVIRONMENTAL AND SOCIAL FRAMEWORKS – ISBN-92-64-02012-8 © OECD 2004
References
Becker, Gary S. (1964): Human Capital, Columbia University Press: New York, London
Becker, Gary S. (1965): A Theory of the Allocation of Time, in Economic Journal, Vol. 75, pp. 493 – 517
Commission of the European Communities - Eurostat, International Monetary Fund, Organisation for Economic Co-operation and Development, United Nations, World Bank (1993): System of National Accounts 1993, Brussels/Luxemburg/ New York/Paris/Washington, D.C.
Eurostat (1995): European System of Accounts - ESA 1995, Luxembourg
Eurostat (2002): Draft Handbook on Social Accounting Matrices and Labour Accounts, preliminary version presented at the Voorburg Seminar, 17 - 18 June, Luxemburg
Ewerhart, Georg (2001): Humankapital in Deutschland - Bildungsinvestitionen, Bildungsvermögen und Abschreibungen auf Bildung, Beiträge zur Arbeitsmarkt- und Berufsforschung, No. 247, Bundesanstalt für Arbeit: Nürnberg
Frohn, Joachim (2001): Ökonometrische Modelle zur Analyse von Umweltstrategien, in Susanne Hartard, Carsten Stahmer (eds.), Bewertung von Nachhaltigkeitsstrategien, Metropolis: Marburg, pp. 139 – 158
Frohn, Joachim (2002): Zur Erweiterung von ökonometrischen Umweltmodellen um soziale Komponenten, in Susanne Hartard, Carsten Stahmer (eds.), Magische Dreiecke - Berichte für eine nachhaltige Gesellschaft, Band 3: Sozio-ökonomische Berichtssysteme, Metropolis: Marburg
Horz, Kurt, Utz-Peter Reich (1982): Dividing Government Product between Intermediate and Final Uses, in Review of Income and Wealth, Series 28, No. 3, pp. 325 – 343
Hill, Peter (1995): Richard Stone's Contribution to National Accounting, in Annali di Statistica, Series X, vol. 6: Social Statistics, National Accounts and Economic Analysis, International Conference in Memory of Sir Richard Stone, Certosa di Pontignano, Siena, October 1993, pp. 23 – 30
Kazemier, Brugt and Jeanet Exel (1992): The Allocation of Time in the Netherlands in the Context of the SNA; A Module, Netherlands Central Bureau of Statistics, National accounts, occasional paper, NA-052
Keuning, Steven J. (1991): Proposal for a Social Accounting Matrix which fits into the Next System of National Accounts, in Economic Systems Research, Volume 3, Number 3, pp. 233 – 248
Keuning, Steven J. (2000): Accounting for Welfare with SESAME, in: United Nations, Handbook of National Accounting, Household Accounting: Experience in Concepts and Compilation, Volume 2: Household Satellite Extensions, Studies in Methods, Series F, No. 75, New York, pp. 273 – 307

SOCIAL ACCOUNTING MATRICES AND EXTENDED INPUT-OUTPUT TABLES – 343
MEASURING SUSTAINABLE DEVELOPMENT: INTEGRATED ECONOMIC, ENVIRONMENTAL AND SOCIAL FRAMEWORKS – ISBN-92-64-02012-8 © OECD 2004
Keuning, Steven J. and Willem A. de Ruijter (1988): Guidelines to the Construction of a Social Accounting Matrix, in Review of Income and Wealth, Series 34, Number 1, March, pp. 71 – 100
Lancaster, Kelvin (1966): A New Approach to Consumer Theory, in Journal of Political Economy, Vol. 74, pp. 132 – 157
Lützel, Heinrich (1989): Household Production and National Accounts, in Statistical Journal of the United Nations ECE, Vol. 6, No. 4, pp. 337 – 348
Pyatt, Graham (1985): Commodity Balances and National Accounts - A SAM Perspective, in Review of Income and Wealth, Series 31, No. 2, pp. 155 – 169
Pyatt, Graham (1990): Accounting for Time Use, in Review of Income and Wealth, Series 36, No. 1, pp. 33 – 52
Pyatt, Graham (1991a): Fundamentals of Social Accounting, in Economic Systems Research, Volume 3, Number 3, pp. 315 – 341
Pyatt, Graham (1991b): SAMs, the SNA and National Accounting Capabilities, in Review of Income and Wealth, Series 37, No. 2, June, pp. 177 – 198
Pyatt, Graham (1999): Some Relationships between T-Accounts, Input-Output Tables and Social Accounting Matrices, in Economic Systems Research, Vol. 11, Number 4, December, pp. 365 – 389
Pyatt, Graham, Alan R. Roe and associates (1977): Social Accounting Matrices for Development Planning: With Special Reference to Sri Lanka, Cambridge University Press: Cambridge
Pyatt, Graham and Jeffery I. Round (eds.) (1985): Social Accounting Matrices, A Basis for Planning, A World Bank Symposium, Washington, D.C.
Reich, Utz-Peter (1986): Treatment of Government Activity on the Production Account, in Review of Income and Wealth, Series 32, No. 1, pp. 69 – 85
Reich, Utz-Peter, Philipp Sonntag and Hans-Werner Holub (1977): Arbeit - Konsum -Rechnung, Axiomatische Kritik und Erweiterung der Volkswirtschaftlichen Gesamtrechnung, Bund: Köln
Schäfer, Dieter and Norbert Schwarz (1995): The Value of Household Production in the Federal Republic of Germany 1992, 30 pages, unpublished paper
Scherhorn, Gerhard (2002): Zur Messung des Wohlstands, in Susanne Hartard, Carsten Stahmer (eds.), Magische Dreiecke - Berichte für eine nachhaltige Gesellschaft, Band 3: Sozio-ökonomische Berichtssysteme, Metropolis: Marburg
Stahmer, Carsten (2000): The Magic Triangle of Input-Output Tables, in: Sandrine Simon and John Proops (eds.), Greening the Accounts, Edward Elgar: Cheltenham, UK, Northampton, MA, USA, pp. 123 - 154
Stahmer, Carsten (2002): Das Unbekannte Meisterwerk – Sir Richard Stone und sein System of Social and Demographic Statistics, in Susanne Hartard, Carsten Stahmer (eds.), Magische Dreiecke - Berichte für eine nachhaltige Gesellschaft, Band 3: Sozio-ökonomische Berichtssysteme, Metropolis: Marburg
Stahmer, Carsten, Georg Ewerhart, Inge Herrchen (2002): Monetäre, Physische und Zeit-Input-Output-Tabellen 1990, Metzler-Poeschel: Stuttgart
344 – SOCIAL ACCOUNTING MATRICES AND EXTENDED INPUT-OUTPUT TABLES
MEASURING SUSTAINABLE DEVELOPMENT: INTEGRATED ECONOMIC, ENVIRONMENTAL AND SOCIAL FRAMEWORKS – ISBN-92-64-02012-8 © OECD 2004
Stone, Richard (1949): Social Accounting, Aggregation and Invariance, in Cahiers du Congrès International de Comptabilité, 1948, French translation: Economie Appliquée, vol. II, No. 1, pp. 26 – 54
Stone, Richard (1951-52): Simple Transaction Models, Information and Computing, paper presented at a conference on Automatic Control, Cranfield, 1951, in The Review of Economic Studies, Vol. XIX, No. 2, pp. 67 – 84
Stone, Richard (1955a): Model-Building and the Social Accounts: A Survey, in International Association for Research in Income and Wealth (ed.), Income and Wealth, Series IV, Bowes and Bowes: Cambridge
Stone, Richard (1955b): Input-Output and the Social Accounts, in University of Pisa (ed.), The Structural Interdependence of the Economy, Proceedings of an International Conference on Input-Output Analysis, Varenna, J. Wiley: New York, Giuffre: Milan, pp. 155 – 172
Stone, Richard (1961): Input-Output and National Accounts, OEEC, Paris
Stone, Richard (1962a): Multiple Classifications in Social Accounting, in Bulletin of the International Statistical Institute, Volume XXXIX, No. 3, pp. 215 - 233, reprint: University of Cambridge, Department of Applied Economics, Reprint Series, No. 220, 1964
Stone, Richard (1962b): A Social Accounting Matrix for 1960 (with Alan Brown and others), in A Programme for Growth, No. 2, Chapman and Hall: London
Stone, Richard (1979): Where are we now? A Short Account of the Development of Input-Output Studies and their Present Trends, paper presented at the 7th International Conference on Input-Output Techniques, Innsbruck, April
Stone, Richard (1981a): Aspects of Economic and Social Modelling, Librairie Droz: Genève
Stone, Richard (1981b): Input-Output-Analysis and Economic Planning: A Survey, presented June 1978, in Mathematical Programming and its Applications, Angeli: Milan
Stone, Richard (1985): The disaggregation of the Household Sector in the National Accounts, in Graham Pyatt and Jeffery I. Round (eds.), Social Accounting Matrices, A Basis for Planning, The World Bank, Washington, D.C., pp. 145 - 185
Stone, Richard and Giovanna Croft-Murray (1959): Social Accounting and Economic Models, Bowes and Bowes: London
Strassert, Günther, Carsten Stahmer (2002): Sachkapital und Physische Input-Output-Rechnung, in Susanne Hartard, Carsten Stahmer (eds.), Magische Dreiecke - Berichte für eine nachhaltige Gesellschaft, Band 3: Sozio-ökonomische Berichtssysteme, Metropolis: Marburg
Timmerman, Jolanda and Peter van de Ven (2000): The SAM and SESAME in the Netherlands. A Modular Approach, in: United Nations, Handbook of National Accounting. Experience in Concepts and Compilation, Volume 2: Household Satellite Extensions, Studies in Methods, Series F, No. 75, New York, pp. 309 - 354
United Nations (1968): A System of National Accounts, Studies in Methods, Series F, No. 2, Rev. 3, New York

133
© OECD 2002
References
Feeney, Patricia (2001),“The Trust Business,” OECD Observer, No. 225, March 2001.
Oldenziel, Joris (2000),“The 2000 Review of the OECD Guidelines for Multinational Enterprises: A New Code ofConduct?”, SOMO, Amsterdam.
Organisation for Economic Co-operation and Development (2001a),“The OECD Guidelines for Multinational Enterprises and Global Instruments forCorporate Responsibility”, Background and Issues Paper, May 16, 2001, Paris.
Organisation for Economic Co-operation and Development (2001b),“OECD Roundtable on Global Instruments for Corporate Responsibility”, SummaryReport of the Roundtable Discussion, June 19, 2001, Paris.
Organisation for Economic Co-operation and Development (2001c),“The OECD Guidelines for Multinational Enterprises – First Annual Meeting of theNational Contact Points”, Summary Report of the Chair, September 21, 2001, Paris.
Sabel, Charles, Dara O’Rourke and Archon Fung (2000),“Ratcheting Labour Standards: Regulation for Continuous Improvement in the GlobalWorkplace”, Washington, DC: The World Bank, Social Protection Discussion PaperNo. 0011.
Trade Union Advisory Committee (2001a),“TUAC Survey of the Functioning of National Contact Points”, Paris.
Trade Union Advisory Committee (2001b),“The OECD Guidelines on Multinational Enterprises: A User’s Guide”, Paris.

TABLE OF CONTENTS – 5
MEASURING SUSTAINABLE DEVELOPMENT: INTEGRATED ECONOMIC, ENVIRONMENTAL AND SOCIAL FRAMEWORKS – ISBN-92-64-02012-8 © OECD 2004
Table of Contents
FOREWARD…………………………………………………………………………….….3
ACCOUNTING FRAMEWORKS FOR SUSTAINABLE DEVELOPMENT: WHAT HAVE WE LEARNT? Enrico. Giovannini ...........................................................................................7
OPENING REMARKS “THE ROLE OF THE OECD” Berglind Ásgeirsdóttir ..................15
THE ROLE OF INSTITUTIONS IN BUILDING FRAMEWORKS TO MEASURE SUSTAINABLE DEVELOPMENT: THE CANADIAN EXPERIENCE Robert Smith.......................................21
ACCOUNTING FOR SUSTAINABILITY Kirk Hamilton ......................................................29
SUSTAINABLE NATIONAL INCOME AND MULTIPLE INDICATORS FOR SUSTAINABLE DEVELOPMENT Bart de Boer and Roefie Hueting...........................................................39
ACCOUNTING FOR SUSTAINABLE DEVELOPMENT: COMPLEMENTARY MONETARY AND BIOPHYSICAL APPROACHES Kirk Hamilton, Jonathan Loh, Jerome Sayre, Thierry Thouveno, and Mathis Wackernagel .................................................................................53
A FEW REMARKS ON METHODOLOGICAL ASPECTS RELATED TO SUSTAINABLE DEVELOPMENT Isabella Pierantoni ................................................................................63
ASPECTS OF SUSTAINABILITY: THE AUSTRALIAN EXPERIENCE Barbara Dunlop .....91
A CAPITAL-BASED SUSTAINABILITY ACCOUNTING FRAMEWORK FOR CANADA Robert Smith ....................................................................................................................111
A FRAMEWORK FOR ESTIMATING CARBON DIOXIDE EMISSIONS EMBODIED IN INTERNATIONAL TRADE OF GOODS Nadim Ahmad .....................................................129
RESULTS FROM THE NORWEGIAN ENVIRONMENTAL AND ECONOMIC ACCOUNTS AND ISSUES ARISING FROM COMPARISONS TO OTHER NORDIC NAMEA – AIR EMISSION SYSTEMS Julie Hass .......................................................................................................155
ACCOUNTING FOR SUSTAINABLE DEVELOPMENT: THE NAMEA-BASED APPROACH Mark De Haan and Peter Kee .........................................................................................183
THE NEW ZEALAND EXPERIENCE WITH ENVIRONMENTAL ACCOUNTING FRAMEWORKS IN MEASURING INTER-RELATIONSHIPS BETWEEN THE ECONOMY, SOCIETY AND THE ENVIRONMENT Chase O’Brien ......................................................199

6 – TABLE OF CONTENTS
MEASURING SUSTAINABLE DEVELOPMENT: INTEGRATED ECONOMIC, ENVIRONMENTAL AND SOCIAL FRAMEWORKS – ISBN-92-64-02012-8 © OECD 2004
INTEGRATED ENVIRONMENTAL AND ECONOMIC ACCOUNTING IN ITALY Cesare Costantino, Frederico Falcitelli, Aldo Femia and Angelica Tudini ..................209
THE DANISH ENVIRONMENTAL ACCOUNTS WITH EXAMPLES OF ITS USE Ole Gravgaard Pedersen.................................................................................................227
MATERIAL FLOW ACCOUNTS AND BALANCES TO DERIVE A SET OF SUSTAINABILITY INDICATORS Luisa Bailon Chico and Félix Alonso Luengo ..........................................247
THE ROLE OF THE NATIONAL ACCOUNTS AND ITS SATELLITE SYSTEMS FOR THE GERMAN NATIONAL STRATEGY FOR SUSTAINABLE DEVELOPMENT Karl Schoer....275
THE DEVELOPMENT OF ENVIRONMENTAL ACCOUNTING FRAMEWORKS AND INDICATORS FOR MEASURING SUSTAINABILITY IN JAPAN Noritoshi Ariyoshi and Yuichi Moriguchi .............................................................................................................287
SUSTAINABLE DEVELOPMENT INDICATORS FOR SWEDEN: CONCEPTS AND FRAMEWORK Madeleine Nyman ...................................................................................305
SOCIAL ACCOUNTING MATRICES AND EXTENDED INPUT-OUTPUT TABLES Carl Stahmer ...................................................................................................................313
ON SAMS ACCORDING TO ESA95 Hubertus Kal.........................................................345
A PILOT SAM FOR ITALY: METHODOLOGY AND RESULTS Federica Battellini, Alessandra Coli and Francesca Tartamella....................................................................365
USING ENVIRONMENTAL ACCOUNTS TO PROMOTE SUSTAINABLE DEVELOPMENT: EXPERIENCES IN SOUTHERN AFRICA Alessandra Alfieri, Rashid Hassan, and Glenn Marie Lange ....................................................................................................................405
From:Measuring Sustainable DevelopmentIntegrated Economic, Environmental and Social Frameworks
Access the complete publication at:https://doi.org/10.1787/9789264020139-en
Please cite this chapter as:
Stahmer, Carl (2004), “Social Accounting Matrices and Extended Input-Output Tables”, in OECD, MeasuringSustainable Development: Integrated Economic, Environmental and Social Frameworks, OECD Publishing,Paris.
DOI: https://doi.org/10.1787/9789264020139-21-en
This work is published under the responsibility of the Secretary-General of the OECD. The opinions expressed and argumentsemployed herein do not necessarily reflect the official views of OECD member countries.
This document and any map included herein are without prejudice to the status of or sovereignty over any territory, to thedelimitation of international frontiers and boundaries and to the name of any territory, city or area.
You can copy, download or print OECD content for your own use, and you can include excerpts from OECD publications,databases and multimedia products in your own documents, presentations, blogs, websites and teaching materials, providedthat suitable acknowledgment of OECD as source and copyright owner is given. All requests for public or commercial use andtranslation rights should be submitted to [email protected]. Requests for permission to photocopy portions of this material forpublic or commercial use shall be addressed directly to the Copyright Clearance Center (CCC) at [email protected] or theCentre français d’exploitation du droit de copie (CFC) at [email protected].