SNY1210 Crosstabs
8
Siena College Research Institute December 6 - 8, 2010 806 New York State Registered Voters MOE +/- 3.5% Total Dem Rep Ind/ Other M F Lib Mod Conserv NYC Subs Upst White Afr Amer /Black Other 18-34 35-54 55+ Cath Jewish Prot Other Right track 29% 36% 18% 24% 28% 29% 37% 33% 17% 38% 27% 21% 25% 45% 48% 37% 25% 28% 24% 31% 32% 31% Wrong direction 60% 50% 73% 67% 60% 59% 48% 57% 75% 46% 62% 72% 65% 39% 43% 53% 65% 59% 68% 58% 57% 54% Don't know/No opinion 11% 13% 9% 8% 11% 11% 15% 10% 8% 16% 12% 7% 11% 15% 8% 10% 10% 13% 8% 11% 11% 15% Total Dem Rep Ind/ Other M F Lib Mod Conserv NYC Subs Upst White Afr Amer /Black Other 18-34 35-54 55+ Cath Jewish Prot Other Right track 30% 41% 16% 22% 29% 31% 40% 34% 17% 36% 26% 27% 27% 48% 42% 27% 33% 29% 31% 21% 31% 30% Wrong direction 59% 48% 77% 65% 63% 56% 49% 56% 73% 52% 66% 62% 64% 29% 52% 59% 59% 60% 61% 71% 55% 57% Don't know/No opinion 11% 11% 7% 13% 8% 13% 10% 11% 11% 12% 8% 11% 9% 23% 5% 14% 8% 11% 7% 8% 14% 13% Total Dem Rep Ind/ Other M F Lib Mod Conserv NYC Subs Upst White Afr Amer /Black Other 18-34 35-54 55+ Cath Jewish Prot Other Favorable 32% 33% 27% 35% 33% 32% 31% 35% 28% 36% 27% 31% 31% 34% 41% 22% 31% 39% 33% 37% 28% 33% Unfavorable 61% 59% 67% 61% 61% 61% 62% 59% 67% 56% 65% 63% 62% 56% 51% 68% 64% 53% 62% 52% 65% 60% Don't know/No opinion 7% 8% 6% 5% 6% 8% 7% 6% 6% 7% 8% 6% 6% 10% 8% 10% 5% 7% 6% 11% 8% 7% I'm going to read a series of names of people and institutions in public life and I'd like you to tell me whether you have a favorable opinion or an unfavorable opinion of each person I name. Q3. David Paterson Party Gender Political View Region Ethnic Age Religion Q2. Is the United States on the right track, or is it headed in the wrong direction? Party Gender Political View Region Ethnic Age Religion Q1. Is New York State on the right track, or is it headed in the wrong direction? Party Gender Political View Region Ethnic Age Religion Total Dem Rep Ind/ Other M F Lib Mod Conserv NYC Subs Upst White Afr Amer /Black Other 18-34 35-54 55+ Cath Jewish Prot Other Favorable 66% 78% 47% 64% 63% 69% 77% 76% 43% 72% 64% 62% 65% 76% 69% 58% 64% 73% 66% 73% 63% 68% Unfavorable 25% 15% 45% 27% 28% 23% 16% 18% 46% 20% 27% 30% 27% 14% 22% 34% 28% 18% 28% 20% 27% 24% Don't know/No opinion 8% 8% 8% 9% 9% 7% 8% 6% 11% 8% 9% 8% 8% 10% 9% 8% 8% 9% 6% 8% 11% 8% Total Dem Rep Ind/ Other M F Lib Mod Conserv NYC Subs Upst White Afr Amer /Black Other 18-34 35-54 55+ Cath Jewish Prot Other Favorable 55% 74% 27% 45% 53% 57% 74% 63% 27% 62% 48% 52% 49% 92% 71% 50% 56% 58% 48% 45% 59% 67% Unfavorable 42% 24% 70% 51% 44% 41% 24% 34% 70% 34% 51% 44% 48% 6% 26% 47% 41% 39% 50% 51% 38% 30% Don't know/No opinion 3% 2% 3% 3% 4% 3% 2% 3% 3% 3% 1% 4% 3% 2% 3% 2% 3% 3% 2% 4% 3% 3% Q5. Barack Obama Party Gender Political View Region Ethnic Age Religion Q4. Andrew Cuomo Party Gender Political View Region Ethnic Age Religion SNY1210 Crosstabs 1 of 8
-
Upload
celeste-katz -
Category
Documents
-
view
236 -
download
0
Transcript of SNY1210 Crosstabs

8/8/2019 SNY1210 Crosstabs
http://slidepdf.com/reader/full/sny1210-crosstabs 1/8
Siena College Research Institute
December 6 - 8, 2010
806 New York State Registered Voters
MOE +/- 3.5%
Total Dem Rep
Ind/
Other M F Lib Mod Conserv NYC Subs Upst White
Afr Amer
/Black Other 18-34 35-54 55+ Cath Jewish Prot Other
Right track 29% 36% 18% 24% 28% 29% 37% 33% 17% 38% 27% 21% 25% 45% 48% 37% 25% 28% 24% 31% 32% 31%
Wrong direction 60% 50% 73% 67% 60% 59% 48% 57% 75% 46% 62% 72% 65% 39% 43% 53% 65% 59% 68% 58% 57% 54%
Don't know/No opinion 11% 13% 9% 8% 11% 11% 15% 10% 8% 16% 12% 7% 11% 15% 8% 10% 10% 13% 8% 11% 11% 15%
Total Dem Rep
Ind/
Other M F Lib Mod Conserv NYC Subs Upst White
Afr Amer
/Black Other 18-34 35-54 55+ Cath Jewish Prot Other
Right track 30% 41% 16% 22% 29% 31% 40% 34% 17% 36% 26% 27% 27% 48% 42% 27% 33% 29% 31% 21% 31% 30%Wrong direction 59% 48% 77% 65% 63% 56% 49% 56% 73% 52% 66% 62% 64% 29% 52% 59% 59% 60% 61% 71% 55% 57%
Don't know/No opinion 11% 11% 7% 13% 8% 13% 10% 11% 11% 12% 8% 11% 9% 23% 5% 14% 8% 11% 7% 8% 14% 13%
Total Dem Rep
Ind/
Other M F Lib Mod Conserv NYC Subs Upst White
Afr Amer
/Black Other 18-34 35-54 55+ Cath Jewish Prot Other
Favorable 32% 33% 27% 35% 33% 32% 31% 35% 28% 36% 27% 31% 31% 34% 41% 22% 31% 39% 33% 37% 28% 33%
Unfavorable 61% 59% 67% 61% 61% 61% 62% 59% 67% 56% 65% 63% 62% 56% 51% 68% 64% 53% 62% 52% 65% 60%
Don't know/No opinion 7% 8% 6% 5% 6% 8% 7% 6% 6% 7% 8% 6% 6% 10% 8% 10% 5% 7% 6% 11% 8% 7%
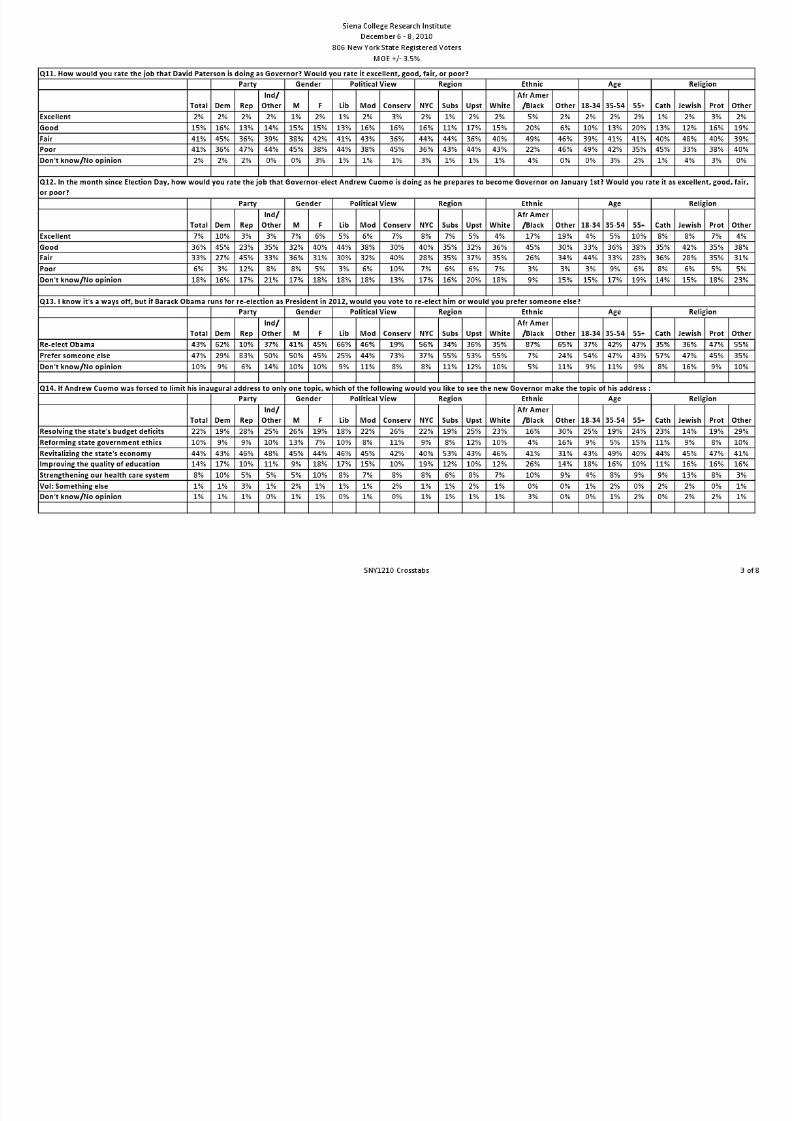
I'm going to read a series of names of people and institutions in public life and I'd like you to tell me whether you have a favorable opinion or an unfavorable opinion of each person I name.
Q3. David Paterson
Party Gender Political View Region Ethnic Age Religion
Q2. Is the United States on the right track, or is it headed in the wrong direction?
Party Gender Political View Region Ethnic Age Religion
Q1. Is New York State on the right track, or is it headed in the wrong direction?
Party Gender Political View Region Ethnic Age Religion
Total Dem Rep
Ind/
Other M F Lib Mod Conserv NYC Subs Upst White
Afr Amer
/Black Other 18-34 35-54 55+ Cath Jewish Prot Other
Favorable 66% 78% 47% 64% 63% 69% 77% 76% 43% 72% 64% 62% 65% 76% 69% 58% 64% 73% 66% 73% 63% 68%
Unfavorable 25% 15% 45% 27% 28% 23% 16% 18% 46% 20% 27% 30% 27% 14% 22% 34% 28% 18% 28% 20% 27% 24%
Don't know/No opinion 8% 8% 8% 9% 9% 7% 8% 6% 11% 8% 9% 8% 8% 10% 9% 8% 8% 9% 6% 8% 11% 8%
Total Dem Rep
Ind/
Other M F Lib Mod Conserv NYC Subs Upst White
Afr Amer
/Black Other 18-34 35-54 55+ Cath Jewish Prot Other
Favorable 55% 74% 27% 45% 53% 57% 74% 63% 27% 62% 48% 52% 49% 92% 71% 50% 56% 58% 48% 45% 59% 67%
Unfavorable 42% 24% 70% 51% 44% 41% 24% 34% 70% 34% 51% 44% 48% 6% 26% 47% 41% 39% 50% 51% 38% 30%
Don't know/No opinion 3% 2% 3% 3% 4% 3% 2% 3% 3% 3% 1% 4% 3% 2% 3% 2% 3% 3% 2% 4% 3% 3%
Q5. Barack Obama
Party Gender Political View Region Ethnic Age Religion
Q4. Andrew Cuomo
Party Gender Political View Region Ethnic Age Religion
SNY1210 Crosstabs 1 of 8

8/8/2019 SNY1210 Crosstabs
http://slidepdf.com/reader/full/sny1210-crosstabs 2/8
Siena College Research Institute
December 6 - 8, 2010
806 New York State Registered Voters
MOE +/- 3.5%
Total Dem Rep
Ind/
Other M F Lib Mod Conserv NYC Subs Upst White
Afr Amer
/Black Other 18-34 35-54 55+ Cath Jewish Prot Other
Favorable 31% 19% 56% 31% 38% 25% 11% 25% 57% 24% 34% 36% 32% 19% 33% 32% 30% 31% 37% 25% 32% 23%
Unfavorable 52% 68% 29% 48% 47% 57% 73% 59% 27% 64% 47% 44% 50% 70% 51% 46% 57% 52% 45% 61% 48% 66%
Don't know/No opinion 17% 13% 15% 22% 15% 18% 16% 16% 16% 12% 19% 20% 18% 11% 16% 22% 14% 17% 18% 14% 20% 11%
Total Dem Rep
Ind/
Other M F Lib Mod Conserv NYC Subs Upst White
Afr Amer
/Black Other 18-34 35-54 55+ Cath Jewish Prot Other
Favorable 22% 31% 14% 13% 21% 23% 24% 22% 23% 32% 12% 19% 20% 39% 28% 22% 24% 21% 21% 36% 23% 17%Unfavorable 42% 36% 49% 46% 51% 35% 40% 40% 47% 35% 49% 44% 44% 25% 49% 32% 41% 49% 47% 34% 39% 41%
Don't know/No opinion 36% 33% 37% 41% 28% 43% 35% 38% 31% 33% 39% 37% 37% 36% 23% 46% 35% 30% 32% 30% 38% 42%
Total Dem Rep
Ind/
Other M F Lib Mod Conserv NYC Subs Upst White
Afr Amer
/Black Other 18-34 35-54 55+ Cath Jewish Prot Other
Favorable 9% 8% 10% 11% 11% 8% 8% 11% 9% 8% 13% 9% 9% 11% 17% 7% 9% 11% 11% 6% 8% 10%
Unfavorable 19% 23% 14% 17% 21% 18% 23% 20% 18% 18% 20% 20% 18% 20% 22% 24% 22% 14% 20% 17% 20% 19%
Don't know/No opinion 71% 69% 76% 72% 68% 74% 69% 70% 74% 74% 67% 71% 73% 69% 62% 69% 69% 75% 69% 77% 73% 72%
Q9. John Sampson
Q8. Dean Skelos
Party Gender Political View Region Ethnic Age Religion
Q7. Sheldon Silver
Party Gender Political View Region Ethnic Age Religion
Q6. Tea Party Movement
Party Gender Political View Region Ethnic Age Religion
Total Dem Rep
Ind/
Other M F Lib Mod Conserv NYC Subs Upst White
Afr Amer
/Black Other 18-34 35-54 55+ Cath Jewish Prot Other
Favorable 10% 13% 4% 12% 11% 9% 14% 10% 8% 11% 8% 10% 9% 16% 22% 15% 10% 7% 8% 13% 12% 10%
Unfavorable 14% 15% 14% 12% 15% 13% 16% 12% 16% 15% 18% 11% 13% 22% 14% 20% 15% 9% 16% 12% 11% 15%
Don't know/No opinion 76% 72% 82% 76% 74% 78% 71% 78% 76% 74% 74% 79% 78% 63% 64% 65% 75% 84% 75% 76% 77% 75%
Total Dem Rep
Ind/
Other M F Lib Mod Conserv NYC Subs Upst White
Afr Amer
/Black Other 18-34 35-54 55+ Cath Jewish Prot Other
Favorable 9% 9% 10% 7% 13% 6% 9% 10% 8% 7% 7% 13% 8% 7% 20% 17% 9% 4% 12% 6% 6% 9%
Unfavorable 9% 10% 11% 7% 10% 9% 9% 9% 11% 9% 11% 9% 8% 19% 5% 16% 9% 6% 8% 7% 12% 9%
Don't know/No opinion 82% 81% 79% 86% 77% 85% 81% 81% 81% 85% 82% 78% 83% 74% 75% 67% 82% 90% 80% 86% 82% 82%
Q10. Brian Kolb
Party Gender Political View Region Ethnic Age Religion
Party Gender Pol t cal V ew Reg on Ethn c Age Rel g on
SNY1210 Crosstabs 2 of 8
8/8/2019 SNY1210 Crosstabs
http://slidepdf.com/reader/full/sny1210-crosstabs 3/8

8/8/2019 SNY1210 Crosstabs
http://slidepdf.com/reader/full/sny1210-crosstabs 4/8

8/8/2019 SNY1210 Crosstabs
http://slidepdf.com/reader/full/sny1210-crosstabs 5/8
8/8/2019 SNY1210 Crosstabs
http://slidepdf.com/reader/full/sny1210-crosstabs 6/8

8/8/2019 SNY1210 Crosstabs
http://slidepdf.com/reader/full/sny1210-crosstabs 7/8
Siena College Research Institute
December 6 - 8, 2010
806 New York State Registered Voters
MOE +/- 3.5%
Total Dem Rep
Ind/
Other M F Lib Mod Conserv NYC Subs Upst White
Afr Amer
/Black Other 18-34 35-54 55+ Cath Jewish Prot OtherA balanced state budget with no new
taxes29% 26% 31% 32% 29% 30% 22% 29% 37% 27% 36% 28% 31% 23% 26% 29% 28% 31% 33% 28% 29% 23%
A thriving Wall Street to help New York's
economy7% 8% 9% 6% 9% 6% 7% 9% 5% 8% 11% 4% 7% 8% 10% 11% 6% 6% 8% 10% 5% 9%
A revitalized upstate economy that
produces jobs32% 32% 34% 32% 35% 30% 34% 35% 28% 24% 26% 44% 34% 32% 26% 31% 34% 32% 32% 17% 35% 39%
A scandal-free and effective State
Legislature9% 8% 11% 9% 10% 9% 8% 10% 8% 10% 9% 8% 10% 7% 1% 7% 9% 11% 11% 10% 8% 8%
The best schools and hospitals in thenation 20% 24% 13% 18% 15% 24% 28% 16% 19% 28% 17% 13% 17% 28% 38% 21% 21% 18% 15% 34% 21% 20%
Vol: Something else 1% 1% 1% 1% 1% 1% 0% 0% 2% 1% 0% 1% 0% 2% 0% 1% 1% 1% 1% 0% 1% 0%
Don't know/No opinion 1% 1% 1% 1% 2% 1% 1% 1% 1% 2% 0% 1% 1% 0% 0% 0% 1% 2% 1% 2% 1% 2%
Q29. If you could play Santa Claus, which of the following gifts would you most like to leave under Governor-elect Andrew Cuomo's Christmas tree?
Party Gender Political View Region Ethnic Age Religion
SNY1210 Crosstabs 7 of 8
8/8/2019 SNY1210 Crosstabs
http://slidepdf.com/reader/full/sny1210-crosstabs 8/8
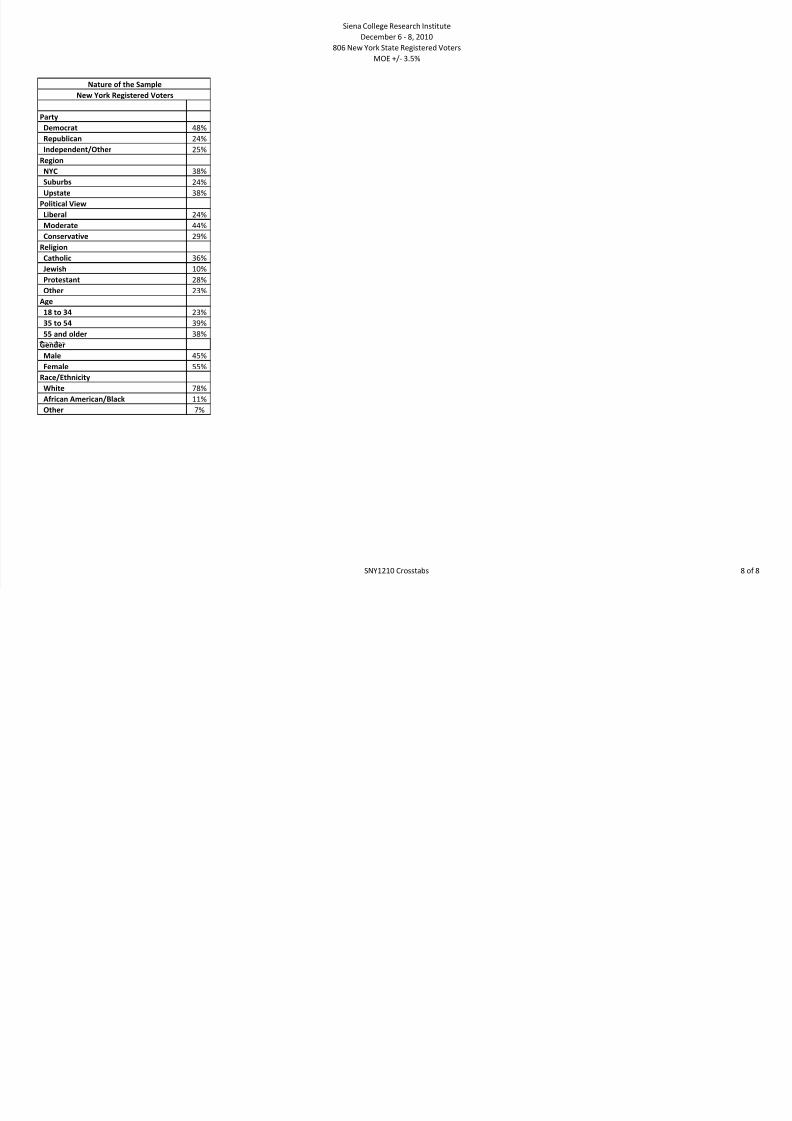
Siena College Research Institute
December 6 - 8, 2010
806 New York State Registered Voters
MOE +/- 3.5%
Party
Democrat 48%
Republican 24%
Independent/Other 25%
Region
NYC 38%
Suburbs 24%
Upstate 38%
Political View
Liberal 24%
Moderate 44%
Conservative 29%
Religion
Catholic 36%
Jewish 10%
Protestant 28%
Other 23%
Age
18 to 34 23%35 to 54 39%
55 and older 38%
Nature of the Sample
New York Registered Voters
Gender
Male 45%
Female 55%
Race/Ethnicity
White 78%
African American/Black 11%
Other 7%
SNY1210 Crosstabs 8 of 8