Snow Analysis for Numerical Weather prediction at ECMWF
24
ECMWF IGARSS 2011, Vancouver, 25-29 July 2011 Slide 1 Snow Analysis Snow Analysis Snow Analysis Snow Analysis for Numerical Weather prediction for Numerical Weather prediction for Numerical Weather prediction for Numerical Weather prediction at ECMWF at ECMWF at ECMWF at ECMWF European Centre for Medium-Range Weather Forecasts Patricia de Rosnay, Gianpaolo Balsamo, Lars Isaksen
-
Upload
grssieee -
Category
Technology
-
view
1.020 -
download
4
description
Transcript of Snow Analysis for Numerical Weather prediction at ECMWF
ECMWFIGARSS 2011, Vancouver, 25-29 July 2011 Slide 1
Snow Analysis Snow Analysis Snow Analysis Snow Analysis
for Numerical Weather prediction for Numerical Weather prediction for Numerical Weather prediction for Numerical Weather prediction
at ECMWFat ECMWFat ECMWFat ECMWF
European Centre for Medium-Range Weather Forecasts
Patricia de Rosnay, Gianpaolo Balsamo, Lars Isaksen
ECMWFIGARSS 2011, Vancouver, 25-29 July 2011 Slide 2
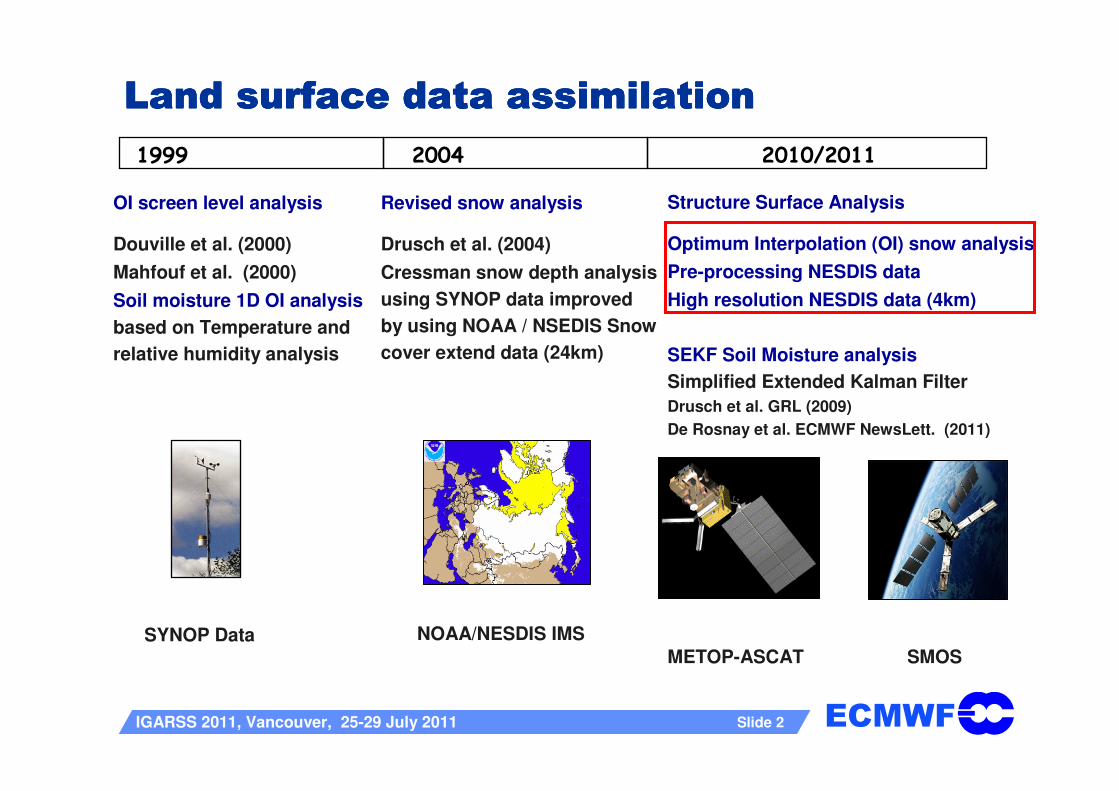
Land surface data assimilationLand surface data assimilationLand surface data assimilationLand surface data assimilation
1999 2004 2010/2011
OI screen level analysis
Douville et al. (2000)
Mahfouf et al. (2000)
Soil moisture 1D OI analysis
based on Temperature and
relative humidity analysis
SYNOP Data
Revised snow analysis
Drusch et al. (2004)
Cressman snow depth analysis
using SYNOP data improved
by using NOAA / NSEDIS Snow
cover extend data (24km)
NOAA/NESDIS IMS
Structure Surface Analysis
Optimum Interpolation (OI) snow analysis
Pre-processing NESDIS data
High resolution NESDIS data (4km)
SEKF Soil Moisture analysis
Simplified Extended Kalman Filter
Drusch et al. GRL (2009)
De Rosnay et al. ECMWF NewsLett. (2011)
METOP-ASCAT SMOS
ECMWFIGARSS 2011, Vancouver, 25-29 July 2011 Slide 3
Snow Analysis Snow Analysis Snow Analysis Snow Analysis
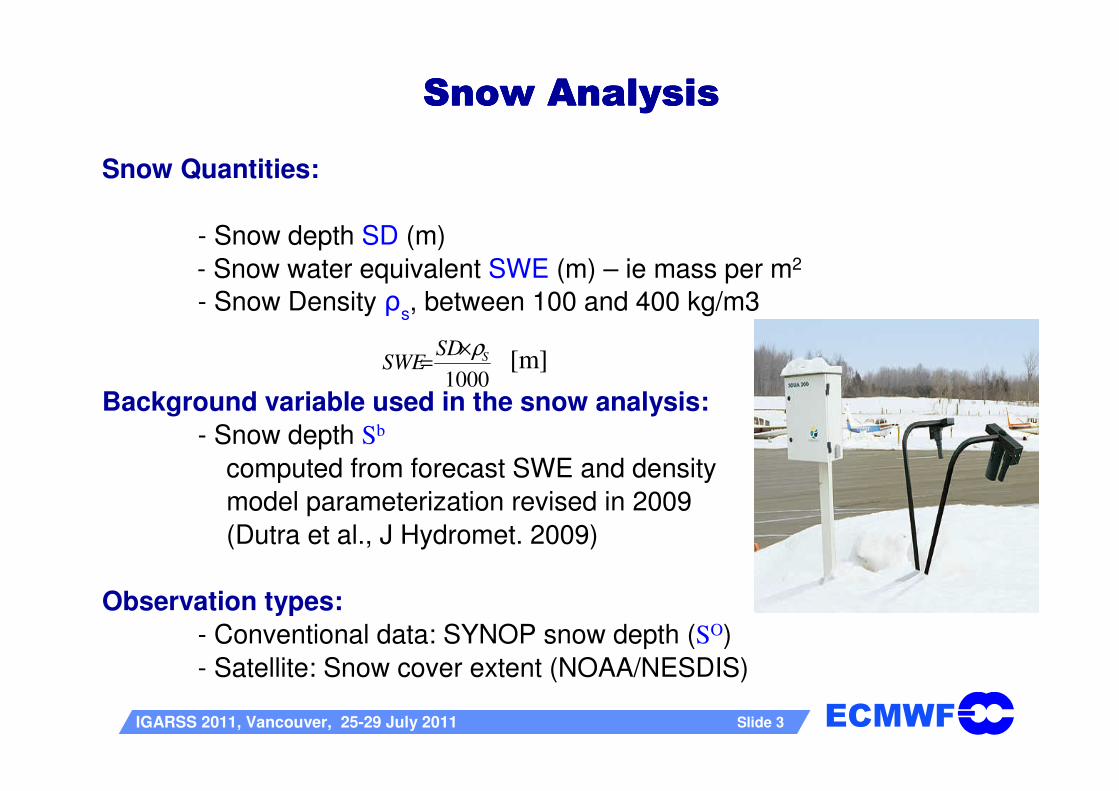
Snow Quantities:
- Snow depth SD (m)
- Snow water equivalent SWE (m) – ie mass per m2
- Snow Density ρs, between 100 and 400 kg/m3
Background variable used in the snow analysis:
- Snow depth Sb
computed from forecast SWE and density
model parameterization revised in 2009
(Dutra et al., J Hydromet. 2009)
Observation types:
- Conventional data: SYNOP snow depth (SO)
- Satellite: Snow cover extent (NOAA/NESDIS)
1000
SSD
SWEρ×
= [m]
ECMWFIGARSS 2011, Vancouver, 25-29 July 2011 Slide 4
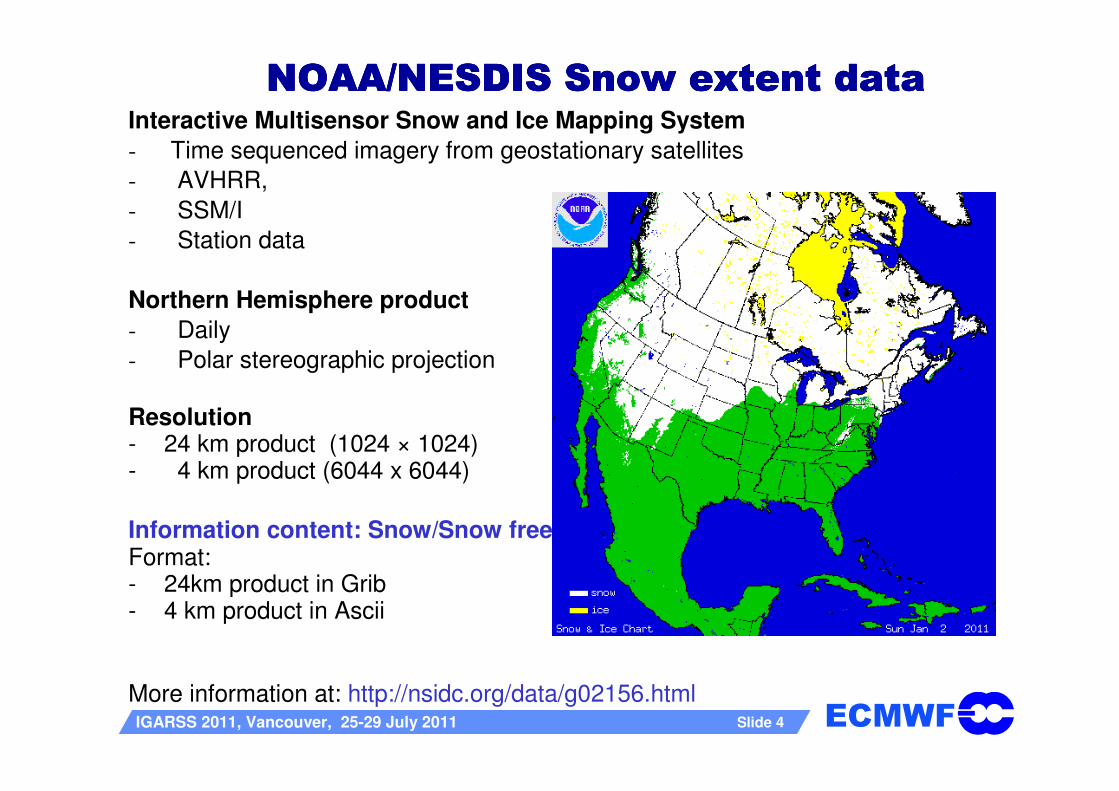
NOAA/NESDIS Snow extent dataNOAA/NESDIS Snow extent dataNOAA/NESDIS Snow extent dataNOAA/NESDIS Snow extent dataInteractive Multisensor Snow and Ice Mapping System
- Time sequenced imagery from geostationary satellites
- AVHRR,
- SSM/I
- Station data
Northern Hemisphere product
- Daily
- Polar stereographic projection
Resolution- 24 km product (1024 × 1024)- 4 km product (6044 x 6044)
Information content: Snow/Snow freeFormat: - 24km product in Grib- 4 km product in Ascii
More information at: http://nsidc.org/data/g02156.html
ECMWFIGARSS 2011, Vancouver, 25-29 July 2011 Slide 5
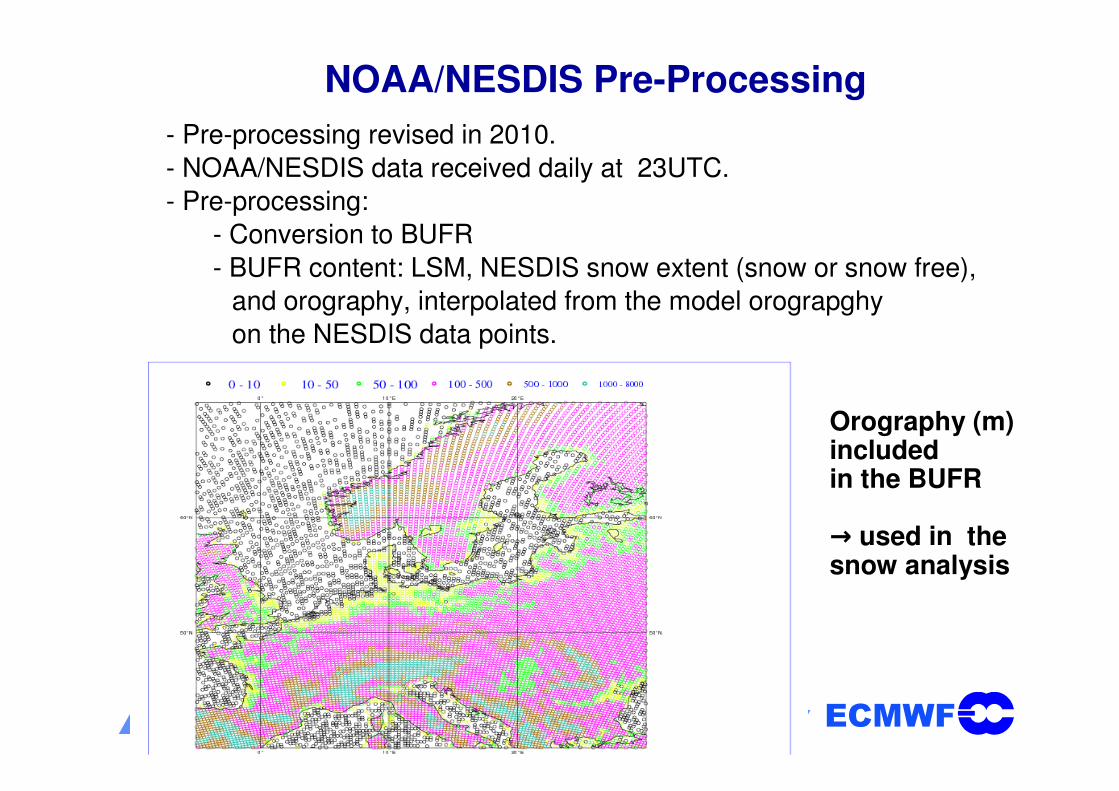
NOAA/NESDIS Pre-Processing
- Pre-processing revised in 2010.
- NOAA/NESDIS data received daily at 23UTC.
- Pre-processing:
- Conversion to BUFR
- BUFR content: LSM, NESDIS snow extent (snow or snow free),
and orography, interpolated from the model orograpghy
on the NESDIS data points.
Orography (m) includedin the BUFR
→ used in the snow analysis
ECMWFIGARSS 2011, Vancouver, 25-29 July 2011 Slide 6
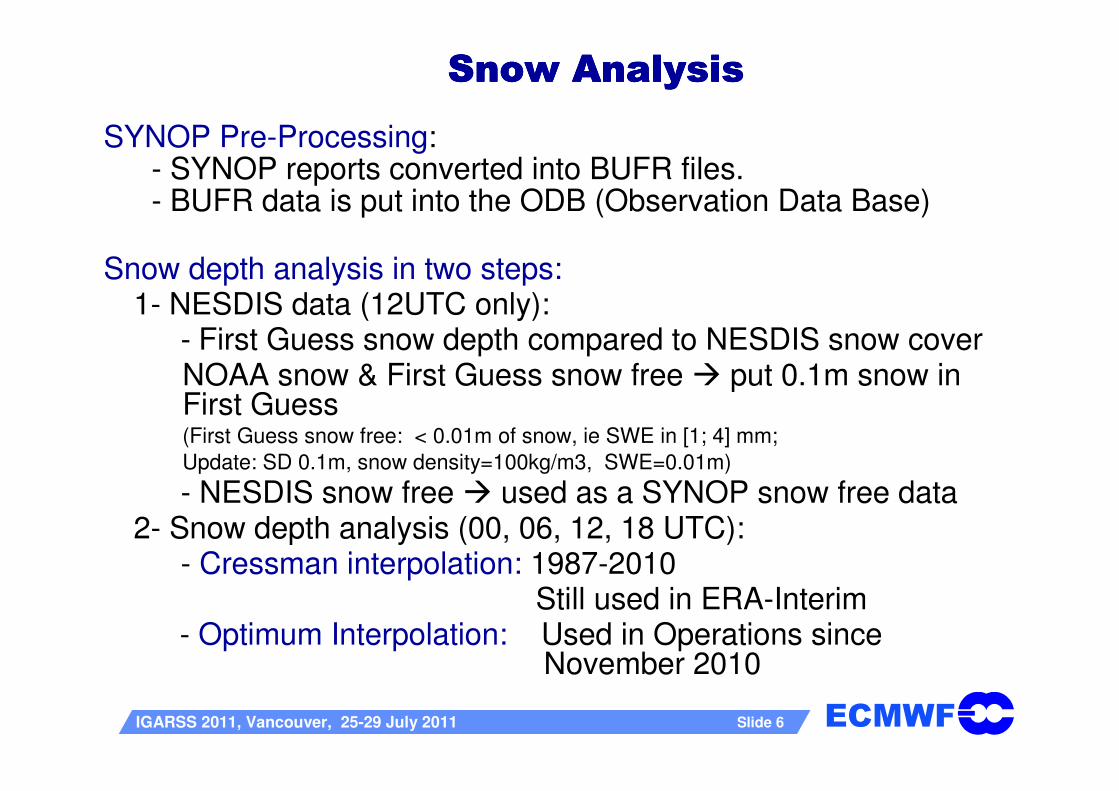
Snow AnalysisSnow AnalysisSnow AnalysisSnow Analysis
Snow depth analysis in two steps:1- NESDIS data (12UTC only):
- First Guess snow depth compared to NESDIS snow coverNOAA snow & First Guess snow free � put 0.1m snow in First Guess (First Guess snow free: < 0.01m of snow, ie SWE in [1; 4] mm;
Update: SD 0.1m, snow density=100kg/m3, SWE=0.01m)
- NESDIS snow free � used as a SYNOP snow free data 2- Snow depth analysis (00, 06, 12, 18 UTC):
- Cressman interpolation: 1987-2010 Still used in ERA-Interim
- Optimum Interpolation: Used in Operations since November 2010
SYNOP Pre-Processing: - SYNOP reports converted into BUFR files. - BUFR data is put into the ODB (Observation Data Base)

ECMWFIGARSS 2011, Vancouver, 25-29 July 2011 Slide 7
( )
∑
∑
=
=
−
+=N
n
n
N
n
bO
nn
ba
w
SSw
SS
1
1
'
Cressman Interpolation
- (Cressman 1959)
- SO snow depth from synop reports,
- Sb background field estimated from the short-range forecast of snow water equivalent,
- Sb‘ background field at observation location, and
- wn weight function, which is a function of horizontal r and vertical difference h (model –
obs): w = H(r) v(h) with:
+
−= ,0
rr
rrmaxH(r)
22max
22max
2h2max
h
2h2max
h
+
−
1 if 0 < h Model above observing station
0 if h < - hmax
if – hmax < h < 0v(h) =
rmax = 250 km (influence radius)
hmax = 300 m (model no more than
300m below obs)
Obs point more than
300m higher than model
55°N55°N
60°N 60°N
65°N65°N
70°N 70°N
75°N75°N
85°E
85°E 90°E
90°E 95°E
95°E 100°E
100°E 105°E
105°E 110°E
110°E 115°E
115°E 120°E
120°E 125°E
125°E 130°E
130°E 135°E
135°E 140°E
140°E 145°E
145°E 150°E
150°E 155°E
155°E
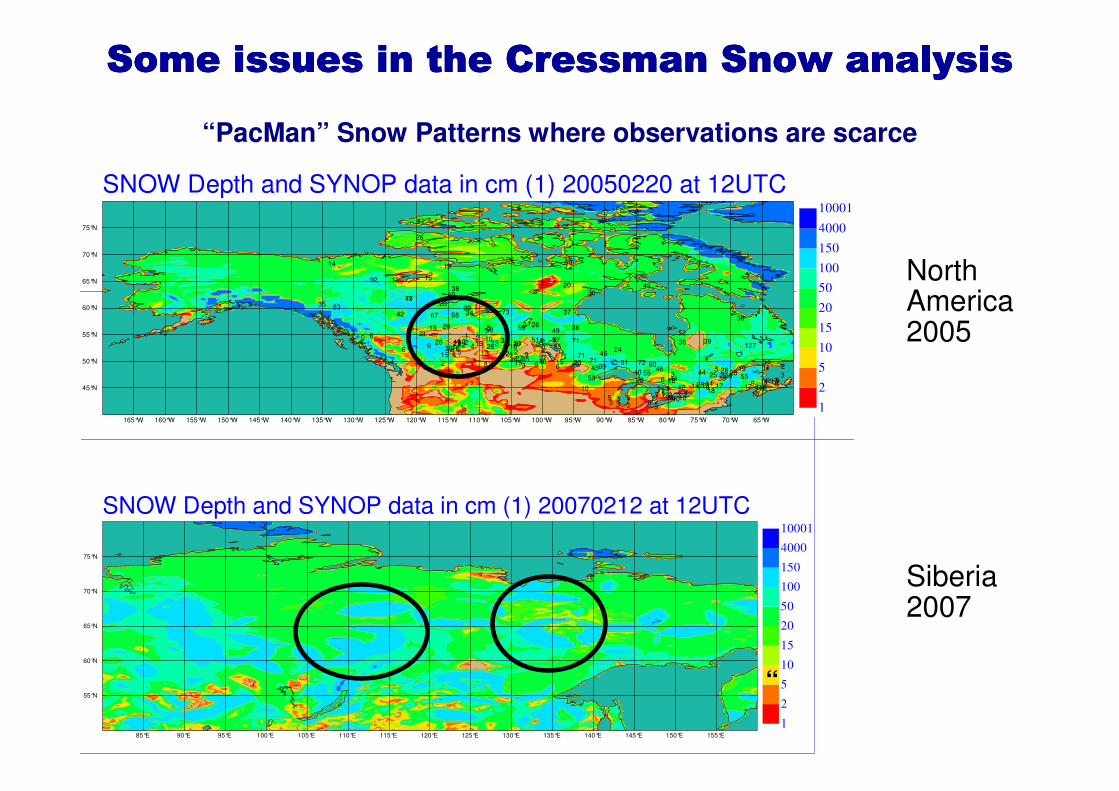
SNOW Depth and SYNOP data in cm (1) 20070212 at 12UTC
1
2
5
10
15
20
50
100
150
4000
10001
1517 3
2
7145
119 14 17
319
44 285
6 18
40 4634
20
49
19
33
42
77
60
35
2
15
2310
12
29
8
940
37
34
20
63
67
18
55
5026
49
30
6 2
512515 26
411
2
12738
6072517146
2371
453
182
6
279
0
4252
35
36
43
5
26
20
36
35
68
7 7
42 17
2
55
24
12
14
45
2521
25 79
7
59
15
3218
26
3
3924
27
55
45
6
3
1615 5
4
73
12
6
37
2126 19
4
101
71
39
1
2
8
271
69
13
36
14
92
9
15
65
26
80
310
3
18535
10
53
1033
2
44 109
15
28
38
26
12
34
57
10
45°N45°N
50°N 50°N
55°N55°N
60°N 60°N
65°N65°N
70°N 70°N
75°N75°N
165°W
165°W 160°W
160°W 155°W
155°W 150°W
150°W 145°W
145°W 140°W
140°W 135°W
135°W 130°W
130°W 125°W
125°W 120°W
120°W 115°W
115°W 110°W
110°W 105°W
105°W 100°W
100°W 95°W
95°W 90°W
90°W 85°W
85°W 80°W
80°W 75°W
75°W 70°W
70°W 65°W
65°W
SNOW Depth and SYNOP data in cm (1) 20050220 at 12UTC
1
2
5
10
15
20
50
100
150
4000
10001
North America 2005
Siberia2007
“
Some issues in the Some issues in the Some issues in the Some issues in the CressmanCressmanCressmanCressman Snow analysisSnow analysisSnow analysisSnow analysis
“PacMan” Snow Patterns where observations are scarce
55°N55°N
60°N 60°N
65°N65°N
70°N 70°N
75°N75°N
85°E
85°E 90°E
90°E 95°E
95°E 100°E
100°E 105°E
105°E 110°E
110°E 115°E
115°E 120°E
120°E 125°E
125°E 130°E
130°E 135°E
135°E 140°E
140°E 145°E
145°E 150°E
150°E 155°E
155°E
SNOW Depth and SYNOP data in cm (1) 20100223 at 12UTC
1
2
5
10
15
20
50
100
150
4000
10001
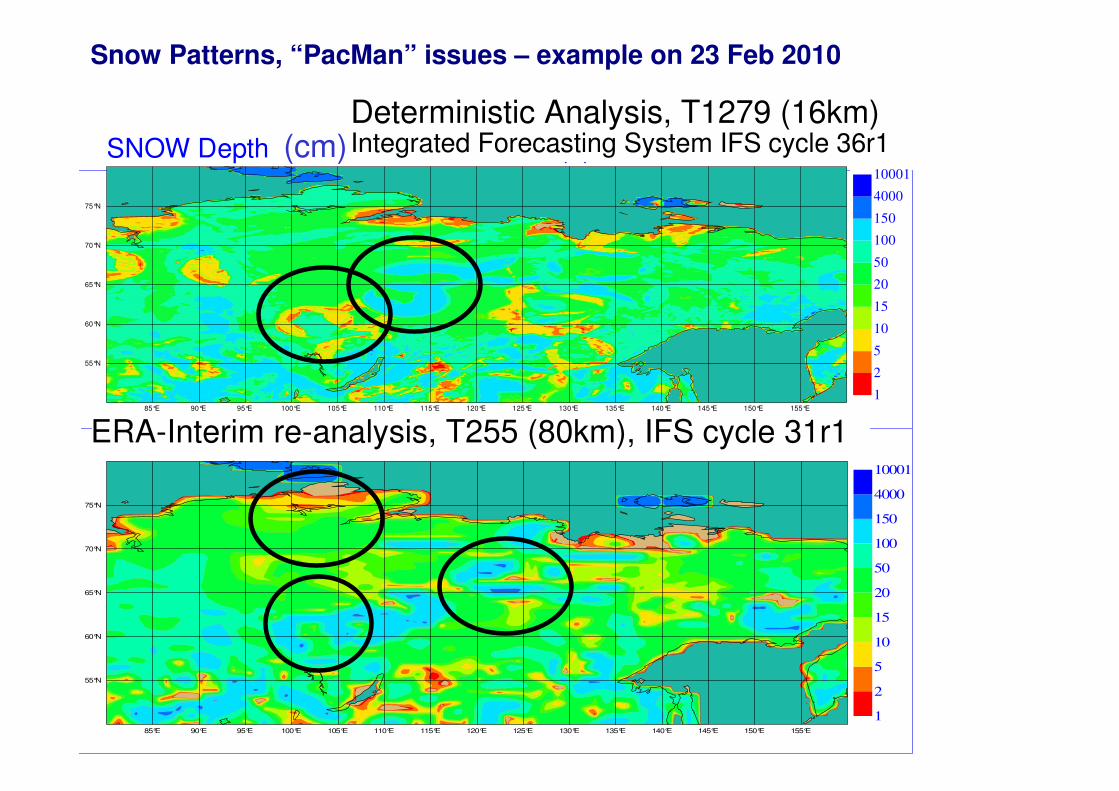
Snow Patterns, “PacMan” issues – example on 23 Feb 2010
ERA-Interim re-analysis, T255 (80km), IFS cycle 31r1
(cm)Deterministic Analysis, T1279 (16km)Integrated Forecasting System IFS cycle 36r1
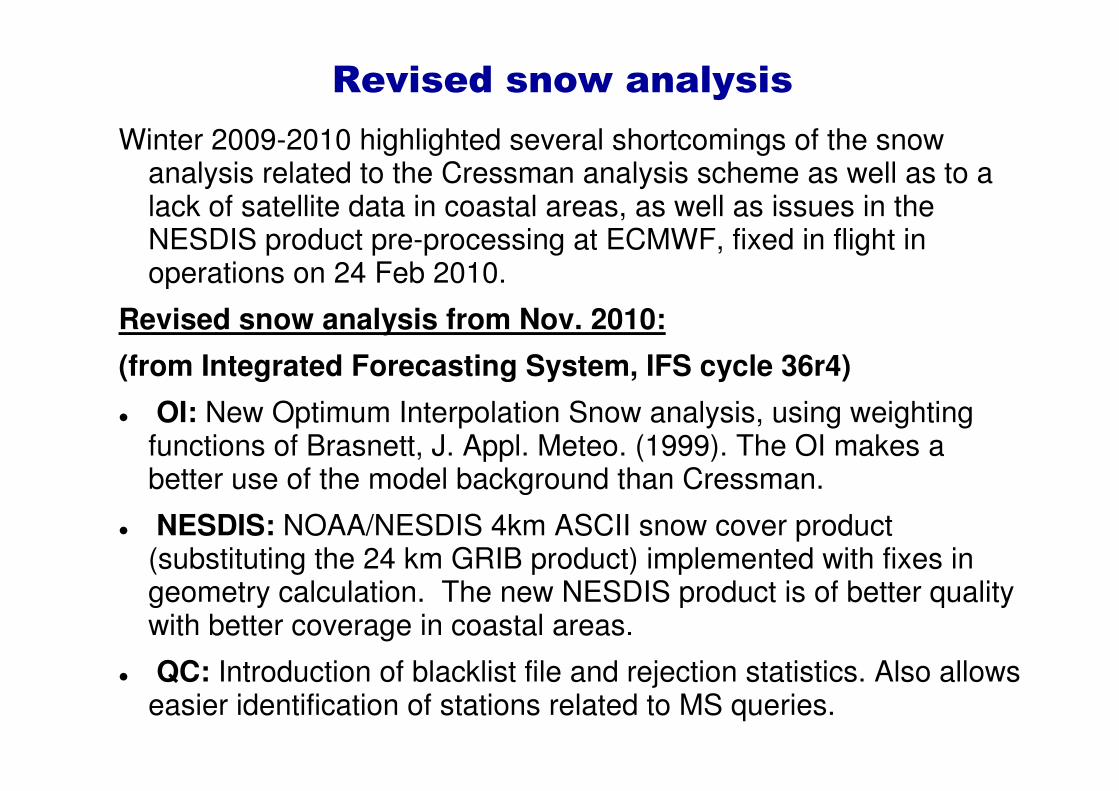
Winter 2009-2010 highlighted several shortcomings of the snow analysis related to the Cressman analysis scheme as well as to a lack of satellite data in coastal areas, as well as issues in the NESDIS product pre-processing at ECMWF, fixed in flight in operations on 24 Feb 2010.
Revised snow analysis from Nov. 2010:
(from Integrated Forecasting System, IFS cycle 36r4)
� OI: New Optimum Interpolation Snow analysis, using weighting functions of Brasnett, J. Appl. Meteo. (1999). The OI makes a better use of the model background than Cressman.
� NESDIS: NOAA/NESDIS 4km ASCII snow cover product (substituting the 24 km GRIB product) implemented with fixes in geometry calculation. The new NESDIS product is of better quality with better coverage in coastal areas.
� QC: Introduction of blacklist file and rejection statistics. Also allows easier identification of stations related to MS queries.
Revised snow analysis

ECMWFIGARSS 2011, Vancouver, 25-29 July 2011 Slide 11
Snow depth Optimum InterpolationSnow depth Optimum InterpolationSnow depth Optimum InterpolationSnow depth Optimum Interpolation
1. Observed Increments from the interpolated background ∆Si are estimated at
each observation location i.
2. Analysis increments ∆Sja at each model grid point j are calculated from:
∑ =
∆×=∆N
i 1
ii
a
j SwS
3. The optimum weights wi are given for each grid point j by: (B + O) w = b
b : error covariance between observation i and model grid point j
(dimension of N observations) b(i) = σb . X µ(i,,j)
B : error covariance matrix of the background field (N × N observations)
B(i1,i2) = σ2b ×µ(i1,i2) with the horizontal correlation coefficients µ(i1,i2)
and σb = 3cm the standard deviation of background errors.
(Brasnett , 1999)
−
−+=)(
2
ii
2
iiii
21Lz
zexp.
Lx
rexp)
Lx
r1(i,iµ 212121
O : covariance matrix of the observation error (N × N observations):
O = σ2o × I with σo = 4cm the standard deviation of obs. Errors
Lz; vertical length scale: 800m, Lx: horizontal length scale: 55km
Quality Control: if ∆Si> Tol (σb2 + σo2 )1/2 ; Tol = 5
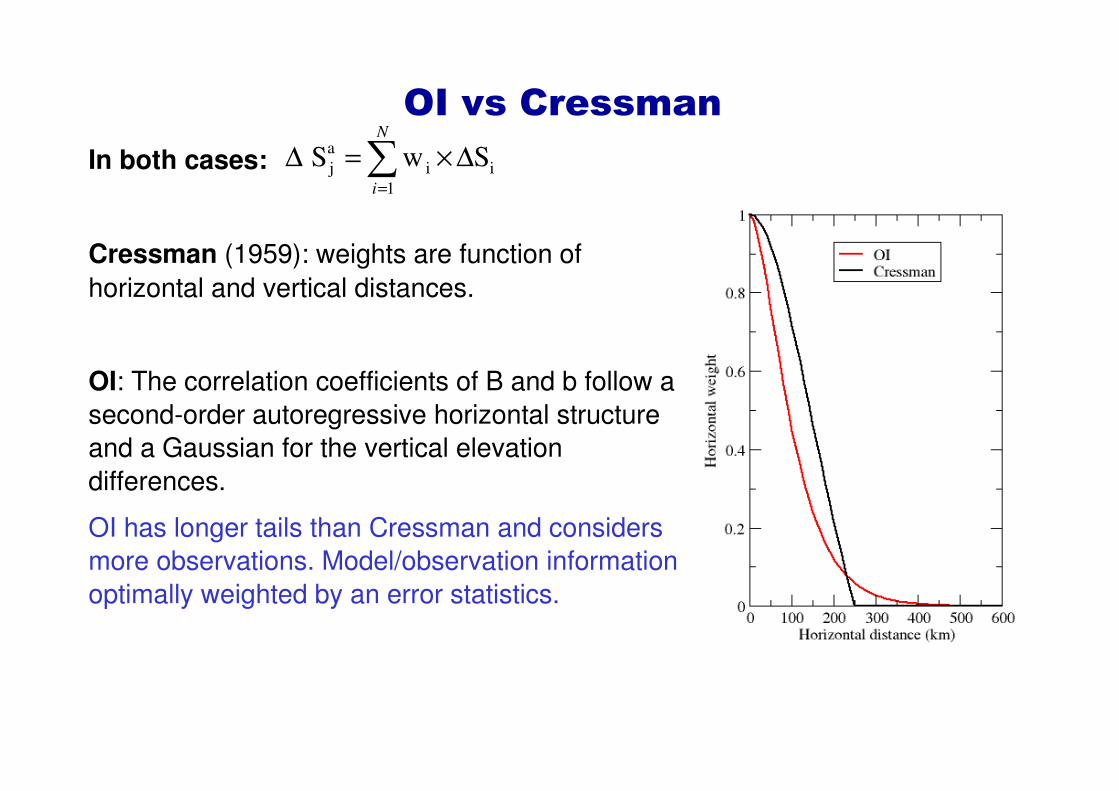
In both cases:
Cressman (1959): weights are function of
horizontal and vertical distances.
OI: The correlation coefficients of B and b follow a
second-order autoregressive horizontal structure
and a Gaussian for the vertical elevation
differences.
OI has longer tails than Cressman and considers
more observations. Model/observation information
optimally weighted by an error statistics.
OI vs Cressman
∑ =
∆×=∆N
i 1
ii
a
j SwS
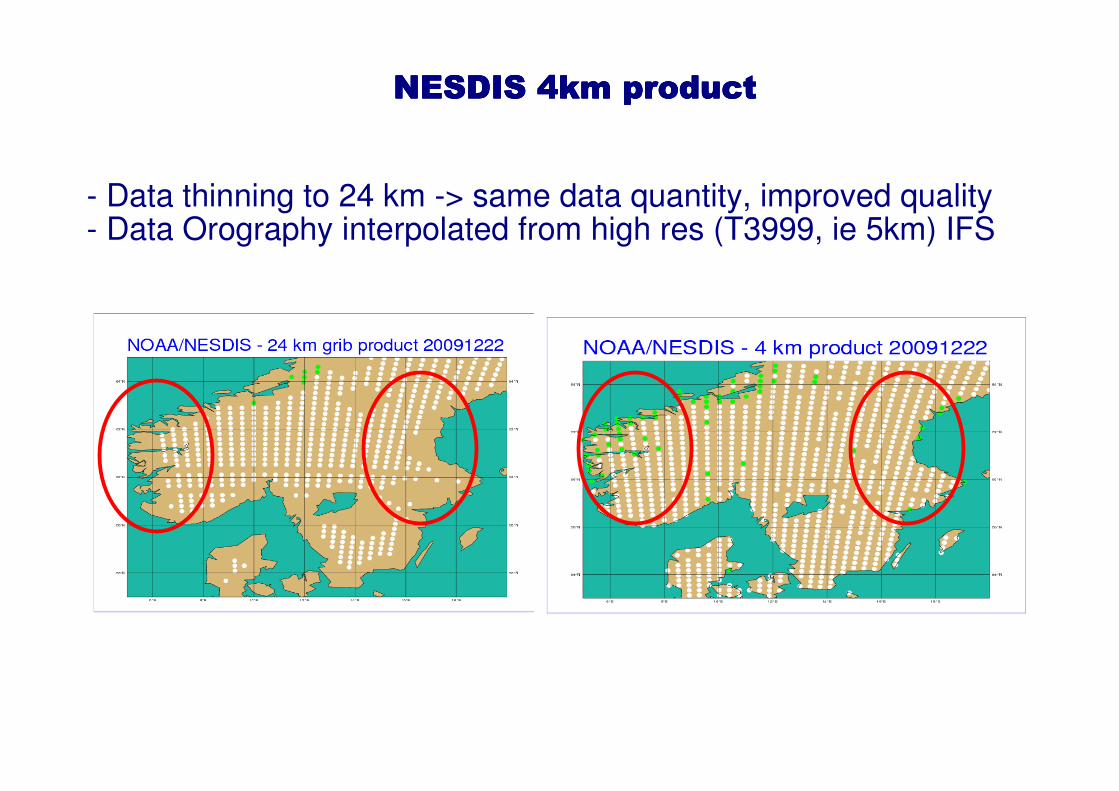
NESDIS 4km productNESDIS 4km productNESDIS 4km productNESDIS 4km product
- Data thinning to 24 km -> same data quantity, improved quality- Data Orography interpolated from high res (T3999, ie 5km) IFS
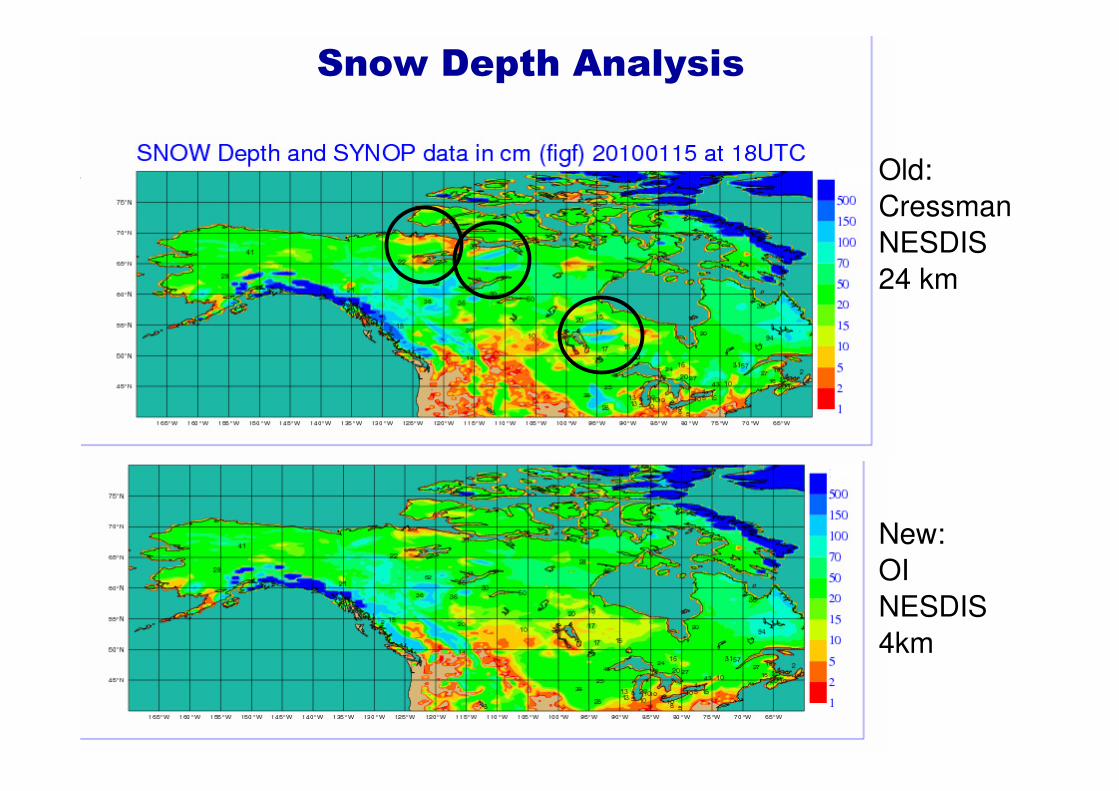
Old:
Cressman
NESDIS
24 km
New:
OI
NESDIS
4km
Snow Depth Analysis

Snow Water Equivalent Analysis increments
Accumulated
January 2010
In mm of water
Old:
Cressman
NESDIS
24 km
New:
OI
NESDIS
4km
(18UTC) Accumulated for January 2010, in mm of water

Cressman, NESDIS 24 km OI, NESDIS 4km
Case study: 22 december 2009 – major snow fall in Europe- Removes snow free patches and overestimated snow patches- Better agreement with SYNOP data and NESDIS data
Snow Depth Analysis
New snow analysis
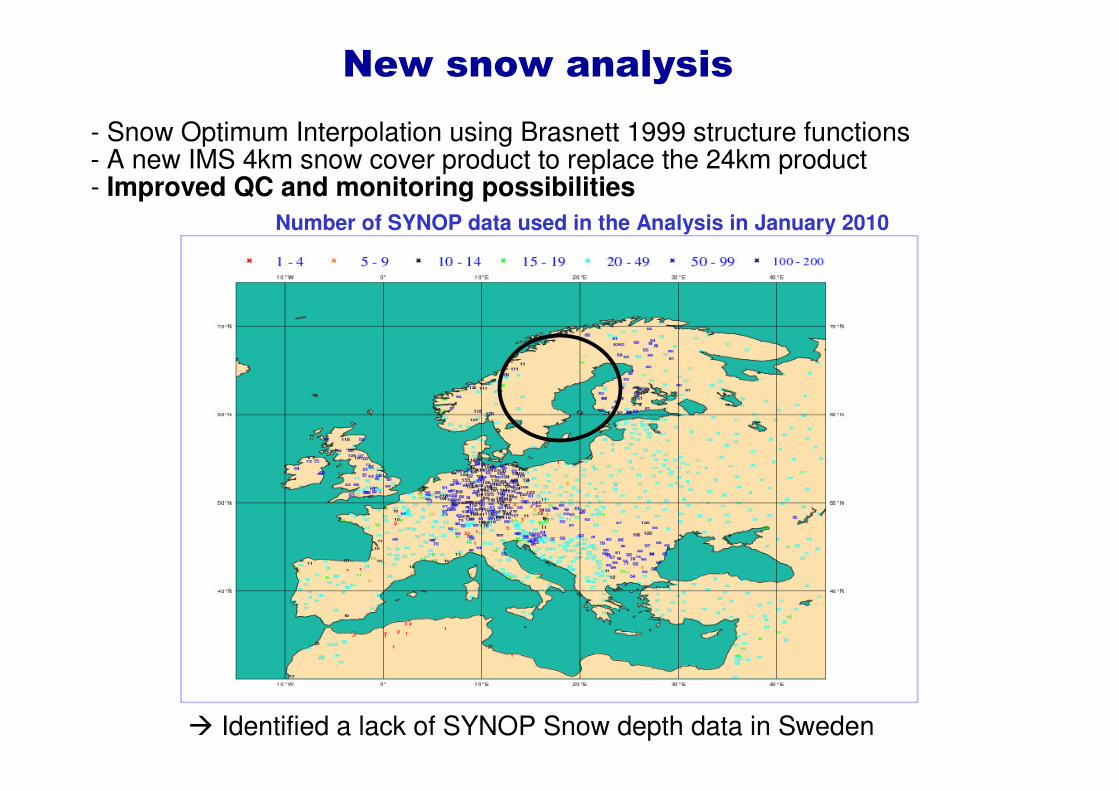
- Snow Optimum Interpolation using Brasnett 1999 structure functions- A new IMS 4km snow cover product to replace the 24km product- Improved QC and monitoring possibilities
Number of SYNOP data used in the Analysis in January 2010
� Identified a lack of SYNOP Snow depth data in Sweden
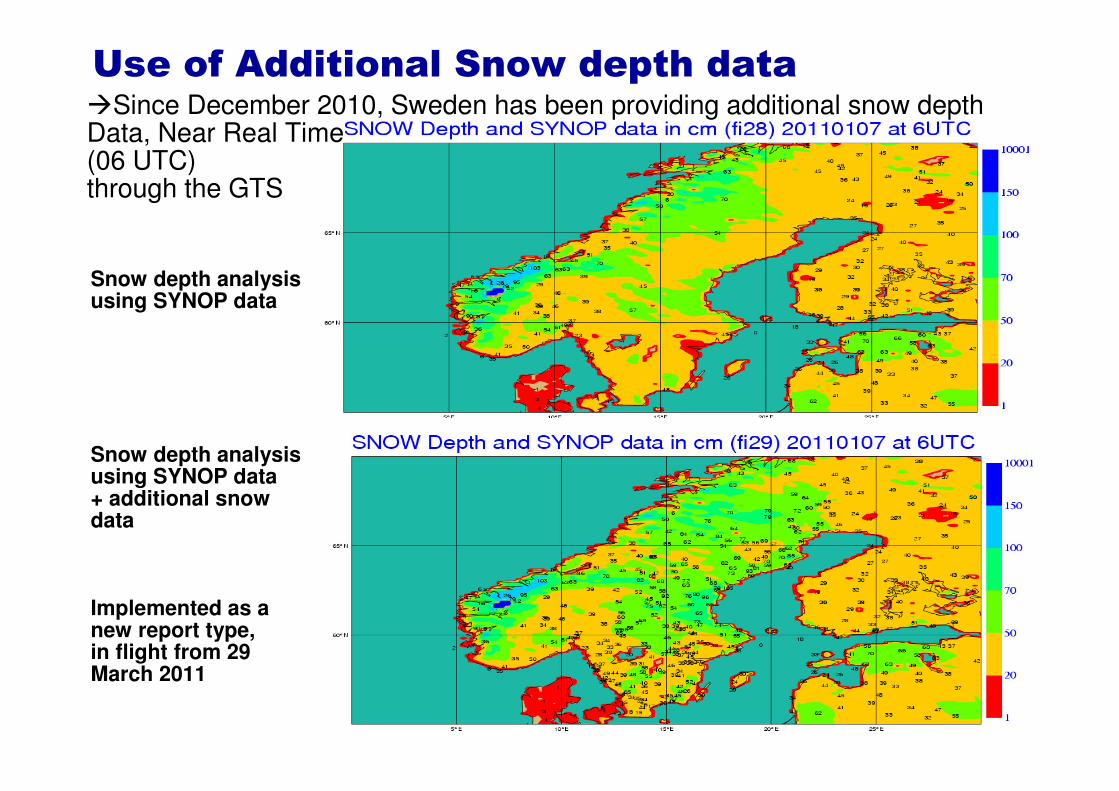
Use of Additional Snow depth data
Snow depth analysis using SYNOP data
Snow depth analysisusing SYNOP data + additional snow data
Implemented as a new report type, in flight from 29 March 2011
�Since December 2010, Sweden has been providing additional snow depthData, Near Real Time(06 UTC)through the GTS

Use of Additional Snow depth data
Snow Depth difference (cm)Due to using additional non-SYNOP data in Sweden
Impact on 500hPa Geopotential
Population: 18Confidence: 90%
500hPa Geopotential 00UTCDate: 20101221 00UTC to 20110107 00UTC
N.hem Lat 20.0 to 90.0 Lon -180.0 to 180.0Root mean square error forecast
control normalised fi28 minus fi29
0 1 2 3 4 5 6 7 8 9 10 11Forecast Day
-0.08
-0.06
-0.04
-0.02
0
0.02
0.04
0.06
0.08
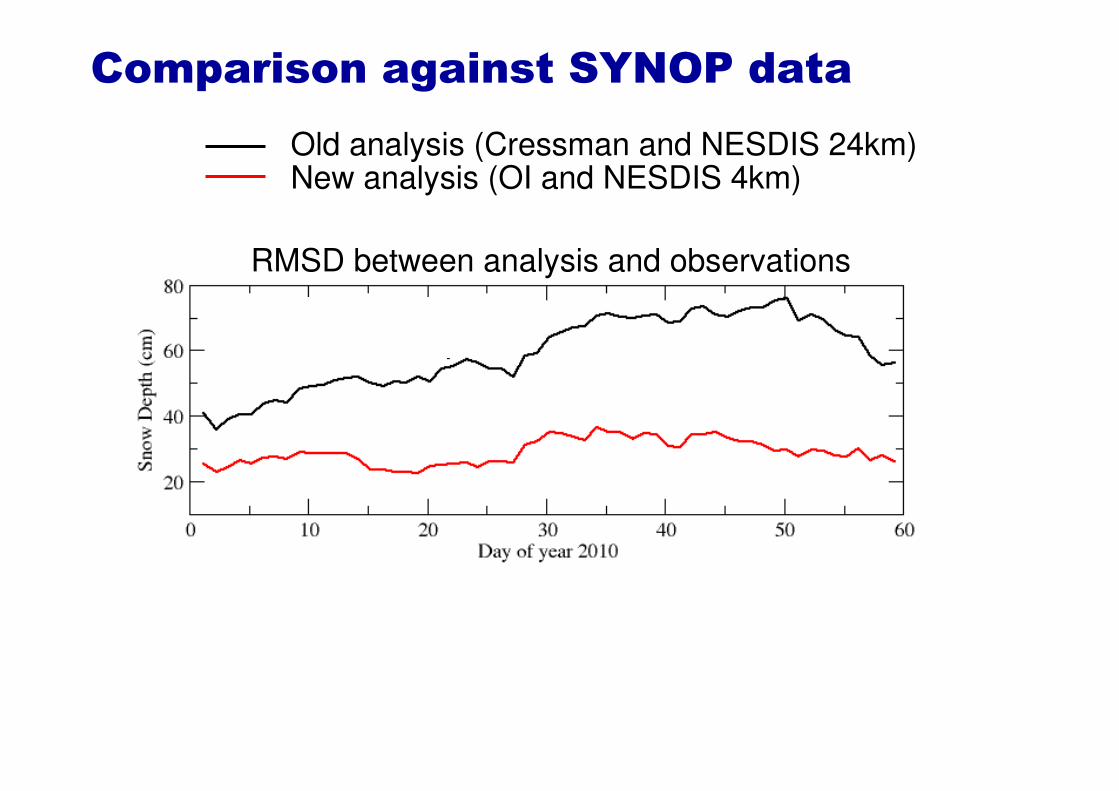
Comparison against SYNOP data
Old analysis (Cressman and NESDIS 24km)New analysis (OI and NESDIS 4km)
RMSD between analysis and observations
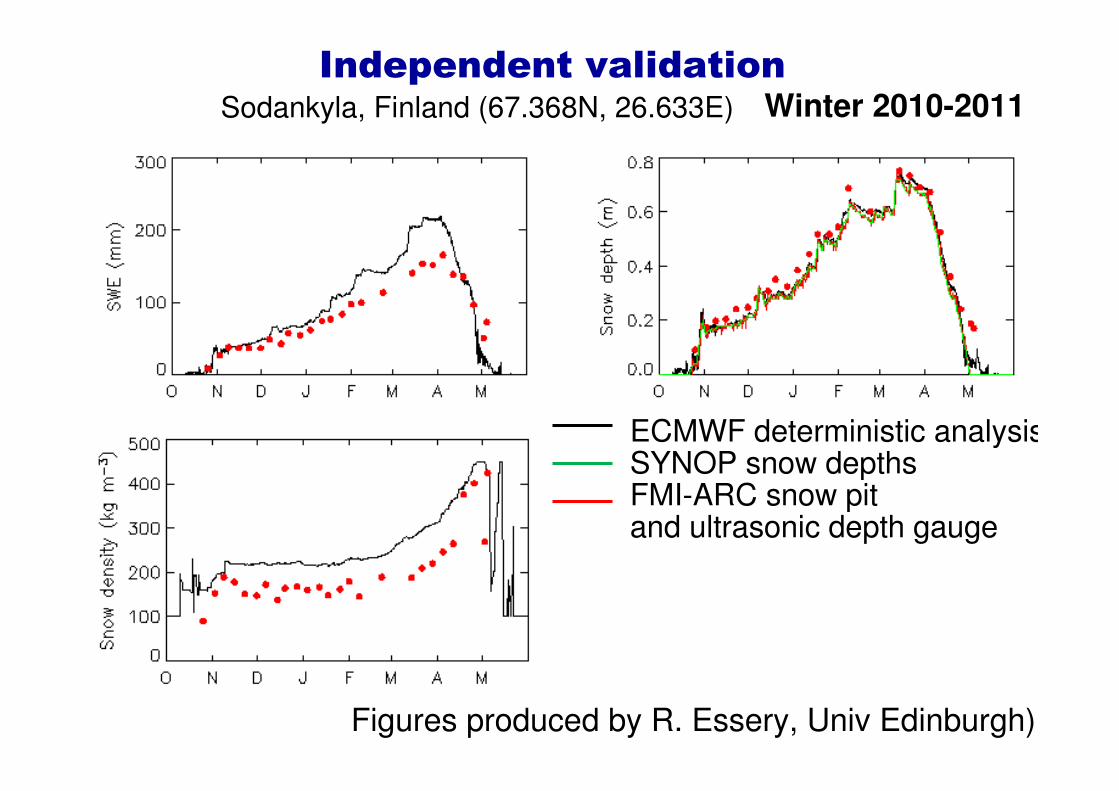
Independent validation Sodankyla, Finland (67.368N, 26.633E)
ECMWF deterministic analysisSYNOP snow depths FMI-ARC snow pit and ultrasonic depth gauge
Figures produced by R. Essery, Univ Edinburgh)
Winter 2010-2011
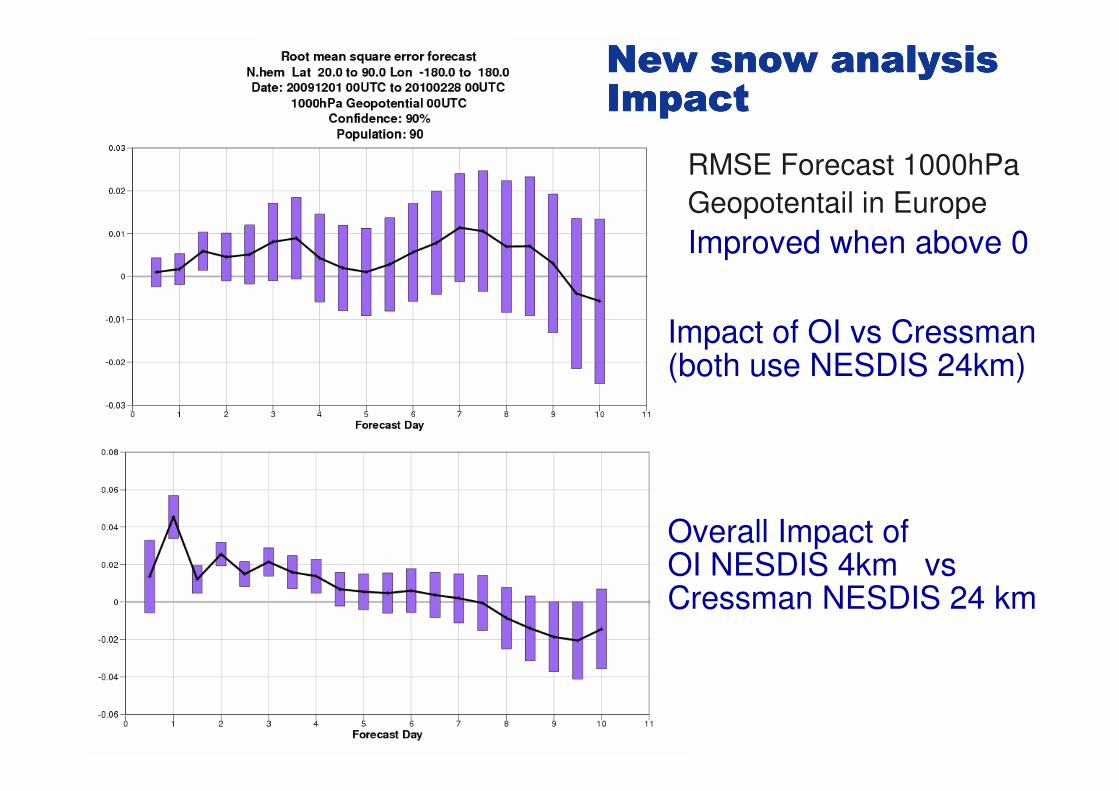
RMSE Forecast 1000hPa
Geopotentail in Europe
Improved when above 0
New snow analysis New snow analysis New snow analysis New snow analysis Impact Impact Impact Impact
Impact of OI vs Cressman(both use NESDIS 24km)
Overall Impact ofOI NESDIS 4km vs Cressman NESDIS 24 km
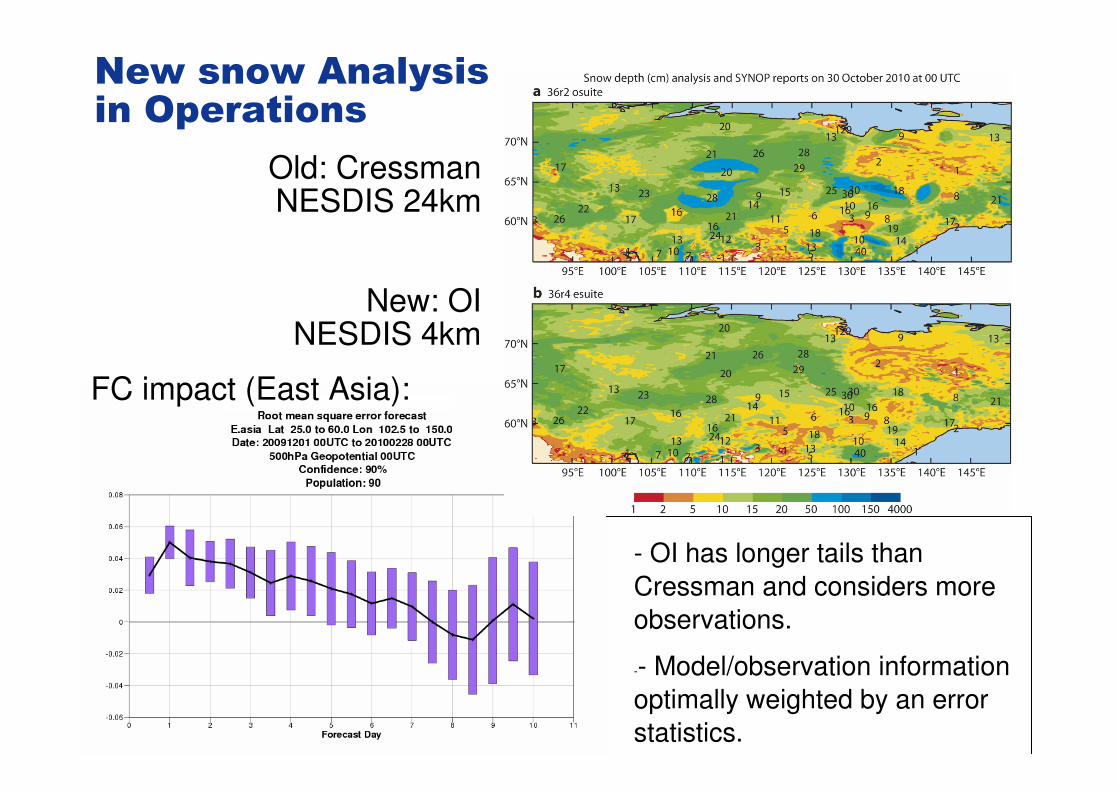
New snow Analysis in Operations
OI Brasnett 1999 +4km NESDIS
- OI has longer tails than
Cressman and considers more
observations.
-- Model/observation information
optimally weighted by an error
statistics.
Cressman +24km NESDIS
Old: CressmanNESDIS 24km
New: OINESDIS 4km
FC impact (East Asia):
• New snow analysis implemented at ECMWF
• Based on a 2D Optimum Interpolation
• Uses Brasnett 1999 structure functions
• Uses SYNOP and high resolution snow cover data from NOAA/NESDIS,
• Flexible to use non-SYNOP reports (new report codetype)
• Improved QC (blacklisting and monitoring possibilities).
• OI has longer tails than Cressman and considers more observations.
• Model/observation information optimally weighted with error statistics.
• Positive impact on NWP. However extensive validation using independent data needs to be done
• In the future, use of combined EKF/OI system for NESDIS/conventional information data assimilation.
Summary and Future PlansSummary and Future PlansSummary and Future PlansSummary and Future Plans