
Snort & ACID
29
Snort & ACID
-
Upload
natalya-penda -
Category
Documents
-
view
66 -
download
4
description
Snort & ACID. SNORT. Overview. Tool Description Where You Can Find it Applicability to Forensics Tool Use/Screen Views Observations Lessons Learned. Technical Description. What is Snort? - PowerPoint PPT Presentation
Transcript of Snort & ACID
Snort & ACID
UTSA IS 6353 Incident Response
SNORT
UTSA IS 6353 Incident Response
Overview
• Tool Description• Where You Can Find it• Applicability to Forensics• Tool Use/Screen Views• Observations• Lessons Learned
UTSA IS 6353 Incident Response
Technical Description
• What is Snort?– “Snort is an open source network intrusion
detection system, capable of performing real-time traffic analysis and packet logging on IP networks.”
– Performs protocol analysis, content searching/matching
– Can detect all sorts of probes and attacks
UTSA IS 6353 Incident Response
How Snort Supports Forensics
• Snort is a packet sniffer on steroids.
• Can be placed at different points in a network to provide real time information.
• By logging alerts and rule violations, a systems administrator can be mindful of attacks in progress or research past incidents.
UTSA IS 6353 Incident Response
Snort Usage
• Run from the command line or as a Windows Service.
• Lots of options
UTSA IS 6353 Incident Response
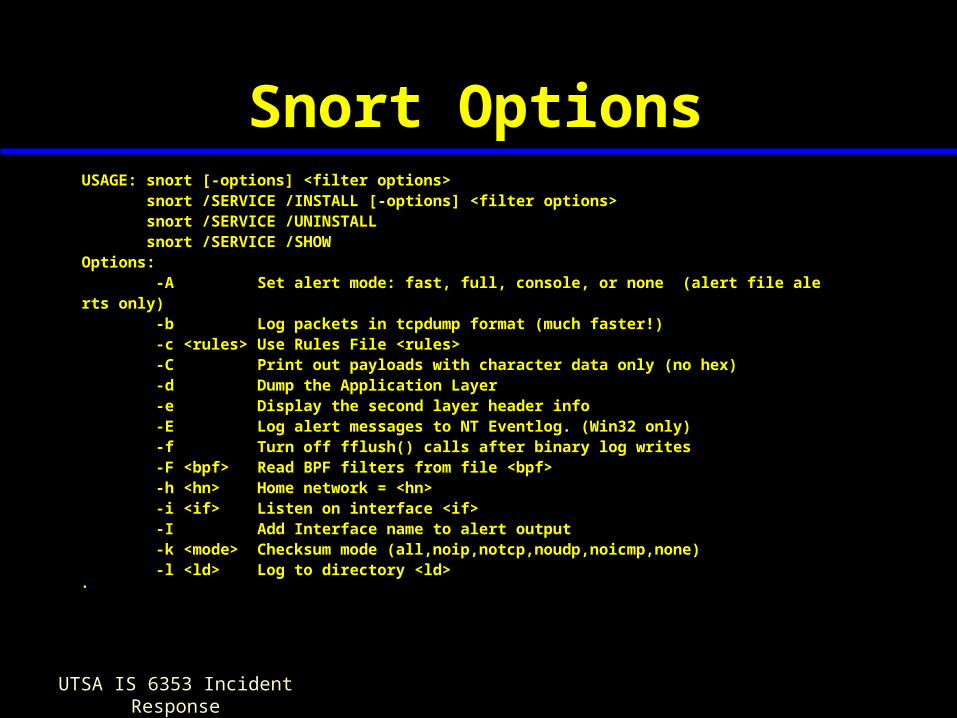
Snort OptionsUSAGE: snort [-options] <filter options> snort /SERVICE /INSTALL [-options] <filter options> snort /SERVICE /UNINSTALL snort /SERVICE /SHOWOptions: -A Set alert mode: fast, full, console, or none (alert file alerts only) -b Log packets in tcpdump format (much faster!) -c <rules> Use Rules File <rules> -C Print out payloads with character data only (no hex) -d Dump the Application Layer -e Display the second layer header info -E Log alert messages to NT Eventlog. (Win32 only) -f Turn off fflush() calls after binary log writes -F <bpf> Read BPF filters from file <bpf> -h <hn> Home network = <hn> -i <if> Listen on interface <if> -I Add Interface name to alert output -k <mode> Checksum mode (all,noip,notcp,noudp,noicmp,none) -l <ld> Log to directory <ld>•
UTSA IS 6353 Incident Response
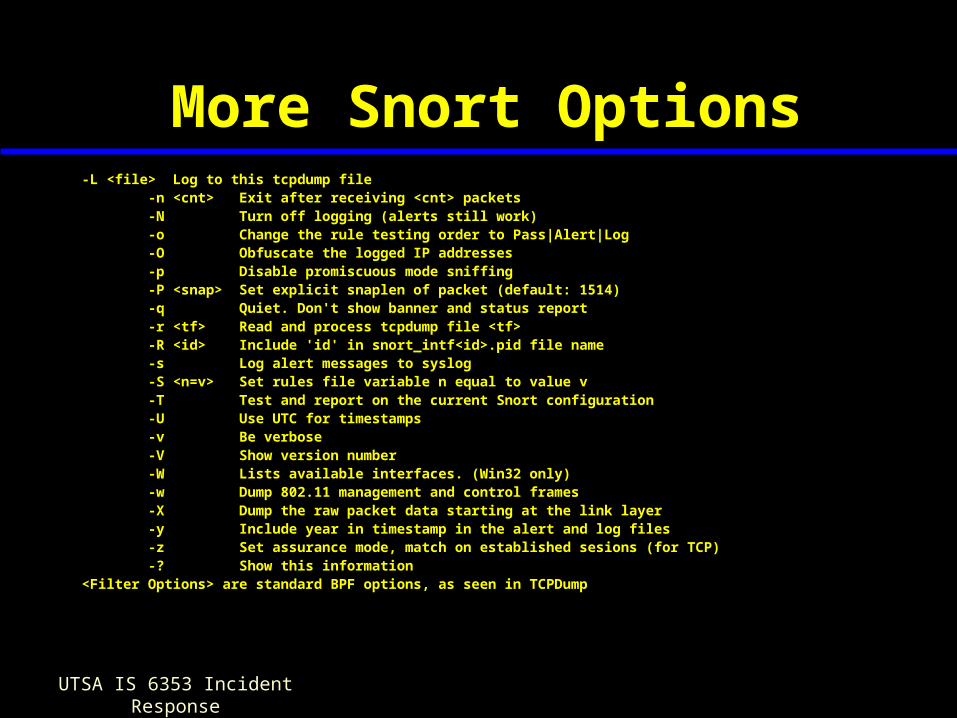
More Snort Options-L <file> Log to this tcpdump file -n <cnt> Exit after receiving <cnt> packets -N Turn off logging (alerts still work) -o Change the rule testing order to Pass|Alert|Log -O Obfuscate the logged IP addresses -p Disable promiscuous mode sniffing -P <snap> Set explicit snaplen of packet (default: 1514) -q Quiet. Don't show banner and status report -r <tf> Read and process tcpdump file <tf> -R <id> Include 'id' in snort_intf<id>.pid file name -s Log alert messages to syslog -S <n=v> Set rules file variable n equal to value v -T Test and report on the current Snort configuration -U Use UTC for timestamps -v Be verbose -V Show version number -W Lists available interfaces. (Win32 only) -w Dump 802.11 management and control frames -X Dump the raw packet data starting at the link layer -y Include year in timestamp in the alert and log files -z Set assurance mode, match on established sesions (for TCP) -? Show this information<Filter Options> are standard BPF options, as seen in TCPDump
UTSA IS 6353 Incident Response
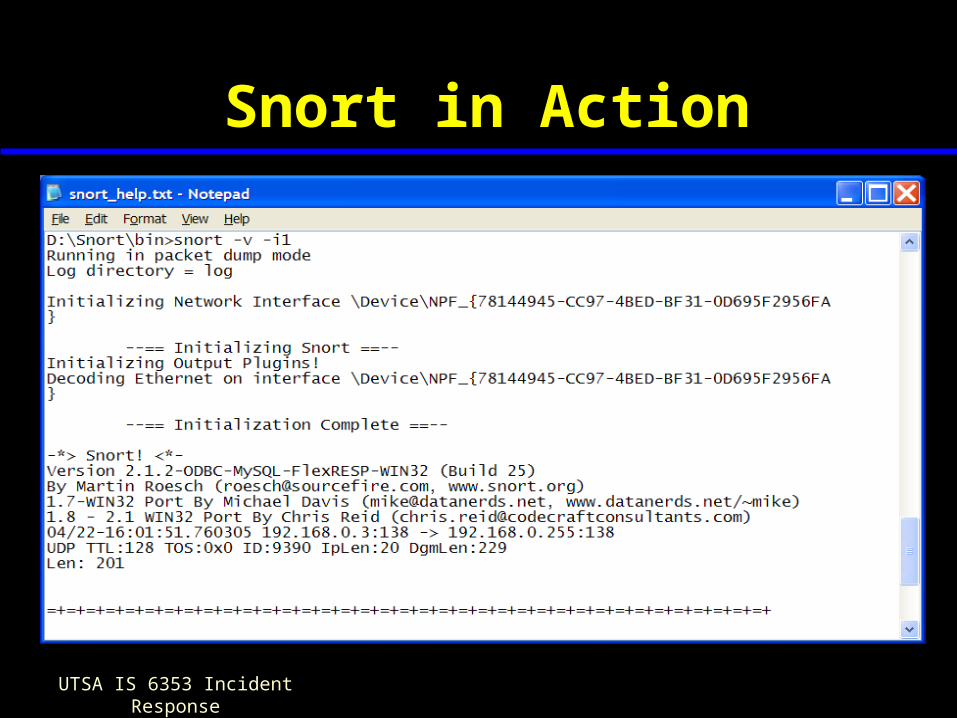
Snort in Action
UTSA IS 6353 Incident Response
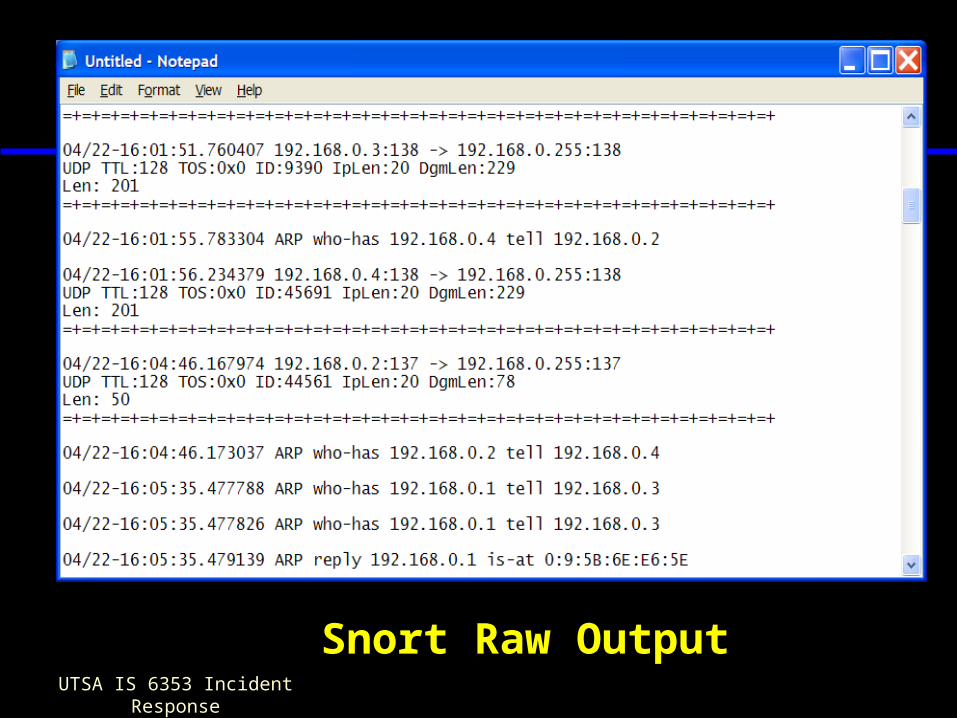
Snort Raw Output
UTSA IS 6353 Incident Response
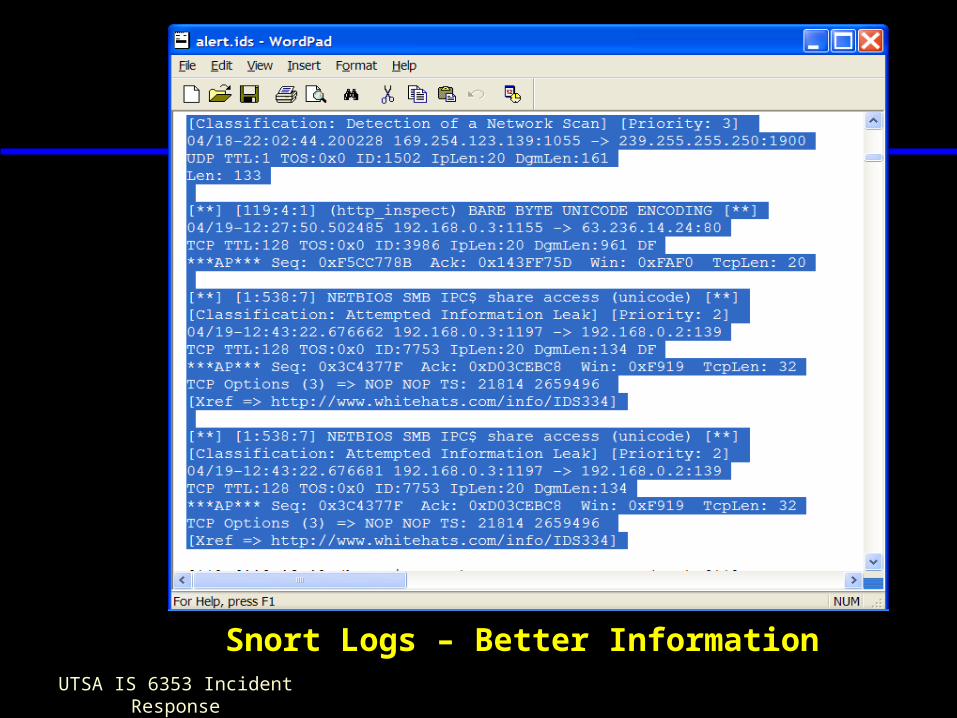
Snort Logs – Better Information
UTSA IS 6353 Incident Response
Observations of Snort - Good
• FREE!
• Large user base
• Community provides constant rule updates
• Free tools to provide log analysis and email/pager alerts
UTSA IS 6353 Incident Response
Observations of Snort - Bad
• UNIX tool ported to Windows; behaves like a UNIX tool– Difficult to configure
• Cryptic command line driven interface
• All configuration is driven by files
• Lacks standardized support
UTSA IS 6353 Incident Response
Lessons Learned - Snort
• You get what you pay for!
• Documentation for running Snort on XP is inconsistent and out of date.
• Since the solution comprises several free tools, each tool has separate issues with XP.
UTSA IS 6353 Incident Response
ACID

UTSA IS 6353 Incident Response
Overview
• Tool Description• Where You Can Find it• Applicability to Forensics• Tool Use/Screen Views• Observations• Lessons Learned
UTSA IS 6353 Incident Response
Technical Description
• What is ACID?– The Analysis Console for Intrusion Databases
(ACID)– PHP-based analysis engine to search and
process a database of security events generated by various IDSes, firewalls, and network monitoring tools.
UTSA IS 6353 Incident Response
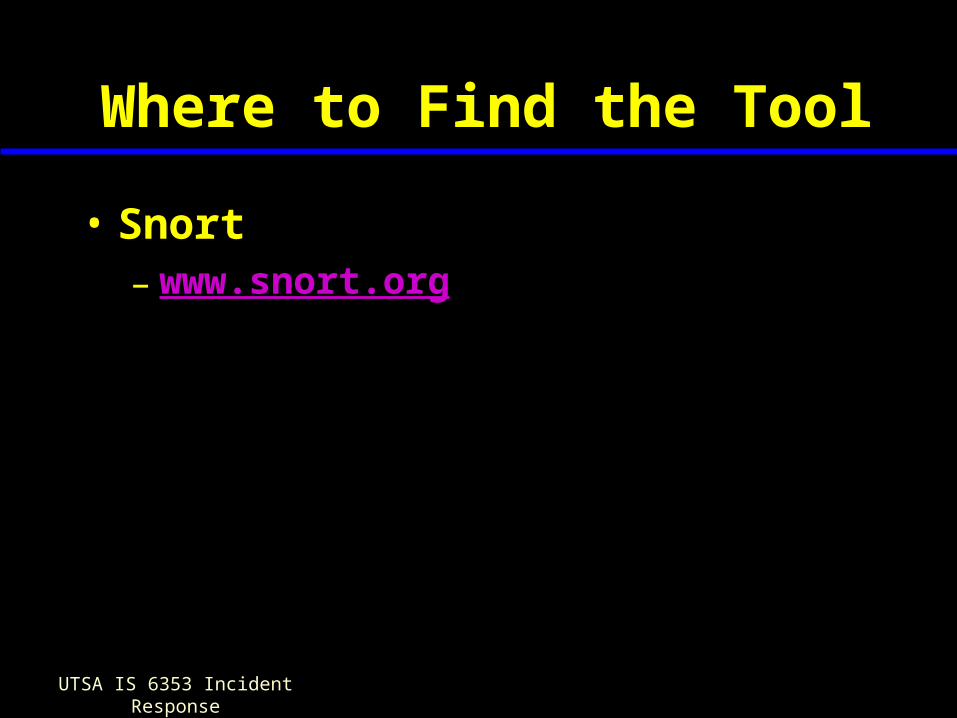
Where to Find the Tool
• ACID– http://acidlab.sourceforge.net/
UTSA IS 6353 Incident Response
How ACID Supports Forensics
• ACID helps to make sense of Snort data in a visual manner.
• Can help analyze trends and help filter out the noise by categorizing attacks and IP addresses.
• Query-builder and search interface.
• Can provide alerts when events occur.
UTSA IS 6353 Incident Response
ACID Usage
• Acid runs as a set of PHP web pages under IIS or Apache.
• Reports, alerts, and information is accessed through the web interface
UTSA IS 6353 Incident Response
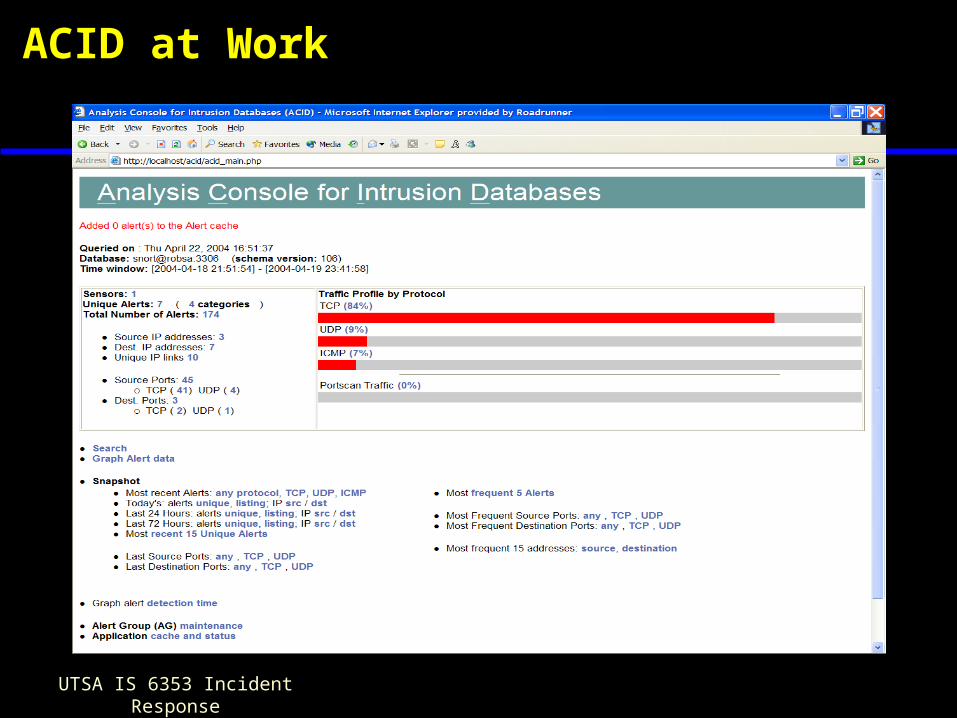
ACID at Work
UTSA IS 6353 Incident Response
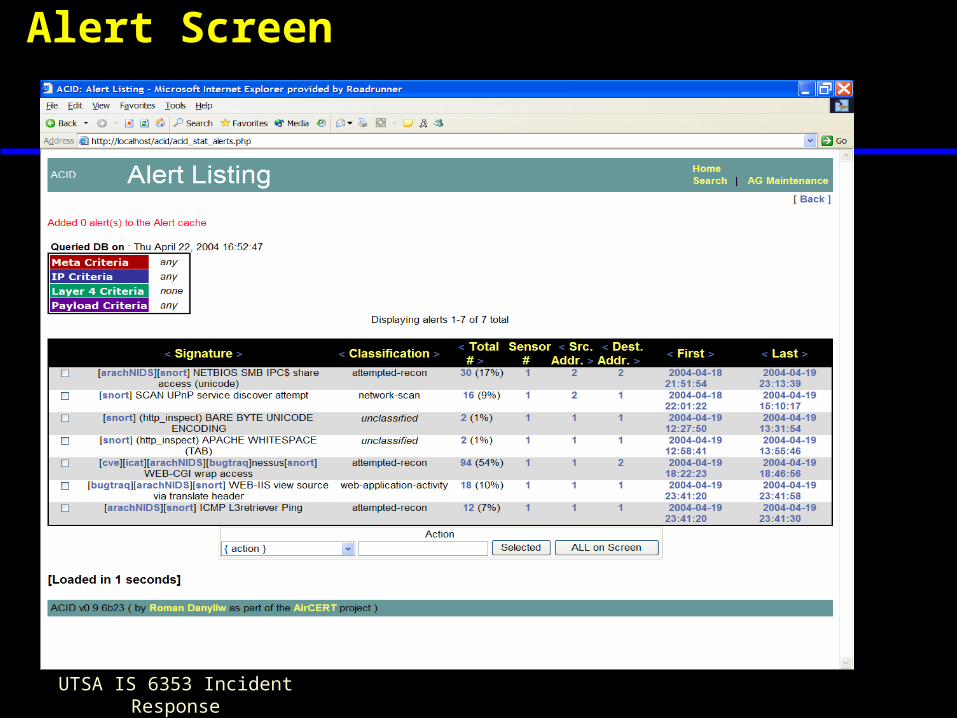
Alert Screen
UTSA IS 6353 Incident Response
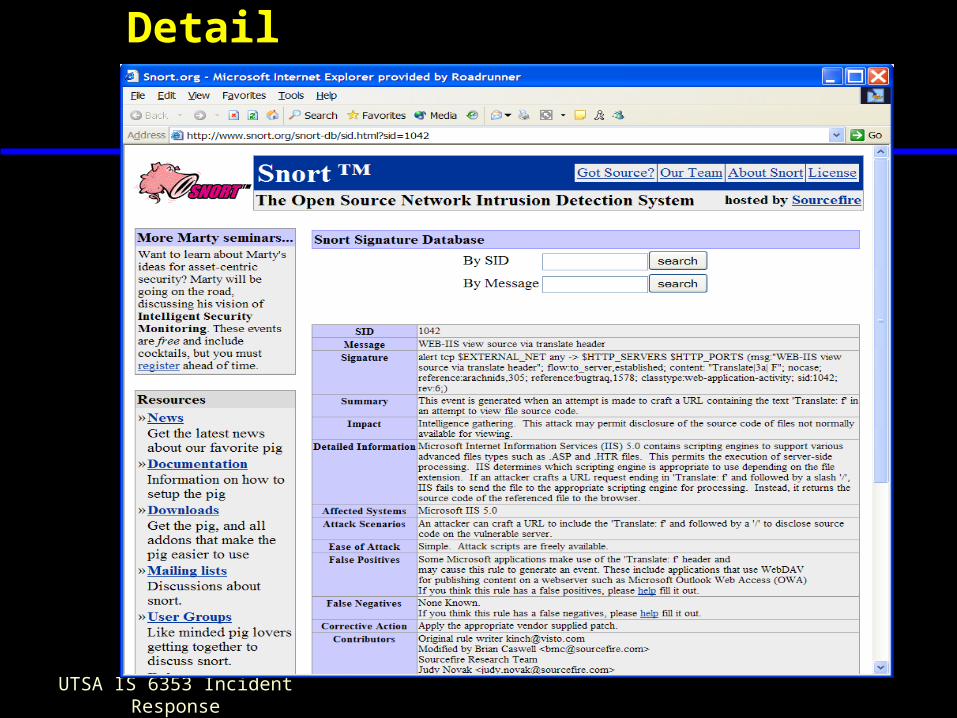
Alert Screen - Detail
UTSA IS 6353 Incident Response
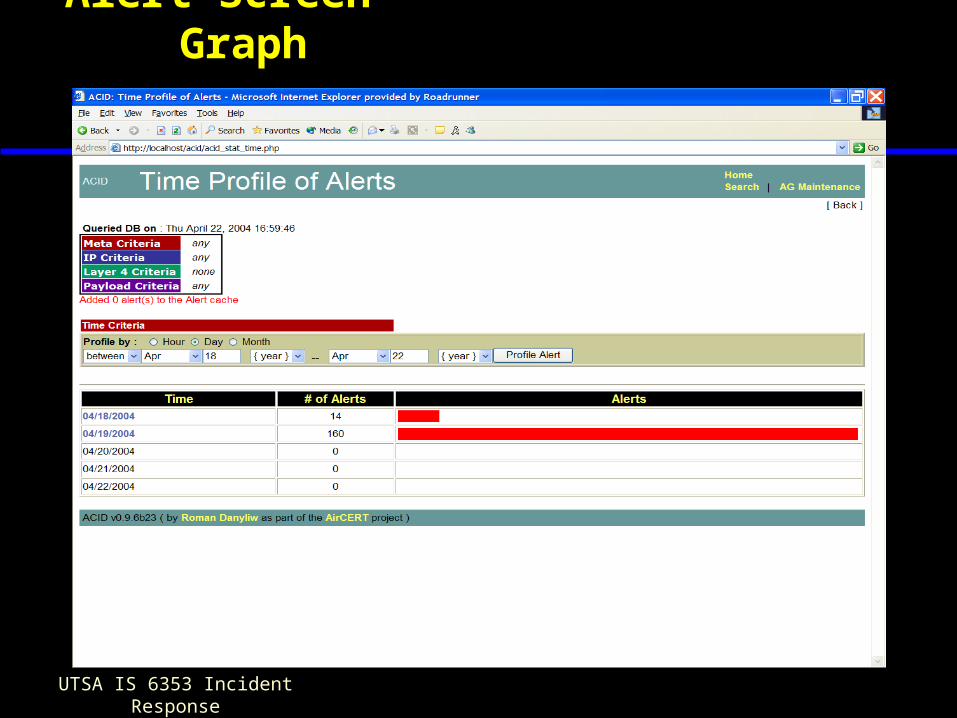
Alert Screen – Graph
UTSA IS 6353 Incident Response
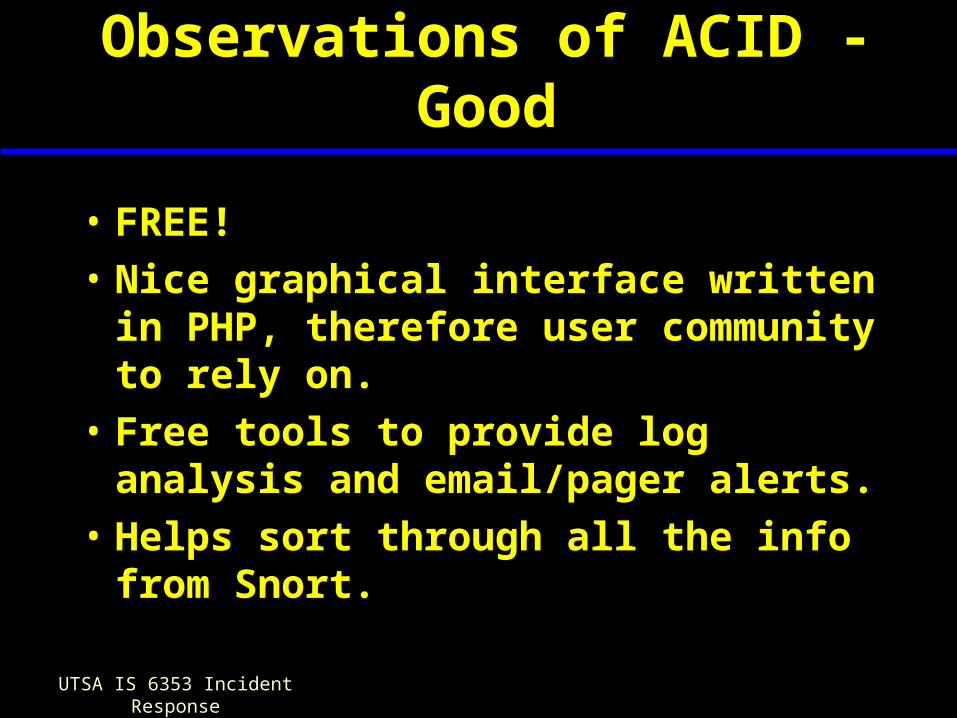
Observations of ACID - Good
• FREE!
• Nice graphical interface written in PHP, therefore user community to rely on.
• Free tools to provide log analysis and email/pager alerts.
• Helps sort through all the info from Snort.
UTSA IS 6353 Incident Response
Observations of ACID - ACID
• Lacks standardized support
• Lots of options to become familiar with
UTSA IS 6353 Incident Response
Lessons Learned – ACID
• You get what you pay for!• Configuration is file driven, no GUI.• Most documentation for running ACID
pertains to Apache servers and took some searching to run on IIS.
• Reliance on PHP means that any interesting aspects on running PHP on Windows had to be sorted through.
UTSA IS 6353 Incident Response
Summary
• Both Snort and ACID are excellent tools for Intrusion Detection.
• Open Source means (hopefully) constant improvements• Free tools for companies that cannot afford tools or
services provided by other companies.• Can be time frustrating to deal with and requires an
administrator with the time and expertise to master all the options and create a working system.