Snapshot of the D0 Computing and Operations Planning Process Amber Boehnlein For the D0 Computing...
22
Snapshot of the D0 Computing and Operations Planning Process Amber Boehnlein For the D0 Computing Planning Board
-
Upload
phillip-whitehead -
Category
Documents
-
view
218 -
download
1
Transcript of Snapshot of the D0 Computing and Operations Planning Process Amber Boehnlein For the D0 Computing...
Snapshot of the D0 Computing and Operations Planning Process
Amber Boehnlein
For the D0 Computing Planning Board
D0 CPB And Friends
• Lee Lueking and Chip Brock, Ruth & Wyatt & Vicky, Don & Jon & Bonnie
• Mike Diesburg, Iain Bertraim, Jae Yu, Heidi• Harry Melanson, Serban Protopopescu, Qizhong
Li, Dugan O’Neil• Alan Jonckheere • Stu Fuess• Dane Skow, Dave Fagan• Nick Hadley, Jianming Qian, ASB
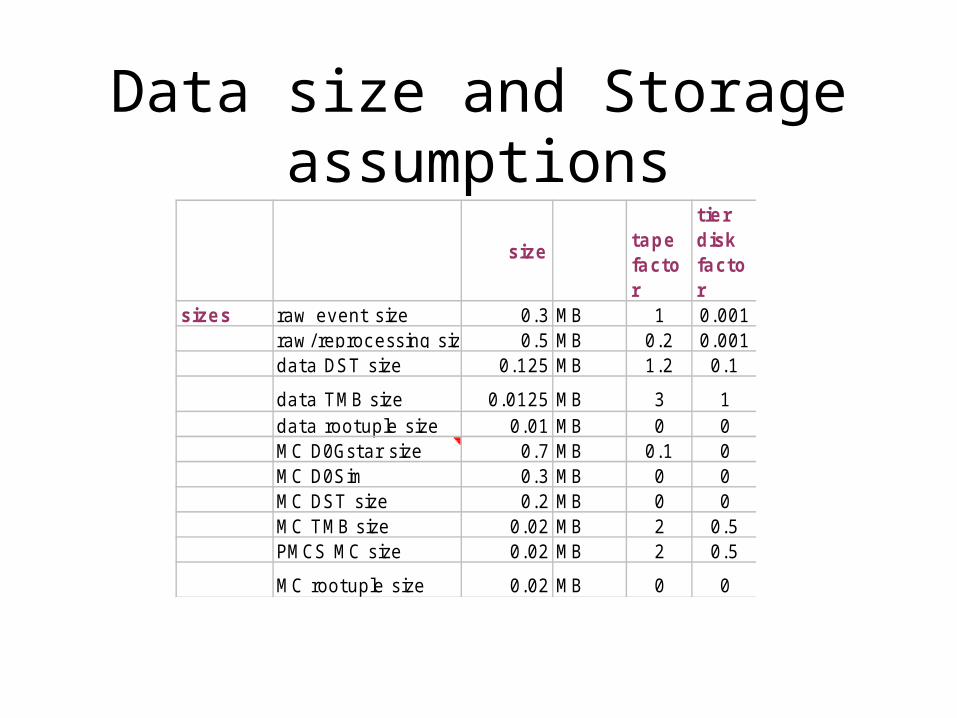
Data size and Storage assumptions
sizetape factor
tier disk factor
sizes raw event size 0.3 MB 1 0.001raw/ reprocessing size 0.5 MB 0.2 0.001data DST size 0.125 MB 1.2 0.1
data TMB size 0.0125 MB 3 1data rootuple size 0.01 MB 0 0MC D0Gstar size 0.7 MB 0.1 0MC D0Sim 0.3 MB 0 0MC DST size 0.2 MB 0 0MC TMB size 0.02 MB 2 0.5PMCS MC size 0.02 MB 2 0.5
MC rootuple size 0.02 MB 0 0
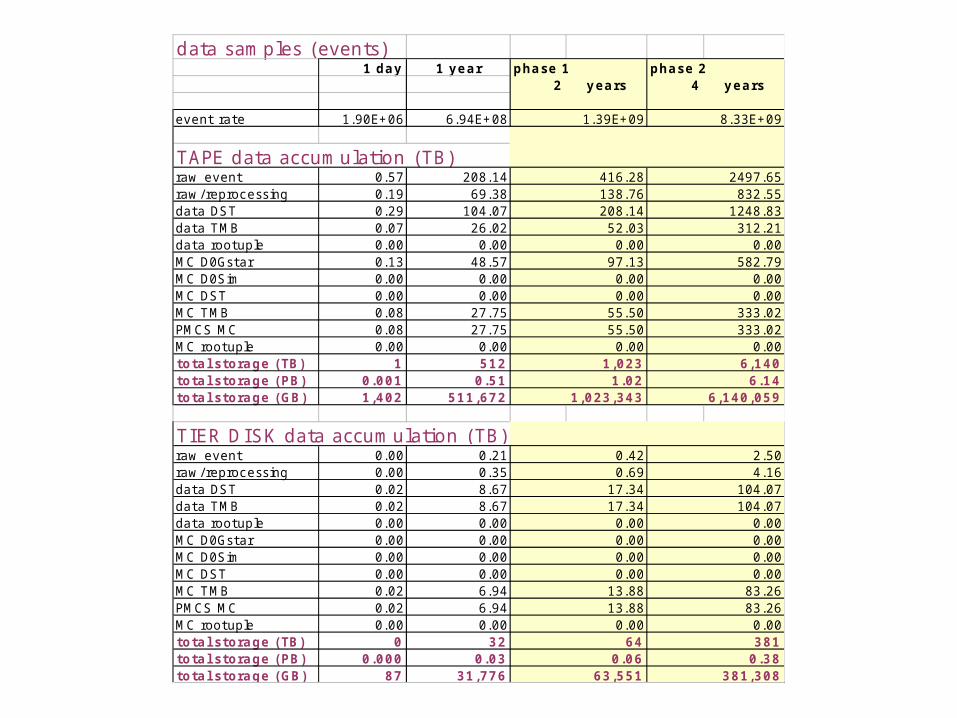
data samples (events)1 day 1 year phase 1 phase 2
2 years 4 years
event rate 1.90E+06 6.94E+08 1.39E+09 8.33E+09
TAPE data accumulation (TB)raw event 0.57 208.14 416.28 2497.65raw/ reprocessing 0.19 69.38 138.76 832.55data DST 0.29 104.07 208.14 1248.83data TMB 0.07 26.02 52.03 312.21data rootuple 0.00 0.00 0.00 0.00MC D0Gstar 0.13 48.57 97.13 582.79MC D0Sim 0.00 0.00 0.00 0.00MC DST 0.00 0.00 0.00 0.00MC TMB 0.08 27.75 55.50 333.02PMCS MC 0.08 27.75 55.50 333.02MC rootuple 0.00 0.00 0.00 0.00total storage (TB) 1 512 1,023 6,140total storage (PB) 0.001 0.51 1.02 6.14total storage (GB) 1,402 511,672 1,023,343 6,140,059
TIER DISK data accumulation (TB)raw event 0.00 0.21 0.42 2.50raw/ reprocessing 0.00 0.35 0.69 4.16data DST 0.02 8.67 17.34 104.07data TMB 0.02 8.67 17.34 104.07data rootuple 0.00 0.00 0.00 0.00MC D0Gstar 0.00 0.00 0.00 0.00MC D0Sim 0.00 0.00 0.00 0.00MC DST 0.00 0.00 0.00 0.00MC TMB 0.02 6.94 13.88 83.26PMCS MC 0.02 6.94 13.88 83.26MC rootuple 0.00 0.00 0.00 0.00total storage (TB) 0 32 64 381total storage (PB) 0.000 0.03 0.06 0.38total storage (GB) 87 31,776 63,551 381,308

D0 Institution Contributions
• All Monte Carlo production takes place offsite at Remote Centers
• Expect some analysis to occur remotely• Investigating compute intensive operations in
addition to MC generation for remote centers• CLueD0 desktop cluster, administered by D0
collaboration members, contributions by institutions• Institutions can provide project disk on D0mino• Anticipated that institutions will contribute to CLuBs,
the CLueD0 back end

Access and Analysis patterns
• Current Access and Analysis patterns– Much primary analysis done on high level data
tier—currently reco based root tuple– Physics group coordinated efforts to generate
• Derived data sets by skimming through root tuple or reco output
• Picked event samples of raw data for re-reco studies
• Specialized reprocessing of small data sets
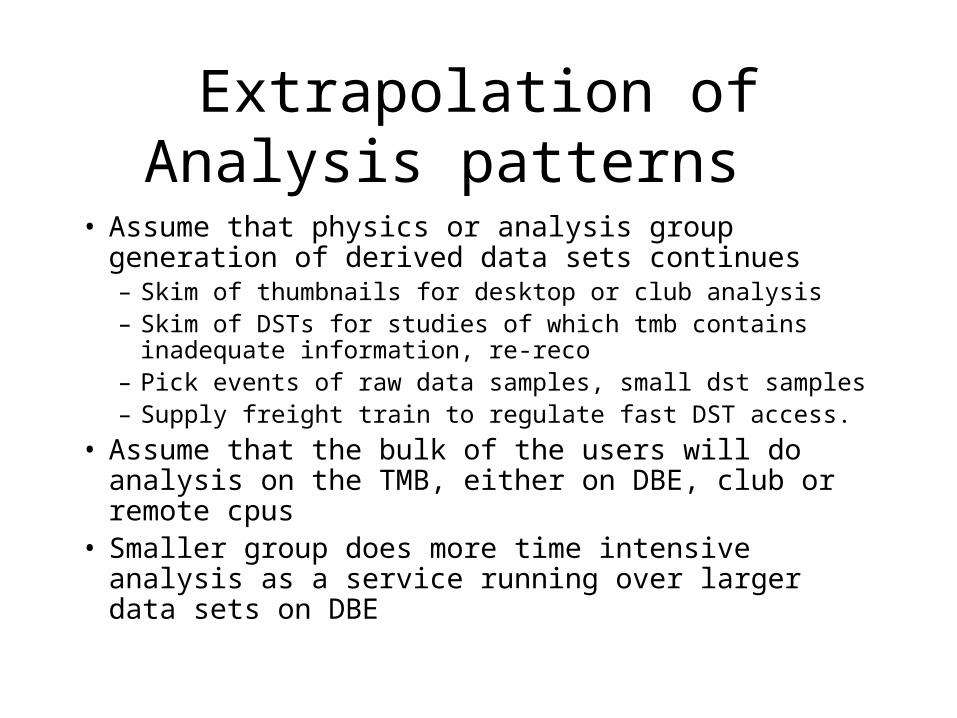
Extrapolation of Analysis patterns
• Assume that physics or analysis group generation of derived data sets continues– Skim of thumbnails for desktop or club analysis – Skim of DSTs for studies of which tmb contains inadequate
information, re-reco– Pick events of raw data samples, small dst samples– Supply freight train to regulate fast DST access.
• Assume that the bulk of the users will do analysis on the TMB, either on DBE, club or remote cpus
• Smaller group does more time intensive analysis as a service running over larger data sets on DBE

• Currently difficult to estimate analysis cpu usage– Assume generation of derived sets is relatively
quick/per event, but happens often– Most DST access implies time intensive operations.
Estimate it is at least the order of farm processing • Would support 3 simultaneous users, ¼ farm processing time
in 3 months each on 1/3 data, for initial data set.
– Reco time per event is expected to increase dramatically as a number of multiple interactions
– Make overall estimate of 75 seconds/event (500 MHz) for reco and analysis and re-reco—collaboration to weigh relative balance available in 2005, staged in.
– Institutions can contribute CPU to CLuBs, assume FNAL contribution of $50K yearly
– Remote center reprocessing, or dst level reprocessing is under evalution.

Farm Processing75 CPU SpecI2000
70% 3GHz 96010% 4GHz 128050% 6GHz 1920
3,000 9GHz 288025,000 14GHz 4480
20GHz 6400
ExecutionTime No. Nodes Cost No. Nodes Cost No. Nodes Cost No. Nodes Cost
30 72 241,000 108 349,000 180 590,000 360 1,180,000 75 180 590,000 271 888,000 452 1,481,000 903 2,959,000
100 241 798,000 361 1,183,000 602 1,981,000 1204 3,962,000
51431285717143
Cost/node:I/O Cost/100 nodes
Beginning of Run500MHz CPUs at
FY05 Target Spending Fraction:
Average Rate:Farm Efficiency:Misc. Processing:Reprocessing:
TotalTarget
20%FY03, 3GHz Nodes
30% 50%FY04, 4GHz Nodes FY05, 6GHz Nodes
Farm processing capacity in Summer ’02 ~50Hz
D0mino backend16 node, 1 GHz 80 nodes, 2 GHz, summer ‘02

Roles of D0mino• D0mino provided a centralized, stable and uniform
work environment– Interactive and batch services for on and offsite users
• High I/O provided by 8 Gigabit ethernet connections—The Central Analysis SAM station– Interactive– To/from robotic storage– To/from secondary analysis systems– To/from the backend
• Access to project disks and disk cache (30 TB)• Analysis CPU provided by Linux backend nodes

Upgrading D0mino• Replacing D0mino requires identifying which parts of the
design can be better served by more cost effective solutions– Linux back end to supply compute power for access to large data
samples– Seeding CLuBs (the Clued0 backend) as solution for
intermediate (1TB) samples – Continue to evaluate I/O performance
• Upgrading D0mino (O3000) would cost about $2M, and would have to be phased in. To stay within nominal guidance, would cut analysis/farm capacity by about ½
• Fortunately, SAM gives D0 a lot of flexibility.

Backup facility
• Two primary consumers– Project disk archive– User driven backups of small samples
• Clearly a need, but not clear how best to accomplish.

Phase 1, Robotic Storage Plan
• D0 has 1 STK silo with 9 9940 drives– Writing raw data and Reco output to mezzosilo1
• We have an option on a second silo• AML2 with 6 LTO drives
– Writing MC data– Plan to start writing Reco output as a test on May 7– If test is successful
• Will purchase more LTO Drives and a few more 9940x
– Else• Will purchase as many 9940x as is feasible
– Likely need to purchase a few more drives of each type to get us to decision point.

• The overall estimated need for Robotic storage for phase 1 can be accommodated by the Mezzosilo1&2 and the AML2 even with the current generation of drives/media.
Current Capacity approx 2*300 TB + 750 TB– compare to roughly 1 PB needed.
Or The overall estimated need for Robotic storage for
phase 1 can be accommodated by Mezzosilos 1&2 with 9940bs
Assume the purchase of Mezzosilo 2 in 2003Assume purchase of Drives for Mezzosilo 2 in 2003Assume additional purchase of drives in 2004

Drive Estimates• Support Online operations plus buffer drain
– 3 10mbyte/sec drives• Support Farm operations
– 3 10 mbyte/sec drives• Support incoming MC
– 2 drives• Support Central analysis
– Freight train for spooling through the DST sample in short interval (3 months) would consume 8 drives
– MC and other – Pick events could consume infinite number of drives
• Buy LTO and STK in 2002—distribution to vary• 20 drives for new Mezzosilo• 2004 expect to add drives

Fixed Infrastructure Costs• Database
– machines– Database disks and controllers (assumed cost 10X cots)– DB Mirrors– Software
• Networking– Expand links between buildings, FCC– Additional switchs for DAB, farms– D0 to FCC upgrade to 10 Gb backbone upgrade ‘06 – Rewiring D0 for Gb to desktop in ’07
• Linux build machines and disk• Additional SAM servers

Disk Estimates
• Aim for sufficient cache, TMB storage on D0mino– All 2002 D0mino project disk additions
supplied by the Institutions– Assume that model continues for project space– Supply additional 18 TB cache per year
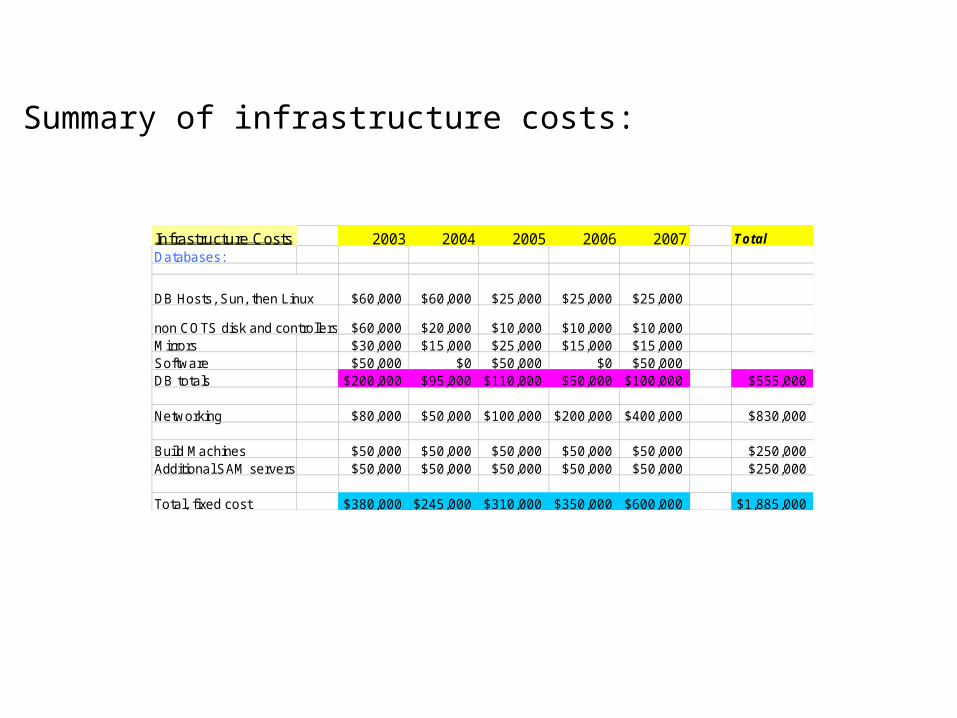
Infrastructure Costs 2003 2004 2005 2006 2007 TotalDatabases:
DB Hosts, Sun, then Linux $60,000 $60,000 $25,000 $25,000 $25,000
non COTS disk and controllers $60,000 $20,000 $10,000 $10,000 $10,000Mirrors $30,000 $15,000 $25,000 $15,000 $15,000Software $50,000 $0 $50,000 $0 $50,000DB totals $200,000 $95,000 $110,000 $50,000 $100,000 $555,000
Networking $80,000 $50,000 $100,000 $200,000 $400,000 $830,000
Build Machines $50,000 $50,000 $50,000 $50,000 $50,000 $250,000Additional SAM servers $50,000 $50,000 $50,000 $50,000 $50,000 $250,000
Total, fixed cost $380,000 $245,000 $310,000 $350,000 $600,000 $1,885,000
Summary of infrastructure costs:

Rate assumptionsrates average event rate 22 Hz
raw data rate 22.5 MB/sGeant MC rate 11 Hz
rate increase assumptionsrate factor 3
phase_1 2
phase_2 4last year 2009total years 6down year 2005
Average rate assumes an accelerator and experimentDuty factor applied to a peak rate of 50 Hz

Full Cost Estimate, No I/O replacement
Extremely preliminary D0 C&S cost estimate2002 2003 2004 2005 2006 2007 Total(2003-2007)
Fixed Infrastructure Costs $400,000 $380,000 $245,000 $310,000 $350,000 $600,000 $1,885,000farm + analysis cpu $800,000 $640,000 $938,000 $1,531,000 $500,000 $500,000 $4,109,000disk cache $0 $150,000 $100,000 $50,000 $150,000 $150,000 $600,000robotic storage $400,000 $150,000 $0 $150,000 $150,000 $150,000 $600,000tape drives $200,000 $600,000 $300,000 $300,000 $600,000 $600,000 $2,400,000D0mino upgrade $150,000 $0 $0 $0Backup facility $350,000
Sum $1,950,000 $2,270,000 $1,583,000 $2,341,000 $1,750,000 $2,000,000 $9,944,000
Questions to D0
• Is it possible to make a better estimate of analysis CPU needs?
• Role of D0mino
• Relative weighting of tmb and DST analysis—better to have a larger tmb as trade off for less DST usage?
• Role of remote centers
Questions to CD
• How should we cost mover nodes?
• Relative role of disk vs robotic storage as time goes on
• Where will we put the phase 2 robots?
• Interaction between networking and remote centers
• Suggestions for backup facility