Snapshot of America’s Children 2015 AAPD Pediatric Oral Health Research and Policy Center.
46
Snapshot of America’s Children 2015 AAPD Pediatric Oral Health Research and Policy Center
-
Upload
sybil-joseph -
Category
Documents
-
view
214 -
download
0
Transcript of Snapshot of America’s Children 2015 AAPD Pediatric Oral Health Research and Policy Center.

Snapshot of America’s Children2015
AAPD Pediatric Oral Health Research and Policy Center

1. What is the state of overall health and well-being for children in the United States?
2. What is the state of oral health for children in the United States?
Topics
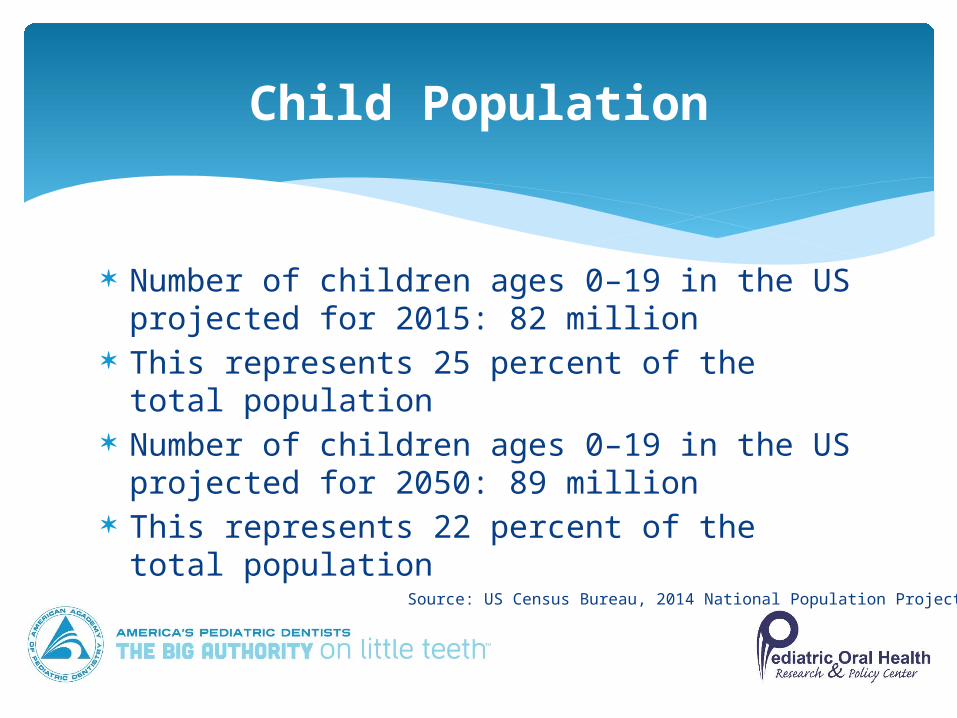
Number of children ages 0–19 in the US projected for 2015: 82 million
This represents 25 percent of the total population
Number of children ages 0–19 in the US projected for 2050: 89 million
This represents 22 percent of the total population
Child Population
Source: US Census Bureau, 2014 National Population Projections

Children Ages 0–17 by Race and Hispanic Origin, 2013White, non-Hispanic 52.4% Hispanic 24.1%Black, non-Hispanic 13.8% Asian 4.6%Two or more races 4.0%American Indian or Alaska Native 0.9%Native Hawaiian Other Pacific Islander 0.2%
Child Demographics
Source: America’s Children: Key National Indicators of Well-Being, 2014, www.childstats.gov
Economic Standing Education and Language Family and Community Child Maltreatment Health Issues
Indicators of Well-Being

Children ages 0 – 17 living in poverty 22%
Children ages 0 – 17 in householdsclassified by USDA as “food insecure” 22%
Households with children ages 0–17 reporting shelter cost burden, crowding, and/or physically inadequate housing 46%
Economic Standing
Source: America’s Children: Key National Indicators of Well-Being, 2014, www.childstats.gov

About 22 percent of children live in households that are food insecure
Federal Programs: SNAP: USDA's Supplemental Nutrition Assistance Program
serves 36.5 million people USDA's National School Lunch program serves 31 million children Special Supplemental Nutrition Program for Women, Infants and
Children, or WIC serves nearly half of all infants
Food Insecurity

Economic Standing
Source: The Annie E. Casey Foundation, Kids Count Data Book, 2014, www.aecf.org
These figures include the cash income available to families, without accounting for many safety net supports that a family might receive:
Federal tax credits Child care and housing vouchers Food aid through the Supplemental Nutrition Assistance
ProgramDoes not reflect the ways in which costs—like housing and child care—vary from region to region
Economic Standing
Source: America’s Children: Key National Indicators of Well-Being, 2014, www.childstats.gov

Education
Source: The Annie E. Casey Foundation, Kids Count Data Book, 2014, www.aecf.org

Children ages 5 – 17 who speak a language other than English at home 22%
Children ages 5 – 17 who speak a language other than English at home and who have difficulty speaking English 5%
Children ages 3 – 5 who were read to 3 or more times in the last week 83%
Education
Source: America’s Children: Key National Indicators of Well-Being, 2014, www.childstats.gov

Average reading scale score of 4th-graders (0 – 500 scale) 222
Average reading scale score of 8th-graders (0 – 500 scale) 268
Young adults ages 18 – 24 who have completed high school 91%
Education
Source: America’s Children: Key National Indicators of Well-Being, 2014, www.childstats.gov

Family and Community
Source: The Annie E. Casey Foundation, Kids Count Data Book, 2014, www.aecf.org

Family and Community
Children ages 4 – 11 with detectable blood cotinine level, a measure for recent exposure to secondhand smoke 40%
Serious violent crime victimization of youth ages 12 – 17 6 per 1,000
Youth offenders ages 12 – 17 involved in serious crimes 9 per 1,000
Source: America’s Children: Key National Indicators of Well-Being, 2014, www.childstats.gov

Child Maltreatment
15Source: The Annie E. Casey Foundation, Kids Count Data Book, 2014, www.aecf.org

Child Maltreatment
Source: The Annie E. Casey Foundation, Kids Count Data Book, 2014, www.aecf.org

Health
Source: The Annie E. Casey Foundation, Kids Count Data Book, 2014, www.aecf.org

Health
Injury deaths ages 1 – 4 11 per 100,000
Injury deaths ages 5 – 14 6 per 100,000
Injury deaths ages 15 – 19 36 per 100,000
Source: America’s Children: Key National Indicators of Well-Being, 2014, www.childstats.gov

Health
Source: America’s Children: Key National Indicators of Well-Being, 2014, www.childstats.gov
0.00%
5.00%
10.00%
15.00%
20.00%
25.00%
30.00%
8th Grade12th Grade

Health
Children ages 19 – 35 months with full immunizations 76%
Children ages 6 – 17 who are obese 19%
High school students who reported ever having had sexual intercourse 47%
Source: America’s Children: Key National Indicators of Well-Being, 2014, www.childstats.gov

Kids Count Indicators of Child Well-being
Source: The Annie E. Casey Foundation, Kids Count Data Book, 2014, www.aecf.org
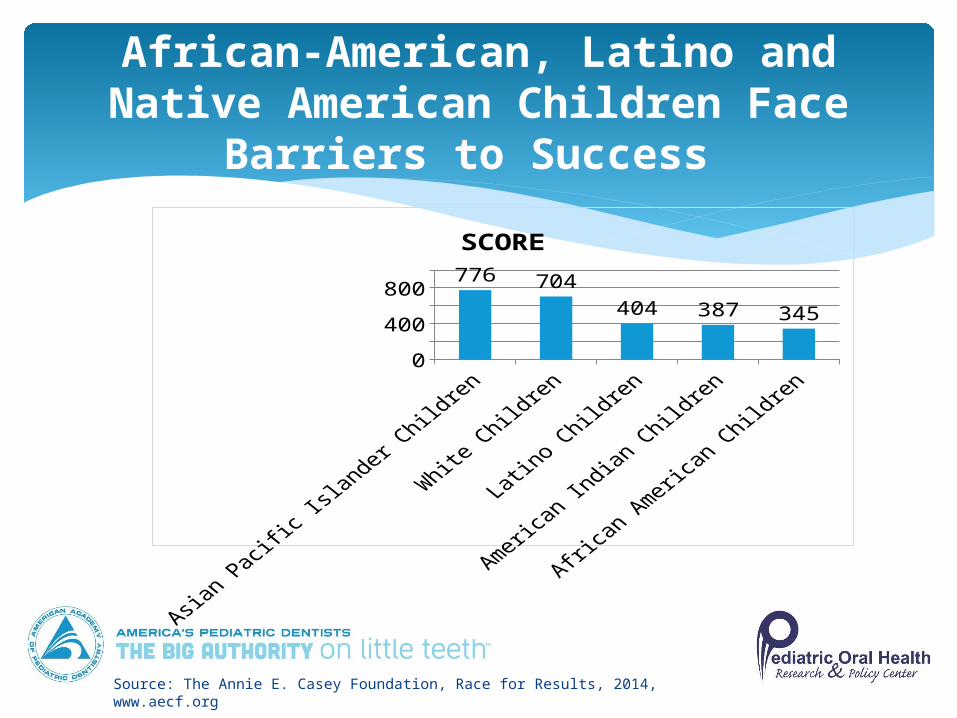
African-American, Latino and Native American Children Face
Barriers to Success
0300600900 776 704
404 387 345
SCORE
Source: The Annie E. Casey Foundation, Race for Results, 2014, www.aecf.org

State Ranking by Kids Count
States ranked 1 - 13
States ranked 14 - 25
States ranked 26 - 37
States ranked 38 - 50
Source: The Annie E. Casey Foundation, Kids Count Data Book, 2014, www.aecf.org

Private Public Uninsured
Children under age 4 43% 49% 8%Children ages 4 – 6 50 44 6Children ages 7 – 12 52 41 7Children ages 13 – 17 55 35 11Children under age 18 50 42 8
Health Insurance by Age
Source: Agency for Healthcare Research and Quality, Medical Expenditure Panel Survey, 2015, www.meps.ahrq.gov/mepsweb

Private Public Uninsured
White, non-Hispanic 71 15 14Black, non-Hispanic 44 35 22Hispanic or Latino 35 33 32Asian/Pacific Islander 72 13 15Total other races 54 32 14
Health Insurance by Race/Ethnicity
Source: Agency for Healthcare Research and Quality, Medical Expenditure Panel Survey, 2015, www.meps.ahrq.gov/mepsweb

Uninsured
Below 100% of poverty level 15%100 – 200% of poverty level 14%200 – 250% of poverty level 11%250% of poverty level or above 5%
Health Insurance by Income Level
Source: US Census Bureau, American Community Survey, 2011

Appointment Respect
White, non-Hispanic 81% 82%Hispanic or Latino 68 75Black, non-Hispanic 77 82Other races/multiple races 70 76
Getting Health Care for Children
Source: Agency for Healthcare Research and Quality, Medical Expenditure Panel Survey, 2015, www.meps.ahrq.gov/mepsweb

Appointment Respect
Private insurance 79% 82%Public insurance 73 77Uninsured 73 85
Getting Health Care for Children
Source: Agency for Healthcare Research and Quality, Medical Expenditure Panel Survey, 2015, www.meps.ahrq.gov/mepsweb

Appointment Respect
Poor 73% 75%Near poor 75 78Low income 75 81Middle income 77 80High income 80 84
Getting Health Care for Children
Source: Agency for Healthcare Research and Quality, Medical Expenditure Panel Survey, 2015, www.meps.ahrq.gov/mepsweb
Dental Health

1997 2005 2012
Children ages 2 - 4 45% 48% 57%Children ages 5 – 11 81 84 89Children ages 12 – 17 77 82 87
Dental Visits by Age
Source: America’s Children: Key National Indicators of Well-Being, 2014, www.childstats.gov

Dental Visits by Insurance
Source: America’s Children: Key National Indicators of Well-Being, 2014, www.childstats.gov

Dental Visits by Income Level
Source: America’s Children: Key National Indicators of Well-Being, 2014, www.childstats.gov

Dental Visits by Race/Ethnicity
Source: America’s Children: Key National Indicators of Well-Being, 2014, www.childstats.gov

Dental Visits by Race/Ethnicity
Source: America’s Children: Key National Indicators of Well-Being, 2014, www.childstats.gov

Source: CMS, Use of Dental Services in Medicaid and CHIP, 2011
Varies: 23% - 62%

Prevalence of dental caries in permanent teeth, by age and race among adolescents
aged 12–19 years, 2011–2012
Source: Data Brief No 191, National Center for Health Statistics, 2015.

Dental Caries by Income Level
Source: America’s Children: Key National Indicators of Well-Being, 2014, www.childstats.gov

Dental Caries by Race/Ethnicity
Source: America’s Children: Key National Indicators of Well-Being, 2014, www.childstats.gov

Lowest percentage of 3rd graders with caries experience: CT: 41%
Highest percentage of 3rd graders with caries experience: ID: 67%
Lowest percentage of 3rd graders with untreated tooth decay:NH:12%
Highest percentage of 3rd graders with untreated tooth decay: TX: 43%
Lowest percentage of 3rd graders with dental sealants: SC: 24%
Highest percentage of 3rd graders with dental sealants: VT: 66%
National Oral Health Surveillance System
Source: CDC National Oral Health Surveillance System: School years ranged from 1999 – 2011, www.CDC.gov/nohss

Parents Reporting Inability to Get Dental Care
0 - 4 years 5 - 11 years
12 - 17 years
all under 18
02468
101214161820
2.33.6 4.4 3.5
2007
2008
2009
2010
Source: www.healthindicators.gov, accessed 6/5/15

Age group Percentage of untreated caries
Percentage of parents reporting inability to get care
Age 2-5 years 10.0%
Age 0-4 years 2.3%
Age 6-8 years 20.1%
Age 9-11 years 7.9%
Age 5-11 years 3.6%
Ages 12-15 years 11.9%
Ages 16-19 years 19.1
Ages 12-17 years 3.5%
Average 13.8% 3.1%
Caries and Inability to Get Care

Children Offered Advice from Healthcare Provider about Need for Dental Visit
Children ages 2 – 17 52%Children ages 2 – 5 57 Children ages 6 – 12 54 Children ages 13 – 17 46
Oral Health in Primary Care
43
Source: Agency for Healthcare Research and Quality, Household Component of the Medical Expenditure Panel Survey, Statistical Brief #432, March 2014
Many parents do not follow good dental practices when it comes to their children because they do not understand how to evaluate their child’s oral health or they do not understand the importance of their child’s oral health
Parents can be poor judges of their children’s oral health, especially when the children are very young and among families with low incomes, low education levels or no dental insurance
More than 9 in 10 parents fail to correctly identify tooth decay as the most common chronic disease among children
Parent Knowledge
44
Source: AAPD State of Little Teeth Report, 2014, aapd.org

Nearly 8 in 10 parents say they engage in practices they acknowledge are bad for their children’s teeth
While 60 percent of parents agree that children should see the dentist by their first birthday, only 25 percent actually brought their infants to the dentist
More than 7 in 10 parents agree that juice is not a healthy drink for their kids’ teeth, but 3 in 10 frequently serve juice to their children
85 percent of parents agree it is not okay to put children to bed with a bottle of milk or juice, but 20 percent do anyway
Parent Action
45
Source: AAPD State of Little Teeth Report, 2014, aapd.org
Snapshot of America’s Children2015
AAPD Pediatric Oral Health Research and Policy Center