
Snake River Plain Model Upgrade Base Case Scenario Donna M. Cosgrove Idaho Water Resources Research...
44
Snake River Plain Snake River Plain Model Upgrade Model Upgrade Base Case Scenario Base Case Scenario Donna M. Cosgrove Donna M. Cosgrove Idaho Water Resources Research Idaho Water Resources Research Institute Institute University of Idaho University of Idaho
-
Upload
louisa-richardson -
Category
Documents
-
view
214 -
download
0
Transcript of Snake River Plain Model Upgrade Base Case Scenario Donna M. Cosgrove Idaho Water Resources Research...

Snake River PlainSnake River PlainModel UpgradeModel Upgrade
Base Case ScenarioBase Case Scenario
Donna M. CosgroveDonna M. CosgroveIdaho Water Resources Research Idaho Water Resources Research
InstituteInstituteUniversity of IdahoUniversity of Idaho
Fellow ContributorsFellow Contributors
• Bryce ContorBryce Contor• Gary JohnsonGary Johnson• Allan WylieAllan Wylie• Nathan RinehartNathan Rinehart• Technical Direction and Oversight Technical Direction and Oversight
– IDWRIDWR– Eastern Snake Hydrologic Modeling Eastern Snake Hydrologic Modeling
CommitteeCommittee
OverviewOverview
• Executive Summary Executive Summary
• Snake Plain Model Re-capSnake Plain Model Re-cap
• Definition of Base Case ScenarioDefinition of Base Case Scenario
• How Base Case Scenario was How Base Case Scenario was calculatedcalculated
• Results of Base Case ScenarioResults of Base Case Scenario
• Effects of droughtEffects of drought
Executive SummaryExecutive Summary
• Snake Plain water use mostly in Snake Plain water use mostly in balance over long periodbalance over long period
• High degree of natural variability in High degree of natural variability in water supplywater supply
• Will continue to experience weather-Will continue to experience weather-induced declines induced declines

Snake Plain Model Re-capSnake Plain Model Re-cap
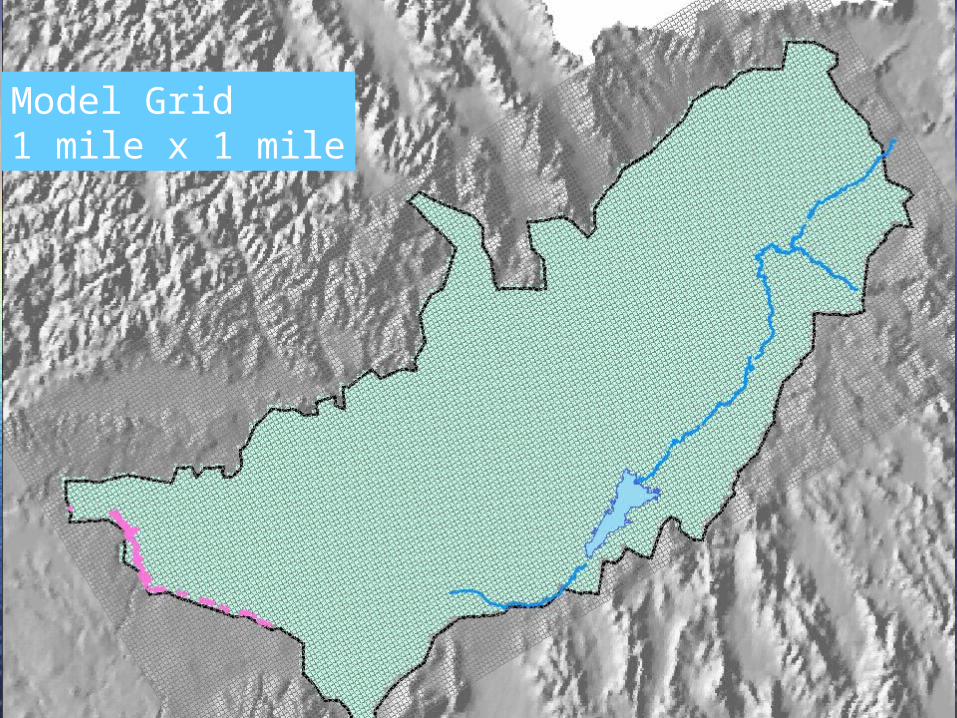
Model Grid1 mile x 1 mile

"
"
"
Pocatello
Twin Falls
Idaho Falls
Eastern Snake Plain Aquifer Model
Modeled River
" cities
steady state wells
River Reaches
Ashton - Rexburg
Heise - Shelly
Shelly - Blackfoot
Blackfoot - Neeley
Neeley - Minidoka
Spring Reaches
Devils Washbowl - Buhl
Buhl - Thousand Springs
Thousand Springs
Thousand Springs - Malad
Malad
Malad - Bancroft
11 InterconnectedRiver and Drain Reaches
• Representative Barraclough had Representative Barraclough had suggested that we compare model suggested that we compare model outputs with historical, measured outputs with historical, measured datadata

Model’s Ability to Match Model’s Ability to Match Historical Measured DataHistorical Measured Data

Matching of Measured DataMatching of Measured Data
• To test model, we compared model To test model, we compared model output with values measured over a output with values measured over a 17-year period17-year period– 10,000 measured aquifer water levels 10,000 measured aquifer water levels
over the 17-year periodover the 17-year period– 725 measured river reach gains in six 725 measured river reach gains in six
reachesreaches– 1500 measured spring discharges in 1500 measured spring discharges in
nine springsnine springs

Aquifer Water LevelsAquifer Water Levels
Historical MeasuredAquifer Water Levels
Model PredictedValues

Aquifer Water LevelsAquifer Water Levels
Historical MeasuredAquifer Water Levels
Model PredictedValues

Measured SpringsMeasured Springs
• Blue LakesBlue Lakes
Historical MeasuredSpring Discharges
Model PredictedValues
ScenariosScenarios
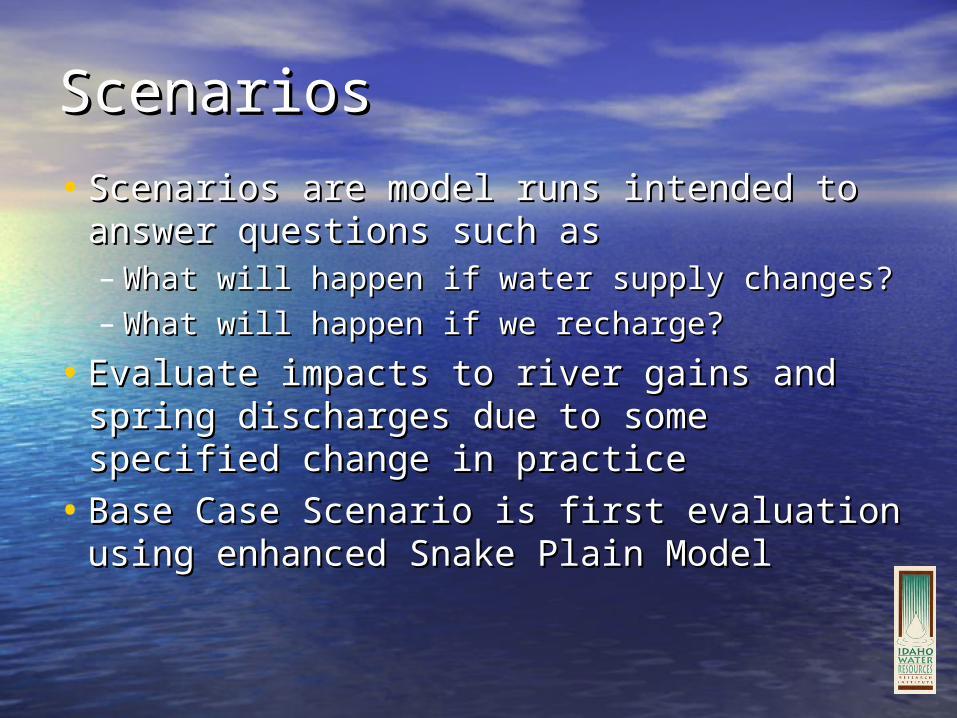
• Scenarios are model runs intended to Scenarios are model runs intended to answer questions such asanswer questions such as– What will happen if water supply changes?What will happen if water supply changes?– What will happen if we recharge?What will happen if we recharge?
• Evaluate impacts to river gains and Evaluate impacts to river gains and spring discharges due to some spring discharges due to some specified change in practicespecified change in practice
• Base Case Scenario is first evaluation Base Case Scenario is first evaluation using enhanced Snake Plain Modelusing enhanced Snake Plain Model

Base Case Scenario designed Base Case Scenario designed to answer following question:to answer following question:
““If current land and water use practices If current land and water use practices continue and if the 22-year period from continue and if the 22-year period from 1980 to 2002 represents future water 1980 to 2002 represents future water supply conditions, what will be the effect supply conditions, what will be the effect on spring discharge and Snake River on spring discharge and Snake River gains and losses?”gains and losses?”
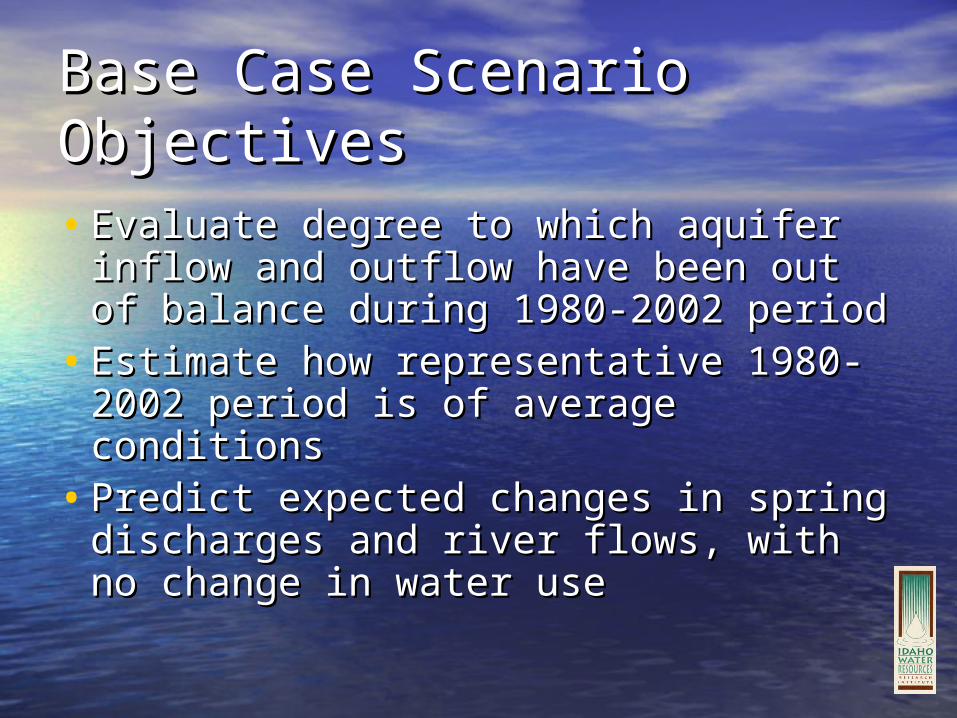
Base Case Scenario Base Case Scenario ObjectivesObjectives• Evaluate degree to which aquifer Evaluate degree to which aquifer
inflow and outflow have been out of inflow and outflow have been out of balance during 1980-2002 periodbalance during 1980-2002 period
• Estimate how representative 1980-Estimate how representative 1980-2002 period is of average conditions2002 period is of average conditions
• Predict expected changes in spring Predict expected changes in spring discharges and river flows, with no discharges and river flows, with no change in water usechange in water use

CaveatCaveat
• The Base Case Scenario is just one of The Base Case Scenario is just one of many scenarios to be evaluatedmany scenarios to be evaluated
• Together, these scenarios give us a Together, these scenarios give us a broad picture of water use and broad picture of water use and impacts on the eastern Snake River impacts on the eastern Snake River PlainPlain
• Any one scenario is only a piece of Any one scenario is only a piece of this larger picturethis larger picture

Major AssumptionsMajor Assumptions
• Past 22-years is representative of Past 22-years is representative of average water use and supplyaverage water use and supply
• Future water use will not significantly Future water use will not significantly changechange
• Water budget is accurate accounting Water budget is accurate accounting of past 22 yearsof past 22 years

ApproachApproach
• Two major aspects to approachTwo major aspects to approach– Water budget analysisWater budget analysis
•The balance between the water supply and The balance between the water supply and water use causes changes in the aquiferwater use causes changes in the aquifer
•Changes are represented in the water Changes are represented in the water budget which drives modeling results budget which drives modeling results
– Running of aquifer modelRunning of aquifer model•Recharge and discharge terms of the water Recharge and discharge terms of the water
budget are applied to the modelbudget are applied to the model
•Model predicts spring flows and river gainsModel predicts spring flows and river gains

Water Budget ApproachWater Budget Approach
• Evaluate degree to which inflows and Evaluate degree to which inflows and outflows were balanced during 1980-outflows were balanced during 1980-20022002
• Determine how representative 1980-Determine how representative 1980-2002 is of the long term2002 is of the long term
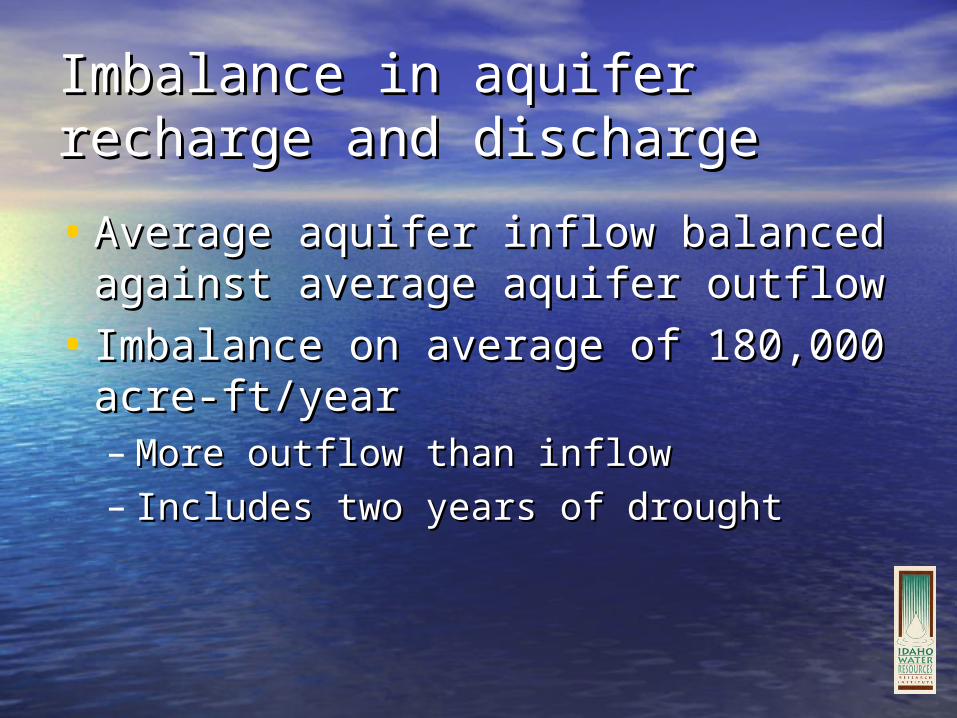
Imbalance in aquifer recharge Imbalance in aquifer recharge and dischargeand discharge
• Average aquifer inflow balanced Average aquifer inflow balanced against average aquifer outflowagainst average aquifer outflow
• Imbalance on average of 180,000 Imbalance on average of 180,000 acre-ft/yearacre-ft/year– More outflow than inflowMore outflow than inflow– Includes two years of drought Includes two years of drought

Figure 1. Annual Net Aquifer Recharge and River Gains.
-7,000,000
-5,000,000
-3,000,000
-1,000,000
1,000,000
3,000,000
5,000,000
7,000,000
Model YrAF
/yr
Net Aquifer Recharge
Total Spring Discharge and NetRiver Gains
Average Recharge=5,160,000 AF/yr
Average Gains = 5,330,000 AF/yr
80 85 90 95 00
On average, inflows are less than outflows by 180,000 acre-feet per year

• Another viewpoint is to look at aquifer Another viewpoint is to look at aquifer storagestorage
• High degree of variability in water High degree of variability in water supplysupply– Some years, water into storageSome years, water into storage– Some years, water out of storageSome years, water out of storage
• Cumulative graph crosses zero several Cumulative graph crosses zero several timestimes– Overall, indicates that we are generally Overall, indicates that we are generally
balanced in our water usebalanced in our water use

Figure 2. Model Estimated Cumulative Aquifer Storage Relative to May 1, 1980.
-4,000,000
-3,000,000
-2,000,000
-1,000,000
0
1,000,000
2,000,000
3,000,000
4,000,000
5,000,000
6,000,000
Ch
ang
e in
aq
uif
er s
tora
ge
rela
tive
to
May
, 19
80 (
AF
)

• Important to note, however, that we Important to note, however, that we never really recovered from the last never really recovered from the last droughtdrought– Even despite high water year of 1997Even despite high water year of 1997
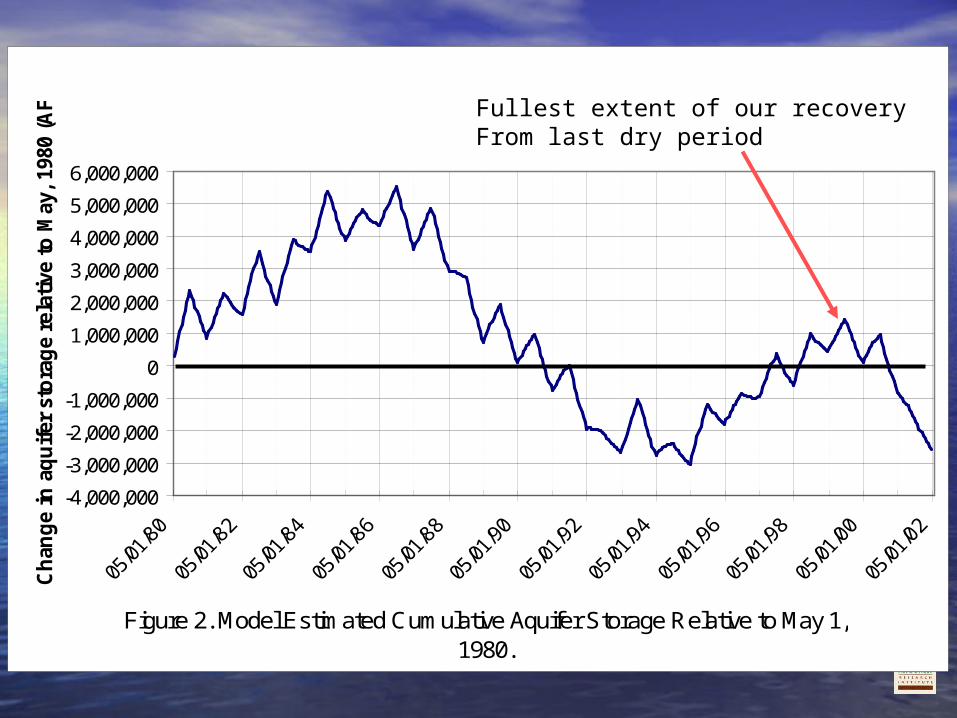
Figure 2. Model Estimated Cumulative Aquifer Storage Relative to May 1, 1980.
-4,000,000
-3,000,000
-2,000,000
-1,000,000
0
1,000,000
2,000,000
3,000,000
4,000,000
5,000,000
6,000,000
Ch
ang
e in
aq
uif
er s
tora
ge
rela
tive
to
May
, 19
80 (
AF
)
Fullest extent of our recoveryFrom last dry period
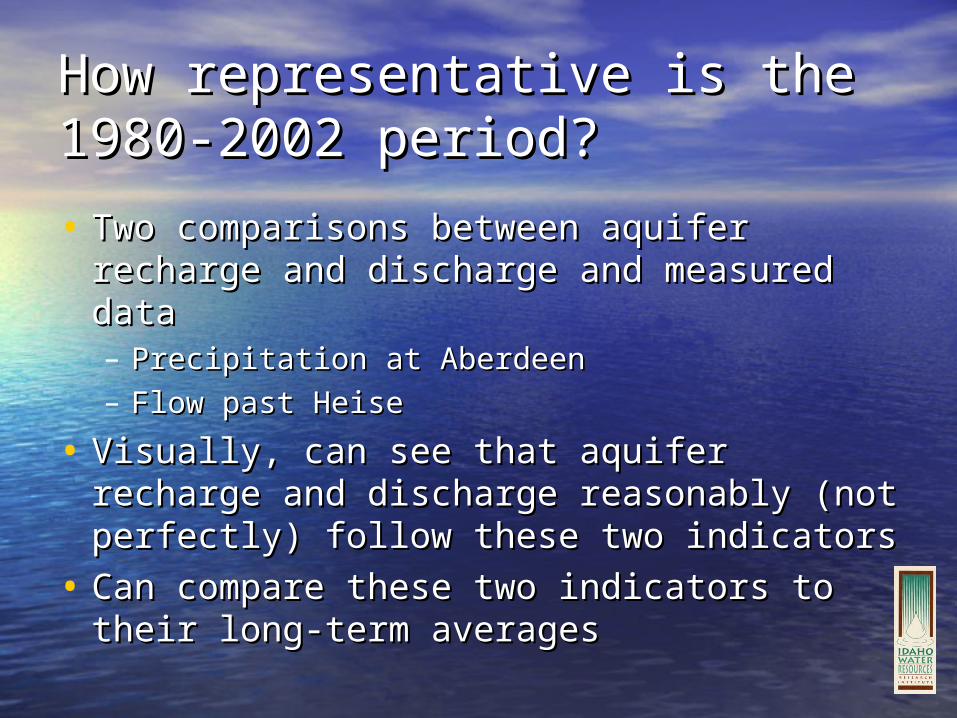
How representative is the How representative is the 1980-2002 period?1980-2002 period?
• Two comparisons between aquifer Two comparisons between aquifer recharge and discharge and measured recharge and discharge and measured datadata– Precipitation at AberdeenPrecipitation at Aberdeen– Flow past HeiseFlow past Heise
• Visually, can see that aquifer recharge and Visually, can see that aquifer recharge and discharge reasonably (not perfectly) follow discharge reasonably (not perfectly) follow these two indicatorsthese two indicators
• Can compare these two indicators to their Can compare these two indicators to their long-term averageslong-term averages
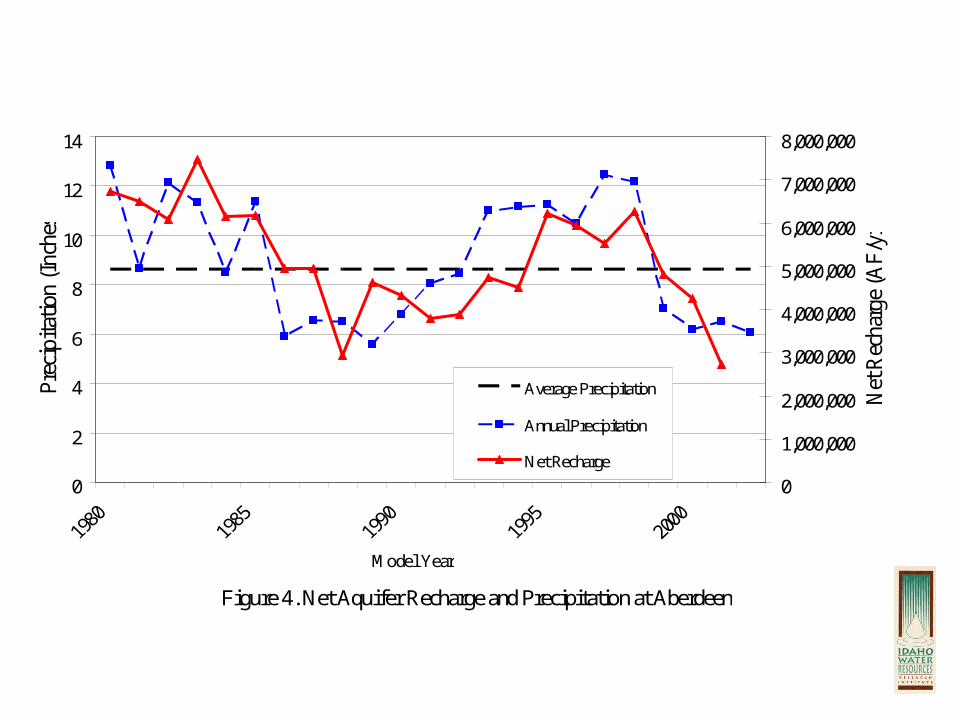
Figure 4. Net Aquifer Recharge and Precipitation at Aberdeen
0
2
4
6
8
10
12
14
Model Year
Pre
cipi
tati
on (
Inch
es)
0
1,000,000
2,000,000
3,000,000
4,000,000
5,000,000
6,000,000
7,000,000
8,000,000
Net
Rec
harg
e (A
F/y
r)
Average Precipitation
Annual Precipitation
Net Recharge

Figure 5. Net Aquifer Recharge and Streamflow near Heise
0
1,000,000
2,000,000
3,000,000
4,000,000
5,000,000
6,000,000
7,000,000
8,000,000
Model Year
AF
/yr
Actual Streamflow
Net Recharge
Average ActualStreamflow

Comparison with Long-termComparison with Long-term
• Precipitation at AberdeenPrecipitation at Aberdeen– 1914-present average was 8.63 inches1914-present average was 8.63 inches– 1980-2002 average was 9.14 inches1980-2002 average was 9.14 inches– 1980-2002 period about 6% above normal1980-2002 period about 6% above normal
• Flow past HeiseFlow past Heise– 1910-present average was 5.04 MAF/yr1910-present average was 5.04 MAF/yr– 1980-2002 average was 5.23 MAF/yr1980-2002 average was 5.23 MAF/yr– 1980-2002 period about 4% above normal1980-2002 period about 4% above normal
• Conclude that 1980-2002 was a bit wetter Conclude that 1980-2002 was a bit wetter than normalthan normal

Modeling ApproachModeling Approach
• We are evaluating the long-term, expected We are evaluating the long-term, expected impacts to spring discharges and river impacts to spring discharges and river gainsgains
• Three simulationsThree simulations– Run 22-year cycle of recharge and discharge Run 22-year cycle of recharge and discharge
over and overover and over• Use ending water levels of one 22-year cycle as Use ending water levels of one 22-year cycle as
starting for nextstarting for next
– Average recharge and discharge terms for 22-Average recharge and discharge terms for 22-year periodyear period• Run as transient data setRun as transient data set
– Average run as steady state data setAverage run as steady state data set

Modeling Approach (cont’d)Modeling Approach (cont’d)
• Repeat of 22-year cycle will give us Repeat of 22-year cycle will give us predicted highs and lows over long termpredicted highs and lows over long term– Assumes future will look like pastAssumes future will look like past– Obviously, cannot predict water supply for Obviously, cannot predict water supply for
futurefuture
• Average recharge/discharge will give us Average recharge/discharge will give us smoothed average impacts to springs and smoothed average impacts to springs and riversrivers
• Steady state will give us impacts after Steady state will give us impacts after infinitely long timeinfinitely long time

Figure 7. Simulation Results for the Malad Reach.
1050
1100
1150
1200
1250
1300
1350
5/1/1980 5/1/2002 5/1/2024 5/1/2046 5/1/2068
Sp
rin
g D
isch
arg
e (c
fs)
22 yr Calibration Period Repeated 22 yr Recharge Average of 22 yr Recharge
Base Case Scenario Steady State
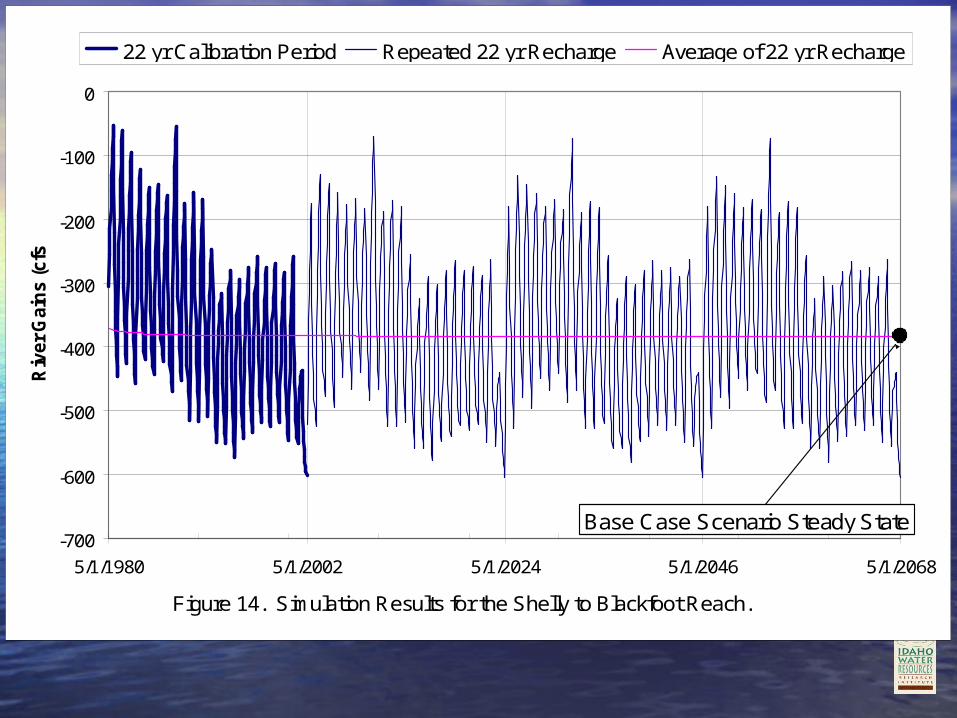
Figure 14. Simulation Results for the Shelly to Blackfoot Reach.
-700
-600
-500
-400
-300
-200
-100
0
5/1/1980 5/1/2002 5/1/2024 5/1/2046 5/1/2068
Riv
er
Gain
s (cfs
)22 yr Calibration Period Repeated 22 yr Recharge Average of 22 yr Recharge
Base Case Scenario Steady State

What these graphs meanWhat these graphs mean
• Blue line (22 years repeated) shows the Blue line (22 years repeated) shows the highs and lows around the averagehighs and lows around the average– Reflects the natural variability of the water Reflects the natural variability of the water
supplysupply– Provides some estimate of the worst it can get Provides some estimate of the worst it can get
assuming water use stays the sameassuming water use stays the same• Pink (average) line shows that we reach Pink (average) line shows that we reach
equilibrium pretty quicklyequilibrium pretty quickly– Spring discharges and river gains already Spring discharges and river gains already
showing full effects of our water useshowing full effects of our water use– No surprises coming down the aquifer (except No surprises coming down the aquifer (except
for weather)for weather)• Black dot shows final impact valueBlack dot shows final impact value
What effect is drought What effect is drought having?having?
Although water use is balanced on Although water use is balanced on average, we will continue to see average, we will continue to see declines in water levels due to declines in water levels due to
droughtdrought

#
#
# #
#
#
# ## ## # ## # ## ### ### ## ## #
## ##### ### # ### ## # # ## # ##### # # # ###### # # # ## ### # # ## ## # ### # # ## # ## # # ## ## ## ## # ### #### ## ## ## ## #### #
# # #### ## ## ##
#### # #### ## # ##### ### ## ##
## ### ## #### ### ## ## ###
## ## #### ####
## # # ## ## #### # ## # ### ### ### ## ##### ## ##### # ###
#### ###
#### ## # # ## # # ####
##
#########
#### ##
## # ### # # ## ### ######
# ### ## #####
#### ###
## ###
#### #
#### #####
##### # ####
## # ##
### # ## ## ###
## ###### # ### ##
### ###
## # ####### ## ### ####
## ## ### ####
##
#
# ## #
# # ###
#
#
#
#
#
###
#
#
#
#
#
####
#
# ##
##
##
#
#
#
#
##
#
# ##
#
#
##
#
#
#
##
## #
Water Level ChangeSpring 1980 - Spring 2001
Change in Water Level Spring '80 to Spring '01-45 - -40-40 - -35-35 - -30-30 - -25-25 - -20-20 - -15-15 - -10-10 - -5-5 - 00 - 55 - 1010 - 1515 - 2020 - 2525 - 3030 - 35No Data
Contours# Obs Points
University of Idaho / IWRRI Water Level Data from USGS, IDWR
21 YearDeclines in AquiferWater Levels
0-5 ft.
5-10 ft.

The very next year:
0-5 ft declines
0-5 ft
5-10 ft
10-15 ft
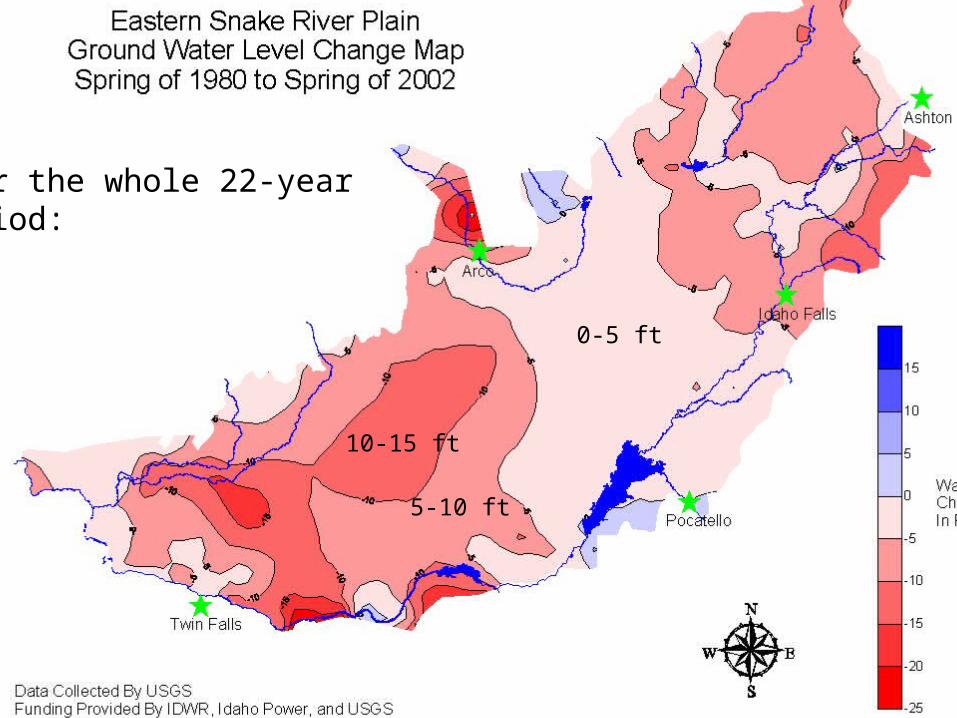
Over the whole 22-yearPeriod:

• Half of the ground water declines Half of the ground water declines between 1980 and 2002 occurred in between 1980 and 2002 occurred in the last year the last year
• The aquifer is very responsive to The aquifer is very responsive to droughtdrought
• We can expect further declines since We can expect further declines since 20022002
• Senator Burtenshaw had suggested Senator Burtenshaw had suggested looking at Big Springs, which would looking at Big Springs, which would be unaffected by ground water be unaffected by ground water pumpingpumping


SummarySummary
• Snake Plain water use mostly in Snake Plain water use mostly in balance over 22-year periodbalance over 22-year period
• The Snake Plain aquifer was close to The Snake Plain aquifer was close to an equilibrium as of 2002an equilibrium as of 2002
• This assumes water use and supply This assumes water use and supply stay the samestay the same
• High degree of natural variability in High degree of natural variability in water supplywater supply
• Will continue to experience weather-Will continue to experience weather-induced declines induced declines


![Idaho Fish and Game | Idaho Fish and Game ...[ELK HUNTING IN IDAHO: SNAKE RIVER] 18. If you hunted in more than one zone in the past 10 years, please list them below. (Please write](https://static.fdocuments.in/doc/165x107/5fdd9910f9d3412b9a29a1a8/idaho-fish-and-game-idaho-fish-and-game-elk-hunting-in-idaho-snake-river.jpg)


