Shopping Campaign Optimization Tips- Purna Virji- SMX East NYC 2016
Upload
crealyticsCategory
view
1.454download
0
#SMX #11B @AndreasReiffen
Reverse Engineering
Google Shopping –
10 Hypotheses Tested

#SMX #11B @AndreasReiffen
About…
• Data-driven online advertising strategist
• Online retail expert
• Entrepreneur
• Over €3 billion in customer revenues
last year
• SaaS product for Google Shopping &
Search
• 160 true experts in their field
• Offices in Germany & UK, new office in
NYC
… me … Crealytics & Camato

#SMX #11B @AndreasReiffen
Hypothesis 1
A very granular account structure harms performance

#SMX #11B @AndreasReiffen
Method to validate hypothesis
A/B/C Test:- All in one product group
- All their own product group- Split out product after 5 clicks
Measure how many products receive Impressions.
Google:
“Don’t split out products too soon, because the algorithm will apply
performance metrics to other products in the same group.”
Question: Does a granular account structure get more impressions?

#SMX #11B @AndreasReiffen
While more products received Impressions, the difference was not significant
# of products with Impressions & total Impressions Key insights
The approach in which products were split in separate product groups from 5 Clicks had the highest number of products with Impressions as well as the highest number of Impressions in total.
However, the difference is not significant.
1,100
900
1,000
700
800
1,019
From 5 clicks
All their own
+6.7%
1,087
1,040
All in one
80
40
60
100
120
140
From 5 clicks
139
+3,2%
All their own
135
All in one
138
# products w Impressions Impressions (k)
#SMX #11B @AndreasReiffen
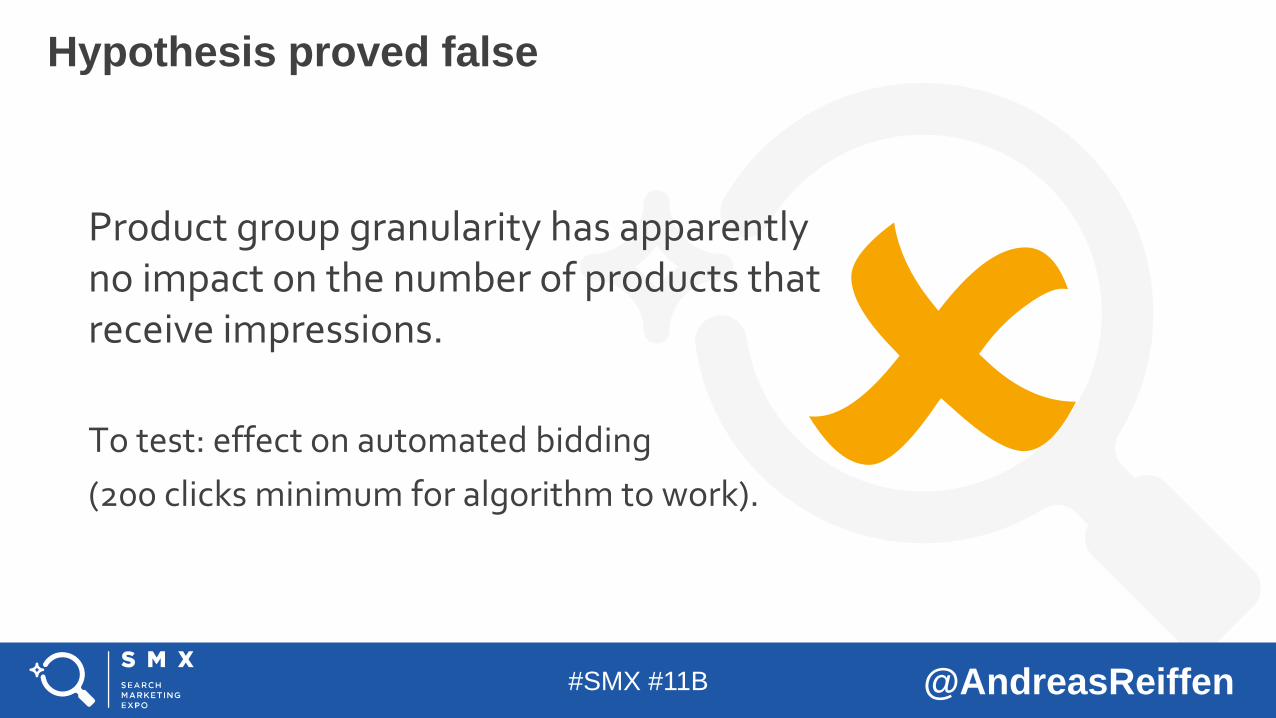
Product group granularity has apparently no impact on the number of products that receive impressions.
To test: effect on automated bidding
(200 clicks minimum for algorithm to work).
Hypothesis proved false

#SMX #11B @AndreasReiffen
Hypothesis 2
SKU Price mainly influences CTR, but not impression volume

#SMX #11B @AndreasReiffen
Method to validate hypothesis
Compare performance:
2000 products above competitor price
vs2000 products below
competitor price
Observation: Massive drop in traffic after slight increase in price
Question: Is this due to lower CTR or lower Impression volume?
#SMX #11B @AndreasReiffen
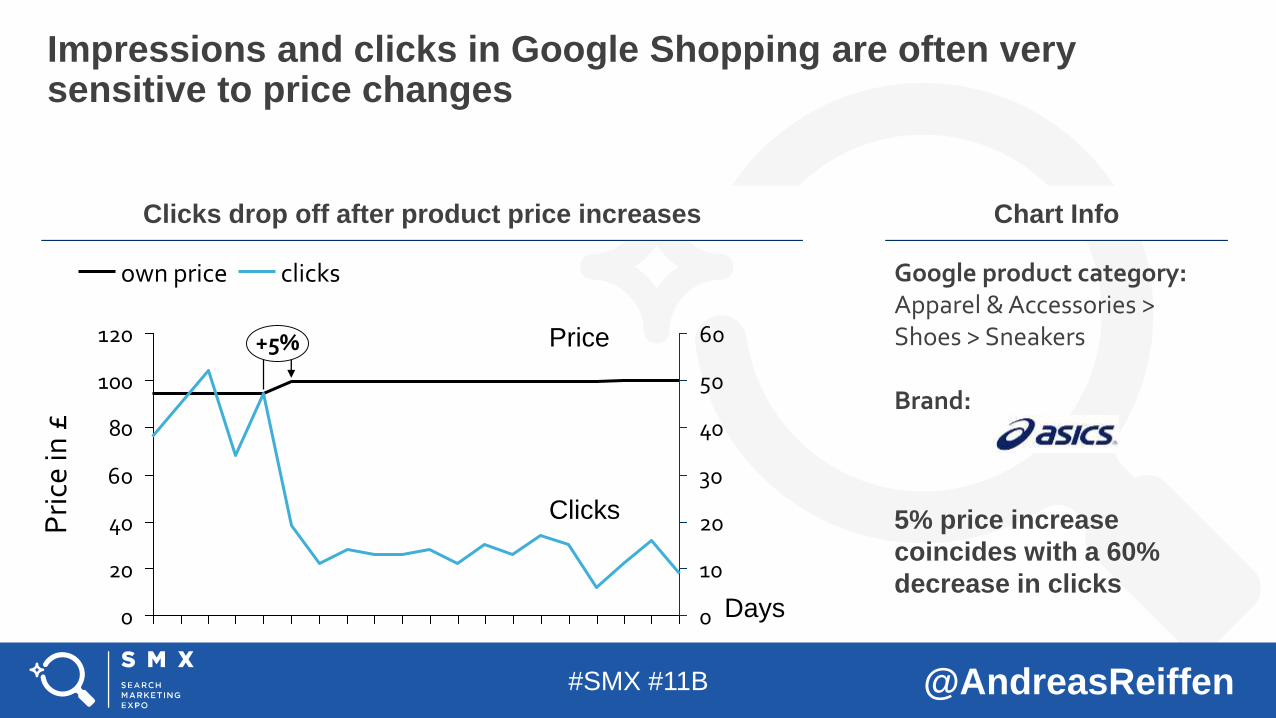
Impressions and clicks in Google Shopping are often very sensitive to price changes
Clicks drop off after product price increases Chart Info
5% price increase
coincides with a 60%
decrease in clicks
0
20
40
60
80
100
120
0
10
20
30
40
50
60+5%
Pri
ce in
£
own price clicks Google product category: Apparel & Accessories > Shoes > Sneakers
Brand:
Days
Clicks
Price

#SMX #11B @AndreasReiffen
Cheap products generate the lion’s share of total traffic
Traffic of similar products within one shop Key insights
Cheaper than competition products generate much more traffic.
CTR is slightly lower but the impact is far less significant than on Impression volume.
Due to this and higher CR, three times more conversions at 30% lower CPO
134%
4.282.611
Imps
1.828.412
0.5%
2.422.41
CTR# of products
9%
2.0471.876
expensive products cheap products
40
28
-29%
CPO
274
+280%
Conversions
1,042
0,6%
CR
61%
1,0%

#SMX #11B @AndreasReiffen
The CTR is roughly the same for cheap and expensive products.
SKU prices have a heavy impact on Impression volume.
Hypothesis proved false

#SMX #11B @AndreasReiffen
Hypothesis 3
Price determines an ad’s position

#SMX #11B @AndreasReiffen
Method to validate hypothesis
Question: We knew price impacts Impression volume, but
does it also influence position?
Analysis 1:Analyzed two sets of
4,000 queries and compared the position of
the cheapest products
Analysis 2:Which factors besides
price have an influence on offer
position?
#SMX #11B @AndreasReiffen
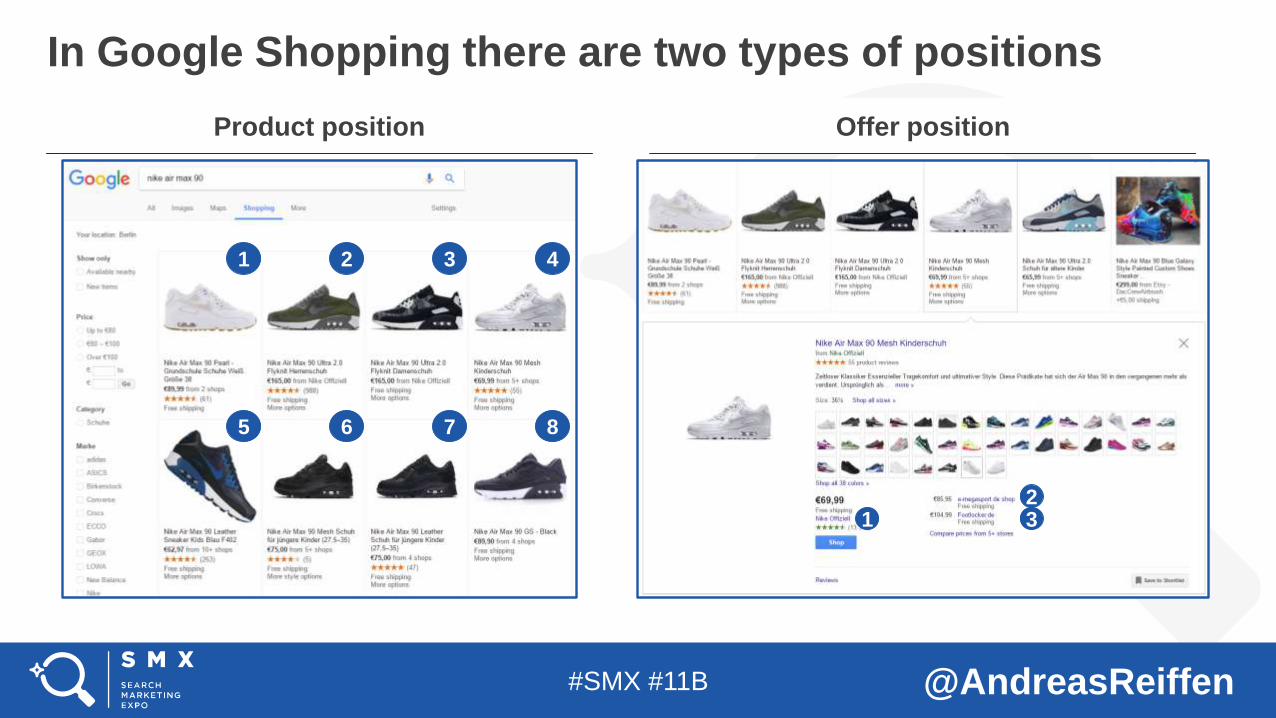
In Google Shopping there are two types of positions
1 2 3 4
5 6 7 8
123
Product position Offer position

#SMX #11B @AndreasReiffen
Product price clearly has an impact on offer position
Pos 1
Pos 2 14%
65%
Set 2
Pos 5 +
Pos 4 4%
7%Pos 3
11%
Pos 1
Pos 2 16%
62%
Set 1
Pos 5 +
Pos 4 4%
9%Pos 3
9%
Offer position* of product with cheapest price Key insights
We analyzed two sets of queries.
In both sets, the cheapest product reached offer position 1 in more than
60% of cases.
*data provided by price comparison tool

#SMX #11B @AndreasReiffen
Possible reasons for lower position despite better price
Seller Rating Key insights
Surfdome DE is in position 7 despite significantly lower price.
But:
While Pos. 1 – 6 have a Seller rating
Surfdome DE does not have a seller rating

#SMX #11B @AndreasReiffen
Possible reasons for lower position despite better price
Shipping Fee Key insights
sportXshop is in pos. 4 despite lowest base price.
But:
Total price including shipping: €29.00
Total price for
position 1: €27.90

#SMX #11B @AndreasReiffen
Possible reasons for lower position despite better price
Max CPC Key insights
Footlocker only reached position 3 despite seller rating AND slightly lower price.
But:
Current bid on product: €0.25
Proposed bid by Google: €0.75

#SMX #11B @AndreasReiffen
The hierarchy for offer position:
• Cheapest price on top
• No seller rating = no top position
• CPC secondary
Hypothesis proved true

#SMX #11B @AndreasReiffen
Hypothesis 4
Bids are the most important factor for generating more traffic

#SMX #11B @AndreasReiffen
Method to validate hypothesis
Question: If price is so
important, how much does bid
matter?
Test 1: Similar bids for cheap
vs expensive products.Increase bids DoD,
compare traffic.
Test 2: Increase prices from
lowest to highest, keep bids stable, compare
traffic.

#SMX #11B @AndreasReiffen
At the same bid, cheap products generate more impressions than expensive ones
There is a direct relationship between product price,
Max CPC bid and impressions Key insights
At each bid stage, impressions for expensive products were lower than for competitively priced products.
While expensive products still gained volume after six Max CPC increases, cheap products reached the volume plateau at a lower Max CPC.
1.2
1,000 0.6
1.0
0.4
0.2
0 0.0
500
0.81,500
2,000
5-13-165-11-16 5-12-16 5-15-16 5-17-165-16-165-14-16
Max CPCImpressions per product
Max CPC
expensive products
cheap products
#SMX #11B @AndreasReiffen
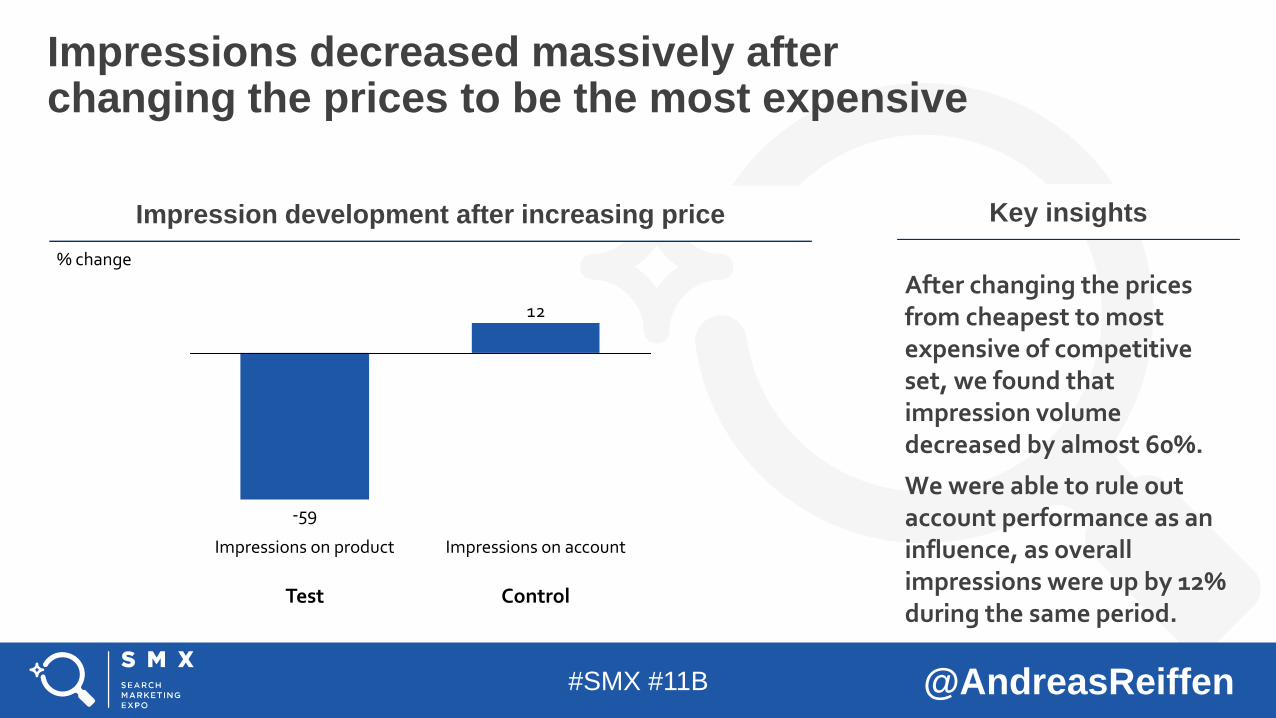
Impressions decreased massively after changing the prices to be the most expensive
After changing the prices from cheapest to most expensive of competitive set, we found that impression volume decreased by almost 60%.
We were able to rule out account performance as an influence, as overall impressions were up by 12% during the same period.
Impression development after increasing price Key insights
12
-59
Impressions on product Impressions on account
% change
Test Control
#SMX #11B @AndreasReiffen
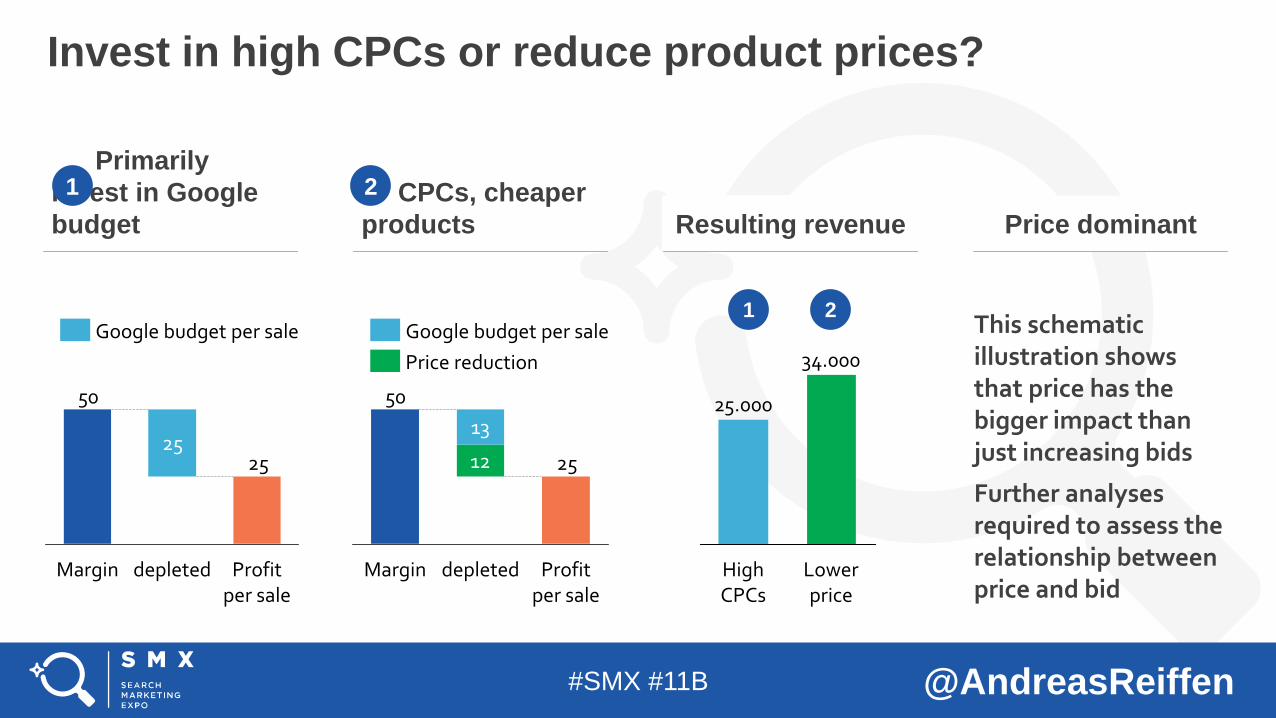
Invest in high CPCs or reduce product prices?
Primarily
invest in Google
budget
CPCs, cheaper
products Resulting revenue Price dominant
25
50
25
Profit per sale
depletedMargin
25.000
High CPCs
Lower price
34.000
This schematic illustration shows that price has the bigger impact than just increasing bids
Further analyses required to assess the relationship between price and bid
Google budget per sale
25
50
12
13
Profit per sale
Margin depleted
Google budget per sale
Price reduction
1 2
1 2

#SMX #11B @AndreasReiffen
Price can influence traffic levels more significantly than bids.
Combined with conversion effect, price changes seem to be more effective.
Further testing required.
Hypothesis proved false

#SMX #11B @AndreasReiffen
Hypothesis 5
Titles are the most important feed element

#SMX #11B @AndreasReiffen
Method to validate hypothesis
Question:
Can we manipulate traffic and queries by changing feed elements?
Is feed management the new campaign management?
Test:
We systematically improve or destroy main feed elements and measure traffic changes.

#SMX #11B @AndreasReiffen
Destroying product description: no effect
Evening dressby TFNC…
Baseball capby Nike…
before destroyed
100% 98%
Impressions
Non-sense description No clear traffic effect

#SMX #11B @AndreasReiffen
Destoying product category: no effect
before destroyed
100%
118%
Impressions
Non-sense category No clear traffic effect
Shoes > …> Athletic Shoes
Clothing > …> Rain Suits

#SMX #11B @AndreasReiffen
Similar results visible across-the-board
Impressions
Include important missing search queries- across many products - Traffic for “Jordan Kids” totals
Jordan 1 Flight 4Premium
Jordan Kids -Jordan 1 Flight…
100100120
167
+67%
Query Level change
+20%
Control group change
AfterBefore

#SMX #11B @AndreasReiffen
Including queries is beneficial if those queries are under-represented in comparison to market volume.
Other elements are less important.
Google openly says “category will become irrelevant”.
Hypothesis proved true

#SMX #11B @AndreasReiffen
Hypothesis 6
Changing titles leads to a loss of history and therefore a loss of traffic

#SMX #11B @AndreasReiffen
Method to validate hypothesis
Test:We changed the titles of
~2,000 products and compared DoD performance before and after the change
History can get lost if feed changes.
Question: Is this the case with title changes?

#SMX #11B @AndreasReiffen
Performance sees only a slight dip on the day of the upload
Impressions before/after in comparison to total account Key insights
Some products had a slight dip in Impressions on the day of the upload but picked up immediately afterwards, showing an even stronger uplift than the account avg.
2017-02-24
-2.9%
-12.5%
Test Group
Account
+6% vs +34%

#SMX #11B @AndreasReiffen
Comparing each product, there is no hint that changing titles causes a loss in traffic.
Impression development before/ after title change Key insights
These four products show that the title change seems to have no impact on performance.
While some had a slight decrease in Impressions, others saw an immediate increase.
What’s in common: All saw an overall increase during the test
-80.6%
-9.6%
+0.4%
+26.0%
Significant drop
Slight drop
No impact
Immediate increase
+13% +86%
+144% +127%

#SMX #11B @AndreasReiffen
Performance is not affected significantly.
Following uplift outweighs potential initial dip.
Hypothesis proved false
#SMX #11B @AndreasReiffen
Hypothesis 7
ECPC uses audience information to predict conversion probability
#SMX #11B @AndreasReiffen
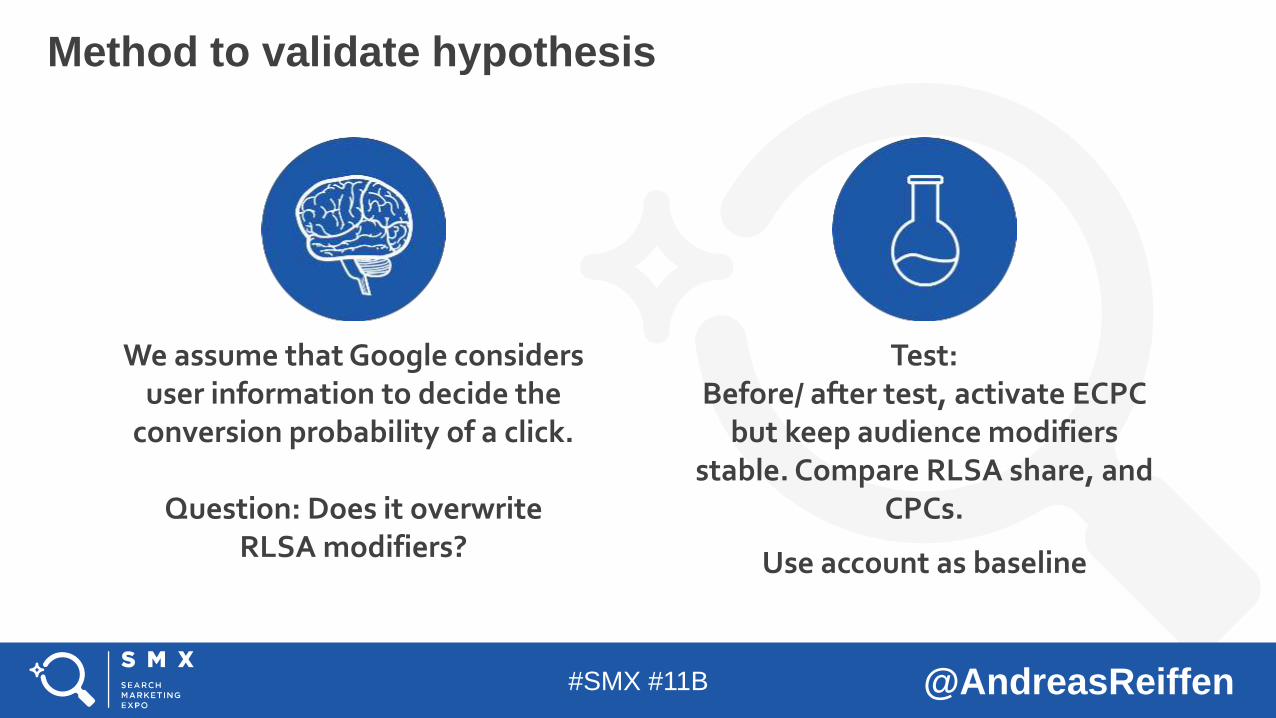
Method to validate hypothesis
Test:Before/ after test, activate ECPC
but keep audience modifiers stable. Compare RLSA share, and
CPCs.
Use account as baseline
We assume that Google considers user information to decide the
conversion probability of a click.
Question: Does it overwrite RLSA modifiers?

#SMX #11B @AndreasReiffen
RLSA CPCs increase more significantly than Non-Audience CPCs after activating ECPC
% increase in CPC RLSA vs non-RLSA Key insights
While there was an overall increase in ad spend during the test, the avg. RLSA CPC increased more significantly.
Also noticeable: The gap in CPC growth became stronger each week during the ECPC algorithm learning phase.
161515
23
20
17
Week 1 Week 3
+44%
Week 2
+13%
+33%
RLSA
Non-RLSA

#SMX #11B @AndreasReiffen
Google pushed lower funnel audiences due to higher conversion probability
Relation CPC RLSA vs non-RLSA by audience type Key insights
Google increased the CPC of lower funnel audiences such as cart abandoners and purchasers as these are more likely to convert.
Audience CPCs increased by 16% in comparison to non-RLSA despite similar bid modifiers.
159
102
184
101
Upper funnel Lower funnel
-1%
+16%
After
Before

#SMX #11B @AndreasReiffen
Google’s learning curve shows reliance on user information.
Caution: Use ECPC carefully if generating
new customers is your main objective.
Hypothesis proved true

#SMX #11B @AndreasReiffen
Hypothesis 8
Raising bids in Shopping
increases share of less relevant Search Terms

#SMX #11B @AndreasReiffen
Method to validate hypothesis
Tests:
Significantly bid up products (+200%) and analyze search queries.
Repeat across multiple designers.
Question:
Do higher bids attract poor-quality traffic?
#SMX #11B @AndreasReiffen
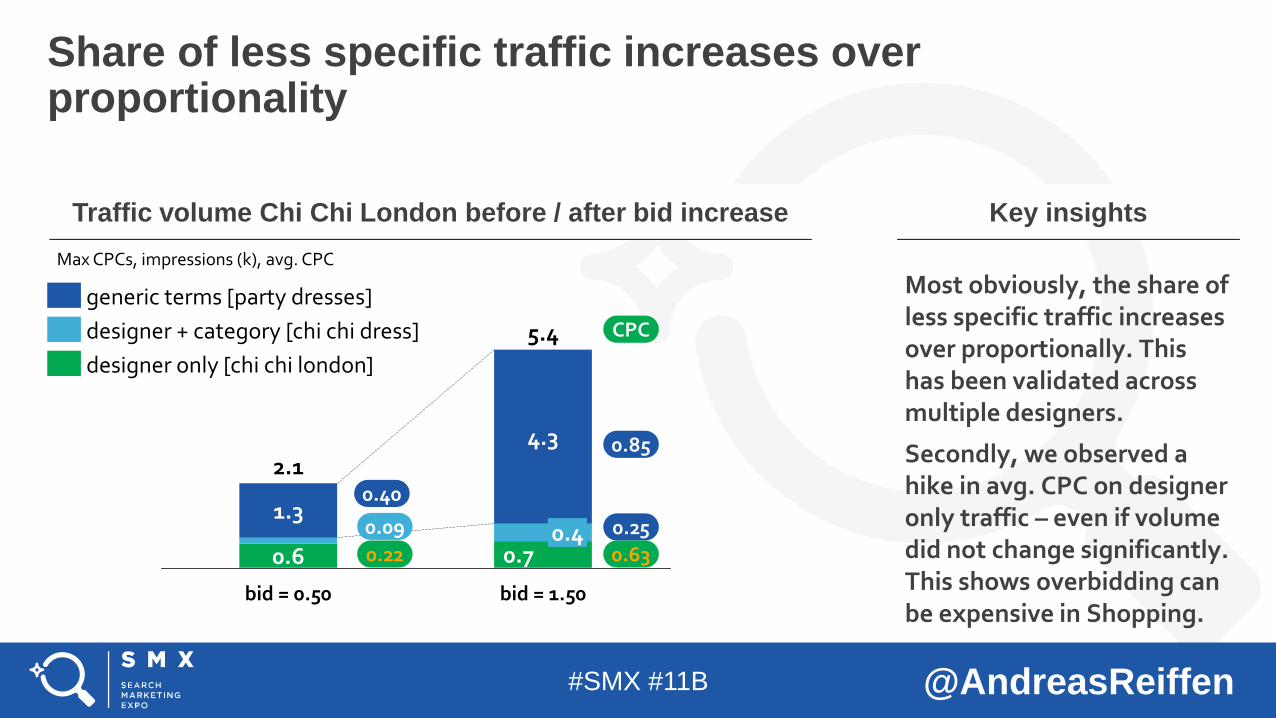
Share of less specific traffic increases over proportionality
Most obviously, the share of less specific traffic increases over proportionally. This has been validated across multiple designers.
Secondly, we observed a hike in avg. CPC on designer only traffic – even if volume did not change significantly. This shows overbidding can be expensive in Shopping.
Traffic volume Chi Chi London before / after bid increase Key insights
0.6
4.32.1
0.41.3
bid = 0.50 bid = 1.50
0.7
5.4
designer only [chi chi london]
designer + category [chi chi dress]
generic terms [party dresses]
0.40
0.09
0.22
0.85
0.25
0.63
CPC
Max CPCs, impressions (k), avg. CPC

#SMX #11B @AndreasReiffen
New Test: Using query length as an indicator, what happens to traffic quality when increasing bids?
Raising bids attracts a higher share of shorter search queries, a similar observation as with broads.
Long tail queries increase at far lower growth rates.
Luxury designer core brand terms tend to have a low word count as well, but they require very high bid levels to win.
Traffic by word count and bid level Key insights
22.6%
0.0%
39.5%
0.6
73.0%
44.0%
17724
12.0%4.0%
24.0%
2 words
3 words
1 word
2.5
339
4 words 1.5%6.7%
67.6%
1.2CPC bid
impressions (k) and share of impressions

#SMX #11B @AndreasReiffen
Bidding up leads to a higher share of generic traffic; specific traffic is maximized first.
Higher bids may lead to the same traffic becoming more expensive.
Hypothesis proved true

#SMX #11B @AndreasReiffen
Hypothesis 9
Matching between query and product is purely based on text match
#SMX #11B @AndreasReiffen
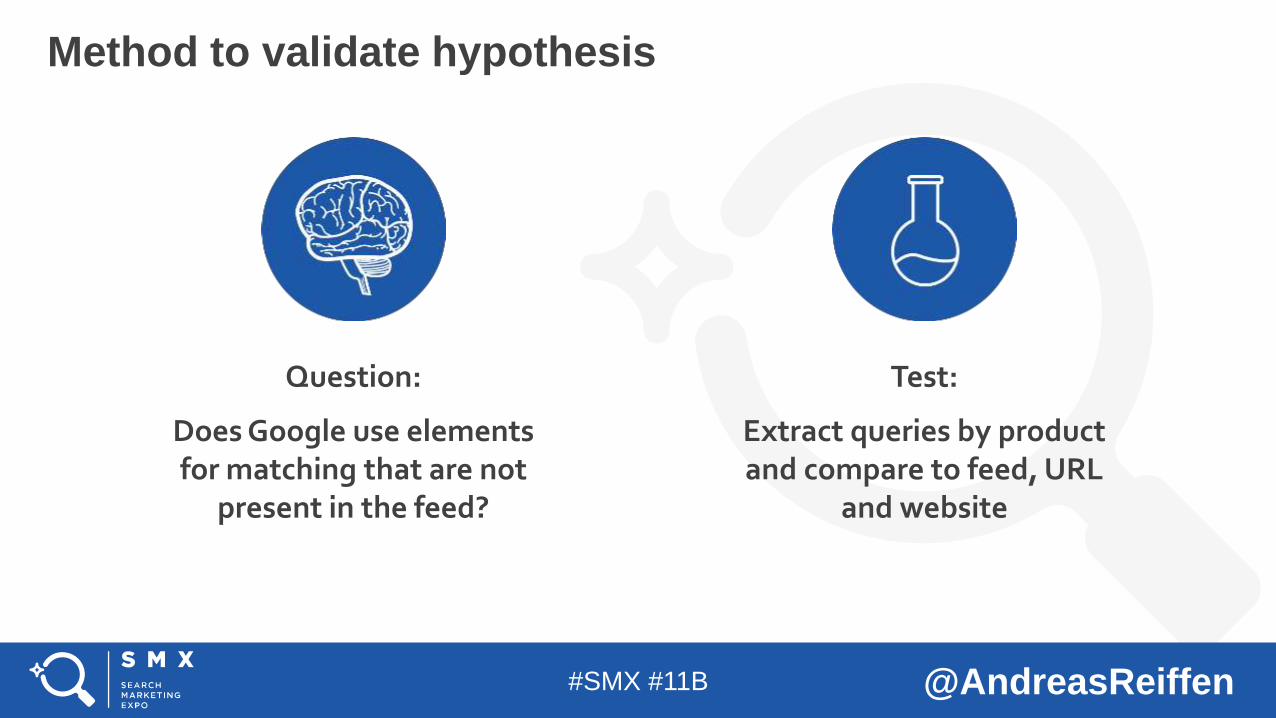
Method to validate hypothesis
Question:
Does Google use elements for matching that are not
present in the feed?
Test:
Extract queries by product and compare to feed, URL
and website

#SMX #11B @AndreasReiffen
Google can match queries to information that is contained in the image, but not in feed or website
Title:
Boy Tracksuit by Adidas Rose Satin Track Top
Query matched:
Adidas leopard print jacket kids
Title:
Nike Free Flyknit - Women Shoes Multi Size 38.5
Query matched:
rainbow Nike shoes

#SMX #11B @AndreasReiffen
Similarly: The information about skirt length is not present anywhere in the feed or on the landing page
Title:
Lipsy - Lace Bodycon Dress - Navy
Query matched:
Lipsy dress short
Title:
Lipsy - Cap Sleeve V Neck Bodycon Dress - Red
Query matched:
Lipsy dress short

#SMX #11B @AndreasReiffen
Examples suggest that Google uses more than the feed for query matching.
Other sources might include:
• Image recognition
• GTINs
• KPI based machine learning
Hypothesis proved false

#SMX #11B @AndreasReiffen
Hypothesis 10
Out of stock products should remain in feed or history is lost

#SMX #11B @AndreasReiffen
Method to validate hypothesis
Test:Compare products with same ID which
a) remain in feed vs
b) get deleted
Google: “History is lost if out of stock products are deleted from
feed. Therefore keep them in feed for 30
days.”

#SMX #11B @AndreasReiffen
Products that remain in feed pick up same traffic levels while deleted ones take time
Impression levels DoD after being in stock again – per
product Key insights
It does not seem to influence traffic levels if products with the same ID are taken out of the feed while being out of stock or if they remain in the feed.
Lower Similar Higher
Lower Similar Higher
Avg. Before
After
Deleted while out of stock
In feed while out of stock

#SMX #11B @AndreasReiffen
Google recognizes same IDs if the products re-enter the feed within 30 days.
It doesn’t matter products remain or are deleted.
Hypothesis proved false

#SMX #11B @AndreasReiffen
LEARN MORE: UPCOMING @SMX EVENTS
THANK YOU! SEE YOU AT THE NEXT #SMX