Smokeless Tobacco Sub-Group - CORESTA · Smokeless Tobacco Sub-Group ... December 2015 Author and...
48
Smokeless Tobacco Sub-Group Technical Report CORESTA Reference Products 2015 Analysis December 2015 Author and Sub-Group Coordinator: Karl Wagner, Ph.D. Altria Client Services Study Coordinator: John Bunch, Ph.D. American Snuff Company Co-Author and Statistical Analysis: Michael Morton, Ph.D. Altria Client Services
Transcript of Smokeless Tobacco Sub-Group - CORESTA · Smokeless Tobacco Sub-Group ... December 2015 Author and...
Smokeless Tobacco Sub-Group
Technical Report
CORESTA Reference Products
2015 Analysis
December 2015
Author and Sub-Group Coordinator:
Karl Wagner, Ph.D.
Altria Client Services
Study Coordinator:
John Bunch, Ph.D.
American Snuff Company
Co-Author and Statistical Analysis:
Michael Morton, Ph.D.
Altria Client Services
Table of Contents
1. Summary ........................................................................................................................... 3
2. Introduction ....................................................................................................................... 3
2.1 Objective ................................................................................................................. 4
3. Organisation ...................................................................................................................... 4
3.1 Participants .............................................................................................................. 4
3.2 Protocol ................................................................................................................... 5
3.2.1 Sample Shipment ......................................................................................... 5
3.2.2 Within Laboratory Sample Preparation ....................................................... 5
3.2.3 Sample Analysis and Data Reporting .......................................................... 6
4. Data – Raw ........................................................................................................................ 7
5. Data – Statistical Analysis .............................................................................................. 12
5.1 Exclusion of Outliers ............................................................................................. 12
5.2 Calculation of Repeatability (r) and Reproducibility (R) ...................................... 13
5.3 Calculation of Z-Scores ......................................................................................... 14
5.4 CRP Stability Assessment ..................................................................................... 16
6. Data Interpretations ......................................................................................................... 19
7. Recommendations ........................................................................................................... 20
APPENDIX A: Raw Data Plots for 2015 WG4 Study ............................................................ 21
APPENDIX B: CRP Stability Assessment, Mean Data Plots ................................................. 35
STS-CTR 2015 Analysis of CRPs – December 2015 3/48
1. Summary
In May 2015, the CORESTA Smokeless Tobacco Sub-Group (STS) conducted the annual
Working Group 4 (WG4) inter-laboratory study designed to assess the stability of the four
CORESTA Reference Products (CRPs). Sixteen laboratories participated in the 2015 study.
The participating laboratories reported the levels of nicotine, pH, moisture (oven volatiles),
and tobacco specific nitrosamines (TSNAs) using CORESTA Recommended Methods
(CRMs). In an initial study conducted in 2010, the STS recommended monitoring these
analytes as appropriate markers for monitoring product stability. Tabulated data are presented
along with repeatability (r), reproducibility (R) and z-scores.
The results from the stability analysis over all study years showed only a few trends.
Specifically:
In the 2014 report1, increased variability between labs was noted across the reporting
period (2010 – 2014) for pH for CRP3 and moisture for CRP1.
In the 2012/2013 report2, a statistically significant increase in moisture was noted for
CRP3 over the study years (2010-2013). This upward trend did not continue in 2014,
but was evident again with the inclusion of 2015 data.
In the 2012/2013 report, an increase in inter-laboratory variability for pH was noted
for CRP3 over the study years (2010-2013). There is still an indication that this is the
case; however, the trend did not reach the level of statistical significance in 2014 or
2015.
In 2012, there was a notable increase in inter-laboratory variability for moisture for
CRP4. Since that time the lab-to-lab differences have been much smaller, possibly
because of improved sample handling, which included grinding and homogenising an
entire pouch prior to analysis.
The results of this study demonstrate that the CRPs are suitable for continued use as reference
products; however, manufacture of new CRPs should be considered due to the dwindling
supply of the current products.
2. Introduction
In November 2008, the Smokeless Tobacco Sub-Group (STS) was established by
recommendation of the CORESTA Scientific Commission. In 2009, STS Working Group
Three (WG3) cooperated to design and manufacture four CORESTA Reference Products
(CRPs) referred to as CRP1, CRP2, CRP3, and CRP4. These products were intended as
replacements for the Smokeless Tobacco Research Products: 2S3 (Moist Snuff), 1S2 (Dry
Snuff) and 2S1 (Loose-leaf Chewing Tobacco), which were more than ten years old.
At the Amelia Island, Florida, STS meeting (October 2009), Working Group 4 (WG4) was
organized to proceed with the chemical characterization of the four CRPs. The protocol for
the first WG4 study3 was distributed in December 2009 and the study was conducted in 2010.
This study included 43 analytes and did not specify methods of analysis. Many of the results
from this study showed a wide range in analyte levels, which is not unexpected since the
methods were not harmonized. The recommendations from the 2010 study were to monitor
1 STS Technical Report: CORESTA Reference Products 2014 Analysis, January 2015.
2 STS Technical Report: CORESTA Reference Products 2012 and 2013 Analysis, July 2014.
3 STS Technical Report: CORESTA Reference Products 2010 Analysis, February 2014.
STS-CTR 2015 Analysis of CRPs – December 2015 4/48
the stability of the CRPs on an annual basis, by determining the levels of nicotine, pH,
moisture (oven volatiles) and TSNAs using CORESTA Recommended Methods (CRMs) or
draft CRMs. This annual analysis would allow the STS to determine when the CRPs should
be remanufactured.
At the STS Meeting in Hamburg, Germany (May 2011), it was decided to adopt the
recommendations from the 2010 WG4 study and initiate the first annual analysis of the four
CRPs using CRMs or draft CRMs. The first WG4 study using CRMs or draft CRMs was
conducted in 2011, and a similar study has been carried annually since that time. The focus of
this report is the 2015 study. Repeatability and reproducibility (r & R) and z-scores were
calculated for the 2015 study while the stability analysis includes data from 2010-2015. As
mentioned earlier, methods of analysis were not specified for the 2010 WG4; however, the
data were considered to be similar enough for inclusion in the analysis.
The CRPs continue to be stored at -20 °C and distributed by the North Carolina State
University (NCSU) Tobacco Analytical Services Lab under the direction of Dr. Ramsey
Lewis4 and Karen Andres
5.
2.1 Objective
The 2015 participating laboratories were to provide analytical results for pH, moisture (oven
volatiles), nicotine, and the four TSNAs (N-nitrosonornicotine (NNN), N-nitrosoanatabine
(NAT), N-nitrosoanabasine (NAB) and 4-(N-nitrosomethylamino)-1-(3-pyridyl)-1-butanone
(NNK)). This work was conducted using the applicable CRMs referenced in Section 3.
These studies were conducted to support the assessment of stability of the CRPs and to
provide an assessment of inter-laboratory variability. Data were collected from the
participating laboratories and statistically evaluated in basic conformance with the
recommendations of ISO 5725-2:1994 and ISO/TR 22971:2005. The stability analysis was
conducted using the study data from 2010 through 2015. Additionally, z-scores were
calculated for the 2015 data as an additional measure of each laboratory’s performance as
compared to the results of other laboratories.
3. Organisation
3.1 Participants
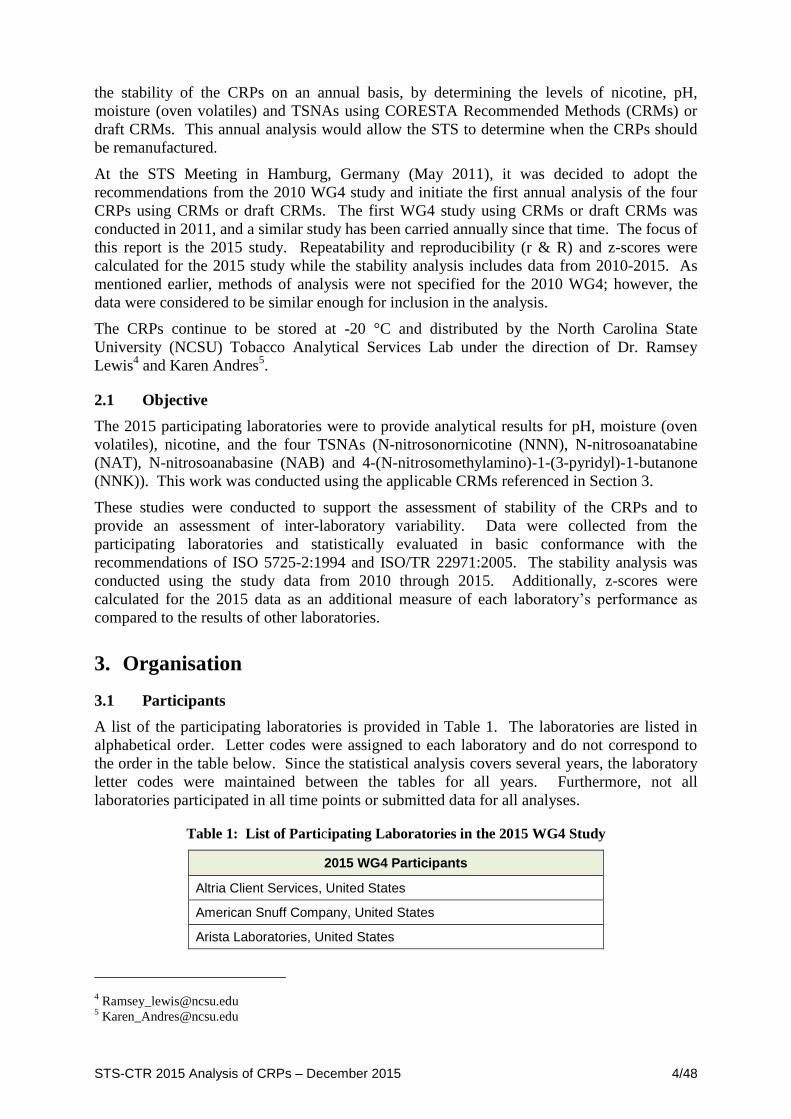
A list of the participating laboratories is provided in Table 1. The laboratories are listed in
alphabetical order. Letter codes were assigned to each laboratory and do not correspond to
the order in the table below. Since the statistical analysis covers several years, the laboratory
letter codes were maintained between the tables for all years. Furthermore, not all
laboratories participated in all time points or submitted data for all analyses.
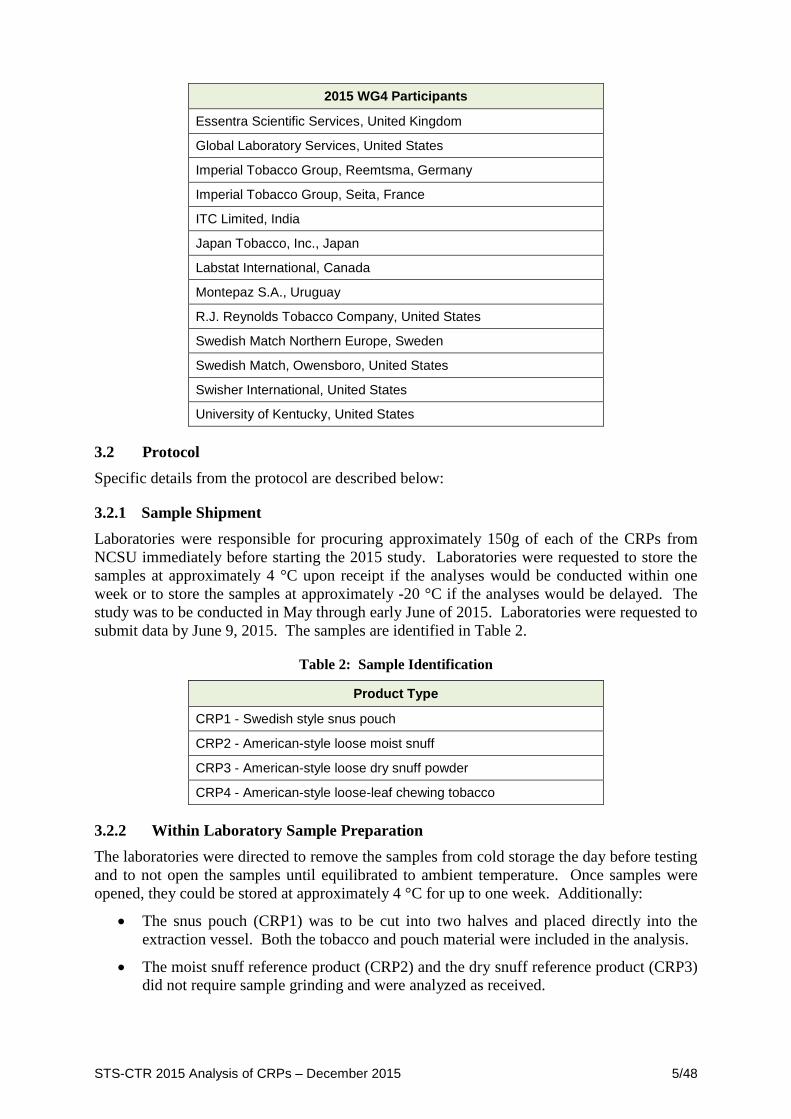
Table 1: List of Participating Laboratories in the 2015 WG4 Study
2015 WG4 Participants
Altria Client Services, United States
American Snuff Company, United States
Arista Laboratories, United States
STS-CTR 2015 Analysis of CRPs – December 2015 5/48
2015 WG4 Participants
Essentra Scientific Services, United Kingdom
Global Laboratory Services, United States
Imperial Tobacco Group, Reemtsma, Germany
Imperial Tobacco Group, Seita, France
ITC Limited, India
Japan Tobacco, Inc., Japan
Labstat International, Canada
Montepaz S.A., Uruguay
R.J. Reynolds Tobacco Company, United States
Swedish Match Northern Europe, Sweden
Swedish Match, Owensboro, United States
Swisher International, United States
University of Kentucky, United States
3.2 Protocol
Specific details from the protocol are described below:
3.2.1 Sample Shipment
Laboratories were responsible for procuring approximately 150g of each of the CRPs from
NCSU immediately before starting the 2015 study. Laboratories were requested to store the
samples at approximately 4 °C upon receipt if the analyses would be conducted within one
week or to store the samples at approximately -20 °C if the analyses would be delayed. The
study was to be conducted in May through early June of 2015. Laboratories were requested to
submit data by June 9, 2015. The samples are identified in Table 2.
Table 2: Sample Identification
Product Type
CRP1 - Swedish style snus pouch
CRP2 - American-style loose moist snuff
CRP3 - American-style loose dry snuff powder
CRP4 - American-style loose-leaf chewing tobacco
3.2.2 Within Laboratory Sample Preparation
The laboratories were directed to remove the samples from cold storage the day before testing
and to not open the samples until equilibrated to ambient temperature. Once samples were
opened, they could be stored at approximately 4 °C for up to one week. Additionally:
The snus pouch (CRP1) was to be cut into two halves and placed directly into the
extraction vessel. Both the tobacco and pouch material were included in the analysis.
The moist snuff reference product (CRP2) and the dry snuff reference product (CRP3)
did not require sample grinding and were analyzed as received.
STS-CTR 2015 Analysis of CRPs – December 2015 6/48
An entire pouch of the loose leaf reference product (CRP4) was to be cryoground
before removing aliquots for analysis.
3.2.3 Sample Analysis and Data Reporting
The WG4 participating laboratories were instructed to conduct triplicate analyses for the
following: pH, moisture (oven volatiles), nicotine, and TSNAs. The laboratories were
requested to use the current versions of the following CRMs:
pH: CRM N° 69, Determination of pH in Smokeless Tobacco Products
Moisture (oven volatiles): CRM N° 76, Determination of Moisture Content (Oven
Volatiles) of Smokeless Tobacco Products
Nicotine: CRM N° 62, Determination of Nicotine in Tobacco and Tobacco Products
by Gas Chromatographic Analysis
TSNAs: CRM N° 72, Determination of Tobacco Specific Nitrosamines in Smokeless
Tobacco Products by Liquid Chromatography - Tandem Mass Spectrometry
Participating laboratories were requested to document any deviations from the protocol and
the CRMs and submit the deviations with their results. The deviations are identified below as
well as if the data were withdrawn from the study.
Lab A: CRP4 was stored in a freezer at approximately -20 °C. Two frozen pouches
were ground at 2000rpm for 15 seconds with a knife mill (Grindomax GM300
Retsch).
Lab D: One pouch of CRP4 was ground at room temperature to approx. 4mm and
then mixed thoroughly prior to sampling for analysis.
Lab G: The grinder and tobacco was placed in refrigerator overnight prior to grinding
at low speed to avoid excess heat.
Lab K: CRP4 was manually cut into very small pieces and mixed thoroughly.
Lab K: CRM N° 72 was not followed for the determination of TSNAs. The
laboratory reported the use of a different extraction solvent. The data were identified
as outliers and removed from the study.
Lab K: Moisture content is measured at 110 °C for 3.5 hours. Moisture for CRP4 was
determined without particle size reduction. These data were not included in the
analysis.
Lab M: One pouch of CRP4 was ground at room temperature.
Lab N: CRP4 was not ground, but cut into smaller pieces, without sufficient
homogenization. The TSNA data were identified as extreme outliers. The participant
requested that CRP4 data for all analytes be removed.
Lab N: Moisture determination was performed by applying CRM 56, Karl Fischer.
These data were removed from the study since the participant determined water
instead of moisture.
Lab P: CRP4 was ground at room temperature in a Retsch Grindomix for 8 seconds.
Lab T: CRP4 was manually cut into smaller pieces.
Lab U: Two frozen pouches of CRP4 (0 °C) were ground in a Robo Coupe RSI 6V at
3000 rpm for 20 seconds.
Lab U: TSNAs were determined using GC-TEA instead of using CRM N° 72.
All test results were to be reported on an as-is basis with no correction for moisture content.
The results were not to be rounded and ideally reported to at least one more digit than
typically required.
STS-CTR 2015 Analysis of CRPs – December 2015 7/48
The study results and the comments were to be sent by e-mail to John E. Bunch and Karl
Wagner.
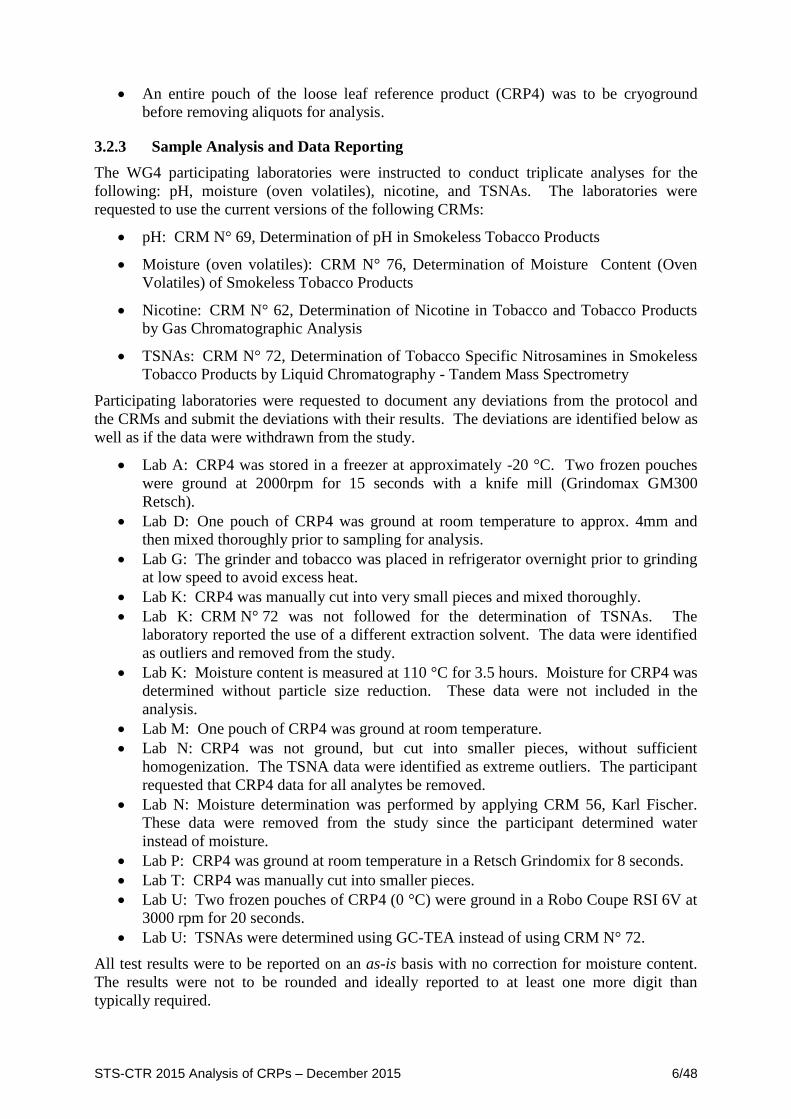
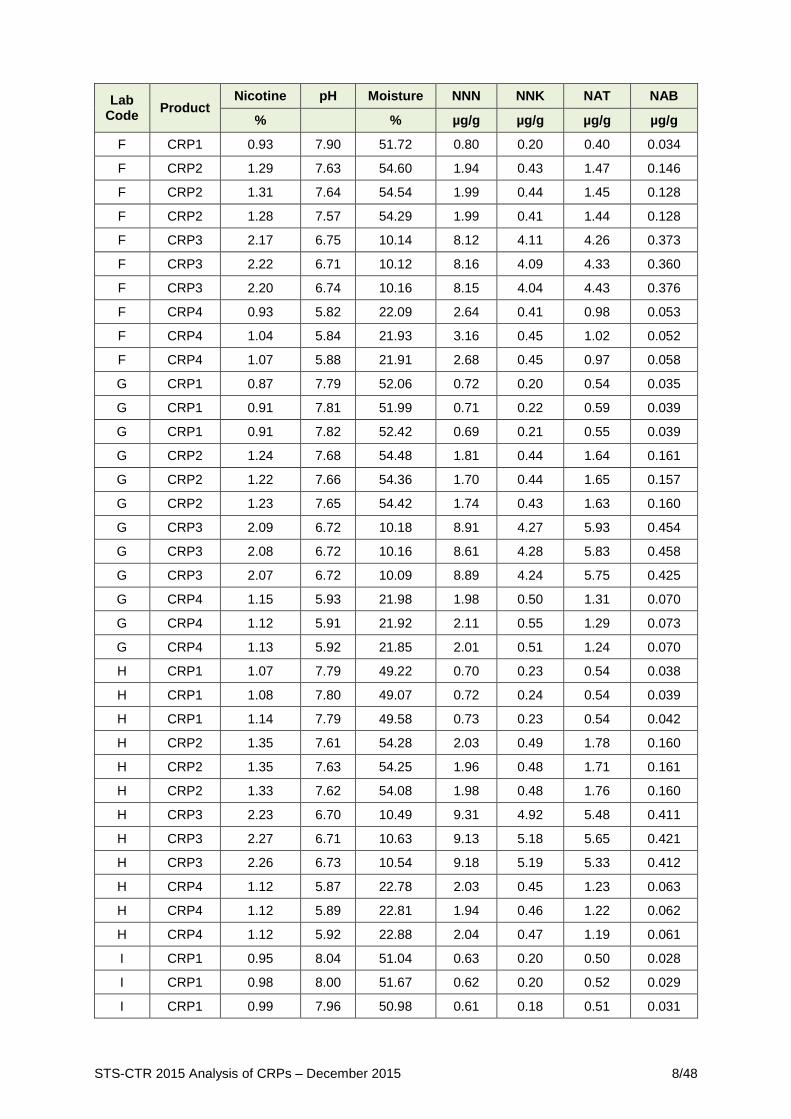
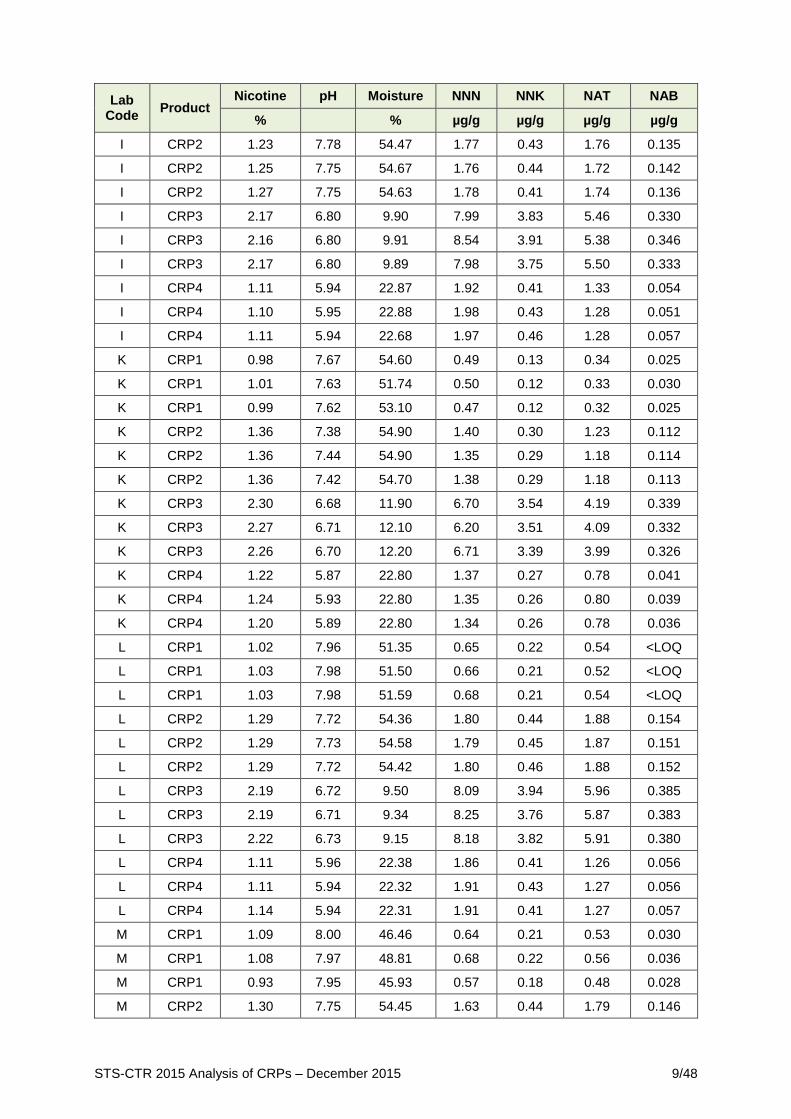
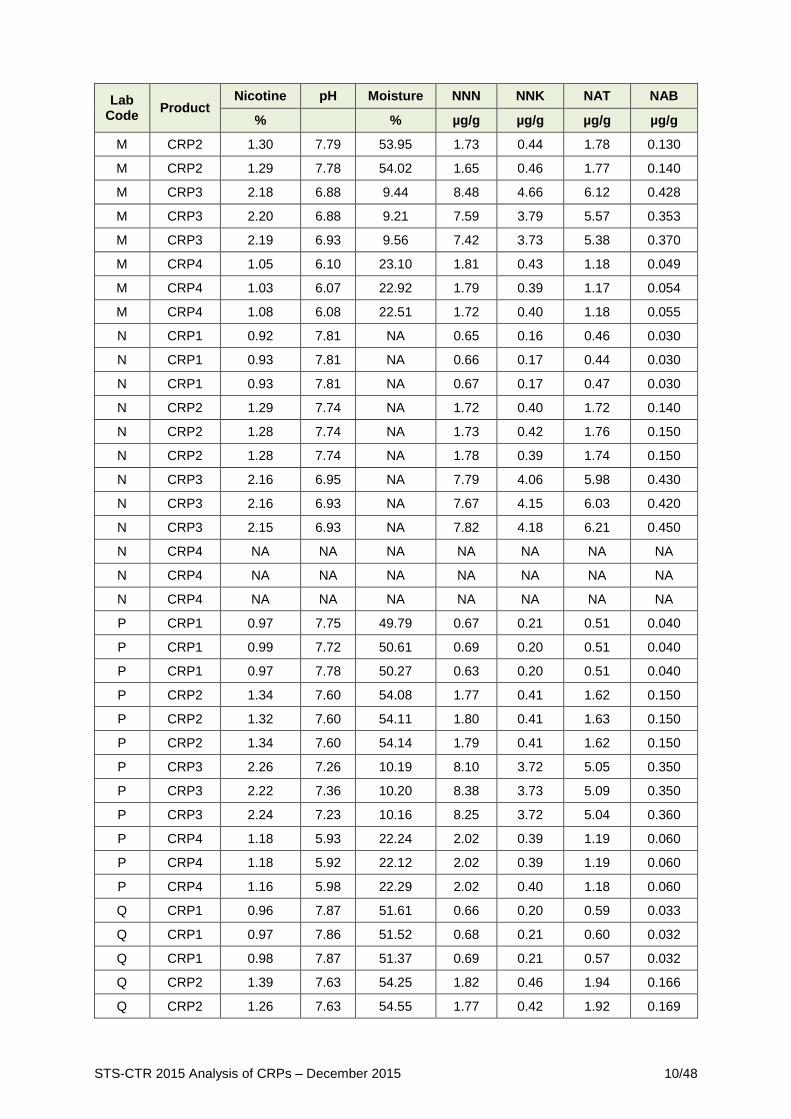
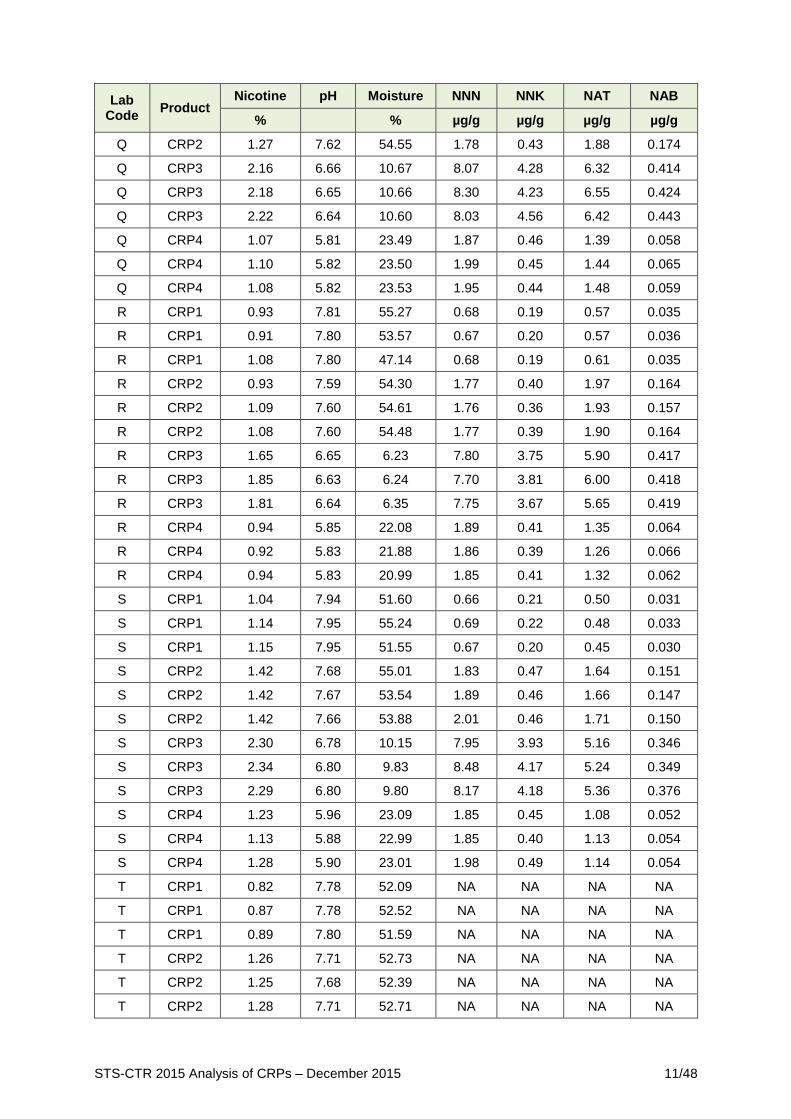
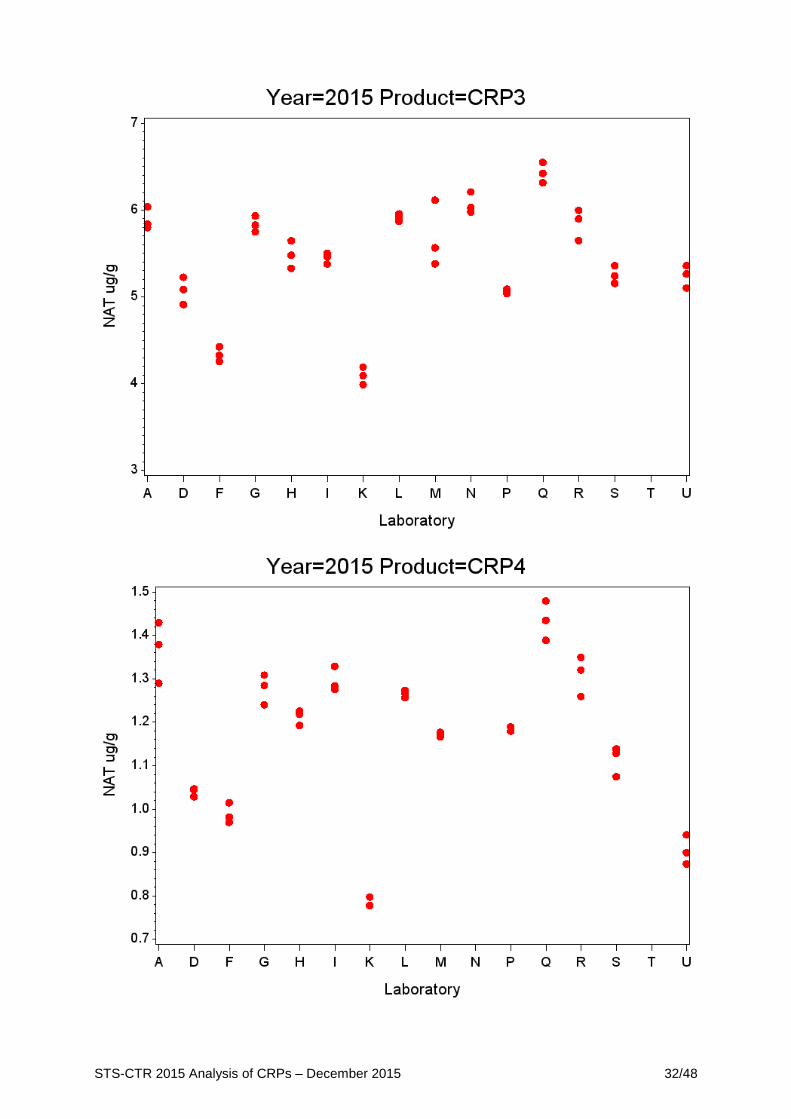
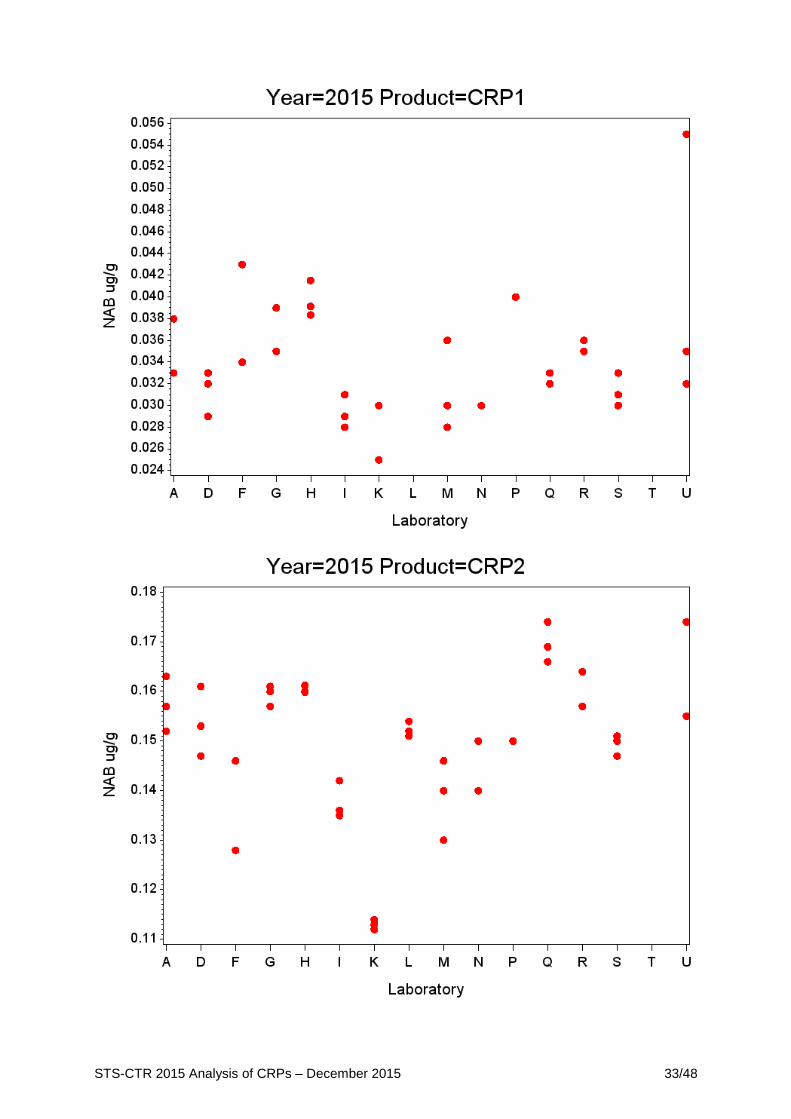
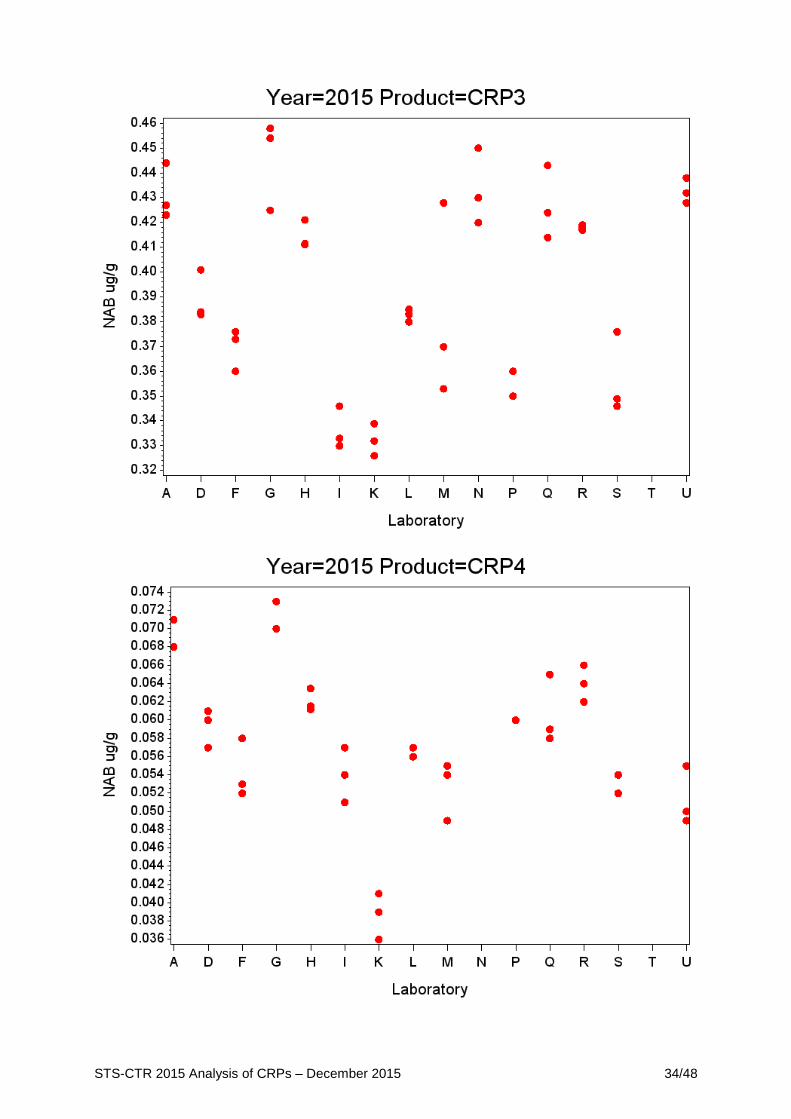
4. Data – Raw
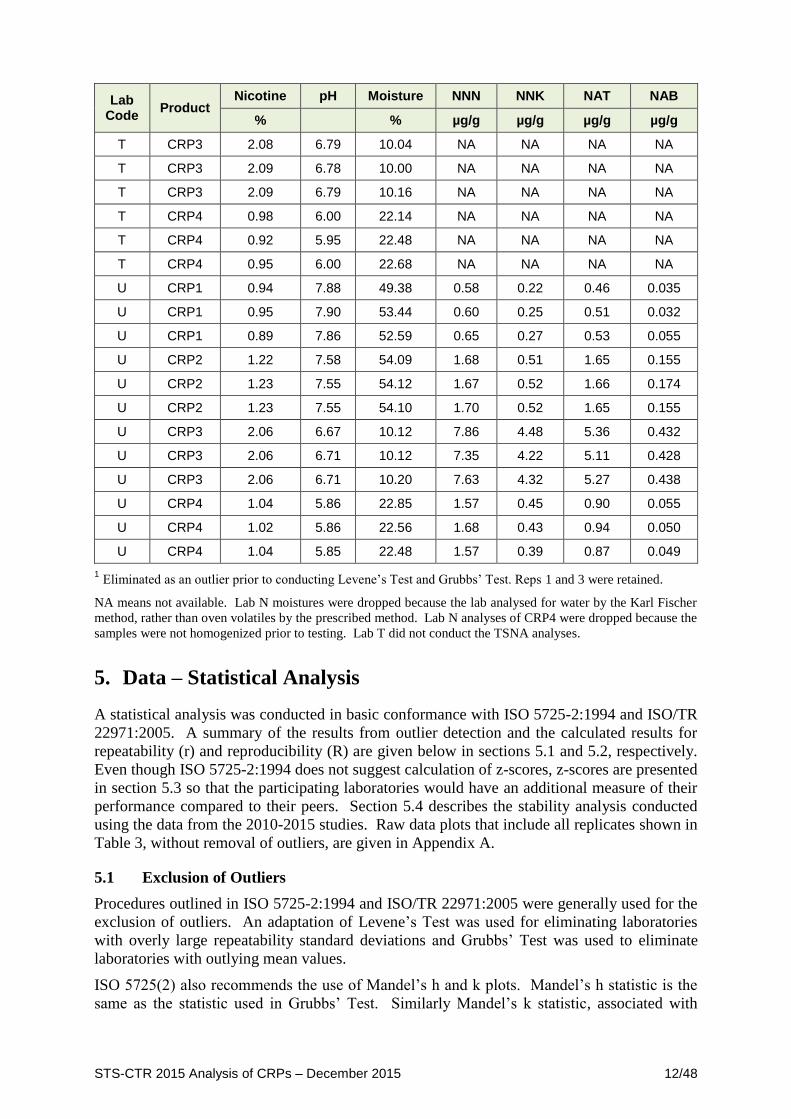
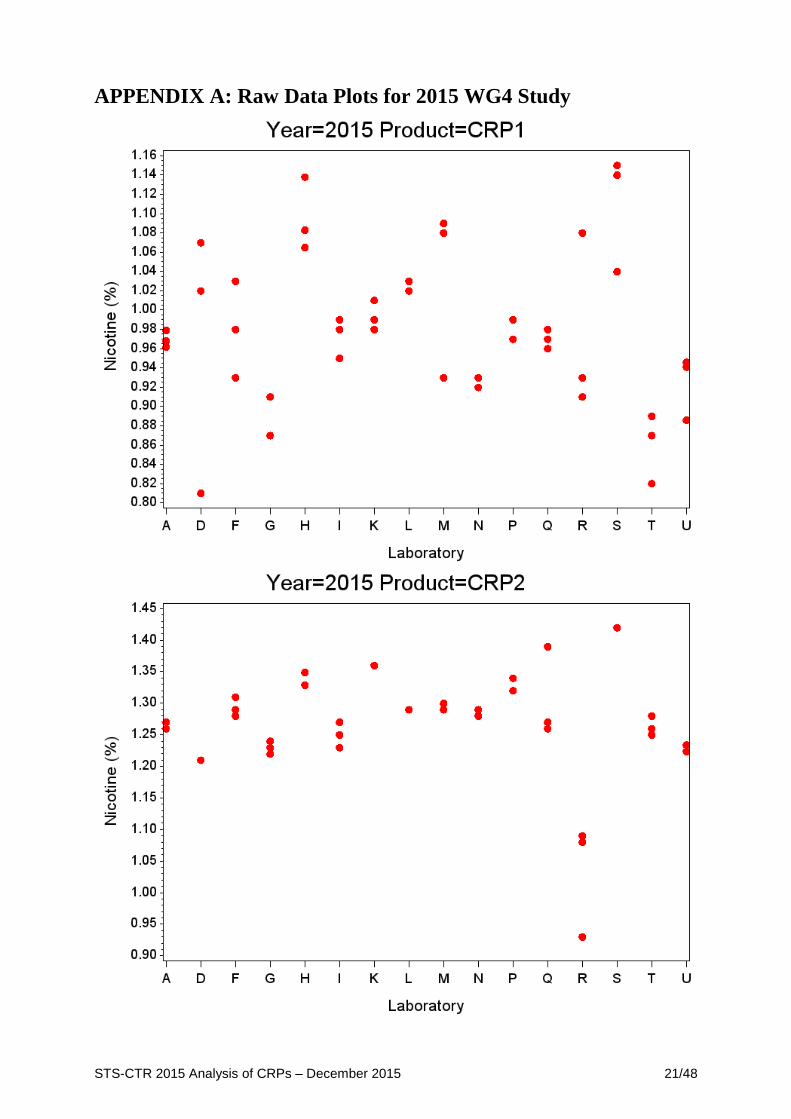
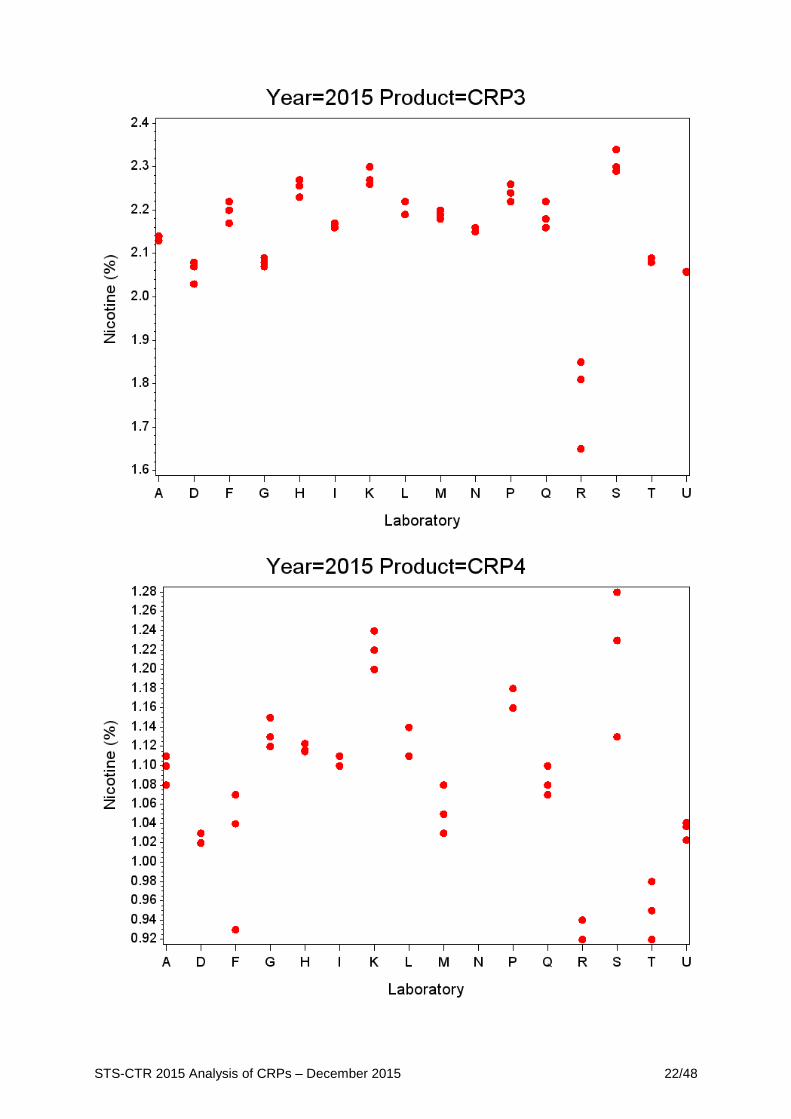
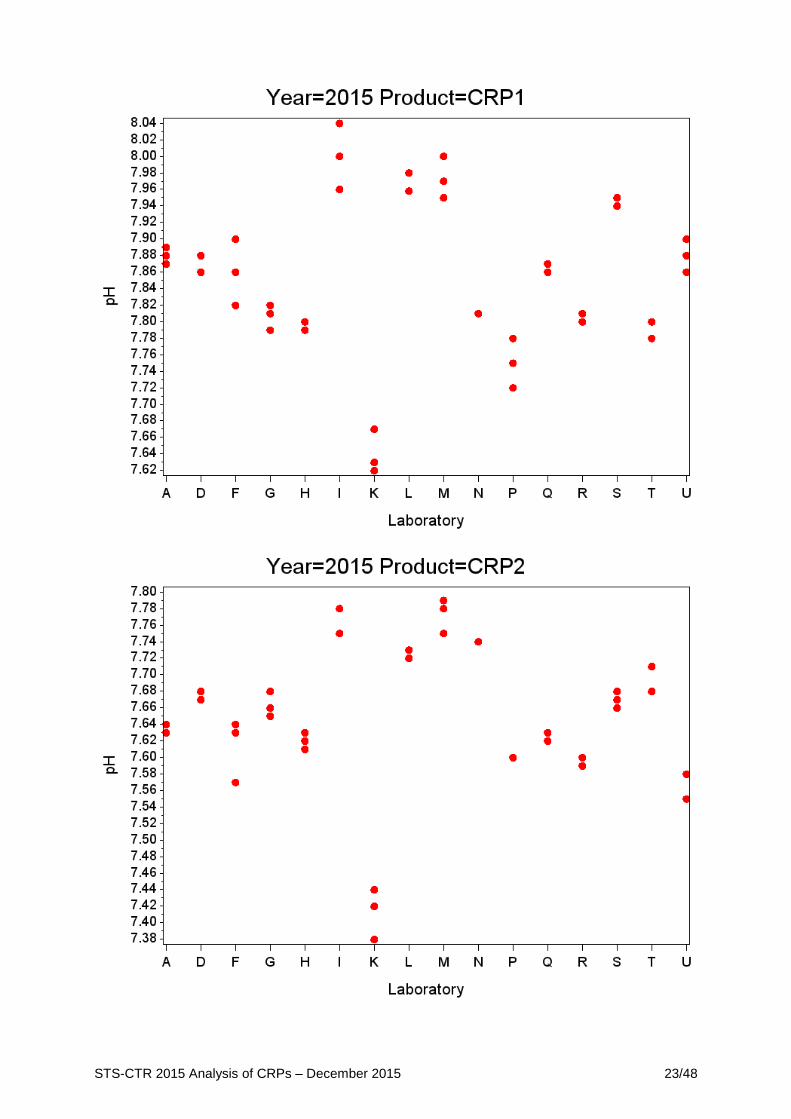
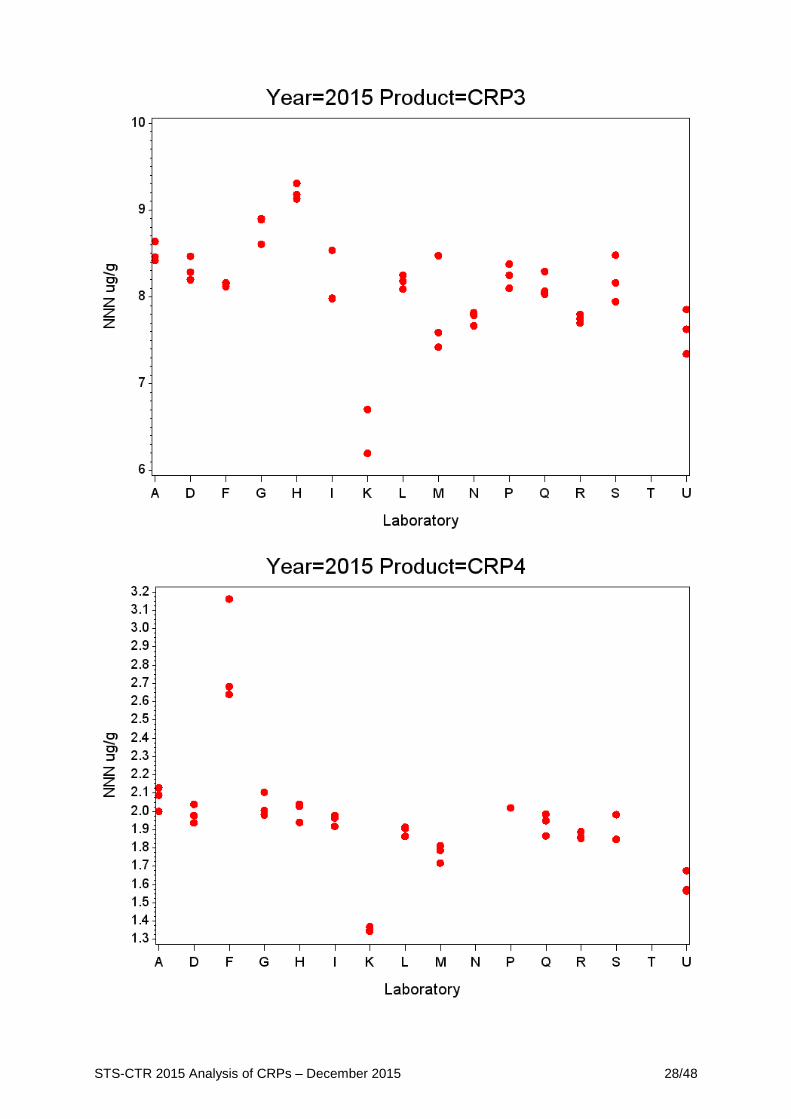
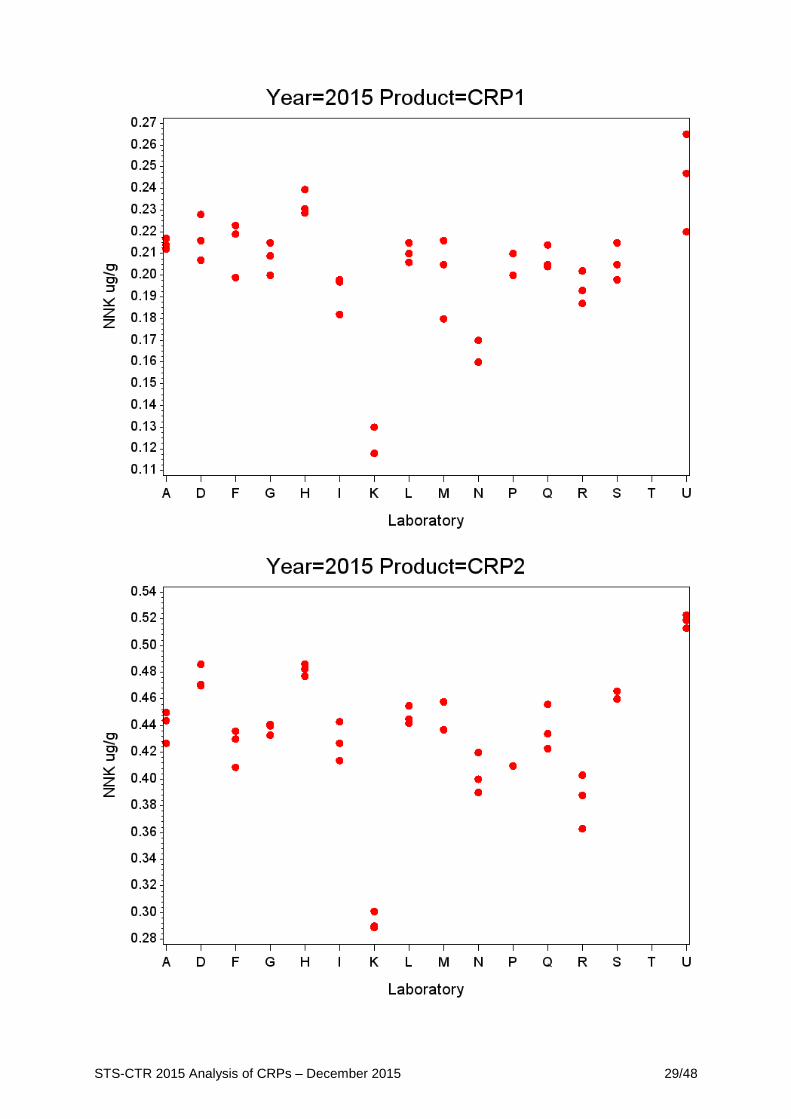
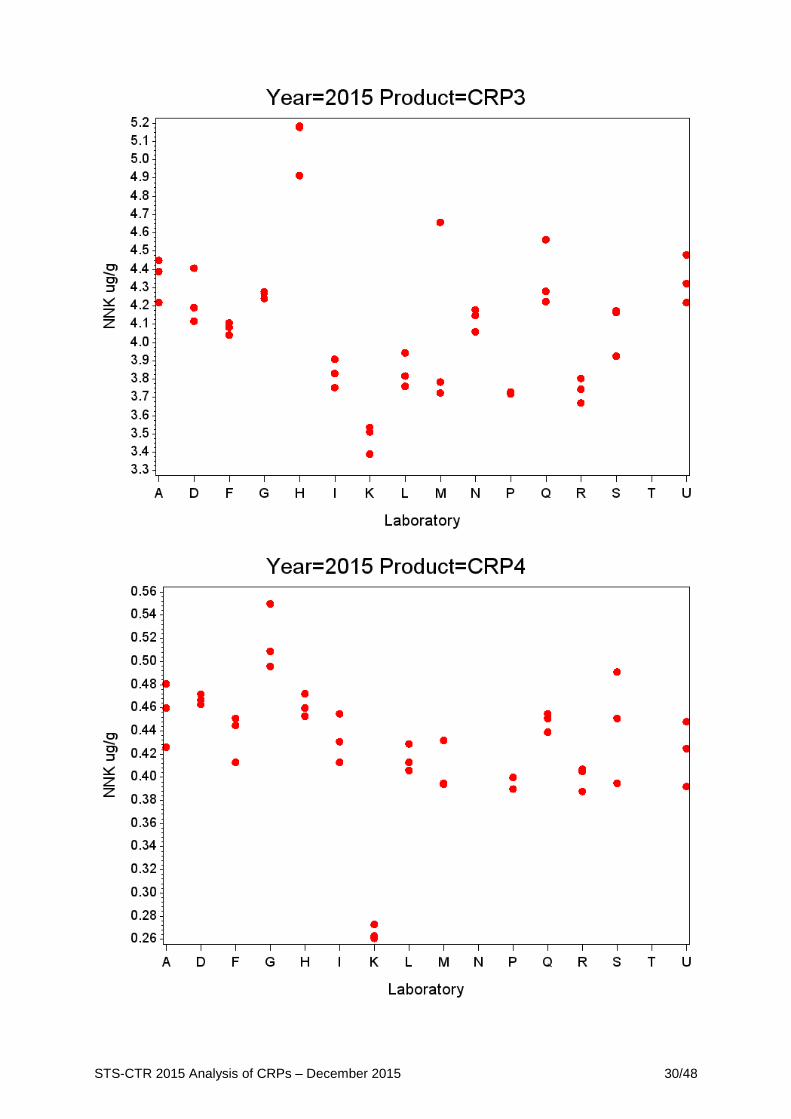
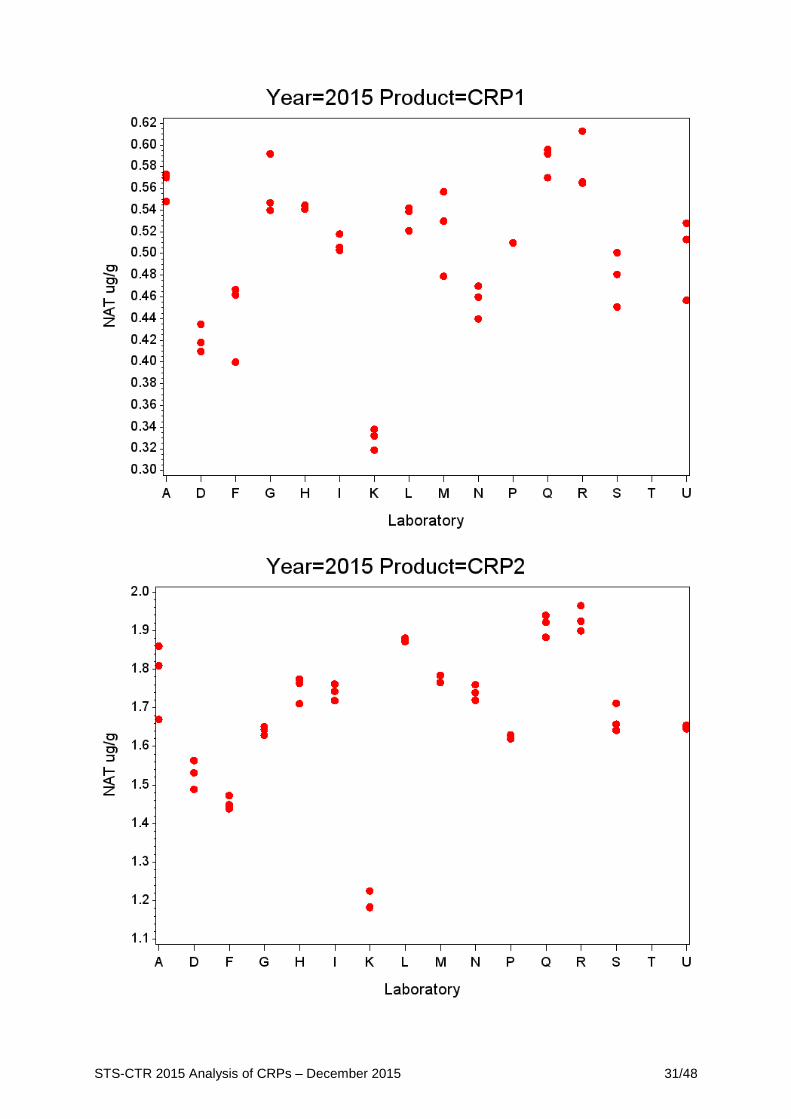
The full data set for the 2015 study is listed in Table 3. The results are presented on an as-is
basis, without correction for moisture. Each analysis includes three replicates. Raw data
plots that include all replicates, without removal of outliers, are given in Appendix A.
As mentioned above, several data sets were removed from the study due to significant
deviations from the study protocol and the fact that the data were preliminarily identified as
outlying data. Those data are included in Table 3, but were eliminated prior to analysis.
Table 3: Full Data Set for 2015 WG4 Study (results are presented on an as-is basis)
Lab Code
Product Nicotine pH Moisture NNN NNK NAT NAB
% % µg/g µg/g µg/g µg/g
A CRP1 0.96 7.87 49.98 0.72 0.22 0.57 0.033
A CRP1 0.98 7.88 49.94 0.70 0.21 0.55 0.038
A CRP1 0.97 7.89 50.00 0.72 0.21 0.57 0.038
A CRP2 1.26 7.64 54.57 1.94 0.43 1.81 0.163
A CRP2 1.27 7.64 54.68 1.85 0.45 1.67 0.157
A CRP2 1.26 7.63 54.53 1.90 0.44 1.86 0.152
A CRP3 2.13 6.79 10.87 8.64 4.39 5.84 0.444
A CRP3 2.14 6.74 10.79 8.42 4.22 5.80 0.423
A CRP3 2.13 6.72 10.63 8.46 4.45 6.04 0.427
A CRP4 1.08 5.85 22.11 2.13 0.48 1.43 0.071
A CRP4 1.11 5.82 22.13 2.09 0.46 1.38 0.068
A CRP4 1.10 5.82 22.15 2.00 0.43 1.29 0.071
D CRP1 1.07 7.88 52.11 0.61 0.21 0.41 0.032
D CRP1 0.811
7.86 50.31 0.70 0.23 0.44 0.033
D CRP1 1.02 7.88 52.27 0.65 0.22 0.42 0.029
D CRP2 1.21 7.68 54.38 1.76 0.47 1.49 0.147
D CRP2 1.21 7.67 54.36 1.89 0.49 1.53 0.161
D CRP2 1.21 7.68 54.21 1.92 0.47 1.56 0.153
D CRP3 2.07 6.76 9.50 8.20 4.41 5.23 0.401
D CRP3 2.08 6.78 9.60 8.29 4.19 4.91 0.383
D CRP3 2.03 6.77 9.40 8.47 4.12 5.09 0.384
D CRP4 1.02 5.88 21.29 1.98 0.47 1.05 0.057
D CRP4 1.03 5.91 21.19 1.94 0.46 1.03 0.061
D CRP4 1.03 5.90 21.10 2.04 0.47 1.05 0.060
F CRP1 1.03 7.82 51.82 0.86 0.22 0.46 0.034
F CRP1 0.98 7.86 51.57 0.85 0.22 0.47 0.043
STS-CTR 2015 Analysis of CRPs – December 2015 8/48
Lab Code
Product Nicotine pH Moisture NNN NNK NAT NAB
% % µg/g µg/g µg/g µg/g
F CRP1 0.93 7.90 51.72 0.80 0.20 0.40 0.034
F CRP2 1.29 7.63 54.60 1.94 0.43 1.47 0.146
F CRP2 1.31 7.64 54.54 1.99 0.44 1.45 0.128
F CRP2 1.28 7.57 54.29 1.99 0.41 1.44 0.128
F CRP3 2.17 6.75 10.14 8.12 4.11 4.26 0.373
F CRP3 2.22 6.71 10.12 8.16 4.09 4.33 0.360
F CRP3 2.20 6.74 10.16 8.15 4.04 4.43 0.376
F CRP4 0.93 5.82 22.09 2.64 0.41 0.98 0.053
F CRP4 1.04 5.84 21.93 3.16 0.45 1.02 0.052
F CRP4 1.07 5.88 21.91 2.68 0.45 0.97 0.058
G CRP1 0.87 7.79 52.06 0.72 0.20 0.54 0.035
G CRP1 0.91 7.81 51.99 0.71 0.22 0.59 0.039
G CRP1 0.91 7.82 52.42 0.69 0.21 0.55 0.039
G CRP2 1.24 7.68 54.48 1.81 0.44 1.64 0.161
G CRP2 1.22 7.66 54.36 1.70 0.44 1.65 0.157
G CRP2 1.23 7.65 54.42 1.74 0.43 1.63 0.160
G CRP3 2.09 6.72 10.18 8.91 4.27 5.93 0.454
G CRP3 2.08 6.72 10.16 8.61 4.28 5.83 0.458
G CRP3 2.07 6.72 10.09 8.89 4.24 5.75 0.425
G CRP4 1.15 5.93 21.98 1.98 0.50 1.31 0.070
G CRP4 1.12 5.91 21.92 2.11 0.55 1.29 0.073
G CRP4 1.13 5.92 21.85 2.01 0.51 1.24 0.070
H CRP1 1.07 7.79 49.22 0.70 0.23 0.54 0.038
H CRP1 1.08 7.80 49.07 0.72 0.24 0.54 0.039
H CRP1 1.14 7.79 49.58 0.73 0.23 0.54 0.042
H CRP2 1.35 7.61 54.28 2.03 0.49 1.78 0.160
H CRP2 1.35 7.63 54.25 1.96 0.48 1.71 0.161
H CRP2 1.33 7.62 54.08 1.98 0.48 1.76 0.160
H CRP3 2.23 6.70 10.49 9.31 4.92 5.48 0.411
H CRP3 2.27 6.71 10.63 9.13 5.18 5.65 0.421
H CRP3 2.26 6.73 10.54 9.18 5.19 5.33 0.412
H CRP4 1.12 5.87 22.78 2.03 0.45 1.23 0.063
H CRP4 1.12 5.89 22.81 1.94 0.46 1.22 0.062
H CRP4 1.12 5.92 22.88 2.04 0.47 1.19 0.061
I CRP1 0.95 8.04 51.04 0.63 0.20 0.50 0.028
I CRP1 0.98 8.00 51.67 0.62 0.20 0.52 0.029
I CRP1 0.99 7.96 50.98 0.61 0.18 0.51 0.031
STS-CTR 2015 Analysis of CRPs – December 2015 9/48
Lab Code
Product Nicotine pH Moisture NNN NNK NAT NAB
% % µg/g µg/g µg/g µg/g
I CRP2 1.23 7.78 54.47 1.77 0.43 1.76 0.135
I CRP2 1.25 7.75 54.67 1.76 0.44 1.72 0.142
I CRP2 1.27 7.75 54.63 1.78 0.41 1.74 0.136
I CRP3 2.17 6.80 9.90 7.99 3.83 5.46 0.330
I CRP3 2.16 6.80 9.91 8.54 3.91 5.38 0.346
I CRP3 2.17 6.80 9.89 7.98 3.75 5.50 0.333
I CRP4 1.11 5.94 22.87 1.92 0.41 1.33 0.054
I CRP4 1.10 5.95 22.88 1.98 0.43 1.28 0.051
I CRP4 1.11 5.94 22.68 1.97 0.46 1.28 0.057
K CRP1 0.98 7.67 54.60 0.49 0.13 0.34 0.025
K CRP1 1.01 7.63 51.74 0.50 0.12 0.33 0.030
K CRP1 0.99 7.62 53.10 0.47 0.12 0.32 0.025
K CRP2 1.36 7.38 54.90 1.40 0.30 1.23 0.112
K CRP2 1.36 7.44 54.90 1.35 0.29 1.18 0.114
K CRP2 1.36 7.42 54.70 1.38 0.29 1.18 0.113
K CRP3 2.30 6.68 11.90 6.70 3.54 4.19 0.339
K CRP3 2.27 6.71 12.10 6.20 3.51 4.09 0.332
K CRP3 2.26 6.70 12.20 6.71 3.39 3.99 0.326
K CRP4 1.22 5.87 22.80 1.37 0.27 0.78 0.041
K CRP4 1.24 5.93 22.80 1.35 0.26 0.80 0.039
K CRP4 1.20 5.89 22.80 1.34 0.26 0.78 0.036
L CRP1 1.02 7.96 51.35 0.65 0.22 0.54 <LOQ
L CRP1 1.03 7.98 51.50 0.66 0.21 0.52 <LOQ
L CRP1 1.03 7.98 51.59 0.68 0.21 0.54 <LOQ
L CRP2 1.29 7.72 54.36 1.80 0.44 1.88 0.154
L CRP2 1.29 7.73 54.58 1.79 0.45 1.87 0.151
L CRP2 1.29 7.72 54.42 1.80 0.46 1.88 0.152
L CRP3 2.19 6.72 9.50 8.09 3.94 5.96 0.385
L CRP3 2.19 6.71 9.34 8.25 3.76 5.87 0.383
L CRP3 2.22 6.73 9.15 8.18 3.82 5.91 0.380
L CRP4 1.11 5.96 22.38 1.86 0.41 1.26 0.056
L CRP4 1.11 5.94 22.32 1.91 0.43 1.27 0.056
L CRP4 1.14 5.94 22.31 1.91 0.41 1.27 0.057
M CRP1 1.09 8.00 46.46 0.64 0.21 0.53 0.030
M CRP1 1.08 7.97 48.81 0.68 0.22 0.56 0.036
M CRP1 0.93 7.95 45.93 0.57 0.18 0.48 0.028
M CRP2 1.30 7.75 54.45 1.63 0.44 1.79 0.146
STS-CTR 2015 Analysis of CRPs – December 2015 10/48
Lab Code
Product Nicotine pH Moisture NNN NNK NAT NAB
% % µg/g µg/g µg/g µg/g
M CRP2 1.30 7.79 53.95 1.73 0.44 1.78 0.130
M CRP2 1.29 7.78 54.02 1.65 0.46 1.77 0.140
M CRP3 2.18 6.88 9.44 8.48 4.66 6.12 0.428
M CRP3 2.20 6.88 9.21 7.59 3.79 5.57 0.353
M CRP3 2.19 6.93 9.56 7.42 3.73 5.38 0.370
M CRP4 1.05 6.10 23.10 1.81 0.43 1.18 0.049
M CRP4 1.03 6.07 22.92 1.79 0.39 1.17 0.054
M CRP4 1.08 6.08 22.51 1.72 0.40 1.18 0.055
N CRP1 0.92 7.81 NA 0.65 0.16 0.46 0.030
N CRP1 0.93 7.81 NA 0.66 0.17 0.44 0.030
N CRP1 0.93 7.81 NA 0.67 0.17 0.47 0.030
N CRP2 1.29 7.74 NA 1.72 0.40 1.72 0.140
N CRP2 1.28 7.74 NA 1.73 0.42 1.76 0.150
N CRP2 1.28 7.74 NA 1.78 0.39 1.74 0.150
N CRP3 2.16 6.95 NA 7.79 4.06 5.98 0.430
N CRP3 2.16 6.93 NA 7.67 4.15 6.03 0.420
N CRP3 2.15 6.93 NA 7.82 4.18 6.21 0.450
N CRP4 NA NA NA NA NA NA NA
N CRP4 NA NA NA NA NA NA NA
N CRP4 NA NA NA NA NA NA NA
P CRP1 0.97 7.75 49.79 0.67 0.21 0.51 0.040
P CRP1 0.99 7.72 50.61 0.69 0.20 0.51 0.040
P CRP1 0.97 7.78 50.27 0.63 0.20 0.51 0.040
P CRP2 1.34 7.60 54.08 1.77 0.41 1.62 0.150
P CRP2 1.32 7.60 54.11 1.80 0.41 1.63 0.150
P CRP2 1.34 7.60 54.14 1.79 0.41 1.62 0.150
P CRP3 2.26 7.26 10.19 8.10 3.72 5.05 0.350
P CRP3 2.22 7.36 10.20 8.38 3.73 5.09 0.350
P CRP3 2.24 7.23 10.16 8.25 3.72 5.04 0.360
P CRP4 1.18 5.93 22.24 2.02 0.39 1.19 0.060
P CRP4 1.18 5.92 22.12 2.02 0.39 1.19 0.060
P CRP4 1.16 5.98 22.29 2.02 0.40 1.18 0.060
Q CRP1 0.96 7.87 51.61 0.66 0.20 0.59 0.033
Q CRP1 0.97 7.86 51.52 0.68 0.21 0.60 0.032
Q CRP1 0.98 7.87 51.37 0.69 0.21 0.57 0.032
Q CRP2 1.39 7.63 54.25 1.82 0.46 1.94 0.166
Q CRP2 1.26 7.63 54.55 1.77 0.42 1.92 0.169
STS-CTR 2015 Analysis of CRPs – December 2015 11/48
Lab Code
Product Nicotine pH Moisture NNN NNK NAT NAB
% % µg/g µg/g µg/g µg/g
Q CRP2 1.27 7.62 54.55 1.78 0.43 1.88 0.174
Q CRP3 2.16 6.66 10.67 8.07 4.28 6.32 0.414
Q CRP3 2.18 6.65 10.66 8.30 4.23 6.55 0.424
Q CRP3 2.22 6.64 10.60 8.03 4.56 6.42 0.443
Q CRP4 1.07 5.81 23.49 1.87 0.46 1.39 0.058
Q CRP4 1.10 5.82 23.50 1.99 0.45 1.44 0.065
Q CRP4 1.08 5.82 23.53 1.95 0.44 1.48 0.059
R CRP1 0.93 7.81 55.27 0.68 0.19 0.57 0.035
R CRP1 0.91 7.80 53.57 0.67 0.20 0.57 0.036
R CRP1 1.08 7.80 47.14 0.68 0.19 0.61 0.035
R CRP2 0.93 7.59 54.30 1.77 0.40 1.97 0.164
R CRP2 1.09 7.60 54.61 1.76 0.36 1.93 0.157
R CRP2 1.08 7.60 54.48 1.77 0.39 1.90 0.164
R CRP3 1.65 6.65 6.23 7.80 3.75 5.90 0.417
R CRP3 1.85 6.63 6.24 7.70 3.81 6.00 0.418
R CRP3 1.81 6.64 6.35 7.75 3.67 5.65 0.419
R CRP4 0.94 5.85 22.08 1.89 0.41 1.35 0.064
R CRP4 0.92 5.83 21.88 1.86 0.39 1.26 0.066
R CRP4 0.94 5.83 20.99 1.85 0.41 1.32 0.062
S CRP1 1.04 7.94 51.60 0.66 0.21 0.50 0.031
S CRP1 1.14 7.95 55.24 0.69 0.22 0.48 0.033
S CRP1 1.15 7.95 51.55 0.67 0.20 0.45 0.030
S CRP2 1.42 7.68 55.01 1.83 0.47 1.64 0.151
S CRP2 1.42 7.67 53.54 1.89 0.46 1.66 0.147
S CRP2 1.42 7.66 53.88 2.01 0.46 1.71 0.150
S CRP3 2.30 6.78 10.15 7.95 3.93 5.16 0.346
S CRP3 2.34 6.80 9.83 8.48 4.17 5.24 0.349
S CRP3 2.29 6.80 9.80 8.17 4.18 5.36 0.376
S CRP4 1.23 5.96 23.09 1.85 0.45 1.08 0.052
S CRP4 1.13 5.88 22.99 1.85 0.40 1.13 0.054
S CRP4 1.28 5.90 23.01 1.98 0.49 1.14 0.054
T CRP1 0.82 7.78 52.09 NA NA NA NA
T CRP1 0.87 7.78 52.52 NA NA NA NA
T CRP1 0.89 7.80 51.59 NA NA NA NA
T CRP2 1.26 7.71 52.73 NA NA NA NA
T CRP2 1.25 7.68 52.39 NA NA NA NA
T CRP2 1.28 7.71 52.71 NA NA NA NA
STS-CTR 2015 Analysis of CRPs – December 2015 12/48
Lab Code
Product Nicotine pH Moisture NNN NNK NAT NAB
% % µg/g µg/g µg/g µg/g
T CRP3 2.08 6.79 10.04 NA NA NA NA
T CRP3 2.09 6.78 10.00 NA NA NA NA
T CRP3 2.09 6.79 10.16 NA NA NA NA
T CRP4 0.98 6.00 22.14 NA NA NA NA
T CRP4 0.92 5.95 22.48 NA NA NA NA
T CRP4 0.95 6.00 22.68 NA NA NA NA
U CRP1 0.94 7.88 49.38 0.58 0.22 0.46 0.035
U CRP1 0.95 7.90 53.44 0.60 0.25 0.51 0.032
U CRP1 0.89 7.86 52.59 0.65 0.27 0.53 0.055
U CRP2 1.22 7.58 54.09 1.68 0.51 1.65 0.155
U CRP2 1.23 7.55 54.12 1.67 0.52 1.66 0.174
U CRP2 1.23 7.55 54.10 1.70 0.52 1.65 0.155
U CRP3 2.06 6.67 10.12 7.86 4.48 5.36 0.432
U CRP3 2.06 6.71 10.12 7.35 4.22 5.11 0.428
U CRP3 2.06 6.71 10.20 7.63 4.32 5.27 0.438
U CRP4 1.04 5.86 22.85 1.57 0.45 0.90 0.055
U CRP4 1.02 5.86 22.56 1.68 0.43 0.94 0.050
U CRP4 1.04 5.85 22.48 1.57 0.39 0.87 0.049
1 Eliminated as an outlier prior to conducting Levene’s Test and Grubbs’ Test. Reps 1 and 3 were retained.
NA means not available. Lab N moistures were dropped because the lab analysed for water by the Karl Fischer
method, rather than oven volatiles by the prescribed method. Lab N analyses of CRP4 were dropped because the
samples were not homogenized prior to testing. Lab T did not conduct the TSNA analyses.
5. Data – Statistical Analysis
A statistical analysis was conducted in basic conformance with ISO 5725-2:1994 and ISO/TR
22971:2005. A summary of the results from outlier detection and the calculated results for
repeatability (r) and reproducibility (R) are given below in sections 5.1 and 5.2, respectively.
Even though ISO 5725-2:1994 does not suggest calculation of z-scores, z-scores are presented
in section 5.3 so that the participating laboratories would have an additional measure of their
performance compared to their peers. Section 5.4 describes the stability analysis conducted
using the data from the 2010-2015 studies. Raw data plots that include all replicates shown in
Table 3, without removal of outliers, are given in Appendix A.
5.1 Exclusion of Outliers
Procedures outlined in ISO 5725-2:1994 and ISO/TR 22971:2005 were generally used for the
exclusion of outliers. An adaptation of Levene’s Test was used for eliminating laboratories
with overly large repeatability standard deviations and Grubbs’ Test was used to eliminate
laboratories with outlying mean values.
ISO 5725(2) also recommends the use of Mandel’s h and k plots. Mandel’s h statistic is the
same as the statistic used in Grubbs’ Test. Similarly Mandel’s k statistic, associated with
STS-CTR 2015 Analysis of CRPs – December 2015 13/48
within lab standard deviation, is statistically equivalent to the c-value calculated in Cochran’s
Test ( cnk labs ). However, the critical values associated with Mandel’s h and k statistics do
not make allowance for multiple testing and can therefore, give a false impression of
statistical significance. Thus, Mandel’s h and k statistics do not add fundamentally new
information and may lead to incorrect conclusions. For those reasons, we do not include
Mandel’s h and k plots.
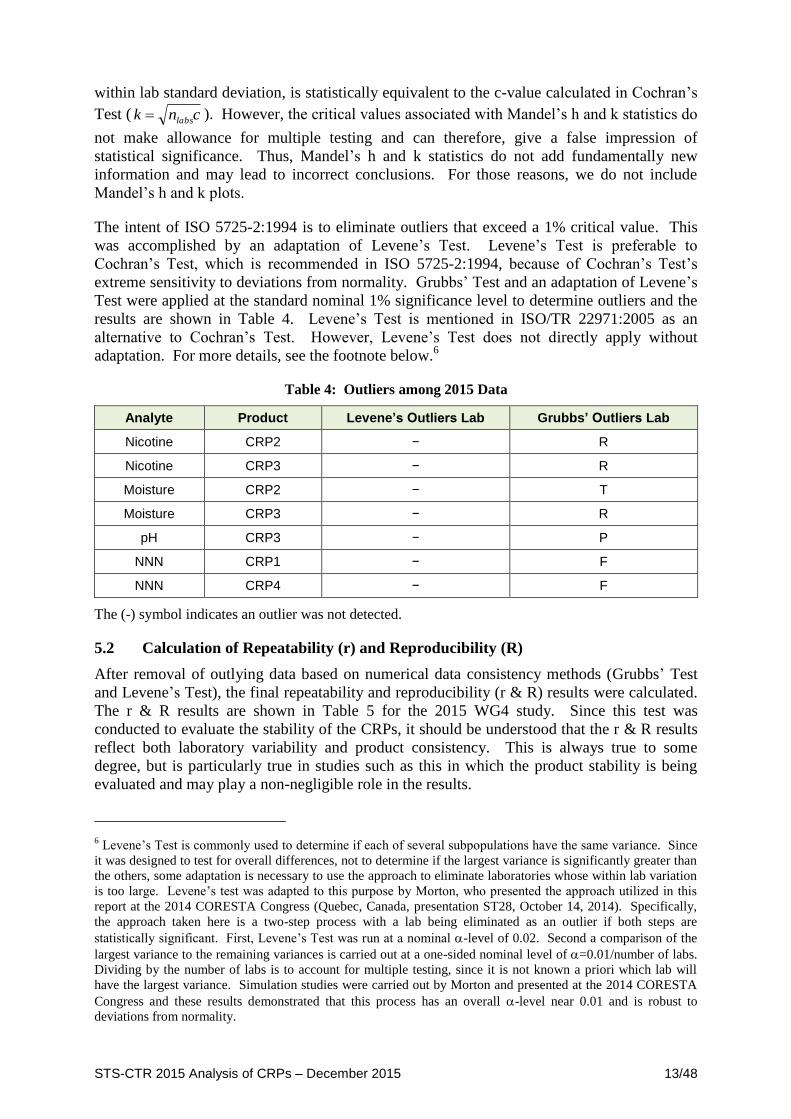
The intent of ISO 5725-2:1994 is to eliminate outliers that exceed a 1% critical value. This
was accomplished by an adaptation of Levene’s Test. Levene’s Test is preferable to
Cochran’s Test, which is recommended in ISO 5725-2:1994, because of Cochran’s Test’s
extreme sensitivity to deviations from normality. Grubbs’ Test and an adaptation of Levene’s
Test were applied at the standard nominal 1% significance level to determine outliers and the
results are shown in Table 4. Levene’s Test is mentioned in ISO/TR 22971:2005 as an
alternative to Cochran’s Test. However, Levene’s Test does not directly apply without
adaptation. For more details, see the footnote below.6
Table 4: Outliers among 2015 Data
Analyte Product Levene’s Outliers Lab Grubbs’ Outliers Lab
Nicotine CRP2 − R
Nicotine CRP3 − R
Moisture CRP2 − T
Moisture CRP3 − R
pH CRP3 − P
NNN CRP1 − F
NNN CRP4 − F
The (-) symbol indicates an outlier was not detected.
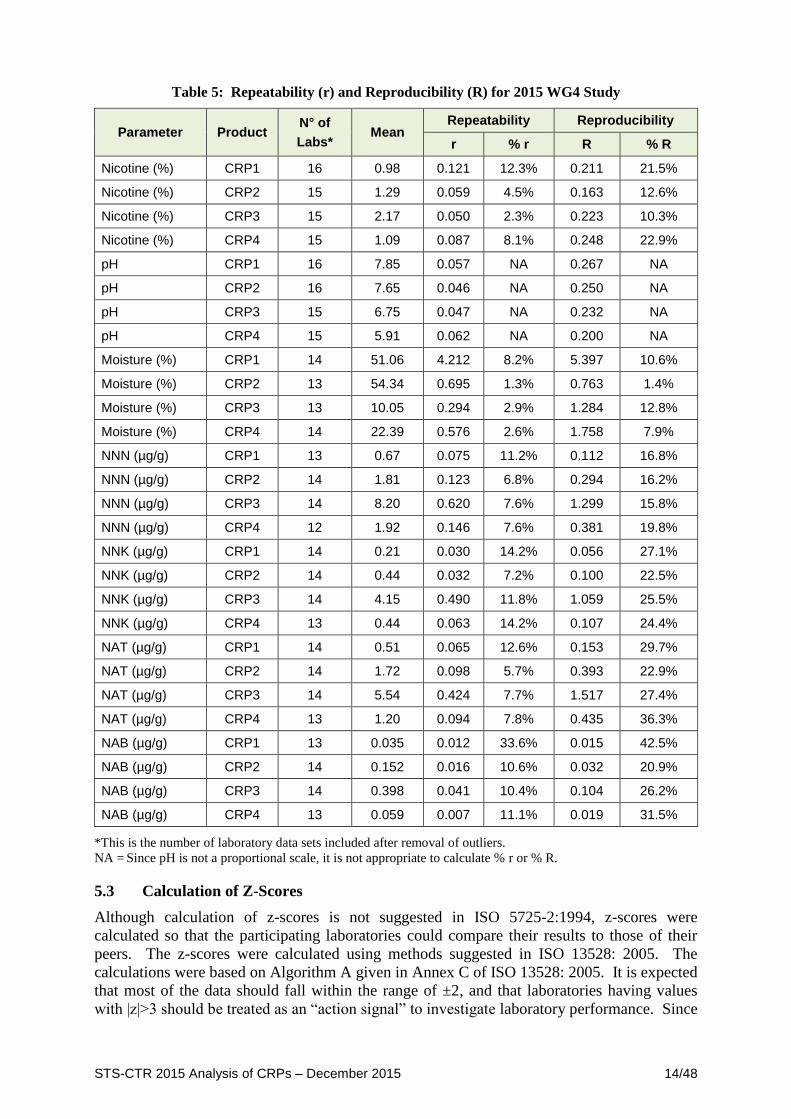
5.2 Calculation of Repeatability (r) and Reproducibility (R)
After removal of outlying data based on numerical data consistency methods (Grubbs’ Test
and Levene’s Test), the final repeatability and reproducibility (r & R) results were calculated.
The r & R results are shown in Table 5 for the 2015 WG4 study. Since this test was
conducted to evaluate the stability of the CRPs, it should be understood that the r & R results
reflect both laboratory variability and product consistency. This is always true to some
degree, but is particularly true in studies such as this in which the product stability is being
evaluated and may play a non-negligible role in the results.
6 Levene’s Test is commonly used to determine if each of several subpopulations have the same variance. Since
it was designed to test for overall differences, not to determine if the largest variance is significantly greater than
the others, some adaptation is necessary to use the approach to eliminate laboratories whose within lab variation
is too large. Levene’s test was adapted to this purpose by Morton, who presented the approach utilized in this
report at the 2014 CORESTA Congress (Quebec, Canada, presentation ST28, October 14, 2014). Specifically,
the approach taken here is a two-step process with a lab being eliminated as an outlier if both steps are
statistically significant. First, Levene’s Test was run at a nominal -level of 0.02. Second a comparison of the
largest variance to the remaining variances is carried out at a one-sided nominal level of =0.01/number of labs.
Dividing by the number of labs is to account for multiple testing, since it is not known a priori which lab will
have the largest variance. Simulation studies were carried out by Morton and presented at the 2014 CORESTA
Congress and these results demonstrated that this process has an overall -level near 0.01 and is robust to
deviations from normality.
STS-CTR 2015 Analysis of CRPs – December 2015 14/48
Table 5: Repeatability (r) and Reproducibility (R) for 2015 WG4 Study
Parameter Product N° of
Labs* Mean
Repeatability Reproducibility
r % r R % R
Nicotine (%) CRP1 16 0.98 0.121 12.3% 0.211 21.5%
Nicotine (%) CRP2 15 1.29 0.059 4.5% 0.163 12.6%
Nicotine (%) CRP3 15 2.17 0.050 2.3% 0.223 10.3%
Nicotine (%) CRP4 15 1.09 0.087 8.1% 0.248 22.9%
pH CRP1 16 7.85 0.057 NA 0.267 NA
pH CRP2 16 7.65 0.046 NA 0.250 NA
pH CRP3 15 6.75 0.047 NA 0.232 NA
pH CRP4 15 5.91 0.062 NA 0.200 NA
Moisture (%) CRP1 14 51.06 4.212 8.2% 5.397 10.6%
Moisture (%) CRP2 13 54.34 0.695 1.3% 0.763 1.4%
Moisture (%) CRP3 13 10.05 0.294 2.9% 1.284 12.8%
Moisture (%) CRP4 14 22.39 0.576 2.6% 1.758 7.9%
NNN (µg/g) CRP1 13 0.67 0.075 11.2% 0.112 16.8%
NNN (µg/g) CRP2 14 1.81 0.123 6.8% 0.294 16.2%
NNN (µg/g) CRP3 14 8.20 0.620 7.6% 1.299 15.8%
NNN (µg/g) CRP4 12 1.92 0.146 7.6% 0.381 19.8%
NNK (µg/g) CRP1 14 0.21 0.030 14.2% 0.056 27.1%
NNK (µg/g) CRP2 14 0.44 0.032 7.2% 0.100 22.5%
NNK (µg/g) CRP3 14 4.15 0.490 11.8% 1.059 25.5%
NNK (µg/g) CRP4 13 0.44 0.063 14.2% 0.107 24.4%
NAT (µg/g) CRP1 14 0.51 0.065 12.6% 0.153 29.7%
NAT (µg/g) CRP2 14 1.72 0.098 5.7% 0.393 22.9%
NAT (µg/g) CRP3 14 5.54 0.424 7.7% 1.517 27.4%
NAT (µg/g) CRP4 13 1.20 0.094 7.8% 0.435 36.3%
NAB (µg/g) CRP1 13 0.035 0.012 33.6% 0.015 42.5%
NAB (µg/g) CRP2 14 0.152 0.016 10.6% 0.032 20.9%
NAB (µg/g) CRP3 14 0.398 0.041 10.4% 0.104 26.2%
NAB (µg/g) CRP4 13 0.059 0.007 11.1% 0.019 31.5%
*This is the number of laboratory data sets included after removal of outliers.
NA = Since pH is not a proportional scale, it is not appropriate to calculate % r or % R.
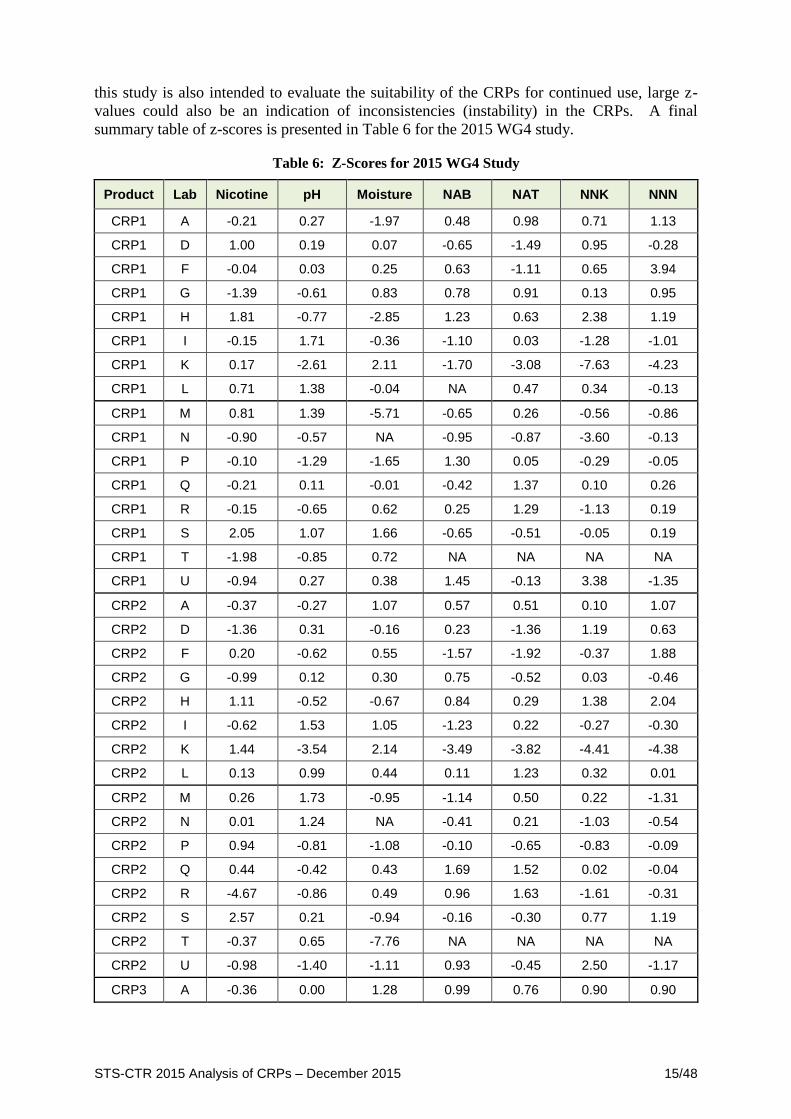
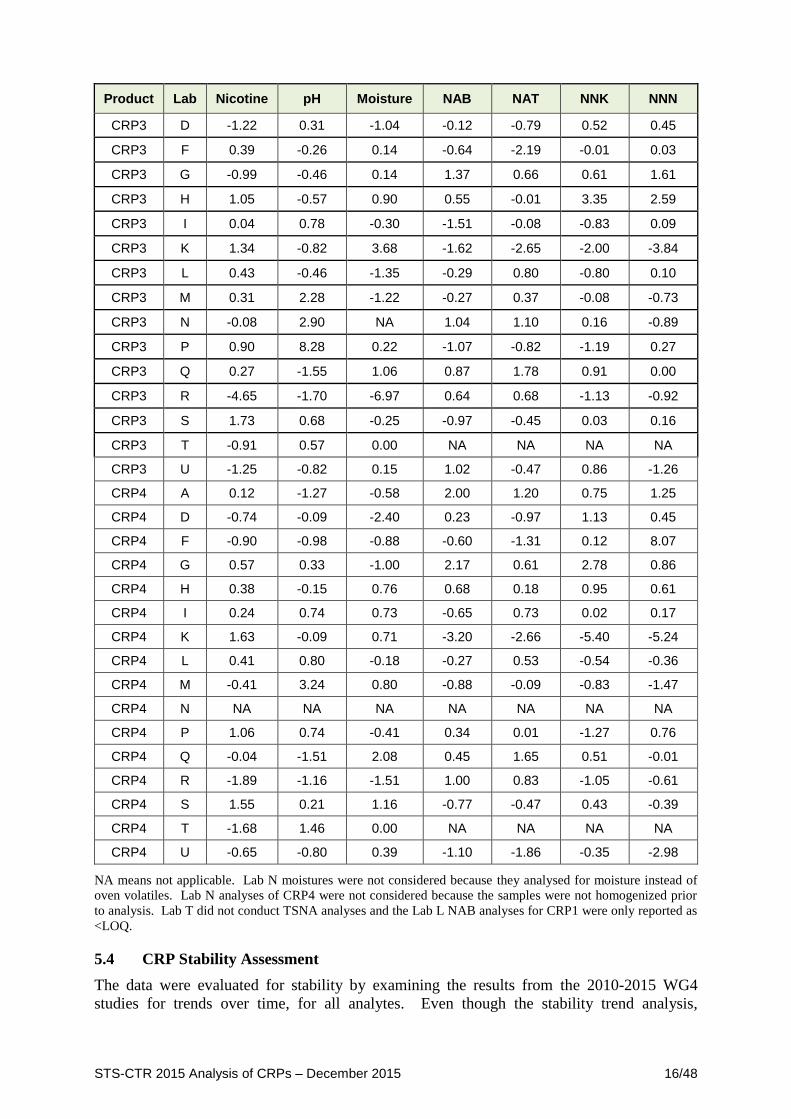
5.3 Calculation of Z-Scores
Although calculation of z-scores is not suggested in ISO 5725-2:1994, z-scores were
calculated so that the participating laboratories could compare their results to those of their
peers. The z-scores were calculated using methods suggested in ISO 13528: 2005. The
calculations were based on Algorithm A given in Annex C of ISO 13528: 2005. It is expected
that most of the data should fall within the range of ±2, and that laboratories having values
with |z|>3 should be treated as an “action signal” to investigate laboratory performance. Since
STS-CTR 2015 Analysis of CRPs – December 2015 15/48
this study is also intended to evaluate the suitability of the CRPs for continued use, large z-
values could also be an indication of inconsistencies (instability) in the CRPs. A final
summary table of z-scores is presented in Table 6 for the 2015 WG4 study.
Table 6: Z-Scores for 2015 WG4 Study
Product Lab Nicotine pH Moisture NAB NAT NNK NNN
CRP1 A -0.21 0.27 -1.97 0.48 0.98 0.71 1.13
CRP1 D 1.00 0.19 0.07 -0.65 -1.49 0.95 -0.28
CRP1 F -0.04 0.03 0.25 0.63 -1.11 0.65 3.94
CRP1 G -1.39 -0.61 0.83 0.78 0.91 0.13 0.95
CRP1 H 1.81 -0.77 -2.85 1.23 0.63 2.38 1.19
CRP1 I -0.15 1.71 -0.36 -1.10 0.03 -1.28 -1.01
CRP1 K 0.17 -2.61 2.11 -1.70 -3.08 -7.63 -4.23
CRP1 L 0.71 1.38 -0.04 NA 0.47 0.34 -0.13
CRP1 M 0.81 1.39 -5.71 -0.65 0.26 -0.56 -0.86
CRP1 N -0.90 -0.57 NA -0.95 -0.87 -3.60 -0.13
CRP1 P -0.10 -1.29 -1.65 1.30 0.05 -0.29 -0.05
CRP1 Q -0.21 0.11 -0.01 -0.42 1.37 0.10 0.26
CRP1 R -0.15 -0.65 0.62 0.25 1.29 -1.13 0.19
CRP1 S 2.05 1.07 1.66 -0.65 -0.51 -0.05 0.19
CRP1 T -1.98 -0.85 0.72 NA NA NA NA
CRP1 U -0.94 0.27 0.38 1.45 -0.13 3.38 -1.35
CRP2 A -0.37 -0.27 1.07 0.57 0.51 0.10 1.07
CRP2 D -1.36 0.31 -0.16 0.23 -1.36 1.19 0.63
CRP2 F 0.20 -0.62 0.55 -1.57 -1.92 -0.37 1.88
CRP2 G -0.99 0.12 0.30 0.75 -0.52 0.03 -0.46
CRP2 H 1.11 -0.52 -0.67 0.84 0.29 1.38 2.04
CRP2 I -0.62 1.53 1.05 -1.23 0.22 -0.27 -0.30
CRP2 K 1.44 -3.54 2.14 -3.49 -3.82 -4.41 -4.38
CRP2 L 0.13 0.99 0.44 0.11 1.23 0.32 0.01
CRP2 M 0.26 1.73 -0.95 -1.14 0.50 0.22 -1.31
CRP2 N 0.01 1.24 NA -0.41 0.21 -1.03 -0.54
CRP2 P 0.94 -0.81 -1.08 -0.10 -0.65 -0.83 -0.09
CRP2 Q 0.44 -0.42 0.43 1.69 1.52 0.02 -0.04
CRP2 R -4.67 -0.86 0.49 0.96 1.63 -1.61 -0.31
CRP2 S 2.57 0.21 -0.94 -0.16 -0.30 0.77 1.19
CRP2 T -0.37 0.65 -7.76 NA NA NA NA
CRP2 U -0.98 -1.40 -1.11 0.93 -0.45 2.50 -1.17
CRP3 A -0.36 0.00 1.28 0.99 0.76 0.90 0.90
STS-CTR 2015 Analysis of CRPs – December 2015 16/48
Product Lab Nicotine pH Moisture NAB NAT NNK NNN
CRP3 D -1.22 0.31 -1.04 -0.12 -0.79 0.52 0.45
CRP3 F 0.39 -0.26 0.14 -0.64 -2.19 -0.01 0.03
CRP3 G -0.99 -0.46 0.14 1.37 0.66 0.61 1.61
CRP3 H 1.05 -0.57 0.90 0.55 -0.01 3.35 2.59
CRP3 I 0.04 0.78 -0.30 -1.51 -0.08 -0.83 0.09
CRP3 K 1.34 -0.82 3.68 -1.62 -2.65 -2.00 -3.84
CRP3 L 0.43 -0.46 -1.35 -0.29 0.80 -0.80 0.10
CRP3 M 0.31 2.28 -1.22 -0.27 0.37 -0.08 -0.73
CRP3 N -0.08 2.90 NA 1.04 1.10 0.16 -0.89
CRP3 P 0.90 8.28 0.22 -1.07 -0.82 -1.19 0.27
CRP3 Q 0.27 -1.55 1.06 0.87 1.78 0.91 0.00
CRP3 R -4.65 -1.70 -6.97 0.64 0.68 -1.13 -0.92
CRP3 S 1.73 0.68 -0.25 -0.97 -0.45 0.03 0.16
CRP3 T -0.91 0.57 0.00 NA NA NA NA
CRP3 U -1.25 -0.82 0.15 1.02 -0.47 0.86 -1.26
CRP4 A 0.12 -1.27 -0.58 2.00 1.20 0.75 1.25
CRP4 D -0.74 -0.09 -2.40 0.23 -0.97 1.13 0.45
CRP4 F -0.90 -0.98 -0.88 -0.60 -1.31 0.12 8.07
CRP4 G 0.57 0.33 -1.00 2.17 0.61 2.78 0.86
CRP4 H 0.38 -0.15 0.76 0.68 0.18 0.95 0.61
CRP4 I 0.24 0.74 0.73 -0.65 0.73 0.02 0.17
CRP4 K 1.63 -0.09 0.71 -3.20 -2.66 -5.40 -5.24
CRP4 L 0.41 0.80 -0.18 -0.27 0.53 -0.54 -0.36
CRP4 M -0.41 3.24 0.80 -0.88 -0.09 -0.83 -1.47
CRP4 N NA NA NA NA NA NA NA
CRP4 P 1.06 0.74 -0.41 0.34 0.01 -1.27 0.76
CRP4 Q -0.04 -1.51 2.08 0.45 1.65 0.51 -0.01
CRP4 R -1.89 -1.16 -1.51 1.00 0.83 -1.05 -0.61
CRP4 S 1.55 0.21 1.16 -0.77 -0.47 0.43 -0.39
CRP4 T -1.68 1.46 0.00 NA NA NA NA
CRP4 U -0.65 -0.80 0.39 -1.10 -1.86 -0.35 -2.98
NA means not applicable. Lab N moistures were not considered because they analysed for moisture instead of
oven volatiles. Lab N analyses of CRP4 were not considered because the samples were not homogenized prior
to analysis. Lab T did not conduct TSNA analyses and the Lab L NAB analyses for CRP1 were only reported as
<LOQ.
5.4 CRP Stability Assessment
The data were evaluated for stability by examining the results from the 2010-2015 WG4
studies for trends over time, for all analytes. Even though the stability trend analysis,
STS-CTR 2015 Analysis of CRPs – December 2015 17/48
described below, was the primary evaluation of stability, the data were also graphically
evaluated for changes in between-lab variability over the study years. As mentioned in the
introduction, the 2010 study did not specify methods of analysis and the 2011 study was the
first study year initiated to assess stability of the CRPs where methods were specified.
However, after evaluating the data for all five years, it was determined that the 2010 data
were consistent with the data from later years and were included in the stability analysis.
The stability trend analysis included two factors: year of analysis and laboratory. To account
for potential year-to-year correlation in a laboratory’s results, the laboratory variable was
treated as a random factor.
There is also a potential need to account for multiplicity of testing. That is, if four statistical
tests are each carried out with a 5% chance to falsely declare a time trend, then there is just
under a 20% chance that at least one of them will give a false indication of a time trend even
in the ideal case of absolute stability. In this instance there are four reference products and
seven separate analytes, thus twenty-eight comparisons in all. The approach taken was to
correct for testing multiplicity across products for each analyte and not across all analytes.
The correction employed was to allow for four tests being conducted not all twenty-eight.
That meant that each test was judged statistically significant if the associated p-value was less
than 5% divided by 4, or 1.25%. Therefore, there is roughly a 5% chance that each analyte
will be declared to show a time trend on one or more of the CRPs by chance alone.
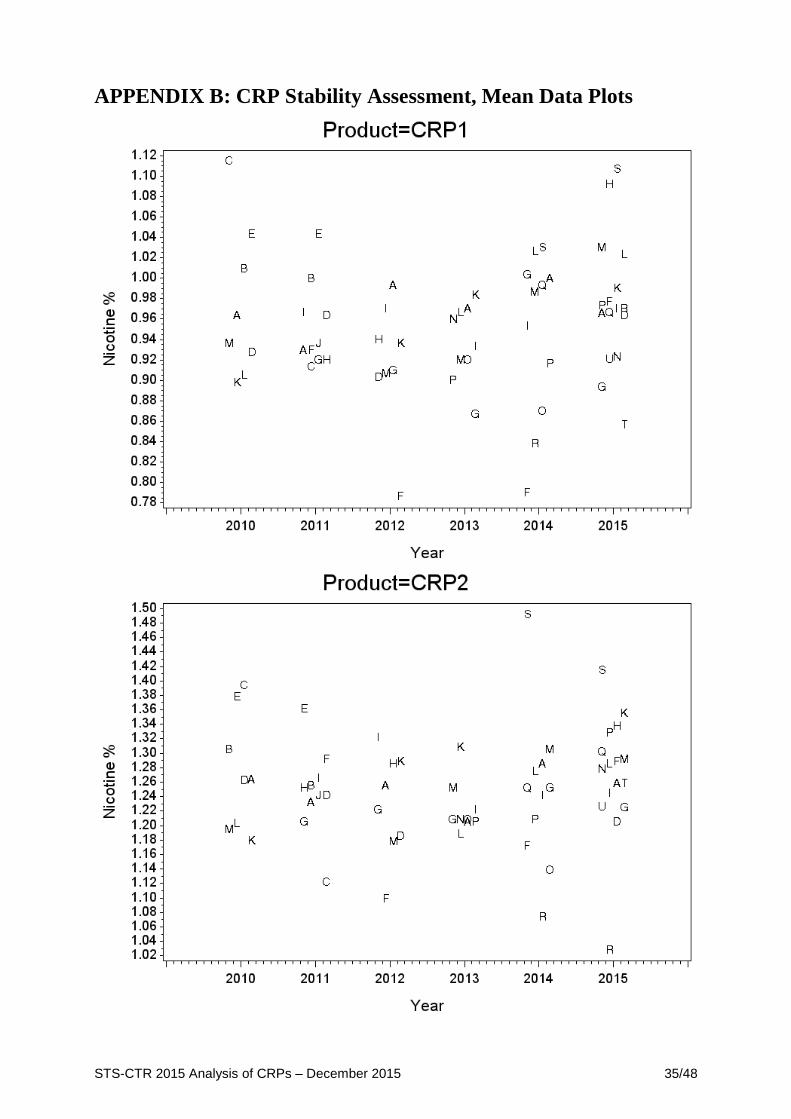
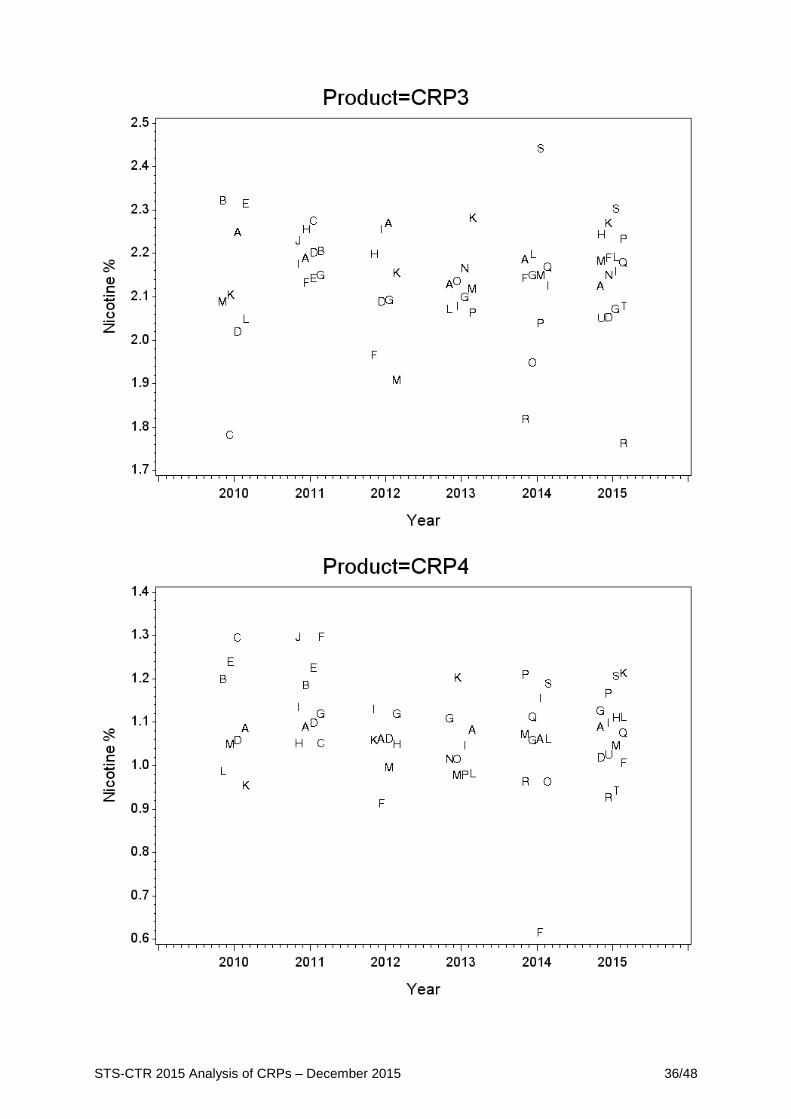
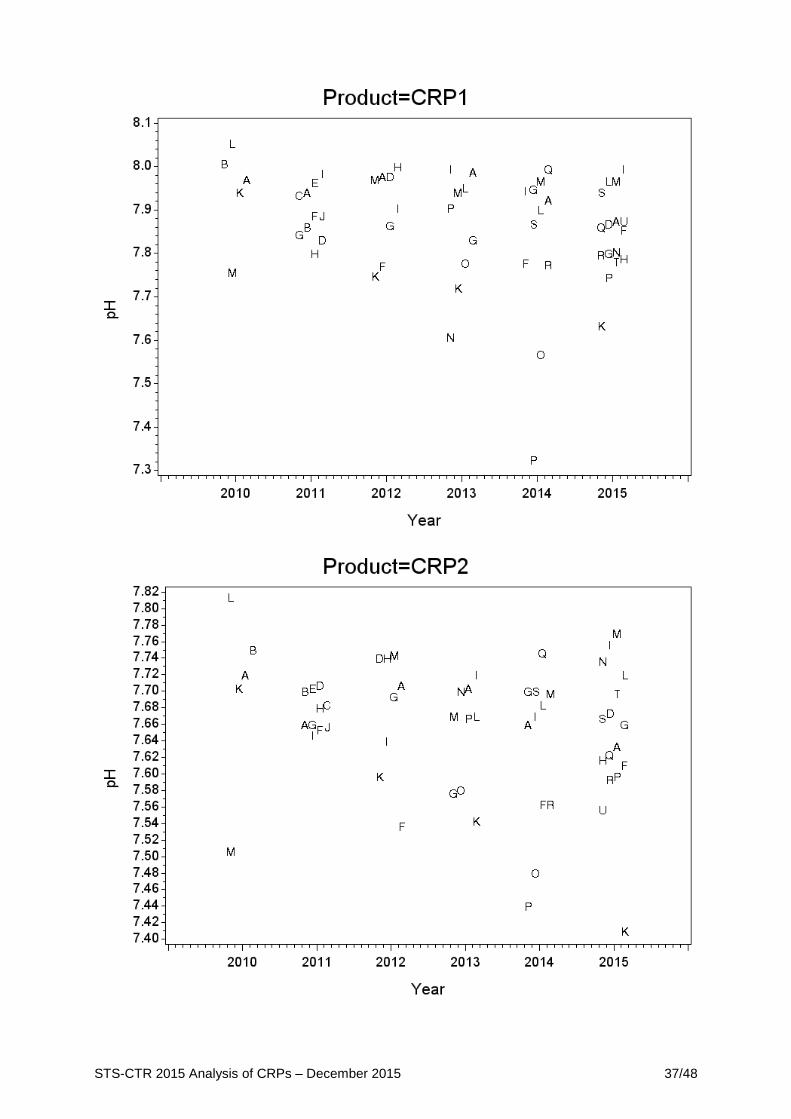
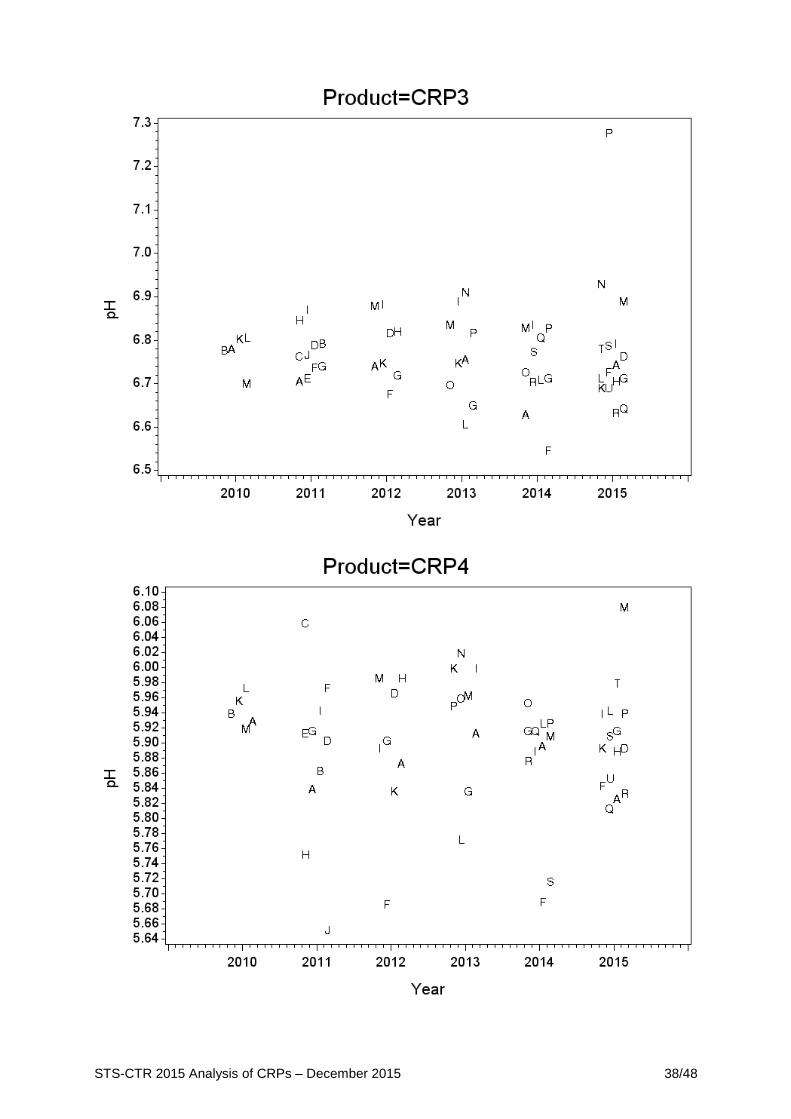
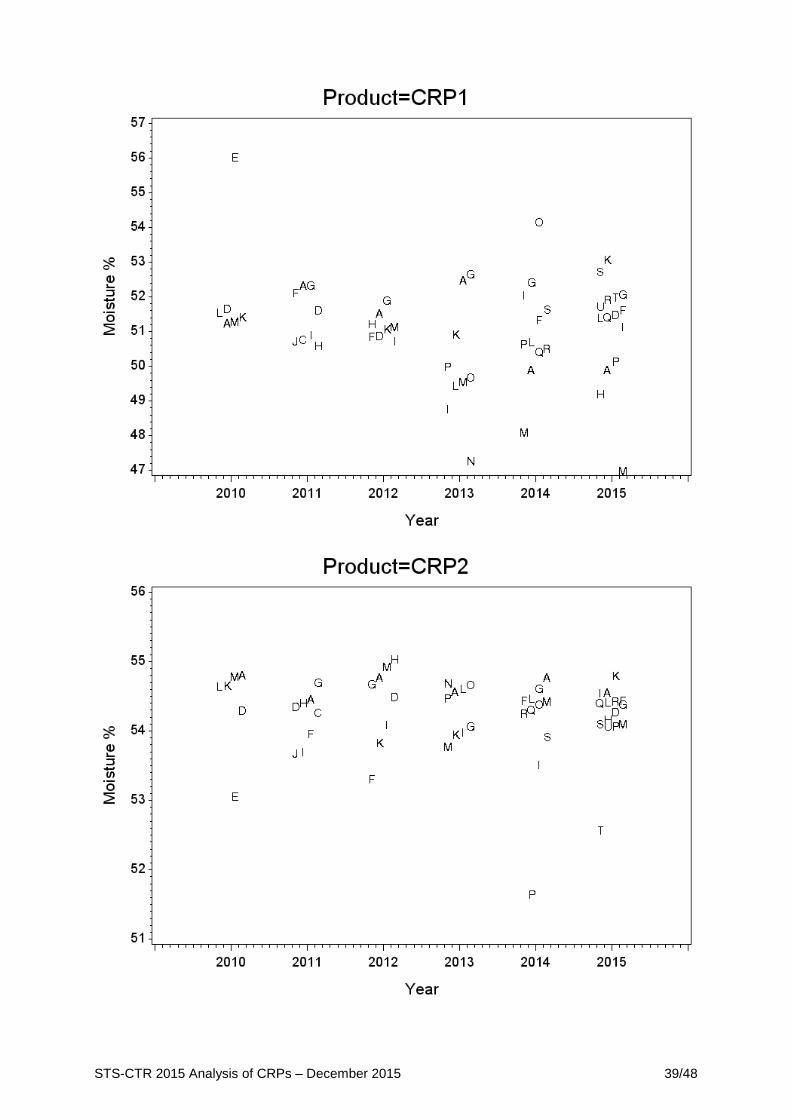
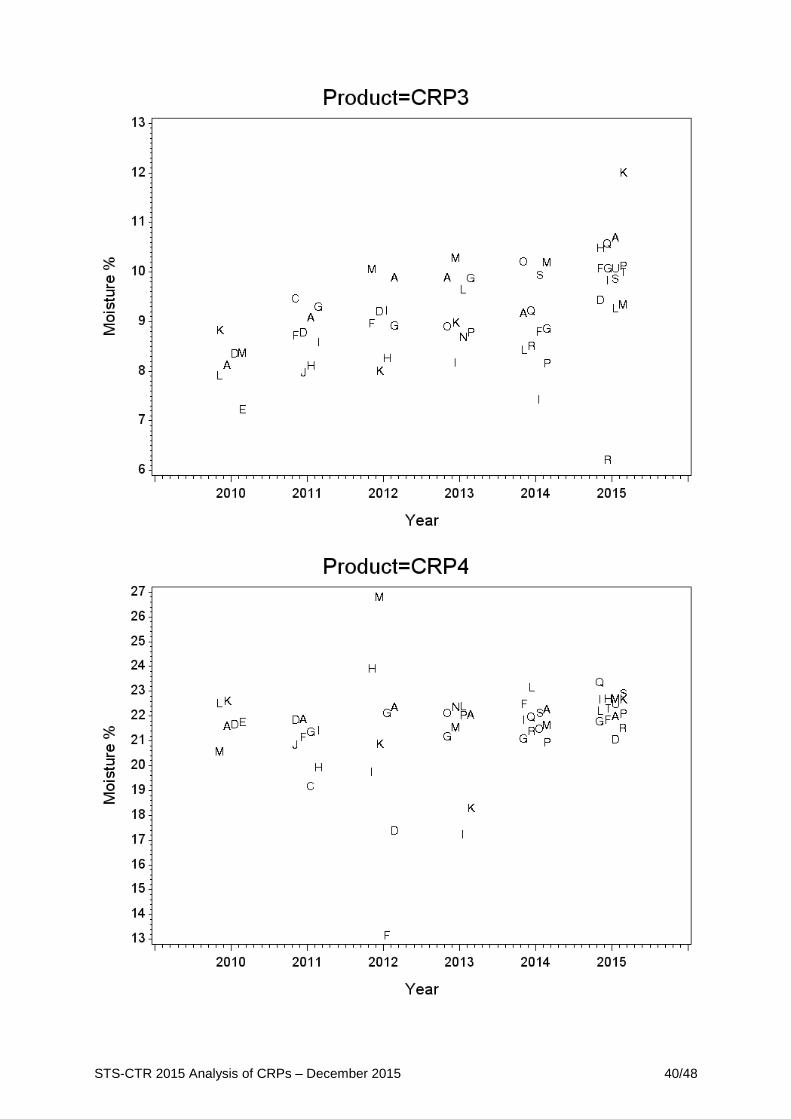
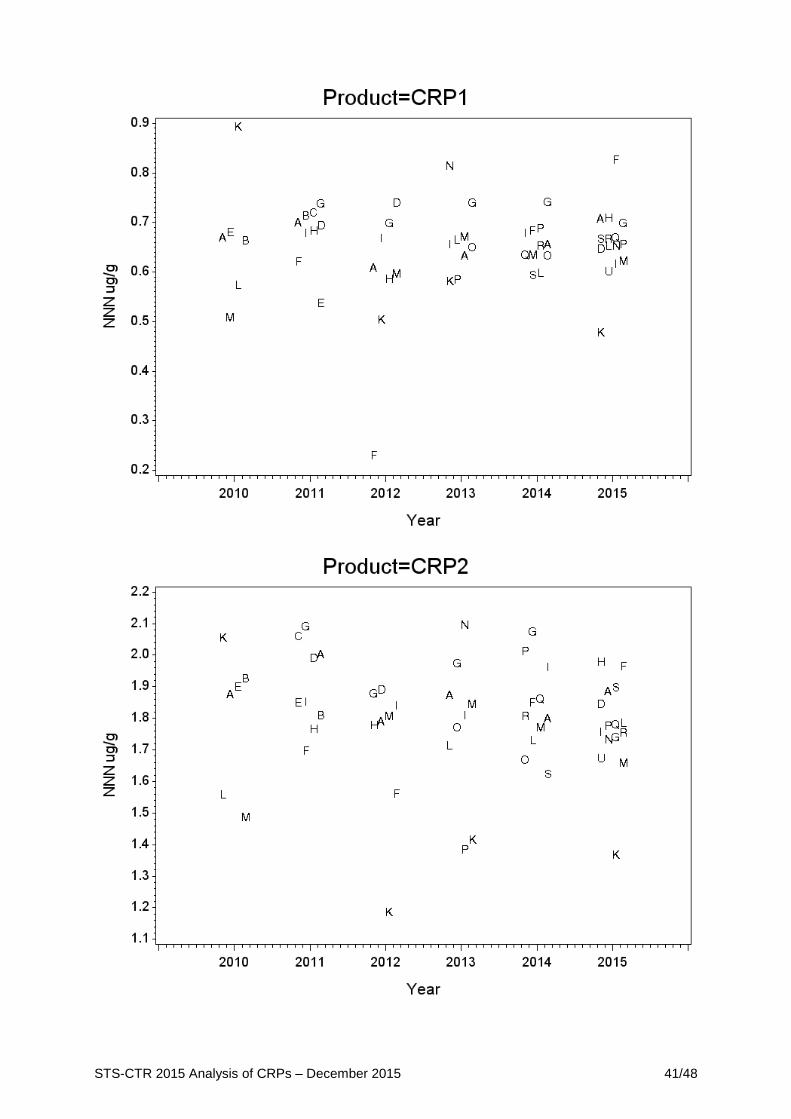
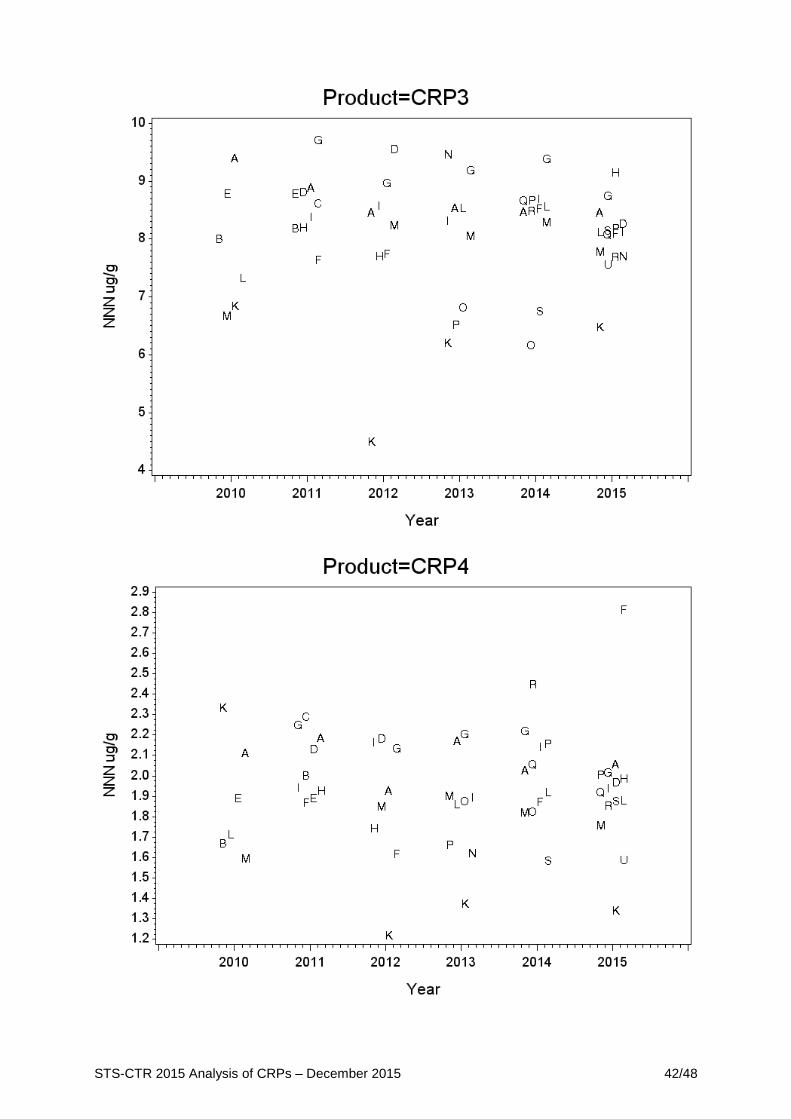
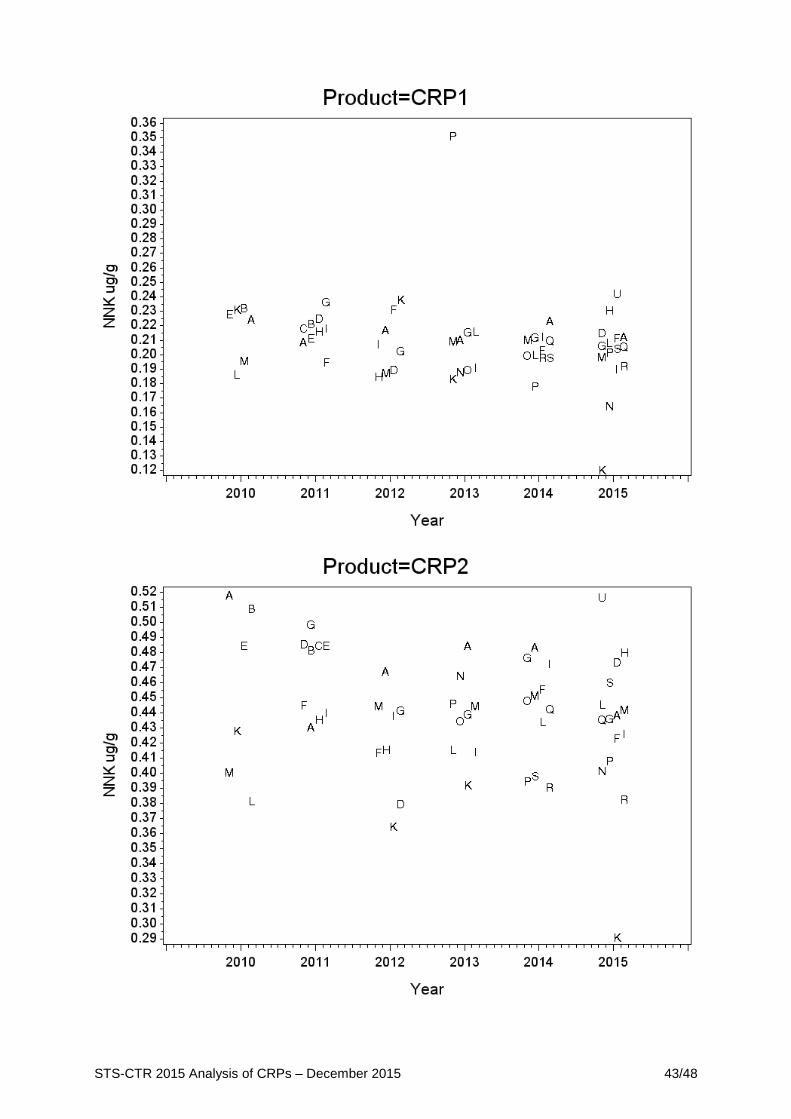
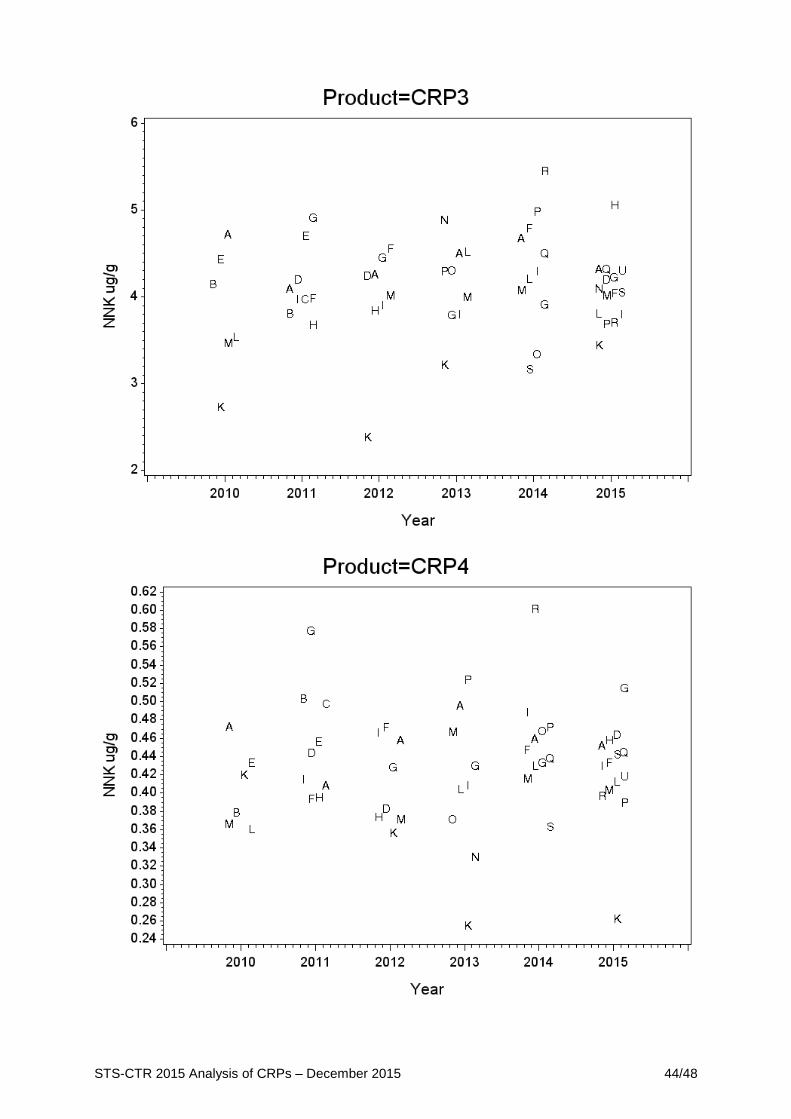
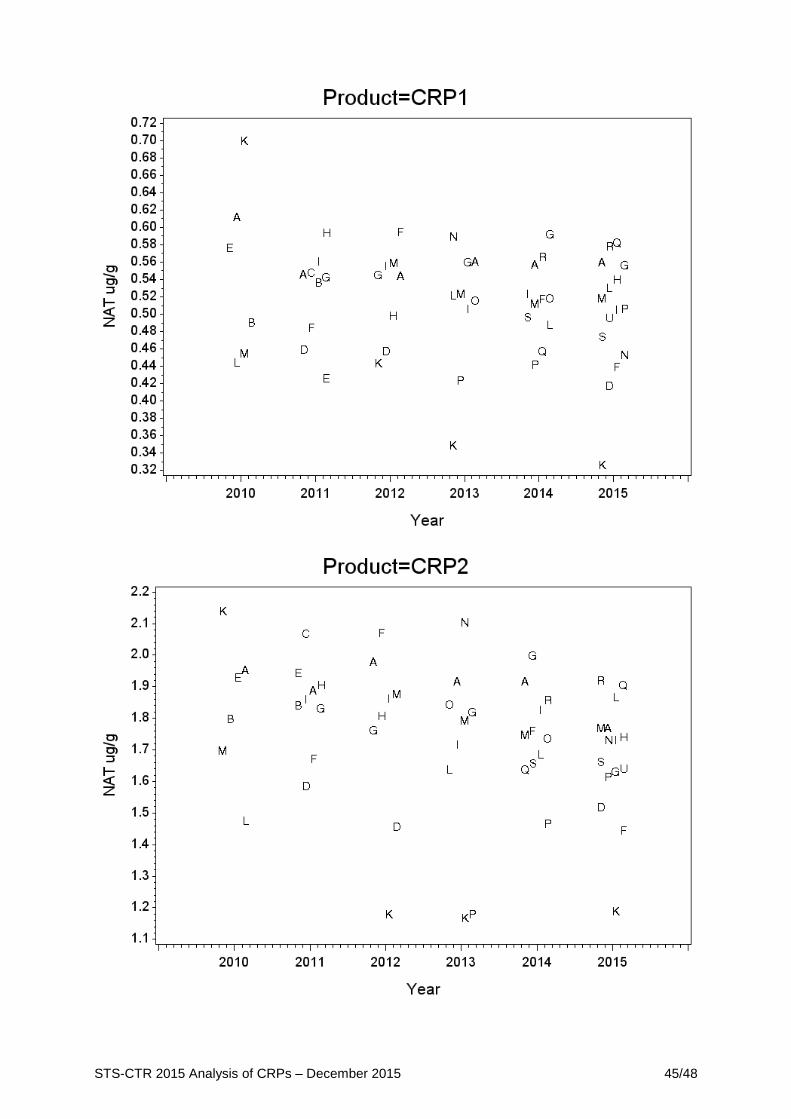
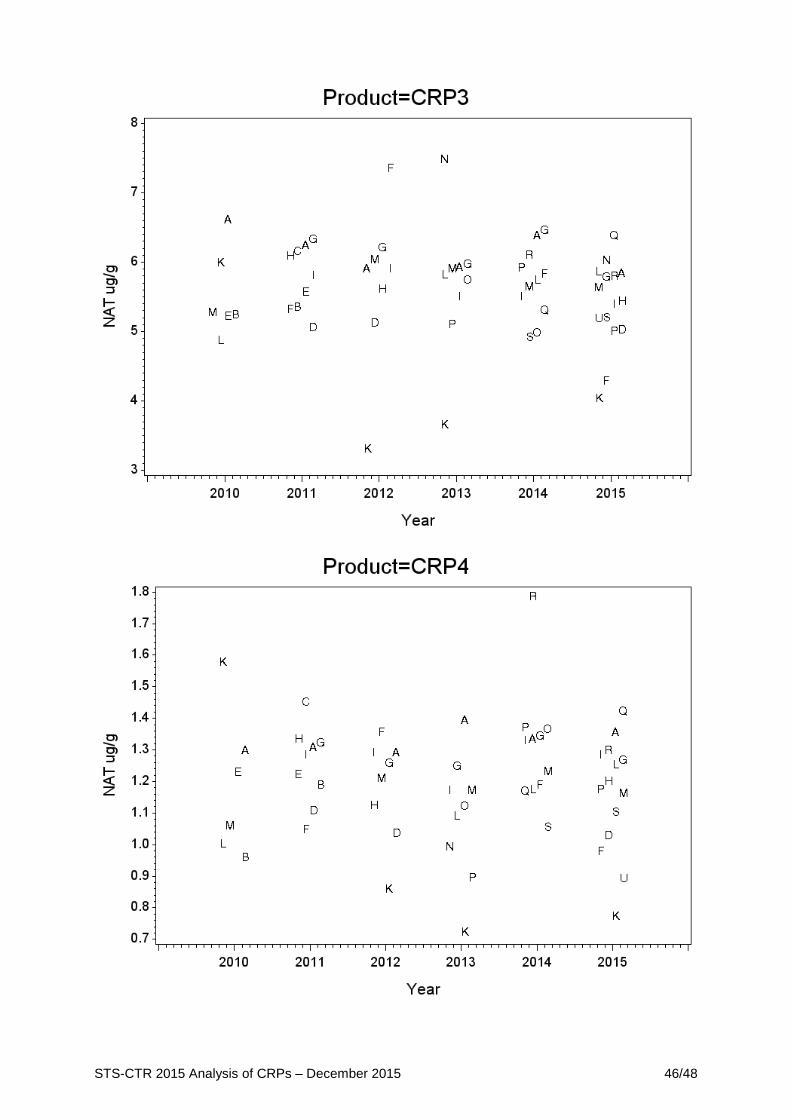
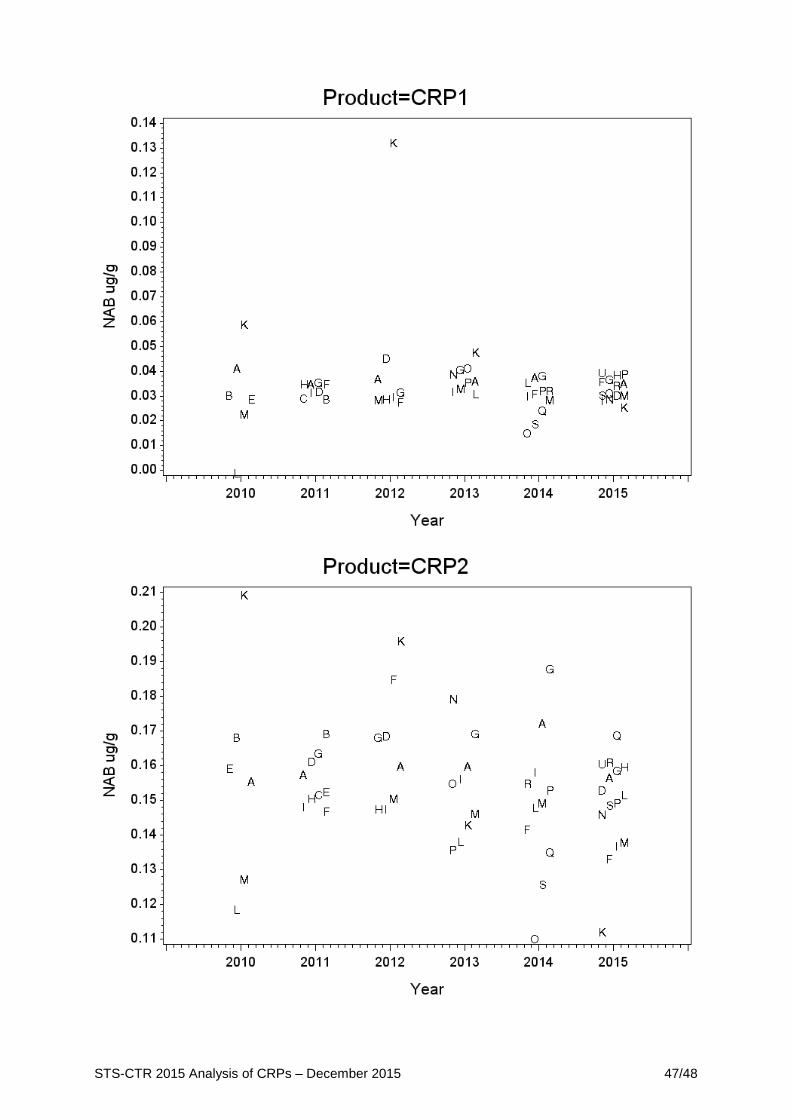
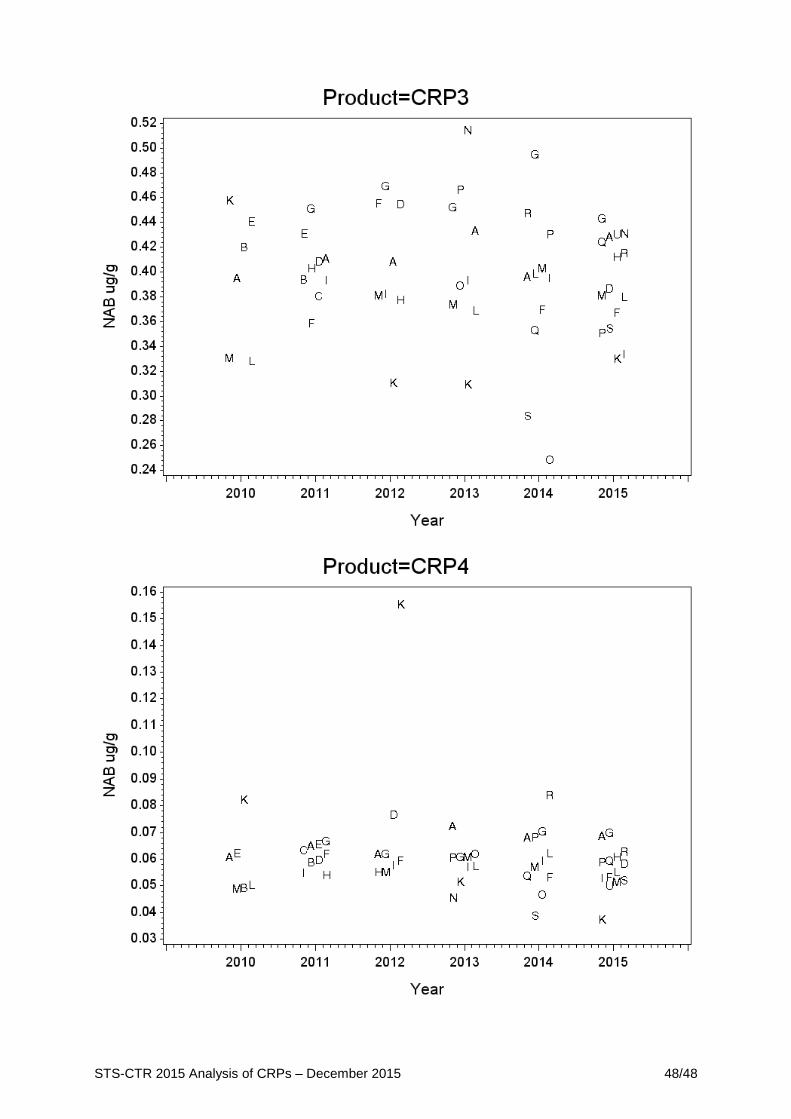
Graphs of the means for all years and all analytes are shown in Appendix B. These graphs
include the complete data set, without removal of outliers, to give the reader a perspective
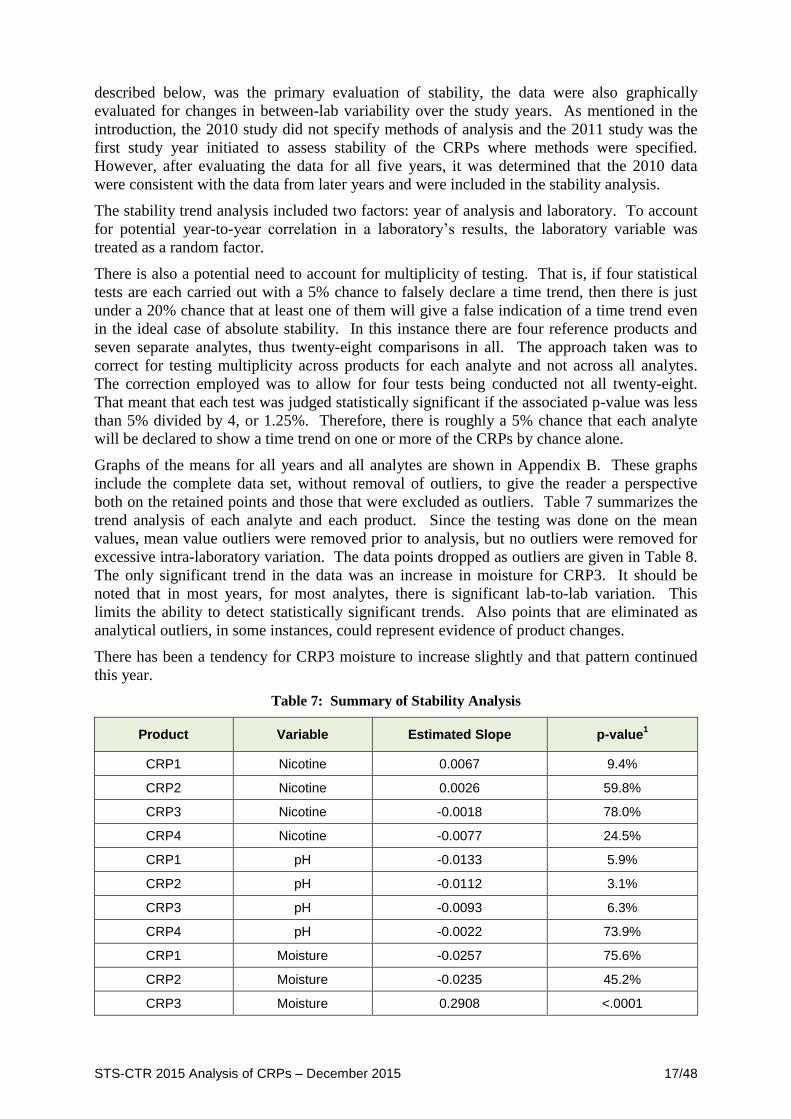
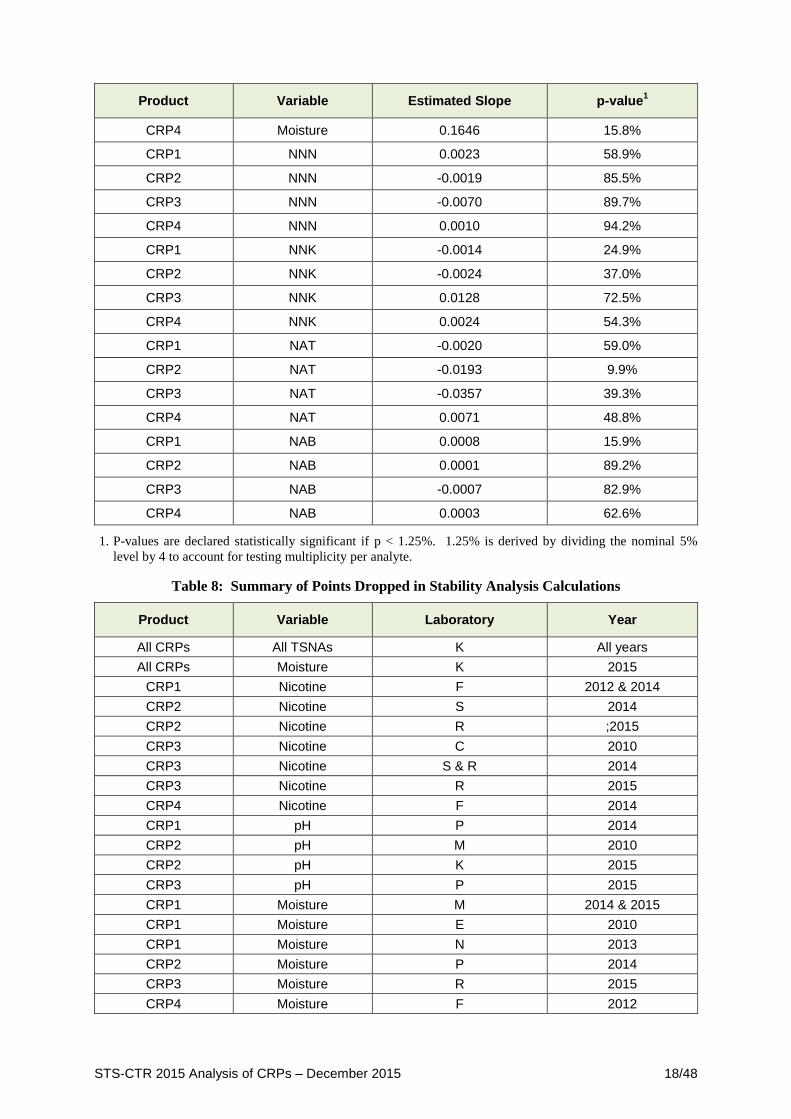
both on the retained points and those that were excluded as outliers. Table 7 summarizes the
trend analysis of each analyte and each product. Since the testing was done on the mean
values, mean value outliers were removed prior to analysis, but no outliers were removed for
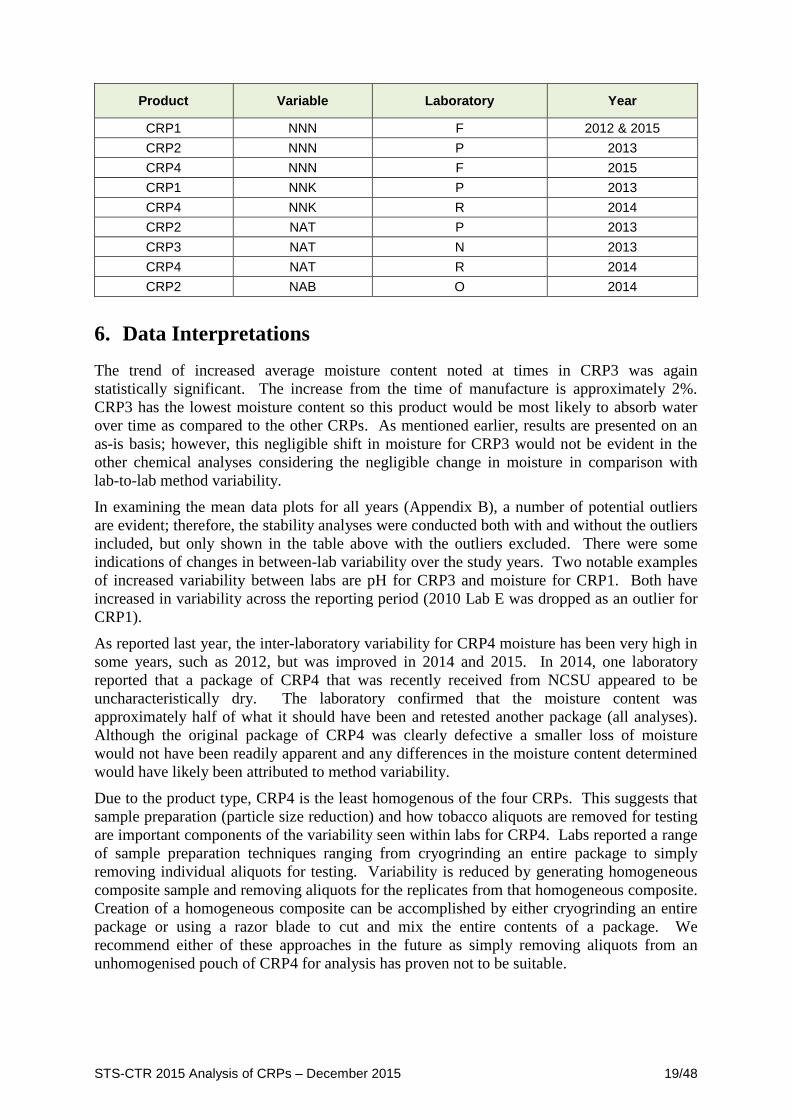
excessive intra-laboratory variation. The data points dropped as outliers are given in Table 8.
The only significant trend in the data was an increase in moisture for CRP3. It should be
noted that in most years, for most analytes, there is significant lab-to-lab variation. This
limits the ability to detect statistically significant trends. Also points that are eliminated as
analytical outliers, in some instances, could represent evidence of product changes.
There has been a tendency for CRP3 moisture to increase slightly and that pattern continued
this year.
Table 7: Summary of Stability Analysis
Product Variable Estimated Slope p-value1
CRP1 Nicotine 0.0067 9.4%
CRP2 Nicotine 0.0026 59.8%
CRP3 Nicotine -0.0018 78.0%
CRP4 Nicotine -0.0077 24.5%
CRP1 pH -0.0133 5.9%
CRP2 pH -0.0112 3.1%
CRP3 pH -0.0093 6.3%
CRP4 pH -0.0022 73.9%
CRP1 Moisture
-0.0257 75.6%
CRP2 Moisture -0.0235 45.2%
CRP3 Moisture 0.2908 <.0001
STS-CTR 2015 Analysis of CRPs – December 2015 18/48
Product Variable Estimated Slope p-value1
CRP4 Moisture 0.1646 15.8%
CRP1 NNN 0.0023 58.9%
CRP2 NNN -0.0019 85.5%
CRP3 NNN -0.0070 89.7%
CRP4 NNN 0.0010 94.2%
CRP1 NNK
-0.0014 24.9%
CRP2 NNK -0.0024 37.0%
CRP3 NNK
0.0128 72.5%
CRP4 NNK 0.0024 54.3%
CRP1 NAT -0.0020 59.0%
CRP2 NAT -0.0193 9.9%
CRP3 NAT -0.0357 39.3%
CRP4 NAT 0.0071 48.8%
CRP1 NAB
0.0008 15.9%
CRP2 NAB 0.0001 89.2%
CRP3 NAB -0.0007 82.9%
CRP4 NAB
0.0003 62.6%
1. P-values are declared statistically significant if p < 1.25%. 1.25% is derived by dividing the nominal 5%
level by 4 to account for testing multiplicity per analyte.
Table 8: Summary of Points Dropped in Stability Analysis Calculations
Product Variable Laboratory Year
All CRPs All TSNAs K All years
All CRPs Moisture K 2015
CRP1 Nicotine F 2012 & 2014
CRP2 Nicotine S 2014
CRP2 Nicotine R ;2015
CRP3 Nicotine C 2010
CRP3 Nicotine S & R 2014
CRP3 Nicotine R 2015
CRP4 Nicotine F 2014
CRP1 pH P 2014
CRP2 pH M 2010
CRP2 pH K 2015
CRP3 pH P 2015
CRP1 Moisture M 2014 & 2015
CRP1 Moisture E 2010
CRP1 Moisture N 2013
CRP2 Moisture P 2014
CRP3 Moisture R 2015
CRP4 Moisture F 2012
STS-CTR 2015 Analysis of CRPs – December 2015 19/48
Product Variable Laboratory Year
CRP1 NNN F 2012 & 2015
CRP2 NNN P 2013
CRP4 NNN F 2015
CRP1 NNK P 2013
CRP4 NNK R 2014
CRP2 NAT P 2013
CRP3 NAT N 2013
CRP4 NAT R 2014
CRP2 NAB O 2014
6. Data Interpretations
The trend of increased average moisture content noted at times in CRP3 was again
statistically significant. The increase from the time of manufacture is approximately 2%.
CRP3 has the lowest moisture content so this product would be most likely to absorb water
over time as compared to the other CRPs. As mentioned earlier, results are presented on an
as-is basis; however, this negligible shift in moisture for CRP3 would not be evident in the
other chemical analyses considering the negligible change in moisture in comparison with
lab-to-lab method variability.
In examining the mean data plots for all years (Appendix B), a number of potential outliers
are evident; therefore, the stability analyses were conducted both with and without the outliers
included, but only shown in the table above with the outliers excluded. There were some
indications of changes in between-lab variability over the study years. Two notable examples
of increased variability between labs are pH for CRP3 and moisture for CRP1. Both have
increased in variability across the reporting period (2010 Lab E was dropped as an outlier for
CRP1).
As reported last year, the inter-laboratory variability for CRP4 moisture has been very high in
some years, such as 2012, but was improved in 2014 and 2015. In 2014, one laboratory
reported that a package of CRP4 that was recently received from NCSU appeared to be
uncharacteristically dry. The laboratory confirmed that the moisture content was
approximately half of what it should have been and retested another package (all analyses).
Although the original package of CRP4 was clearly defective a smaller loss of moisture
would not have been readily apparent and any differences in the moisture content determined
would have likely been attributed to method variability.
Due to the product type, CRP4 is the least homogenous of the four CRPs. This suggests that
sample preparation (particle size reduction) and how tobacco aliquots are removed for testing
are important components of the variability seen within labs for CRP4. Labs reported a range
of sample preparation techniques ranging from cryogrinding an entire package to simply
removing individual aliquots for testing. Variability is reduced by generating homogeneous
composite sample and removing aliquots for the replicates from that homogeneous composite.
Creation of a homogeneous composite can be accomplished by either cryogrinding an entire
package or using a razor blade to cut and mix the entire contents of a package. We
recommend either of these approaches in the future as simply removing aliquots from an
unhomogenised pouch of CRP4 for analysis has proven not to be suitable.
STS-CTR 2015 Analysis of CRPs – December 2015 20/48
Overall, both nicotine and TSNAs are shown to be stable over the six study years, for all
CRPs. This is not unexpected as both nicotine and TSNAs should be stable in these products
when the products are maintained at -20 °C.
Based on the results taken in their entirety, the conclusion of this study is that all four CRPs
are suitable for continued use as reference products. Lack of any clear and significant trends
in the stability results indicate that storage at -20 °C is an appropriate storage condition for the
four reference products. Furthermore, since the changes in moisture, if any, are small relative
to the inherent method reproducibilities, it is unlikely that they will have an easily detectable
effect on other results.
7. Recommendations
The results of this study demonstrate that the CRPs ae suitable for continued use as reference
products; however, manufacture of new CRPs should be considered due to the dwindling
supply of the 2009 products.
STS-CTR 2015 Analysis of CRPs – December 2015 21/48
APPENDIX A: Raw Data Plots for 2015 WG4 Study
STS-CTR 2015 Analysis of CRPs – December 2015 22/48
STS-CTR 2015 Analysis of CRPs – December 2015 23/48
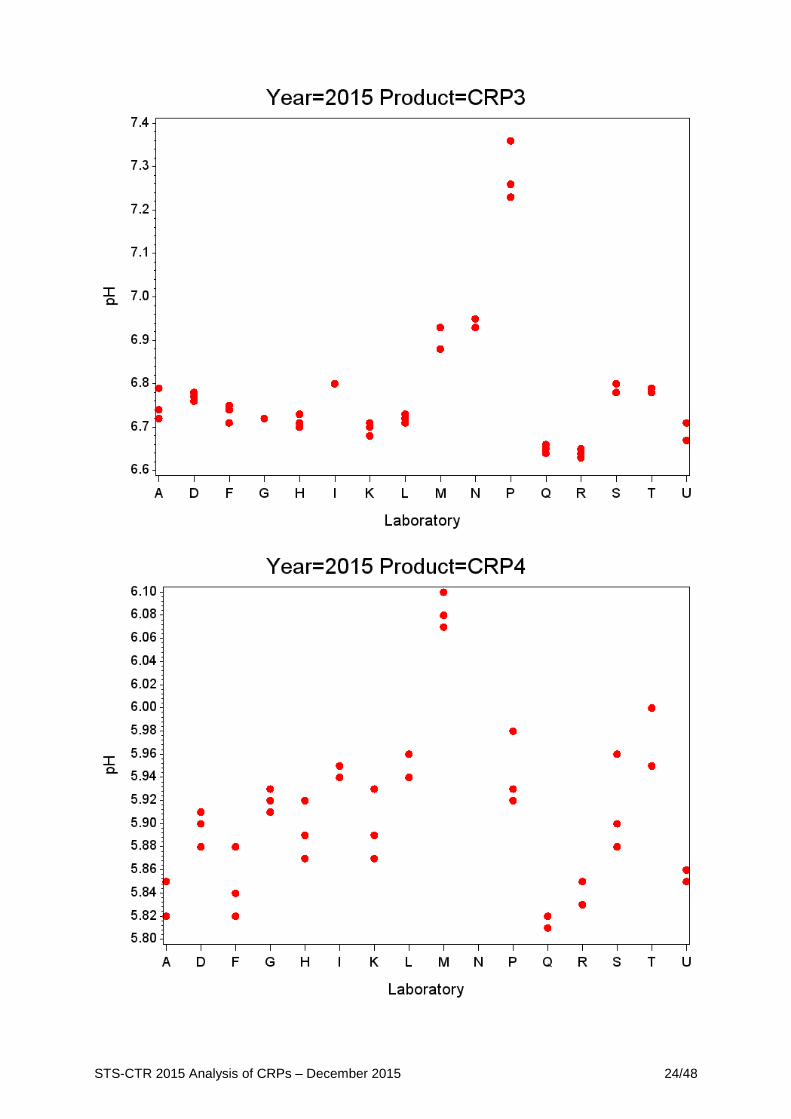
STS-CTR 2015 Analysis of CRPs – December 2015 24/48
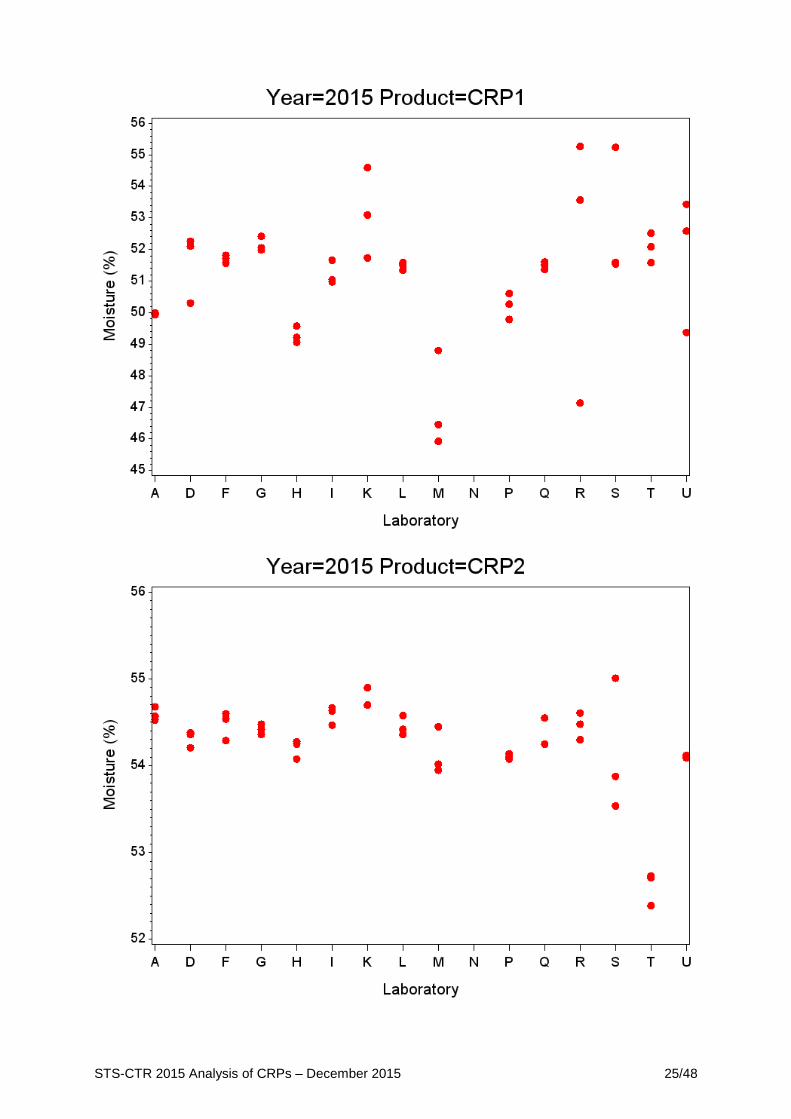
STS-CTR 2015 Analysis of CRPs – December 2015 25/48
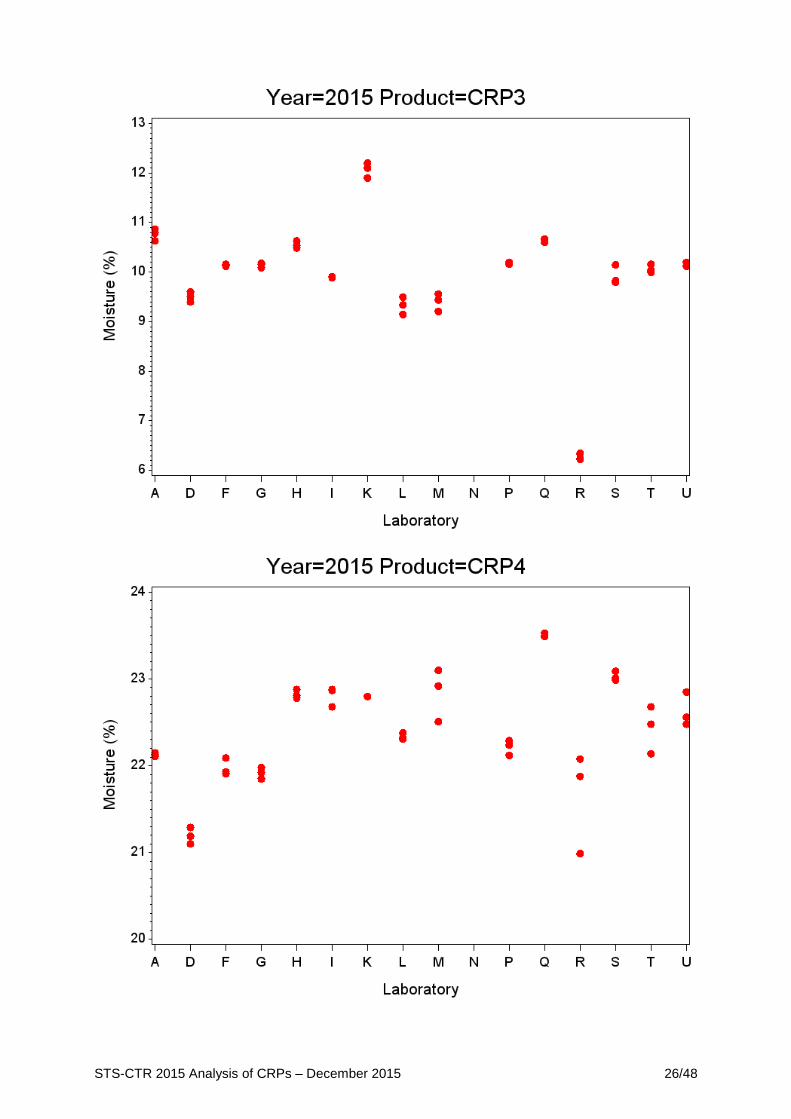
STS-CTR 2015 Analysis of CRPs – December 2015 26/48
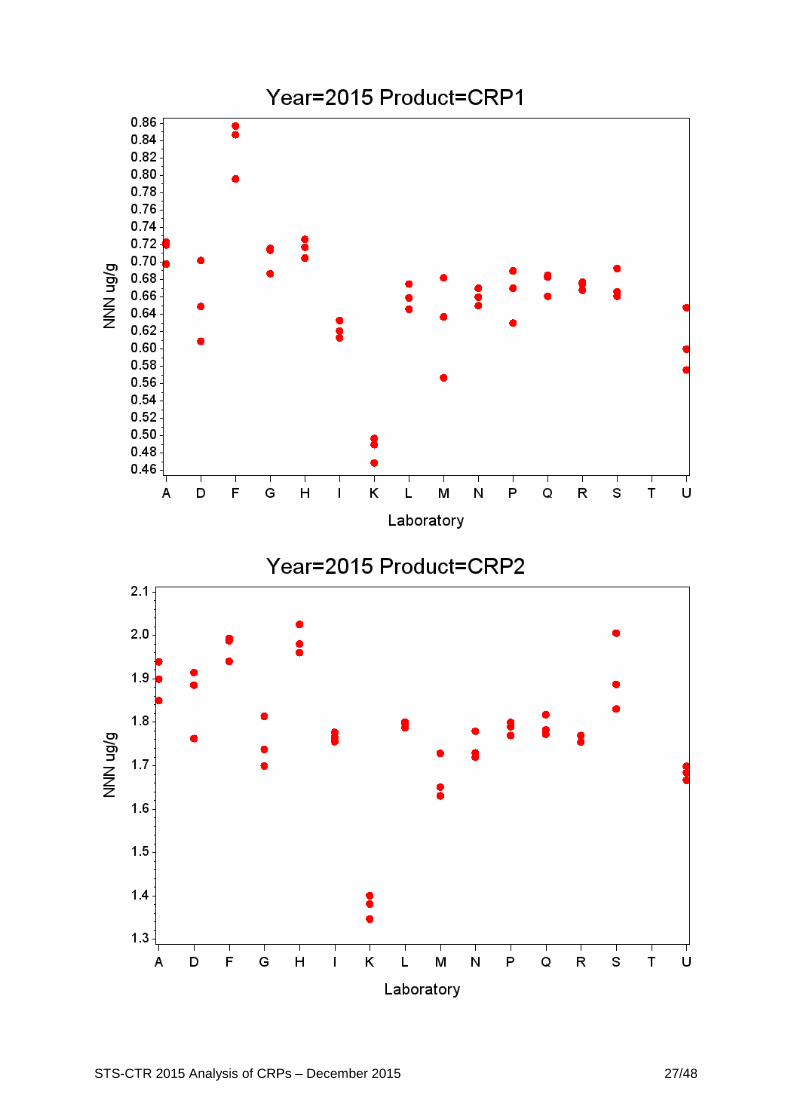
STS-CTR 2015 Analysis of CRPs – December 2015 27/48
STS-CTR 2015 Analysis of CRPs – December 2015 28/48
STS-CTR 2015 Analysis of CRPs – December 2015 29/48
STS-CTR 2015 Analysis of CRPs – December 2015 30/48
STS-CTR 2015 Analysis of CRPs – December 2015 31/48
STS-CTR 2015 Analysis of CRPs – December 2015 32/48
STS-CTR 2015 Analysis of CRPs – December 2015 33/48
STS-CTR 2015 Analysis of CRPs – December 2015 34/48
STS-CTR 2015 Analysis of CRPs – December 2015 35/48
APPENDIX B: CRP Stability Assessment, Mean Data Plots
STS-CTR 2015 Analysis of CRPs – December 2015 36/48
STS-CTR 2015 Analysis of CRPs – December 2015 37/48
STS-CTR 2015 Analysis of CRPs – December 2015 38/48
STS-CTR 2015 Analysis of CRPs – December 2015 39/48
STS-CTR 2015 Analysis of CRPs – December 2015 40/48
STS-CTR 2015 Analysis of CRPs – December 2015 41/48
STS-CTR 2015 Analysis of CRPs – December 2015 42/48
STS-CTR 2015 Analysis of CRPs – December 2015 43/48
STS-CTR 2015 Analysis of CRPs – December 2015 44/48
STS-CTR 2015 Analysis of CRPs – December 2015 45/48
STS-CTR 2015 Analysis of CRPs – December 2015 46/48
STS-CTR 2015 Analysis of CRPs – December 2015 47/48
STS-CTR 2015 Analysis of CRPs – December 2015 48/48