SMITH RIVER STATE PARK AND RIVER CORRIDOR
28
SMITH RIVER STATE PARK AND RIVER CORRIDOR Visitor Use & Statistics Monitoring Report 2020
Transcript of SMITH RIVER STATE PARK AND RIVER CORRIDOR

SMITH RIVER STATE PARK AND RIVER CORRIDOR
Visitor Use & Statistics Monitoring Report
2020

A summary of visitor use statistics, management activities and resource and social conditions on the Smith River corridor during the 2020 field season
Submitted by: Nate Kluz Smith River State Park and River Corridor
Lead River Ranger (FWP)
Edited by: Colin J. Maas Smith River State Park and River Corridor
Park Manager (FWP)
Contributors: Cody Kenyon - River Ranger (FWP) Austin Moody - River Ranger (FWP) Don Mendenhall - River Ranger (USFS) Krystal Phares - Smith River Reservation Clerk (FWP)
Approved by: John Taillie
Region 4 Parks Manager Date: 01/21/2021

1
TABLE OF CONTENTS Section Page 1. EXECUTIVE SUMMARY .................................................................. 2-3 2. MANAGEMENT ACTIVITIES Staffing ........................................................................................... 3 Fee Revenue .................................................................................. 4 Special Projects Completed ........................................................ 5-6 3. VISITOR USE STATISTICS Private Launch Applications ........................................................... 6 Floater Log Comment Summary ............................................... 7-12 Boat Camp Overnight Use ........................................................... 13 Smith River Use Statistics by Month ....................................... 14-15 Smith River Trends Statistics (2001-2020) .............................. 16-17 Visitor Use Trends .................................................................. 18-19 Average Group Size ........................................................... 18-19 Number of Floaters per Year ................................................... 19 Smith River Daily Log Statistics .............................................. 20-24 4. RESOURCE AND SOCIAL CONDITIONS River Flows and Temperature ................................................. 25-26

2
SECTION 1 – EXECUTIVE SUMMARY Visitation The Smith River experienced record-setting interest and visitation again in 2020. The permit lottery saw 10,866 applications, 7.9% higher than 2019 (10,070) and 3.1% higher than 2018 (10,530), the previous record. Despite being closed to floating through May 4th, visitation set a record high. This year there were 6,629 floaters across all user groups and was driven by record setting private floater use. There were 5,630 private floaters, 44% more than the twenty-year average and 468 more private floaters than the next highest year (2019). Outfitted groups had 582 floaters,13% lower than 2019, but still 21% better than the twenty-year average. Landowner parties had a record-setting season with 120 floaters, 135% more than the twenty-year average. Landowner parties that included non-family members had 29% more use than the twenty-year average. Both landowner groups accounted for 3.3% of total users, but only 0.7% of total user days. While the number of floaters was record-setting this year, the number of total groups was only the third highest with 785 groups. This was 3% lower than 2018 (809) and 4.7% lower than 2019 (824), but still 20% higher than the twenty-year average. Outfitters conducted 54 trips, well below highs set over the past two seasons, but still 15% higher than the twenty-year average. Private floaters had their third highest number of groups. The record number of floaters was driven by an increase in the average group size of private float parties. Private groups averaged 8.39 floaters per party, 7% higher than the previous record of 7.84 (2017) and 21% more than the twenty-year average (6.96). Snowpack, Rainfall and River Flows An above average snowpack and good summer rains combined for excellent float conditions. As of January 01, 2020, snowpack was at 47% of its median peak. At the estimated median peak (April 18) the snowpack was 123% of normal. High elevation snowpack persisted well into June. Precipitation was 118% of normal in May, 137% in June and only 56% in July. Despite low July precipitation, a significant storm at the end of June brought up the flow considerably and the flow was 1040 CFS on July 1, 2020. Flows dropped steadily from there and finally fell below 200 CFS on July 26, 2020. The good flows benefitted water temperatures as well. Hoot owl closure requirements were met once, but not instituted due to weather forecasts conducive to cooling in the immediate future. Another benefit of the good flow was a reduction in the filamentous algae that had been pervasive in 2015-2017. Very little algae was seen in the float corridor and was not a nuisance to fishing or the float experience. However, there was quite a bit of algae in the river above the confluence with Sheep Creek all the way to the confluence of the North and South Forks. Early Spring Conditions On March 25th, park staff received information from a landowner that the river was iced over and impassable in the canyon. This news prompted park leadership to enact an emergency closure due to unsafe conditions. This closure lasted until April 11, after which, the river remained closed due to the Governor’s mandates for slowing the spread of Covid-19. The Covid-19 closure lasted through May 4th, with the river reopening May 5th. Social Conditions The qualitative social indicator which measures satisfaction levels related to “encounters with other boats while floating the river” is the basis for assessing floater satisfaction with the overall level of solitude on the Smith River. 90.26% of the floaters fell into the range of “Neutral to Liked Very Much.” There is a correlation between the number of boats seen per hour and the level of satisfaction. On average, respondents reported seeing 1.46 boats per hour with an average satisfaction of 3.9. This is

3
slightly above last years’ 1.32 boats per hour and slightly below last years’ satisfaction level of 4. These results are a strong indication of high floater satisfaction with the overall level of solitude. Most of the other statistics within this report are within similar ranges of previous years. In 2018, there was an uptick in dissatisfaction with the perception of crowding at Camp Baker during the month of June with 54% of respondents reporting they felt crowded. This perception has improved in the past two years and this year only 33% of respondents reported feeling crowded while launching, despite this being the busiest June in history. One factor for this decrease in feeling crowded may be due to the fact that overnight camping was discontinued to comply with social distancing.
SECTION 2 – MANAGEMENT ACTIVITIES
Staffing
Employees from Montana Fish, Wildlife & Parks (FWP) Region 4 and Helena-Lewis and Clark National Forest (USFS) involved with the 2020 Smith River State Park & River Corridor program included:
• Colin Maas – Smith River Manager (FWP)
• John Taillie – Region 4 Parks Manager (FWP)
• Robert Gliko – Resource Specialist (USFS)
• Nate Kluz – FWP Lead River Ranger (FWP)
• Cody Kenyon – River Ranger (FWP)
• Austin Moody – River Ranger (FWP)
• Don Mendenhall – River Ranger (USFS)
• Joshua Wagoner – Region 4 Maintenance Supervisor (FWP)
• Krystal Phares – Smith River Reservation Clerk (FWP) Numerous other employees from Region 4 FWP and the Helena Headquarters office, as well as individuals from the USFS, played a role in a team effort to make the Smith River State Park & River Corridor program work successfully.
4
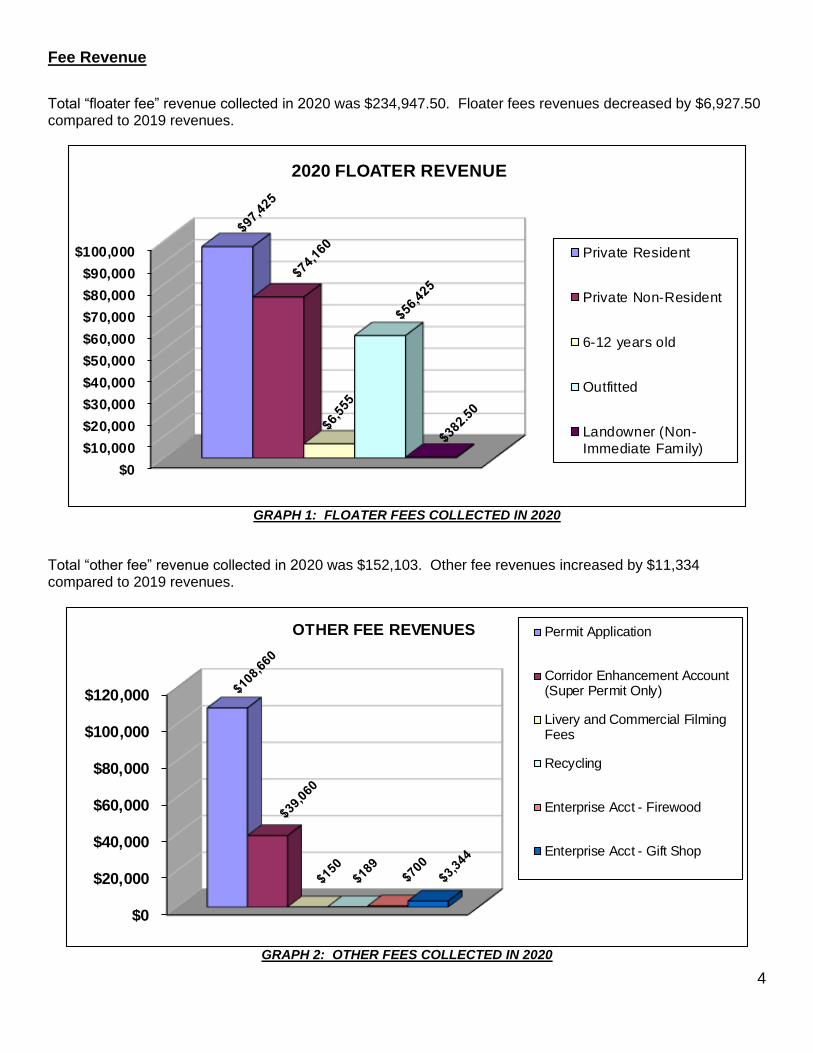
Fee Revenue Total “floater fee” revenue collected in 2020 was $234,947.50. Floater fees revenues decreased by $6,927.50 compared to 2019 revenues.
GRAPH 1: FLOATER FEES COLLECTED IN 2020
Total “other fee” revenue collected in 2020 was $152,103. Other fee revenues increased by $11,334 compared to 2019 revenues.
GRAPH 2: OTHER FEES COLLECTED IN 2020
$0
$10,000
$20,000
$30,000
$40,000
$50,000
$60,000
$70,000
$80,000
$90,000
$100,000
2020 FLOATER REVENUE
Private Resident
Private Non-Resident
6-12 years old
Outfitted
Landowner (Non-
Immediate Family)
$0
$20,000
$40,000
$60,000
$80,000
$100,000
$120,000
OTHER FEE REVENUES Permit Application
Corridor Enhancement Account(Super Permit Only)
Livery and Commercial FilmingFees
Recycling
Enterprise Acct - Firewood
Enterprise Acct - Gift Shop

5
The following floater fees approved for the 2020 season by means of the Smith River State Park Biennial Rule:
• Permit application fee (residents and non-residents, non-refundable) = $10.00
• Montana Resident Floaters Age 13+, Outfitter Staff = $25.00
• Non-Montana Resident Floaters Age 13+ = $60.00
• Children Ages 6-12 (Resident or Non-resident) = $15.00
• Landowner Non-Immediate Family = $7.50
• Outfitted Client Floater = $100.00
• Outfitted Launch Fee = $200.00
• Outfitted Transfer Fee = $200.00
Special Projects Completed in 2020 Camp Baker
➢ Added gravel and graded the road. Eden Bridge
➢ Installed a gate on fence line to open previously unused land north of the main parking area for overflow parking; begin use in 2021.
River Corridor
➢ Noxious weed control efforts were undertaken by the Smith River Habitat Project (SRHP), the Smith River Weed Volunteers and state, federal and county entities. West River Land Management, on behalf of SRHP, completed a ten-day float in early July and additional fall spraying via UTV. The Smith River Weed Volunteers performed a weed-pull float in June and toiled in extremely wet conditions. Total treated acres data for 2020 is not yet available at this time.
Smith River Weed Volunteers 2020 – Monsoon Edition

6
➢ Due to favorable growing conditions, rangers spent substantial time clearing vegetation on trails to latrines and reducing vegetation in general use areas of camps.
➢ Rebuilt stone steps at Upper Ridgetop landing. ➢ Continued hazard tree removals. Also cleaned up illegally felled trees at Upper
Ridgetop and Upper Rattlesnake camp. ➢ Replaced old, worn-out fire-rings at Syringa and Upper Cow Coulee and replaced
numerous latrine bases, risers and seats.
Administrative - Management Actions and Covid-19 Mitigation Measures
➢ Floating was closed via an emergency order from the end of March through April 11th due to unsafe condition from ice and ice-jams.
➢ On April 11, 2020 the emergency closure was changed from an ice closure to a closure due to mandates from the Governor to contain the spread of Covid-19.
➢ The river was re-opened to floating on May 5, 2020. From May 5th to May 31st, non-residents were allowed to float, but only after a 14-day quarantine. Quarantine restrictions for non-residents was lifted June 1st.
➢ Upon re-opening, Camp Baker was closed to overnight camping for the 2020 season. ➢ All registration, including payment and camp selection, was completed via phone two
days prior to a floater’s launch date. Floaters received permit paperwork at Camp Baker.
➢ Floater orientation talks were conducted outdoors at appropriate prescribed social distances.
➢ Permit holders that had permits cancelled due to ice and Covid-19 closures were given the option to have their 2020 permit honored on the same date in the 2021 season.
➢ Restriction to apply for a peak season permit in 2021 was “waived” for peak season permit holders from 2020.
SECTION 3 - VISITOR USE STATISTICS
Private Launch Applications
GRAPH 3: NUMBER OF APPLICANTS PER YEAR
56336156
66627377
8096
936510077
10530
10070
10866
0
1000
2000
3000
4000
5000
6000
7000
8000
9000
10000
11000
12000
2011 2012 2013 2014 2015 2016 2017 2018 2019 2020
NUMBER OF APPLICATIONS RECEIVED PER YEAR

7
2020 FLOATER LOG COMMENT SUMMARY CAMPSITE QUESTIONS: Question: Overall, how satisfied were you with this boat camp?
GRAPH 4: BOAT CAMP SATISFACTION
Question: Did you feel crowded by other groups occupying adjacent or nearby boat camps?
GRAPH 5: PERCEPTION OF CROWDING BY ADJACENT BOAT CAMPS
0%
10%
20%
30%
40%
50%
60%
70%
VERY
DISSATI SFIED
DISSATI SFIED NEITHER
SATISFIED OR
DISSATI SFIED
SATISFIED VERY
SATISFIED
4% 3%6%
19%
68%
OVERALL, HOW SATISFIED WERE YOU WITH THIS BOAT CAMP?
0%
20%
40%
60%
80%
100%
2020
6%
94%
DID YOU FEEL CROWDED BY OTHER GROUPS OCCUPYING ADJACENT OR NEARBY BOAT CAMPS?
YES NO

8
FLOATING QUESTIONS: Question: How many other boats did you observe while floating the river today (excluding your group)?
GRAPH 6: FLOATER PERCEPTION OF NUMBER OF BOATS SEEN PER HOUR
GRAPH 7: FLOATER PERCEPTION OF NUMBER OF BOATS SEEN PER MILE
0
0.5
1
1.5
2
APRIL MAY JUNE JULY
0
1.56
1.89
1.38
AVERAGE NUMBER OF BOATS SEEN PER HOUR WHILE FLOATING (BREAKOUT BY MONTH)
0
0.2
0.4
0.6
0.8
1
APRIL MAY JUNE JULY
0
0.54
0.83
0.64
AVERAGE NUMBER OF BOATS SEEN PER MILE WHILE FLOATING (BREAKOUT BY MONTH)

9
Question: How did you feel about the number of other boats observed on the water while floating the river today? Beginning in 2010, FWP implemented the new social indicator of encounters with other boats while on the river. This indicator has become the basis for assessing floater satisfaction with the overall level of solitude. The corresponding standard, that defines the appropriate satisfaction level with solitude, has not yet been determined.
GRAPH 8: FLOATER PERCEPTION OF NUMBER OF BOATS SEEN PER DAY
GRAPH 9: FLOATER PERCEPTION OF NUMBER OF BOATS SEEN PER DAY –
OVERALL PERCENT OF RESPONSE
0.00%
10.00%
20.00%
30.00%
40.00%
50.00%
1 Disliked
Very Much
2 Disliked
Somewhat
3 Neutral 2 Liked
Somewhat
5 Liked Very
Much
1.85%
7.89%
31.40%
7.89%
41.38%
HOW DID YOU FEEL ABOUT THE NUMBER OF OTHER BOATS OBSERVED ON THE WATER WHILE FLOATING THE RIVER TODAY?
(OVERALL PERCENT OF RESPONSE)

10
GRAPH 10: FLOATER PERCEPTION OF NUMBER OF BOATS SEEN PER DAY – OVERALL
RESPONSE PER HOUR
Written responses to questions 1, 2, 5 and 7 of the floater logs are contained verbatim in the 2020 Floater Log Comments document.
Smith River Photo Bomb!
4.53
3.74
3.41 3.03
2.79 3.00
0
1
2
3
4
5
0 - .99 1 - 1.99 2 - 2.99 3 - 3.99 4 - 4.99 5 or
more
Number of Other Boats Seen Per Hour
*Less than 13% of respondents reported seeing 3 or more boats per hour
HOW DID YOU FEEL ABOUT THE NUMBER OF OTHER BOATS OBSERVED ON THE WATER WHILE FLOATING THE
RIVER TODAY? (OVERALL RESPONSE - PER HOUR)
1 = DISLIKED VERY MUCH2 = DISLIKED SOMEWHAT3 = NEUTRAL4 = LIKED SOMEWHAT5 = LIKED VERY MUCH

11
Question #3: Did you feel crowded at the put-in? Yes or No
GRAPH 11: FLOATER PERCEPTION OF FEELING CROWDED AT CAMP BAKER PUT-IN
Question #4: Did you feel crowded at the take-out? Yes or No
GRAPH 12: FLOATER PERCEPTION OF FEELING CROWDED AT EDEN BRIDGE TAKE-OUT
0%
20%
40%
60%
80%
100%
APRIL MAY JUNE JULY
0%
16%
33%
14%
0%
84%
67%
86%
DID YOU FEEL CROWDED AT THE CAMP BAKER PUT-IN? (BREAKOUT BY MONTH)
Yes No
0%
20%
40%
60%
80%
100%
APRIL MAY JUNE JULY
0%
11%
30%
9%0%
89%
70%
91%
DID YOU FEEL CROWDED AT THE EDEN BRIDGE TAKE-OUT? (BREAKOUT BY MONTH)
Yes No

12
Question # 7: Please rate your overall satisfaction with your Smith River trip.
GRAPH 13: FLOATER OVERALL SATISFACTION WITH SMITH RIVER TRIP
Lower Indian Springs
0%
10%
20%
30%
40%
50%
60%
70%
80%
90%
1 Poor 2 3 Neutral 4 5 Excellent
0.0% 0.0% 1.3%
11.3%
87.4%
PLEASE RATE YOUR OVERALL SATISFACTION WITH YOUR SMITH RIVER TRIP
RATING (% OF RESPONSE)

13
BOAT CAMP RIVER MILE
LAND
OWNERSHIP
NUMBER OF GROUPS
STAYED AT EACH
BOATCAMP % OF OVERALL USE
UPPER SPRING CREEK 4.4 FWP 2 0.07%
LOWER SPRING CREEK 4.4 FWP 2 0.07%
IN LIEU 5.6 FWP 1 0.04%
UPPER INDIAN SPRINGS 6 USFS 15 0.56%
MIDDLE INDIAN SPRINGS 6 USFS 65 2.42%
LOWER INDIAN SPRINGS 6 USFS 64 2.38%
UPPER ROCK GARDEN 6.8 USFS 68 2.53%
LOWER ROCK GARDEN 6.8 USFS 63 2.35%
ROCK CREEK 8.9 USFS 103 3.84%
UPPER SCOTTY ALLEN 12 USFS 74 2.76%
MIDDLE SCOTTY ALLEN 12 USFS 39 1.45%
LOWER SCOTTY ALLEN 12 USFS 85 3.17%
SYRINGA 15.2 DNRC 74 2.76%
CANYON DEPTH 16.9 USFS 78 2.91%
TWO CREEK 17.8 USFS 46 1.71%
SHEEPWAGON 18.4 USFS 60 2.24%
UPPER COW COULEE 22.8 USFS 76 2.83%
MIDDLE COW COULEE 22.8 USFS 68 2.53%
LOWER COW COULEE 22.8 USFS 27 1.01%
UPPER SUNSET CLIFF 23.6 USFS 88 3.28%
MIDDLE SUNSET CLIFF 23.6 USFS 84 3.13%
LOWER SUNSET CLIFF 23.6 USFS 87 3.24%
COUNTY LINE 25.5 USFS 37 1.38%
UPPER BEAR GULCH 29 USFS 22 0.82%
LOWER BEAR GULCH 29 USFS 48 1.79%
UPPER TROUT CREEK 30.3 FWP 11 0.41%
MIDDLE TROUT CREEK 30.3 FWP 8 0.30%
LOWER TROUT CREEK 30.3 FWP 20 0.75%
CROWSFOOT 32 FWP 75 2.79%
UPPER TABLE ROCK 33.5 USFS 47 1.75%
MIDDLE TABLE ROCK 33.5 USFS 37 1.38%
LOWER TABLE ROCK 33.5 USFS 24 0.89%
UPPER FRAUNHOFER 35.4 USFS 88 3.28%
LOWER FRAUNHOFER 35.4 USFS 58 2.16%
MEADOW BEND 35.6 FWP 33 1.23%
UPPER PARKER FLAT 37.5 USFS 79 2.94%
PARKER FLAT #1 37.9 FWP 58 2.16%
PARKER FLAT #2 37.9 FWP 11 0.41%
PARKER FLAT #3 37.9 FWP 43 1.60%
DEEP CREEK 38.7 PRIVATE 14 0.52%
PARADISE BEND 39.5 FWP 55 2.05%
STAIGMILLER 44 PRIVATE 60 2.24%
MERGANSER BEND 44.5 FWP 40 1.49%
UPPER BLACK BUTTE 44.8 FWP 45 1.68%
LOWER BLACK BUTTE 44.8 FWP 21 0.78%
UPPER RIDGETOP 45 PRIVATE 77 2.87%
MIDDLE RIDGETOP 45 PRIVATE 72 2.68%
LOWER RIDGETOP 45 PRIVATE 85 3.17%
UPPER GIVENS GULCH 47.2 PRIVATE 1 0.04%
LOWER GIVENS GULCH 47.2 PRIVATE 94 3.50%
UPPER RATTLESNAKE 47.4 PRIVATE 69 2.57%
LOWER RATTLESNAKE 47.4 PRIVATE 83 3.09%
TOTALS 2684 100.00%
# OF SITES SITES OWNED BY % OF TOTAL SITES
15 FWP 29%
1 DNRC 2%
9 PRIVATE 17%
27 USFS 52%
52 100%
2020 BOAT CAMP GROUP USE
BOATCAMP LAND DISTRIBUTION
14
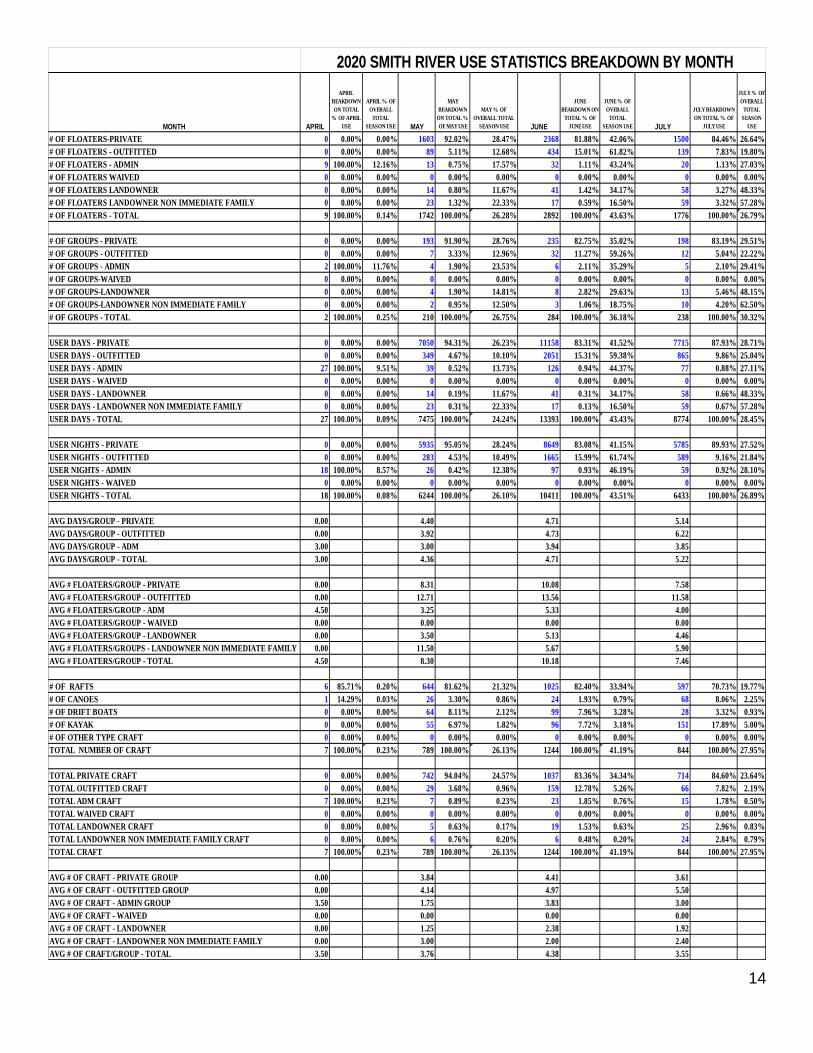
MONTH APRIL
APRIL
BEAKDOWN
ON TOTAL
% OF APRIL
USE
APRIL % OF
OVERALL
TOTAL
SEASON USE MAY
MAY
BEAKDOWN
ON TOTAL %
OF MAY USE
MAY % OF
OVERALL TOTAL
SEASON USE JUNE
JUNE
BEAKDOWN ON
TOTAL % OF
JUNE USE
JUNE % OF
OVERALL
TOTAL
SEASON USE JULY
JULY BEAKDOWN
ON TOTAL % OF
JULY USE
JULY % OF
OVERALL
TOTAL
SEASON
USE
# OF FLOATERS-PRIVATE 0 0.00% 0.00% 1603 92.02% 28.47% 2368 81.88% 42.06% 1500 84.46% 26.64%
# OF FLOATERS - OUTFITTED 0 0.00% 0.00% 89 5.11% 12.68% 434 15.01% 61.82% 139 7.83% 19.80%
# OF FLOATERS - ADMIN 9 100.00% 12.16% 13 0.75% 17.57% 32 1.11% 43.24% 20 1.13% 27.03%
# OF FLOATERS WAIVED 0 0.00% 0.00% 0 0.00% 0.00% 0 0.00% 0.00% 0 0.00% 0.00%
# OF FLOATERS LANDOWNER 0 0.00% 0.00% 14 0.80% 11.67% 41 1.42% 34.17% 58 3.27% 48.33%
# OF FLOATERS LANDOWNER NON IMMEDIATE FAMILY 0 0.00% 0.00% 23 1.32% 22.33% 17 0.59% 16.50% 59 3.32% 57.28%
# OF FLOATERS - TOTAL 9 100.00% 0.14% 1742 100.00% 26.28% 2892 100.00% 43.63% 1776 100.00% 26.79%
# OF GROUPS - PRIVATE 0 0.00% 0.00% 193 91.90% 28.76% 235 82.75% 35.02% 198 83.19% 29.51%
# OF GROUPS - OUTFITTED 0 0.00% 0.00% 7 3.33% 12.96% 32 11.27% 59.26% 12 5.04% 22.22%
# OF GROUPS - ADMIN 2 100.00% 11.76% 4 1.90% 23.53% 6 2.11% 35.29% 5 2.10% 29.41%
# OF GROUPS-WAIVED 0 0.00% 0.00% 0 0.00% 0.00% 0 0.00% 0.00% 0 0.00% 0.00%
# OF GROUPS-LANDOWNER 0 0.00% 0.00% 4 1.90% 14.81% 8 2.82% 29.63% 13 5.46% 48.15%
# OF GROUPS-LANDOWNER NON IMMEDIATE FAMILY 0 0.00% 0.00% 2 0.95% 12.50% 3 1.06% 18.75% 10 4.20% 62.50%
# OF GROUPS - TOTAL 2 100.00% 0.25% 210 100.00% 26.75% 284 100.00% 36.18% 238 100.00% 30.32%
USER DAYS - PRIVATE 0 0.00% 0.00% 7050 94.31% 26.23% 11158 83.31% 41.52% 7715 87.93% 28.71%
USER DAYS - OUTFITTED 0 0.00% 0.00% 349 4.67% 10.10% 2051 15.31% 59.38% 865 9.86% 25.04%
USER DAYS - ADMIN 27 100.00% 9.51% 39 0.52% 13.73% 126 0.94% 44.37% 77 0.88% 27.11%
USER DAYS - WAIVED 0 0.00% 0.00% 0 0.00% 0.00% 0 0.00% 0.00% 0 0.00% 0.00%
USER DAYS - LANDOWNER 0 0.00% 0.00% 14 0.19% 11.67% 41 0.31% 34.17% 58 0.66% 48.33%
USER DAYS - LANDOWNER NON IMMEDIATE FAMILY 0 0.00% 0.00% 23 0.31% 22.33% 17 0.13% 16.50% 59 0.67% 57.28%
USER DAYS - TOTAL 27 100.00% 0.09% 7475 100.00% 24.24% 13393 100.00% 43.43% 8774 100.00% 28.45%
USER NIGHTS - PRIVATE 0 0.00% 0.00% 5935 95.05% 28.24% 8649 83.08% 41.15% 5785 89.93% 27.52%
USER NIGHTS - OUTFITTED 0 0.00% 0.00% 283 4.53% 10.49% 1665 15.99% 61.74% 589 9.16% 21.84%
USER NIGHTS - ADMIN 18 100.00% 8.57% 26 0.42% 12.38% 97 0.93% 46.19% 59 0.92% 28.10%
USER NIGHTS - WAIVED 0 0.00% 0.00% 0 0.00% 0.00% 0 0.00% 0.00% 0 0.00% 0.00%
USER NIGHTS - TOTAL 18 100.00% 0.08% 6244 100.00% 26.10% 10411 100.00% 43.51% 6433 100.00% 26.89%
AVG DAYS/GROUP - PRIVATE 0.00 4.40 4.71 5.14
AVG DAYS/GROUP - OUTFITTED 0.00 3.92 4.73 6.22
AVG DAYS/GROUP - ADM 3.00 3.00 3.94 3.85
AVG DAYS/GROUP - TOTAL 3.00 4.36 4.71 5.22
AVG # FLOATERS/GROUP - PRIVATE 0.00 8.31 10.08 7.58
AVG # FLOATERS/GROUP - OUTFITTED 0.00 12.71 13.56 11.58
AVG # FLOATERS/GROUP - ADM 4.50 3.25 5.33 4.00
AVG # FLOATERS/GROUP - WAIVED 0.00 0.00 0.00 0.00
AVG # FLOATERS/GROUP - LANDOWNER 0.00 3.50 5.13 4.46
AVG # FLOATERS/GROUPS - LANDOWNER NON IMMEDIATE FAMILY 0.00 11.50 5.67 5.90
AVG # FLOATERS/GROUP - TOTAL 4.50 8.30 10.18 7.46
# OF RAFTS 6 85.71% 0.20% 644 81.62% 21.32% 1025 82.40% 33.94% 597 70.73% 19.77%
# OF CANOES 1 14.29% 0.03% 26 3.30% 0.86% 24 1.93% 0.79% 68 8.06% 2.25%
# OF DRIFT BOATS 0 0.00% 0.00% 64 8.11% 2.12% 99 7.96% 3.28% 28 3.32% 0.93%
# OF KAYAK 0 0.00% 0.00% 55 6.97% 1.82% 96 7.72% 3.18% 151 17.89% 5.00%
# OF OTHER TYPE CRAFT 0 0.00% 0.00% 0 0.00% 0.00% 0 0.00% 0.00% 0 0.00% 0.00%
TOTAL NUMBER OF CRAFT 7 100.00% 0.23% 789 100.00% 26.13% 1244 100.00% 41.19% 844 100.00% 27.95%
TOTAL PRIVATE CRAFT 0 0.00% 0.00% 742 94.04% 24.57% 1037 83.36% 34.34% 714 84.60% 23.64%
TOTAL OUTFITTED CRAFT 0 0.00% 0.00% 29 3.68% 0.96% 159 12.78% 5.26% 66 7.82% 2.19%
TOTAL ADM CRAFT 7 100.00% 0.23% 7 0.89% 0.23% 23 1.85% 0.76% 15 1.78% 0.50%
TOTAL WAIVED CRAFT 0 0.00% 0.00% 0 0.00% 0.00% 0 0.00% 0.00% 0 0.00% 0.00%
TOTAL LANDOWNER CRAFT 0 0.00% 0.00% 5 0.63% 0.17% 19 1.53% 0.63% 25 2.96% 0.83%
TOTAL LANDOWNER NON IMMEDIATE FAMILY CRAFT 0 0.00% 0.00% 6 0.76% 0.20% 6 0.48% 0.20% 24 2.84% 0.79%
TOTAL CRAFT 7 100.00% 0.23% 789 100.00% 26.13% 1244 100.00% 41.19% 844 100.00% 27.95%
AVG # OF CRAFT - PRIVATE GROUP 0.00 3.84 4.41 3.61
AVG # OF CRAFT - OUTFITTED GROUP 0.00 4.14 4.97 5.50
AVG # OF CRAFT - ADMIN GROUP 3.50 1.75 3.83 3.00
AVG # OF CRAFT - WAIVED 0.00 0.00 0.00 0.00
AVG # OF CRAFT - LANDOWNER 0.00 1.25 2.38 1.92
AVG # OF CRAFT - LANDOWNER NON IMMEDIATE FAMILY 0.00 3.00 2.00 2.40
AVG # OF CRAFT/GROUP - TOTAL 3.50 3.76 4.38 3.55
2020 SMITH RIVER USE STATISTICS BREAKDOWN BY MONTH

15
MONTH AUG
AUG BEAKDOWN
ON TOTAL % OF
AUG USE
AUG % OF
OVERALL
TOTAL
SEASON USE SEPT
SEPT
BEAKDOWN ON
TOTAL % OF
SEPT USE
SEPT % OF
OVERALL
TOTAL
SEASON USE OCT
OCT
BEAKDOWN ON
TOTAL % OF
OCT USE
OCT % OF
OVERALL
TOTAL
SEASON USE TOTAL
TOTAL
PERCENT
# OF FLOATERS-PRIVATE 52 82.54% 0.92% 83 67.48% 1.47% 24 100.00% 0.43% 5630 84.93%
# OF FLOATERS - OUTFITTED 0 0.00% 0.00% 40 32.52% 5.70% 0 0.00% 0.00% 702 10.59%
# OF FLOATERS - ADMIN 0 0.00% 0.00% 0 0.00% 0.00% 0 0.00% 0.00% 74 1.12%
# OF FLOATERS WAIVED 0 0.00% 0.00% 0 0.00% 0.00% 0 0.00% 0.00% 0 0.00%
# OF FLOATERS LANDOWNER 7 11.11% 5.83% 0 0.00% 0.00% 0 0.00% 0.00% 120 1.81%
# OF FLOATERS LANDOWNER NON IMMEDIATE FAMILY 4 6.35% 3.88% 0 0.00% 0.00% 0 0.00% 0.00% 103 1.55%
# OF FLOATERS - TOTAL 63 100.00% 0.95% 123 100.00% 1.86% 24 100.00% 0.36% 6629 100.00%
# OF GROUPS - PRIVATE 14 82.35% 2.09% 23 88.46% 3.43% 8 100.00% 1.19% 671 85.48%
# OF GROUPS - OUTFITTED 0 0.00% 0.00% 3 11.54% 5.56% 0 0.00% 0.00% 54 6.88%
# OF GROUPS - ADMIN 0 0.00% 0.00% 0 0.00% 0.00% 0 0.00% 0.00% 17 2.17%
# OF GROUPS-WAIVED 0 0.00% 0.00% 0 0.00% 0.00% 0 0.00% 0.00% 0 0.00%
# OF GROUPS-LANDOWNER 2 11.76% 7.41% 0 0.00% 0.00% 0 0.00% 0.00% 27 3.44%
# OF GROUPS-LANDOWNER NON IMMEDIATE FAMILY 1 5.88% 6.25% 0 0.00% 0.00% 0 0.00% 0.00% 16 2.04%
# OF GROUPS - TOTAL 17 100.00% 2.17% 26 100.00% 3.31% 8 100.00% 1.02% 785 100.00%
USER DAYS - PRIVATE 384 93.66% 1.43% 459 74.27% 1.71% 109 78.42% 0.41% 26875 87.15%
USER DAYS - OUTFITTED 0 0.00% 0.00% 159 25.73% 4.60% 30 21.58% 0.87% 3454 11.20%
USER DAYS - ADMIN 15 3.66% 5.28% 0 0.00% 0.00% 0 0.00% 0.00% 284 0.92%
USER DAYS - WAIVED 0 0.00% 0.00% 0 0.00% 0.00% 0 0.00% 0.00% 0 0.00%
USER DAYS - LANDOWNER 7 1.71% 5.83% 0 0.00% 0.00% 0 0.00% 0.00% 120 0.39%
USER DAYS - LANDOWNER NON IMMEDIATE FAMILY 4 0.98% 3.88% 0 0.00% 0.00% 0 0.00% 0.00% 103 0.33%
USER DAYS - TOTAL 410 100.00% 1.33% 618 100.00% 2.00% 139 100.00% 0.45% 30836 100.00%
USER NIGHTS - PRIVATE 196 95.15% 0.93% 370 71.84% 1.76% 84 84.85% 0.40% 21019 87.85%
USER NIGHTS - OUTFITTED 0 0.00% 0.00% 145 28.16% 5.38% 15 15.15% 0.56% 2697 11.27%
USER NIGHTS - ADMIN 10 4.85% 4.76% 0 0.00% 0.00% 0 0.00% 0.00% 210 0.88%
USER NIGHTS - WAIVED 0 0.00% 0.00% 0 0.00% 0.00% 0 0.00% 0.00% 0 0.00%
USER NIGHTS - TOTAL 206 100.00% 0.86% 515 100.00% 2.15% 99 100.00% 0.41% 23926 100.00%
AVG DAYS/GROUP - PRIVATE 7.38 5.53 4.54 4.77
AVG DAYS/GROUP - OUTFITTED 0.00 3.98 0.00 4.92
AVG DAYS/GROUP - ADM 0.00 0.00 0.00 3.84
AVG DAYS/GROUP - TOTAL 7.67 5.02 5.79 4.78
AVG # FLOATERS/GROUP - PRIVATE 3.71 3.61 3.00 8.39
AVG # FLOATERS/GROUP - OUTFITTED 0.00 13.33 0.00 13.00
AVG # FLOATERS/GROUP - ADM 0.00 0.00 0.00 4.35
AVG # FLOATERS/GROUP - WAIVED 0.00 0.00 0.00 0.00
AVG # FLOATERS/GROUP - LANDOWNER 3.50 0.00 0.00 4.44
AVG # FLOATERS/GROUPS - LANDOWNER NON IMMEDIATE FAMILY 4.00 0.00 0.00 6.44
AVG # FLOATERS/GROUP - TOTAL 3.71 4.73 3.00 8.44
# OF RAFTS 15 35.71% 0.50% 46 58.23% 1.52% 7 46.67% 0.23% 2340 77.48%
# OF CANOES 16 38.10% 0.53% 23 29.11% 0.76% 5 33.33% 0.17% 163 5.40%
# OF DRIFT BOATS 0 0.00% 0.00% 4 5.06% 0.13% 0 0.00% 0.00% 195 6.46%
# OF KAYAK 11 26.19% 0.36% 6 7.59% 0.20% 3 20.00% 0.10% 322 10.66%
# OF OTHER TYPE CRAFT 0 0.00% 0.00% 0 0.00% 0.00% 0 0.00% 0.00% 0 0.00%
TOTAL NUMBER OF CRAFT 42 100.00% 1.39% 79 100.00% 2.62% 15 100.00% 0.50% 3020 100.00%
TOTAL PRIVATE CRAFT 35 83.33% 1.16% 58 73.42% 1.92% 15 100.00% 0.50% 2601 86.13%
TOTAL OUTFITTED CRAFT 0 0.00% 0.00% 21 26.58% 0.70% 0 0.00% 0.00% 275 9.11%
TOTAL ADM CRAFT 0 0.00% 0.00% 0.00% 0.00% 0 0.00% 0.00% 52 1.72%
TOTAL WAIVED CRAFT 0 0.00% 0.00% 0.00% 0.00% 0 0.00% 0.00% 0 0.00%
TOTAL LANDOWNER CRAFT 5 11.90% 0.17% 0.00% 0.00% 0 0.00% 0.00% 54 1.79%
TOTAL LANDOWNER NON IMMEDIATE FAMILY CRAFT 2 4.76% 0.07% 0.00% 0.00% 0 0.00% 0.00% 38 1.26%
TOTAL CRAFT 42 100.00% 1.39% 79 100.00% 2.62% 15 100.00% 0.50% 3020 100.00%
AVG # OF CRAFT - PRIVATE GROUP 2.50 2.52 1.88 3.88
AVG # OF CRAFT - OUTFITTED GROUP 0.00 7.00 0.00 5.09
AVG # OF CRAFT - ADMIN GROUP 0.00 0.00 0.00 3.06
AVG # OF CRAFT - WAIVED 0.00 0.00 0.00 0.00
AVG # OF CRAFT - LANDOWNER 2.50 0.00 0.00 2.00
AVG # OF CRAFT - LANDOWNER NON IMMEDIATE FAMILY 2.00 0.00 0.00 2.38
AVG # OF CRAFT/GROUP - TOTAL 2.47 3.04 1.88 3.85
2020 SMITH RIVER USE STATISTICS BREAKDOWN BY MONTH

16
YEAR 2001 2002 2003 2004 2005 2006 2007 2008 2009 2010 2011 2012 2013 2014 2015 2016 2017 2018 2019 2020 AVERAGE
# OF FLOATERS-PRIVATE 1,678 2,798 3,065 3,187 3,197 3,894 3,567 3,931 4,311 3,986 3,259 3,962 3,883 4,684 3,781 4,367 4,670 5,126 5,162 5,630 3,907
# OF FLOATERS - GUIDED 505 626 452 517 573 638 632 710 478 496 445 504 509 518 432 611 697 795 808 702 582
# OF FLOATERS - ADMIN 32 59 85 48 37 51 38 66 91 63 89 49 79 87 71 92 107 101 95 74 71
# OF FLOATERS WAIVED 0 0 0 0 0 12 0 0 0 9 0 9 11 0 0 0 0 0 0 0 2
# OF FLOATERS LANDOWNER 21 12 42 40 47 67 19 54 105 47 67 41 18 35 35 59 38 93 54 120 51
# OF FLOATERS LANDOWNER NON IMMEDIATE
FAMILY 26 46 70 63 87 74 73 75 93 98 139 149 88 51 36 64 87 74 113 103 80
# OF FLOATERS - TOTAL 2,262 3,541 3,714 3,855 3,941 4,736 4,329 4,836 5,078 4,699 3,999 4,714 4,588 5,375 4,355 5,193 5,599 6,189 6,232 6,629 4,693
# OF GROUPS - PRIVATE 291 450 450 503 526 582 507 560 621 613 539 567 531 673 537 605 596 689 708 671 561
# OF GROUPS - GUIDED 42 48 37 46 48 52 48 54 39 42 40 43 40 40 36 47 54 62 65 54 47
# OF GROUPS - ADMIN 13 20 18 16 12 13 13 22 21 19 24 17 21 22 19 25 27 28 23 17 20
# OF GROUPS-WAIVED 0 0 0 0 0 1 0 0 0 1 0 1 1 0 0 0 0 0 0 0 0
# OF GROUPS-LANDOWNER 4 3 11 12 14 16 5 8 20 11 16 8 5 9 8 15 10 17 12 27 12
# OF GROUPS-LANDOWNER NON IMMEDIATE
FAMILY 5 9 12 10 18 10 13 12 13 17 21 22 14 7 7 11 16 13 16 16 13
# OF GROUPS - TOTAL 355 530 528 587 618 674 586 656 714 703 640 658 612 751 607 703 703 809 824 785 652
USER DAYS - PRIVATE 7,657 12,340 13,673 13,867 14,278 17,307 15,517 17,317 18,916 17,447 14,971 17,266 17,460 21,339 17,417 20,366 21,225 23,867 24,039 26,875 17,657
USER DAYS - GUIDED 2,490 3,129 2,205 2,429 2,860 3,168 3,155 3,539 2,390 2,469 2,185 2,521 2,419 2,557 2,154 3,032 3,448 3,953 4,021 3,454 2,879
USER DAYS - ADMIN 127 195 377 215 157 222 171 243 320 236 300 178 307 386 261 283 407 363 390 284 271
USER DAYS - WAIVED 0 0 0 0 0 60 0 0 0 45 0 36 55 0 0 0 0 0 0 0 10
USER DAYS - LANDOWNER 21 12 42 40 47 67 19 58 105 47 67 26 18 35 35 59 38 93 54 120 50
USER DAYS - LANDOWNER NON IMMEDIATE
FAMILY 26 46 70 63 87 74 73 72 93 98 139 149 88 51 36 64 87 74 113 103 80
USER DAYS - TOTAL 10,321 15,722 16,367 16,614 17,429 20,898 18,935 21,229 21,824 20,342 17,662 20,176 20,347 24,368 19,903 23,804 25,205 28,350 28,617 30,836 20,947
USER NIGHTS - PRIVATE 5,995 10,141 10,636 10,502 11,078 13,288 11,938 13,502 14,856 13,490 11,112 13,722 13,582 16,613 13,559 15,887 16,680 18,388 18,681 21,019 13,733
USER NIGHTS - GUIDED 1,960 2,256 1,777 1,796 2,432 2,393 2,611 2,797 1,847 1,973 1,745 2,005 1,902 2,029 1,686 2,408 2,702 3,101 3,126 2,697 2,262
USER NIGHTS - ADMIN 97 178 298 176 121 167 134 199 148 177 213 129 228 297 192 217 289 209 317 210 200
USER NIGHTS - WAIVED 0 0 0 0 0 48 0 0 0 36 0 27 44 0 0 0 0 0 0 0 8
USER NIGHTS - TOTAL 8,052 12,575 12,711 12,474 13,631 15,896 14,683 16,498 16,851 15,676 13,070 15,883 15,756 18,939 15,437 18,512 19,671 21,698 22,124 23,926 16,203
AVG DAYS/GROUP - PRIVATE 4.56 4.41 4.46 4.35 4.47 4.44 4.35 4.41 4.39 4.38 4.59 4.36 4.50 4.56 4.61 4.66 4.54 4.66 4.66 4.77 4.52
AVG DAYS/GROUP - GUIDED 4.93 5.00 4.88 4.70 4.99 4.97 4.99 4.98 5.00 4.98 4.91 5.00 4.75 4.94 4.99 4.96 4.95 4.97 4.98 4.92 4.94
AVG DAYS/GROUP - ADM 3.97 3.31 4.44 4.48 4.24 4.35 4.50 3.68 3.52 3.75 3.37 3.63 3.89 4.44 3.68 3.08 3.80 3.59 4.11 3.84 3.83
AVG DAYS/GROUP - TOTAL 4.64 4.50 4.51 4.40 4.54 4.52 4.45 4.48 4.43 4.44 4.60 4.42 4.52 4.59 4.63 4.67 4.58 4.68 4.69 4.78 4.78
AVG # FLOATERS/GROUP - PRIVATE 5.77 6.22 6.81 6.34 6.08 6.69 7.04 7.02 6.94 6.50 6.05 6.99 7.31 6.96 7.04 7.22 7.84 7.44 7.29 8.39 6.96
AVG # FLOATERS/GROUP - GUIDED 12.02 13.04 12.22 11.24 11.94 12.27 13.17 13.15 12.26 11.81 11.13 11.72 12.73 12.95 12.00 13.00 12.91 12.82 12.43 13.00 12.43
AVG # FLOATERS/GROUP - ADM 2.46 2.95 4.72 3.00 3.08 3.92 2.92 3.00 4.33 3.32 3.71 2.88 3.76 3.95 3.74 3.68 3.96 3.61 4.13 4.35 3.63
AVG # FLOATERS/GROUP - WAIVED 0.00 0.00 0.00 0.00 0.00 12.00 0.00 0.00 0.00 9.00 0.00 9.00 11.00 0.00 0.00 0.00 0.00 0.00 0.00 0.00 10.25
AVG # FLOATERS/GROUP - LANDOWNER 5.25 4.00 3.82 3.33 3.36 4.19 3.80 6.75 5.25 4.27 4.19 5.13 3.60 3.89 4.38 3.93 3.80 5.47 4.50 4.44 4.39
AVG # FLOATERS/GROUPS - LANDOWNER NON
IMMEDIATE FAMILY 5.20 5.11 5.83 6.30 4.83 7.40 5.62 6.25 7.15 5.76 6.62 6.77 6.29 7.29 5.14 5.82 5.44 5.69 7.06 6.44 6.14
AVG#FlOATERS/GROUP - PRIVATEand GUIDED 6.56 6.88 7.22 6.75 6.57 7.15 7.57 7.56 7.26 6.84 6.40 7.32 7.69 7.30 7.35 7.63 8.26 7.88 7.72 8.73 7.39
AVG # FLOATERS/GROUP - TOTAL 6.37 6.68 7.03 6.57 6.38 7.03 7.39 7.37 7.11 6.68 6.25 7.16 7.50 7.16 7.17 7.39 7.96 7.65 7.56 8.44 7.20
SMITH RIVER TREND STATISTICS (2001-2020)

17
YEAR 2001 2002 2003 2004 2005 2006 2007 2008 2009 2010 2011 2012 2013 2014 2015 2016 2017 2018 2019 2020 AVERAGE
# OF RAFTS 759 1101 1245 1237 1311 1560 1545 1693 1766 1624 1552 1651 1829 1965 1701 2009 2047 2291 2255 2340 1,674
# OF CANOES 244 378 276 284 235 259 209 210 200 215 150 155 153 206 185 152 164 133 178 163 207
# OF DRIFT BOATS 37 63 96 86 113 119 128 138 168 163 91 115 86 131 80 118 131 195 171 195 121
# OF KAYAKS 56 151 133 157 133 206 162 184 189 151 174 214 164 204 147 180 249 246 305 322 186
# OF OTHER TYPE CRAFT 24 55 23 56 44 90 NA NA NA NA NA NA NA NA NA NA NA 0 0 0 32
TOTAL NUMBER OF CRAFT 1120 1748 1773 1820 1836 2234 2044 2225 2323 2153 1967 2135 2232 2506 2113 2459 2591 2865 2909 3020 2,204
TOTAL PRIVATE CRAFT 837 1368 1452 1503 1494 1867 1685 1808 2008 1836 1608 1759 1925 2218 1846 2124 2166 2403 2452 2601 1,848
TOTAL GUIDED CRAFT 241 293 209 218 253 240 273 307 195 220 216 240 209 205 191 248 307 342 325 275 250
TOTAL ADM CRAFT 20 42 45 28 20 33 24 37 42 37 51 34 42 58 46 40 62 64 52 52 41
TOTAL WAIVED CRAFT 0 0 0 0 0 3 0 0 0 3 0 3 3 0 0 0 0 0 0 0 1
TOTAL LANDOWNER CRAFT 10 6 20 19 20 32 18 28 39 21 28 12 10 12 18 27 19 34 29 54 23
TOTAL LANDOWNER NON IMMEDIATE FAMILY
CRAFT 12 39 47 52 49 59 44 45 39 36 64 87 43 13 12 20 37 22 51 38 40
AVG # OF CRAFT/PRIVATE GROUP 2.88 3.04 3.23 2.99 2.84 3.21 3.32 3.23 3.23 3.00 2.98 3.10 3.63 3.30 3.44 3.51 3.63 3.49 3.46 3.88 3.29
AVG # OF CRAFT/GUIDED GROUP 5.74 6.10 5.65 4.74 5.27 4.62 5.69 5.69 5.00 5.24 5.40 5.58 5.23 5.13 5.31 5.28 5.69 5.52 5.00 5.09 5.34
AVG # OF CRAFT/ADMIN GROUP 1.54 2.10 2.50 1.75 1.67 2.54 1.85 1.68 2.00 1.95 2.13 2.00 2.00 2.64 2.42 1.60 2.30 2.29 2.26 3.06 2.13
AVG # OF CRAFT/WAIVED 0.00 0.00 0.00 0.00 0.00 3.00 0.00 0.00 0.00 3.00 0.00 3.00 3.00 0.00 0.00 0.00 0.00 0.00 0.00 0.00 3.00
AVG # OF CRAFT/LANDOWNER 2.50 2.00 1.82 1.58 1.43 2.00 3.60 3.50 1.95 1.91 1.75 1.50 2.00 1.33 2.25 1.80 1.90 2.00 2.42 2.00 1.97
AVG # OF CRAFT/LANDOWNER NON IMMEDIATE
FAMILY 2.40 4.33 3.92 5.20 2.72 5.90 3.38 3.75 3.00 2.12 3.05 3.95 3.07 1.86 1.71 1.82 2.31 1.69 3.19 2.38 3.09
AVG # OF CRAFT/GROUP - TOTAL 3.15 3.30 3.36 3.10 2.97 3.31 3.49 3.39 3.25 3.06 3.07 3.24 3.65 3.34 3.48 3.50 3.69 3.54 3.53 3.85 3.38
OUTFITTED % OF TOTAL GROUPS 11.83% 9.06% 7.01% 7.84% 7.77% 7.72% 8.19% 8.23% 5.46% 5.97% 6.25% 6.53% 6.54% 5.33% 5.93% 6.69% 7.68% 7.66% 7.89% 6.88% 7.18%
OUTFITTED % OF TOTAL FLOATERS 22.33% 17.68% 12.17% 13.41% 14.54% 13.47% 14.60% 14.68% 9.41% 10.56% 11.13% 10.69% 11.09% 9.64% 9.92% 11.77% 12.45% 12.85% 12.97% 10.59% 12.41%
HIGH WATER FLOW LEVEL IN CFS (daily mean) 447 1080 938 1650 1650 1290 853 1420 1050 2040 3820 1250 1110 1360 886 825 652 2350 1880 1600 1,408
LOW WATER FLOW LEVEL IN CFS (daily mean) 34 63 43 79 100 60 43 85 87 150 151 62 55 102 68 52 51 88 108 87 78
SMITH RIVER TREND STATISTICS CONTINUED (2001-2020)

18
Visitor Use Trends – Average Group Size
GRAPH 14: AVERAGE GROUP SIZE PER YEAR – PRIVATE GROUPS
GRAPH 15: AVERAGE GROUP SIZE PER YEAR – OUTFITTED GROUPS
6.05
6.99
7.31
6.96
7.04 7.22
7.84
7.44
7.29
8.39
3.00
4.00
5.00
6.00
7.00
8.00
9.00
2011 2012 2013 2014 2015 2016 2017 2018 2019 2020
Average # Floaters Per Group (Private)
11.13
11.72
12.7312.95
12
13 12.9112.82
12.43
13
6.00
7.00
8.00
9.00
10.00
11.00
12.00
13.00
14.00
2011 2012 2013 2014 2015 2016 2017 2018 2019 2020
Average # Floaters Per Group (Outfitted)

19
GRAPH 16: AVERAGE GROUP SIZE PER YEAR – PRIVATE AND OUTFITTED GROUPS
Visitor Use Trends – Number of Floaters Per Year
GRAPH 17: NUMBER OF FLOATERS PER YEAR
6.4
7.32
7.69
7.3
7.35 7.63
8.26
7.88
7.72
8.73
4
4.5
5
5.5
6
6.5
7
7.5
8
8.5
9
2011 2012 2013 2014 2015 2016 2017 2018 2019 2020
Average # Floaters Per Group (Private + Outfitted)
3999
4714
4588
5375
4355
5193
5599
6189 6232
6629
0
1000
2000
3000
4000
5000
6000
7000
Number of Floaters Per Year

20
2020 CFS DAILY MEAN
TOTAL NUMBER
OF GROUPS ON
THE RIVER
EACH DAY
TOTAL NUMBER
OF PEOPLE ON
THE RIVER
EACH DAY
AVERAGE NUMBER
OF PEOPLE PER
GROUP ON THE
RIVER EACH DAY
1-Apr 152 0 0 0.00
2-Apr 141 0 0 0.00
3-Apr 137 0 0 0.00
4-Apr 140 0 0 0.00
5-Apr 136 0 0 0.00
6-Apr 155 0 0 0.00
7-Apr 195 0 0 0.00
8-Apr 183 0 0 0.00
9-Apr 222 0 0 0.00
10-Apr 295 0 0 0.00
11-Apr 292 0 0 0.00
12-Apr 196 0 0 0.00
13-Apr 165 0 0 0.00
14-Apr 167 0 0 0.00
15-Apr 183 0 0 0.00
16-Apr 163 0 0 0.00
17-Apr 165 0 0 0.00
18-Apr 208 1 6 6.00
19-Apr 259 1 6 6.00
20-Apr 310 1 6 6.00
21-Apr 344 0 0 0.00
22-Apr 371 0 0 0.00
23-Apr 382 0 0 0.00
24-Apr 408 0 0 0.00
25-Apr 382 0 0 0.00
26-Apr 390 0 0 0.00
27-Apr 430 1 3 3.00
28-Apr 449 1 3 3.00
29-Apr 492 1 3 3.00
30-Apr 649 0 0 0.00
1-May 1080 0 0 0.00
2-May 1000 0 0 0.00
3-May 941 0 0 0.00
4-May 850 1 2 2.00
5-May 761 8 60 7.50
6-May 733 15 108 7.20
7-May 815 21 167 7.95
8-May 831 27 220 8.15
9-May 867 28 214 7.64
10-May 783 30 203 6.77
11-May 732 32 214 6.69
12-May 731 33 211 6.39
13-May 754 36 234 6.50
14-May 735 37 264 7.14
SMITH RIVER DAILY LOG (2020)

21
2020 CFS DAILY MEAN
TOTAL NUMBER
OF GROUPS ON
THE RIVER
EACH DAY
TOTAL NUMBER
OF PEOPLE ON
THE RIVER
EACH DAY
AVERAGE NUMBER
OF PEOPLE PER
GROUP ON THE
RIVER EACH DAY
15-May 761 39 286 7.33
16-May 788 37 290 7.84
17-May 794 41 318 7.76
18-May 860 33 270 8.18
19-May 1120 32 264 8.25
20-May 1430 30 252 8.40
21-May 1560 34 297 8.74
22-May 1520 35 329 9.40
23-May 1350 38 384 10.11
24-May 1240 39 375 9.62
25-May 1130 42 400 9.52
26-May 1110 35 317 9.06
27-May 1120 35 316 9.03
28-May 1090 38 355 9.34
29-May 1090 41 381 9.29
30-May 1120 41 370 9.02
31-May 1240 40 374 9.35
1-Jun 1320 40 356 8.90
2-Jun 1260 39 339 8.69
3-Jun 1140 38 336 8.84
4-Jun 1050 40 360 9.00
5-Jun 947 43 412 9.58
6-Jun 918 40 395 9.88
7-Jun 1190 41 414 10.10
8-Jun 1080 42 414 9.86
9-Jun 1040 39 400 10.26
10-Jun 893 38 377 9.92
11-Jun 782 44 477 10.84
12-Jun 681 43 472 10.98
13-Jun 614 42 494 11.76
14-Jun 577 43 472 10.98
15-Jun 570 46 506 11.00
16-Jun 571 41 422 10.29
17-Jun 641 46 463 10.07
18-Jun 879 45 468 10.40
19-Jun 782 47 505 10.74
20-Jun 689 44 505 11.48
21-Jun 644 44 507 11.52
22-Jun 599 43 486 11.30
23-Jun 541 43 482 11.21
24-Jun 492 47 538 11.45
25-Jun 462 42 494 11.76
26-Jun 421 46 517 11.24
27-Jun 398 46 515 11.20
SMITH RIVER DAILY LOG (2020)

22
2020 CFS DAILY MEAN
TOTAL NUMBER
OF GROUPS ON
THE RIVER
EACH DAY
TOTAL NUMBER
OF PEOPLE ON
THE RIVER
EACH DAY
AVERAGE NUMBER
OF PEOPLE PER
GROUP ON THE
RIVER EACH DAY
28-Jun 495 40 430 10.75
29-Jun 962 42 447 10.64
30-Jun 1170 41 388 9.46
1-Jul 1040 42 411 9.79
2-Jul 935 42 435 10.36
3-Jul 830 45 467 10.38
4-Jul 747 43 433 10.07
5-Jul 700 43 445 10.35
6-Jul 647 44 451 10.25
7-Jul 607 36 358 9.94
8-Jul 562 39 390 10.00
9-Jul 512 39 394 10.10
10-Jul 491 40 378 9.45
11-Jul 464 43 379 8.81
12-Jul 431 42 354 8.43
13-Jul 416 43 334 7.77
14-Jul 381 38 241 6.34
15-Jul 354 40 262 6.55
16-Jul 325 40 275 6.88
17-Jul 298 41 272 6.63
18-Jul 276 42 299 7.12
19-Jul 246 35 266 7.60
20-Jul 226 32 228 7.13
21-Jul 214 34 237 6.97
22-Jul 196 30 185 6.17
23-Jul 189 32 195 6.09
24-Jul 212 34 209 6.15
25-Jul 201 33 190 5.76
26-Jul 178 27 144 5.33
27-Jul 155 24 125 5.21
28-Jul 148 19 102 5.37
29-Jul 147 21 127 6.05
30-Jul 139 18 101 5.61
31-Jul 136 18 87 4.83
1-Aug 141 14 74 5.29
2-Aug 135 10 62 6.20
3-Aug 128 5 21 4.20
4-Aug 127 7 24 3.43
5-Aug 126 7 24 3.43
6-Aug 132 9 33 3.67
7-Aug 128 9 33 3.67
8-Aug 125 7 27 3.86
9-Aug 124 6 27 4.50
10-Aug 116 5 19 3.80
SMITH RIVER DAILY LOG (2020)

23
2020 CFS DAILY MEAN
TOTAL NUMBER
OF GROUPS ON
THE RIVER
EACH DAY
TOTAL NUMBER
OF PEOPLE ON
THE RIVER
EACH DAY
AVERAGE NUMBER
OF PEOPLE PER
GROUP ON THE
RIVER EACH DAY
11-Aug 106 3 10 3.33
12-Aug 99.7 2 11 5.50
13-Aug 104 2 8 4.00
14-Aug 104 2 8 4.00
15-Aug 99.4 1 2 2.00
16-Aug 93.8 1 2 2.00
17-Aug 87.5 1 3 3.00
18-Aug 88.9 1 3 3.00
19-Aug 92.3 1 3 3.00
20-Aug 97.3 1 3 3.00
21-Aug 98.9 2 5 2.50
22-Aug 96.6 1 2 2.00
23-Aug 98.1 1 2 2.00
24-Aug 98.5 1 2 2.00
25-Aug 104 1 2 2.00
26-Aug 116 0 0 0.00
27-Aug 118 0 0 0.00
28-Aug 126 0 0 0.00
29-Aug 127 0 0 0.00
30-Aug 124 0 0 0.00
31-Aug 121 0 0 0.00
1-Sep 120 1 2 2.00
2-Sep 116 1 2 2.00
3-Sep 109 1 2 2.00
4-Sep 103 1 2 2.00
5-Sep 100 1 2 2.00
6-Sep 97.5 1 5 5.00
7-Sep 109 1 5 5.00
8-Sep 147 1 5 5.00
9-Sep 154 5 16 3.20
10-Sep 151 7 28 4.00
11-Sep 145 7 25 3.57
12-Sep 138 8 29 3.63
13-Sep 124 9 31 3.44
14-Sep 127 7 25 3.57
15-Sep 123 5 21 4.20
16-Sep 115 3 8 2.67
17-Sep 108 4 11 2.75
18-Sep 108 4 11 2.75
19-Sep 113 3 17 5.67
20-Sep 121 4 33 8.25
21-Sep 120 6 36 6.00
22-Sep 123 8 43 5.38
23-Sep 124 9 46 5.11
24-Sep 121 9 46 5.11
SMITH RIVER DAILY LOG (2020)

24
2020 CFS DAILY MEAN
TOTAL NUMBER
OF GROUPS ON
THE RIVER
EACH DAY
TOTAL NUMBER
OF PEOPLE ON
THE RIVER
EACH DAY
AVERAGE NUMBER
OF PEOPLE PER
GROUP ON THE
RIVER EACH DAY
25-Sep 127 9 47 5.22
26-Sep 128 6 32 5.33
27-Sep 129 4 25 6.25
28-Sep 131 3 29 9.67
29-Sep 129 2 18 9.00
30-Sep 127 2 16 8.00
1-Oct 126 4 19 4.75
2-Oct 130 5 22 4.40
3-Oct 134 4 7 1.75
4-Oct 134 3 6 2.00
5-Oct 131 2 3 1.50
6-Oct 128 1 2 2.00
7-Oct 129 1 10 10.00
8-Oct 134 2 11 5.50
9-Oct 133 3 15 5.00
10-Oct 135 3 15 5.00
11-Oct 143 3 15 5.00
12-Oct 150 0 0 0.00
13-Oct 151 0 0 0.00
14-Oct 153 0 0 0.00
15-Oct 156 0 0 0.00
16-Oct 160 0 0 0.00
17-Oct 165 0 0 0.00
18-Oct 157 0 0 0.00
19-Oct 163 0 0 0.00
20-Oct 181 0 0 0.00
21-Oct 173 0 0 0.00
22-Oct 153 0 0 0.00
23-Oct 135 0 0 0.00
24-Oct 88 0 0 0.00
25-Oct 81 0 0 0.00
26-Oct 157 0 0 0.00
27-Oct 228 0 0 0.00
28-Oct 268 0 0 0.00
29-Oct 261 0 0 0.00
30-Oct 250 0 0 0.00
31-Oct 210 2 14 7.00
SMITH RIVER DAILY LOG (2020)

25
SECTION 4 – RESOURCE AND SOCIAL CONDITIONS
River Flows
The lowest measured stream flow for the 2020 season was 81 cfs (10/25/2020), while the peak stream flow was 1560 cfs (5/21/2020). High/Low flows represented as daily mean values.
GRAPH 18: HISTORICAL RIVER FLOW TRENDS
GRAPH 19: APRIL – OCTOBER FLOW COMPARISON OF 2020 TO 1997 – 2020
34
65
43
79100
6043
85 87150 151
62 55
102
6852
42
88 108 81
447
1080 938
1650 16501290
853
1420 10502040
3820
1250 11001360
886826 632
2350
18801560
10
100
1000
10000
2001 2002 2003 2004 2005 2006 2007 2008 2009 2010 2011 2012 2013 2014 2015 2016 2017 2018 2019 2020
HIGH AND LOW WATER FLOWS TREND DATA
Low Flow High Flow
0
200
400
600
800
1000
1200
1400
1600
1800
Cu
bic
Fe
et
Pe
r Se
con
d (
CFS
)
April 01-October 31
Smith River Flow at Eagle Creek Gauge
1997-2020
2020

26
GRAPH 20: JUNE – AUGUST TEMPERATURE COMPARISON OF 2020 TO 1997 – 2020
This season was a blur. See you next year.
0
10
20
30
40
50
60
70
80
Tem
p -
F
June 01 - August 31
Mean Temperature - Eagle Creek Gauge
2020
1997-2020