SME Regulatory Compliance Cost Report—September … · ii SME Regulatory Compliance Cost...
35
SME Regulatory Compliance Cost Report Results from the 2011 Statistics Canada Survey of Regulatory Compliance Costs September 2013
Transcript of SME Regulatory Compliance Cost Report—September … · ii SME Regulatory Compliance Cost...

SME Regulatory Compliance Cost Report
Results from the 2011 Statistics Canada Survey of Regulatory Compliance Costs
September 2013
This paper was authored by Daniel Seens, an economist who works in the research group of the Small Business Branch of Industry Canada.
This publication is available upon request in accessible formats (Braille and large print). Contact:
Multimedia Services Communications and Marketing Branch Email: [email protected]
This publication is also available online in HTML at www.reducingpaperburden.gc.ca/Survey.
Permission to Reproduce Except as otherwise specifically noted, the information in this publication may be reproduced, in part or in whole and by any means, without charge or further permission from Industry Canada, provided that due diligence is exercised in ensuring the accuracy of the information reproduced; that Industry Canada is identified as the source institution; and that the reproduction is not represented as an official version of the information reproduced, nor as having been made in affiliation with, or with the endorsement of, Industry Canada.
For permission to reproduce the information in this publication for commercial redistribution, please email [email protected].
Cat. No. Iu188-112/2013E-PDF ISSN 978-1-100-22750-4
Aussi offert en français sous le titre Rapport sur le coût de la mise en conformité des PME à la réglementation — Septembre 2013.

i
SME Regulatory Compliance Cost Report—September 2013
Table of Contents
Executive Summary ...............................................................................................................................................ii
1. Introduction .....................................................................................................................................................1
2. Survey Methodology ......................................................................................................................................1
3. Survey Results ................................................................................................................................................7
3.1 Impact of Regulatory Compliance on Business Success ...................................................................... 7
3.2 Quantity of Regulatory Compliance Paperwork ..................................................................................... 10
3.3 Internal Time Costs ................................................................................................................................ 11
3.4 Compliance Process .............................................................................................................................. 13
3.5 Cost of Regulatory Compliance ............................................................................................................. 16
3.6 Business Opinions Regarding the Cost of Regulatory Compliance ...................................................... 24
3.7 Prioritizing Regulatory Compliance Cost Reduction .............................................................................. 25
4. Conclusions ...................................................................................................................................................26
Annex A. Regulations Covered in the Survey ...................................................................................................28
Annex B. Estimation Formulas and Concepts ...................................................................................................30
7

ii
SME Regulatory Compliance Cost Report—September 2013
Executive Summary
This report presents data on the cost of regulatory compliance to small and medium-sized enterprises (SMEs) in Canada stemming from federal, provincial and municipal regulations. The data were collected from 10,477 respondents through the 2011 Survey of Regulatory Compliance Costs (SRCC) undertaken by Statistics Canada and Industry Canada. This survey was also conducted in 2005 and 2008.
The data revealed that the real cost of regulatory compliance to Canadian SMEs (adjusting for inflation and growth in the size of the business sector) was $4.76 billion in 2011. This amounted to approximately $3,500 per business and $370 per employee, or 0.29 percent of business sector revenues. As a share of economic resources, the cost of regulatory compliance fell from 0.81 percent of SME gross domestic product (GDP) in 2005 to 0.75 percent of SME GDP in 2011. The real cost of regulatory compliance has decreased by 0.3 percent per year since 2005.
The findings also showed that, although 6 percent of SMEs considered regulatory compliance to be a serious obstacle to success, the majority of SMEs (72 percent) did not consider it to be even a moderate obstacle.
The data included information on the quantity of regulatory paperwork faced by Canadian SMEs and the amount of time spent on compliance. The analysis revealed that Canadian SMEs submit, on average, two government forms to regulators per month, which takes them, on average, three hours per month to complete, or less than an hour per week.
Businesses consider the paperwork stemming from federal regulations to be the most time consuming, with tax-related requirements remaining the biggest challenge. Since 2005, however, paperwork stemming from federal regulations also represents an area in which significant regulatory compliance cost reduction efforts have been made (e.g., simplification of forms, availability of electronic filing). Electronic processing methods are being increasingly adopted by those SMEs that continue to carry out their regulatory compliance activities in-house. At the same time, there has been a high rate of substitution from in-house compliance to outsourcing between 2008 and 2011.
Small businesses continue to bear a disproportionate share of the national burden of regulatory compliance. However, the SRCC data also show that this burden does not fall most heavily on the smallest of businesses (i.e., non-employer businesses). This finding supports the hypothesis that the regulatory compliance burden initially increases as a firm grows and hires employees before decreasing once certain economies of scale are reached.
About 65 percent of companies indicated that the cost of regulatory compliance was at an acceptable level in 2011, with only 8.5 percent reporting that the cost was at a much higher than acceptable level. That being said, Canadian businesses still want action taken to reduce regulatory compliance costs, with the majority of firms stating that it should be a moderate to high priority for the federal government.

1
SME Regulatory Compliance Cost Report—September 2013
1. Introduction
In a developed economy, regulatory systems are used to protect property rights and enforce contractual agreements, protect the environment and the health and safety of citizens, and ensure a well-functioning tax system. Over the last decade, however, there has been growing concern among government officials and business owners in Canada regarding the cost of regulatory compliance.
Of particular concern is the impact on small and medium-sized enterprises (SMEs), given the major role they play in the Canadian economy. SMEs account for 99.9 percent of the 2.4 million businesses in operation.1 They represent nearly all of Canada’s employers (99.8 percent) and 97 percent of all of Canada’s exporters, and they employ 90 percent of Canada’s private sector workforce. As such, it is important for the Government of Canada to create an environment that supports the growth of SMEs.
It is out of these concerns that the government developed the Survey of Regulatory Compliance Costs (SRCC), a voluntary survey designed to measure and monitor changes in the time spent and costs incurred by SMEs to comply with government regulations.
Statistics Canada distributes survey questionnaires to over 30,000 SMEs and professional service providers across the country every three years. This is the third iteration of the survey (2005, 2008 and 2011). Survey data have supported the work of the Red Tape Reduction Commission, Advisory Committee on Paperwork Burden Reduction (ACPBR), Advisory Committee on Small Business and Entrepreneurship, and Canada Revenue Agency Action Task Force on Small Business Issues.
Part 2 of this report summarizes the survey methodology, Part 3 presents the survey results and Part 4 presents conclusions from the work.
2. Survey Methodology
The SRCC aims to gather detailed and robust information on the cost of regulatory compliance, i.e., “red tape,” with a focus on SMEs. Care was taken in the design of the survey so as not to impose an undue reporting burden on businesses while ensuring the collection of high-quality data. Data in this third iteration of the survey cover the 2011 calendar year.
Regulatory ComplianceTo quantify and monitor changes in the cost of regulatory compliance, it is necessary to define the term. Consistent with the Organisation for Economic Co-operation and Development’s (OECD’s) definition, regulatory compliance for the purpose of the survey was defined as the “formalities and paperwork that a business carries out, or pays someone to carry out on their behalf, to comply with [regulations]. [It] includes all the time and resources spent by owners, managers, staff and hired experts to understand regulations, collect, plan, process, report, retain data and fill in forms required by government. [It also includes the time spent dealing with follow-up and training staff to handle compliance activities.] [It] includes the administration of taxes, but not the actual amount of money paid in taxes.”2
1 Industry Canada, Key Small Business Statistics, 2012.
2 Organisation for Economic Co-operation and Development, Business Views on Red Tape: Administrative and Regulatory Burdens on Small and Medium-Sized Enterprises, 2001.

2
SME Regulatory Compliance Cost Report—September 2013
Areas of RegulationThe survey measures regulatory compliance costs originating from three areas of regulation: tax-related, employment-related and other regulations (see Annex A).• Tax-related regulations include business income tax filing, federal/provincial sales taxes and corporate tax instalments.
• Employment-related regulations include workers’ compensation claims and remittances, Records of Employment (ROE), payroll remittances and T4 summaries / individual T4s.
• Other regulations include mandatory Statistics Canada surveys, municipal and provincial licences and permits, corporate registration, and all other federal, provincial and municipal regulations.
Detailed information on 11 key regulations was gathered by size of business, region and sector. These 11 regulations are considered to be the most burdensome regulations to the largest number of businesses across Canada.3 In addition to these 11 regulations, aggregate data covering all other federal, provincial and municipal regulations that impact SMEs were also gathered (including environmental, and health and safety regulations). These aggregate data were not included in previous iterations of this survey, but were added to build a more complete picture of the total cost of regulatory compliance.
Survey QuestionnairesTwo survey questionnaires were distributed—a main questionnaire and a service provider questionnaire. Although the survey was originally designed as a mail-out survey, the 2011 version used electronic questionnaires to help streamline the process.
The main questionnaire was sent to SMEs and collected detailed information on time spent, and salaries of individuals internal to the business involved in, preparing and submitting regulatory paperwork. As well, it collected data on the total cost of assistance provided by external service providers to meet regulatory compliance requirements. To supplement questions about time and costs, questions about firm demographics were also asked. This makes it possible to tabulate compliance costs by business size, region and sector. A series of qualitative questions were also asked to better understand the views of business owners on regulatory compliance.
The service provider questionnaire gathered information on time spent by service providers to complete regulatory paperwork on behalf of business clients. Data were collected for three types of service providers (accounting firms, tax preparation specialists, and bookkeeping and payroll services providers). This information is necessary to apportion the total dollar costs of outsourced services reported in the main survey questionnaire.
3 These regulations were initially identified by the ACPBR based on consultations with business owners, service providers and departmental specialists. A robustness check was performed in 2005 in which business respondents were asked to identify on the SRCC questionnaires whether there were any other regulations in addition to the 11 regulations identified in the questionnaire that required a significant amount of time and cost to comply with. At that time, the majority of businesses (71 percent) reported that there were no other federal, provincial or municipal regulations that required a significant amount of time and cost to comply with.

3
SME Regulatory Compliance Cost Report—September 2013
Sample SelectionThe main and service provider surveys are sample-based surveys with cross-sectional designs. Statistics Canada’s Business Register was used as the survey frame for the target populations. The sampling frame for the main 2011 survey contained 703,579 establishments. The initial stratification was by region, industry and size of business. The number of employees in the establishment was used to define the size of the business. A simple random sample of 30,001 SMEs was selected.4 For the service provider survey, the sampling frame contained 33,629 establishments belonging to the accounting, tax preparation, and bookkeeping and payroll services industries with revenues greater than $30,000. The frame was stratified by region, industry and revenues. A simple random sample of 5,000 service providers was selected.
All establishments within the sampling frame were contacted to obtain an email address and to confirm that the establishment fell within the scope of the survey. Subsequently, all establishments with confirmed email addresses that fell within the scope of the survey were emailed an invitation to participate in the survey and provided with links to the electronic questionnaires. At least two follow-up attempts by phone and four follow-up attempts by email were made to participants to encourage them to return the questionnaires.
Region and SectorThe survey population was stratified by region to ensure that results were representative of businesses across the Atlantic provinces, Quebec, Ontario, the Prairie provinces and British Columbia. Respondents were grouped into 5 of 20 possible sectors according to North American Industry Classification System (NAICS) standards: manufacturing; retail trade; professional, scientific and technical services; accommodation and food services; and other services. These sectors were originally selected by the ACPBR for their high concentrations of SMEs.
RespondentsIn total, 8,857 SMEs and 1,620 service providers responded to the surveys in 2011, resulting in response rates of 35 percent and 38 percent respectively.5 These response rates are consistent with those from previous surveys. The respondents represent the overall structure of the Canadian economy within the selected categories. Figures 1–3 compare the distribution of survey responses to the distribution of SMEs in the Canadian economy by region, sector and size of business.
Figure 1 shows that 38 percent of respondents were located in Ontario, 22 percent in Quebec and 16 percent in British Columbia. The remaining 24 percent were located throughout the Prairies and Atlantic Canada. This regional distribution of respondents is consistent with the regional distribution of SMEs in the economy.
4 SMEs are defined as establishments that are non-employers (zero employees) or employers with fewer than 500 employees that generate between $30,000 and $50 million in annual gross revenues.
5 Response rates are calculated by dividing the total number of responding establishments by the total number of establishments sampled, excluding those businesses that did not fall within the scope of the survey.

4
SME Regulatory Compliance Cost Report—September 2013
Figure 1: Regional distribution of respondents compared with the regional distribution of SMEs in the Canadian economy
Source: Statistics Canada, Survey of Regulatory Compliance Costs, 2011; Statistics Canada, Business Register, 2011.
Figure 2 compares the sectors in which respondents operated with the sectoral distribution of SMEs in the economy.
Figure 2: Sectoral distribution of respondents compared with the sectoral distribution of SMEs in the Canadian economy
Source: Statistics Canada, Survey of Regulatory Compliance Costs, 2011; Statistics Canada, Business Register, 2011.
The data show that professional, scientific and technical services is overrepresented, but this is not surprising given the importance of the issue in that sector. In the cost estimates, Statistics Canada applied a weighting methodology to help correct for this overrepresentation.
Figure 3 compares survey respondents by size of business, defined as the number of employees, with the distribution of SMEs by size of business in the economy. Non-employer businesses were under-represented, reflecting about 27 percent of respondents compared with 43 percent in the economy as a whole. About 39 percent of respondents had 1–4 employees,
0
5
10
15
20
25
30
35
40
45
50
Canadian economySurvey respondents
OtherServices
Accommodation and FoodServices
Professional,Scienti�c and
Technical Services
Retail TradeManufacturing
10.78.7
19.5
23.6
45.7
35.1
7.910.9
21.7
16.2
%
0
5
10
15
20
25
30
35
40
45
Canadian economySurvey respondents
Atlantic CanadaQuebecOntarioPrairiesBritish Columbia
15.7 14.8
18.8 19.0
38.2 39.2
22.2 21.6
5.55.1
%

5
SME Regulatory Compliance Cost Report—September 2013
24 percent had 5–19 employees and 9 percent had 20–99 employees, with each of these categories being slightly overrepresented in the data. In the cost estimates, Statistics Canada again applied a weighting methodology to help correct for this overrepresentation. Another 1 percent of respondents were medium-sized businesses that employed 100–499 employees.
Figure 3: Distribution of respondents by size of business compared with the distribution of SMEs by size of business in the Canadian economy
Source: Statistics Canada, Survey of Regulatory Compliance Costs, 2011; Statistics Canada, Business Register, 2011.
Data VerificationThe high number of respondents and broad representation make the SRCC one of the most comprehensive surveys on the cost of regulatory compliance in the country. Statistics Canada has reviewed the data to ensure they are valid, representative and acceptable for public release. At the micro level, this validation involved editing the data from respondents both during and after data collection to verify internal consistency and identify reporting errors and outliers. At the macro level, the review involved a comparative analysis of survey estimates for 2011 with those from previous years, thereby allowing any material errors or outliers to be identified and resolved.
Measures of AnalysisStatistical measures generated from the survey are listed below.
0
5
10
15
20
25
30
35
40
45
50
Canadian economySurvey respondents
100−49920−995−191−40
27.3
42.5
30.1
23.6
39.1
20.1
8.96.4
1.01.1
%
Number of Employees
Quantity of Regulatory Paperwork• Total submissions• Average submissions per businessTime Costs• Total time • Average time per business
Monetary Costs• Total internal/external compliance costs • Average internal/external compliance costs per business• Capital costs

6
SME Regulatory Compliance Cost Report—September 2013
Cost MeasurementThe total cost of the regulatory system includes the cost to regulators to administer the regulations as well as the cost to individuals and businesses to comply with those regulations. The focus of this report is on the cost to businesses to comply with the regulations. The cost of administering the regulations (e.g., agency costs, overhead and wages paid to program staff) was not measured, nor was the cost to individuals.
This analysis does not attempt to measure the benefits of regulations.
Generally, compliance costs fall into one of five categories:6
• Internal costs: This includes wages paid to owners, managers and staff for time spent retrieving and reviewing information, completing forms, logging submissions, dealing with follow-up, training staff to handle compliance activities, and meeting and communicating with service professionals.
• External costs: This includes fees paid to professional service providers for the purpose of regulatory compliance. Care must be taken in measuring service provider costs if the service provider performs other functions in addition to those related to regulatory compliance (e.g., monitors financial accounts and prepares annual statements). For the purpose of this analysis, only that portion of service provider costs incurred for the sole purpose of regulatory compliance was measured.
• Capital costs: This includes the cost of computer hardware and software used for regulatory compliance. As with external costs, capital costs must be calculated with care as they are less visible and less easily separated from other capital expenditures. For example, although a computer may be used primarily to prepare claims and forms for regulators, if it is also used for invoicing and day-to-day bookkeeping activities, the full cost of the computer should not be treated as a regulatory compliance cost. If the full cost were to be included, measures of compliance costs would be overstated. To avoid this, only the cost of capital equipment purchased for the sole purpose of regulatory compliance was included.
• Other opportunity costs: This includes the cost of foregone opportunities, such as the cost of lost sales or a reduction in productivity. These costs do not involve the actual payment of money and are extremely difficult to quantify. Attempts to assess these costs can be fraught with errors and are sensitive to the attitudes of business owners. Owners that are very negative towards regulatory compliance, for instance, may exaggerate the extent to which it has caused them to lose sales.
• Psychological costs: This includes mental stress and anxiety associated with having to deal with compliance activities. Like other opportunity costs, psychological costs are very difficult to measure and have been excluded from this analysis.
Compliance Burden• Cost per employee• Cost as a percentage of revenues
Views of Business Owners • Obstacle to success• Government source of burden• Level of acceptability
6 McKerchar, Margaret, Helen Hodgson, and Michael Walpole. Scoping Study on the Costs of Compliance of Small Business. Atax, University of New South Wales, 2006.

7
SME Regulatory Compliance Cost Report—September 2013
Calculating the cost of regulatory compliance was done in five steps. First, survey respondents were asked to report the total number of claims and forms prepared and submitted to government to comply with regulations. This information is presented in Section 3.2: Quantity of Regulatory Compliance Paperwork. Second, respondents reported the average time spent completing and processing individual claims/forms. In addition, data on hourly wage rates paid to the individuals responsible for doing the work were collected and used to produce estimates of internal costs. Third, respondents were asked to report total fees paid to external service providers to comply with regulations. Fourth, estimates of the total cost, average cost and average cost per employee were calculated by adding internal, external and capital costs together for the business sizes, regions and sectors of interest. Lastly, estimates were adjusted for inflation using the consumer price index (CPI) and expressed in 2011 dollars to examine the real costs of compliance. Estimates were also adjusted to cover the whole economy for analytical purposes. This information is presented in Section 3.5: Cost of Regulatory Compliance. (See Annex B for more detailed information on estimation formulas and concepts.)
In interpreting the survey results, it is important to note that no attempt was made to measure what proportion of regulatory compliance costs is ultimately paid for by the business and what proportion is passed through to consumers. It is possible that businesses can pass through the entire cost to consumers in the form of higher prices and that the final cost to businesses, therefore, is less than what is estimated from this survey. Who ultimately bears the cost depends on the rate of pass-through and on demand and supply elasticities within each industry.7 Estimates produced by the Canadian Federation of Independent Business suggest that 50 percent of businesses can pass through at least a portion of the cost to customers in the form of higher prices.8
3. Survey Results
3.1 Impact of Regulatory Compliance on Business SuccessA new approach taken in this iteration of the SRCC involved asking companies to consider the impact of government regulations on their business and report on whether regulatory compliance is an “obstacle to success.” Respondents could report that regulatory compliance is not an obstacle, a small obstacle, a moderate obstacle or a serious obstacle. Findings provided a key indicator of the cumulative impact of regulatory compliance on SMEs based on the knowledge and sentiments of business owners and senior managers (Figure 4).
In total, 40 percent of SMEs reported that regulatory compliance is not an obstacle to success; another 32 percent reported that regulatory compliance is only a small obstacle. Together, almost three quarters of Canadian businesses did not consider regulatory compliance to be even a moderate obstacle to success. Only 6 percent of SMEs reported that regulatory compliance is a serious obstacle to success. The remaining 22 percent indicated that it is a moderate obstacle.
7 Crain, W. Mark, The Impact of Regulatory Costs on Small Firms. Lafayette College, Easton, PA, Small Business Administration, Office of Advocacy, 2005.
8 Jones, Laura, Canada’s Red Tape Report with U.S. Comparisons. Canadian Federation of Independent Business, 2013.

8
SME Regulatory Compliance Cost Report—September 2013
Figure 4: Degree to which companies consider regulatory compliance an obstacle to business success
Source: Statistics Canada, Survey of Regulatory Compliance Costs, 2011.
Only about 4 percent of businesses in British Columbia and 5 percent of businesses in Ontario and the Prairie provinces reported that regulatory compliance is a serious obstacle to success (Table 1). Businesses in Quebec had a more negative view, with almost 9 percent reporting that regulatory compliance is a serious obstacle. This result is consistent with expectations as, for many regulations, there is an additional level of complexity added to the system in Quebec, with businesses reporting to two levels of government (i.e., separate federal and provincial income tax reporting).
Table 1: Percentage of companies that consider regulatory compliance to be an obstacle to business success by size of business, region and sector
Source: Statistics Canada, Survey of Regulatory Compliance Costs, 2011.
22%6%
40%
32%
Not anobstacle
Smallobstacle
Moderateobstacle
Seriousobstacle
Not an Obstacle Small Obstacle Moderate Obstacle Serious ObstacleSize of Business (number of employees)
0 50.2 30.0 15.9 3.9
1–4 38.5 34.0 22.1 5.5
5–19 33.4 32.3 27.2 7.1
20–99 34.5 29.8 27.9 7.7
100–499 39.5 30.9 20.4 9.2
Region
Atlantic Provinces 39.4 32.6 21.6 6.3
Quebec 35.2 31.1 24.8 8.9
Ontario 43.9 29.5 21.8 4.7
Prairie Provinces 39.9 34.4 20.9 4.8
British Columbia 38.3 36.7 20.7 4.3
Sector
Manufacturing 31.9 31.5 28.8 7.8
Retail Trade 36.0 30.7 24.9 8.4
Professional, Scientific and Technical Services 45.5 33.5 17.3 3.7
Accommodation and Food Services 32.3 32.3 29.3 6.1
Other Services 39.2 30.1 24.4 6.2
Canada 40.1 32.1 22.1 5.7

9
SME Regulatory Compliance Cost Report—September 2013
Firms with a larger number of employees were more inclined to feel that regulatory compliance is a serious obstacle to success. This was surprising given that there is considerable evidence indicating that regulatory compliance is, in fact, more “burdensome” to smaller businesses than larger businesses.9
Results also revealed differences in views across sectors. Manufacturing and retail trade had the most negative views towards regulatory compliance, with about 8 percent of businesses indicating that it is a serious obstacle to success. Almost 4 percent of professional, scientific and technical services firms reported that regulatory compliance is a serious obstacle to success. By comparison, about 32 percent of accommodation and food services companies reported that regulatory compliance is not an obstacle to business success.
A follow-up question involved asking businesses from which level of government they consider regulatory compliance to be the most time consuming (Table 2). Results indicate that about 72 percent of businesses believe that the most time-consuming compliance stems from federal regulations.
Table 2: Level of government from which regulatory compliance is considered to be the most time consuming (percent) by size of business, region and sector
Source: Statistics Canada, Survey of Regulatory Compliance Costs, 2011.
There were minor differences in views across firm size, with firms with fewer than five employees expressing a slightly more negative view about the time required to comply with federal regulations and businesses with 5–19 employees expressing a slightly more negative view regarding the time required to comply with provincial regulations.
Federal Provincial MunicipalSize of Business (number of employees)
0 74.8 23.9 1.3
1–4 73.3 24.7 2.0
5–19 66.7 30.8 2.5
20–99 68.7 28.8 2.5
100–499 69.3 29.6 1.1
Region
Atlantic Provinces 85.1 13.7 1.2
Quebec 19.3 79.5 1.2
Ontario 81.8 15.3 2.9
Prairie Provinces 88.9 9.7 1.4
British Columbia 81.4 16.6 2.0
Sector
Manufacturing 70.9 28.3 0.8
Retail Trade 66.2 31.3 2.4
Professional, Scientific and Technical Services 79.1 20.1 0.8
Accommodation and Food Services 59.3 31.9 8.9
Other Services 62.1 35.5 2.4
Canada 71.6 26.4 2.0
9 Industry Canada, Analysis of Regulatory Compliance Costs: Part II—Paperwork Time Burden, Costs of Paperwork Compliance and Paperwork Simplification, 2010; Organisation for Economic Co-operation and Development, Business Views on Red Tape: Administrative and Regulatory Burdens on Small and Medium-Sized Enterprises, 2001; Crain, W. Mark, The Impact of Regulatory Costs on Small Firms. Lafayette College, Easton, PA, Small Business Administration, Office of Advocacy, 2005.

10
SME Regulatory Compliance Cost Report—September 2013
Businesses in Quebec felt that provincial regulations are considerably more time consuming than federal regulations. Across all regions, municipal regulations were the least time consuming in spite of there being a significant number of operating and licensing permit requirements administered at the municipal level.
There were some differences observed across sectors, with accommodation and food services being the sector that was most negative about the time required to comply with provincial and municipal regulations. The professional, scientific and technical services sector was the most negative about the time required to comply with federal regulations.
3.2 Quantity of Regulatory Compliance PaperworkCompanies surveyed were provided with a list of 11 key regulations and asked to identify which they had to comply with over the previous 12 months. For each regulation, respondents were asked to report the total number of claims and forms they were required to submit to regulators. From this, estimates of the average number of submissions per business per month were calculated. Table 3 presents the results by size of business, region and sector and compares the results with 2005 and 2008 findings.
The data in Table 3 indicate that the amount of regulatory paperwork submitted by Canadian SMEs in 2011 was consistent with that submitted in 2005 and 2008, with two submissions to regulators per business per month. The range of submissions reveals some variation, with businesses with more employees; businesses in the Atlantic provinces and Quebec; and businesses in the manufacturing, retail trade, and accommodation and food services sectors submitting the greatest quantities of paperwork, on average, per month.
Table 3: Average claim/form submissions to regulators per business per month by size of business, region and sector
Source: Statistics Canada, Survey of Regulatory Compliance Costs, 2005, 2008 and 2011. Note: Although the average number of submissions per month increased for certain categories of businesses, when weighted to reflect the structure of the business population in terms of region, size of business and sector, the Canada-wide estimate did not change.
2005 2008 2011Size of Business (number of employees)
0 <1 <1 <1
1–4 2 2 2
5–19 3 3 3
20–99 6 6 6
100–499 14 14 10
Region
Atlantic Provinces — 2 3
Quebec — 2 3
Ontario — 2 2
Prairie Provinces — 2 2
British Columbia — 2 2
Sector
Manufacturing — 3 4
Retail Trade — 3 3
Professional, Scientific and Technical Services — 2 2
Accommodation and Food Services — 3 3
Other Services — 2 2
Canada 2 2 2

11
SME Regulatory Compliance Cost Report—September 2013
The most notable change between 2008 and 2011 was for medium-sized businesses, where the average number of claims and forms submitted to regulators fell from 14 per month, on average, to 10. Analysis revealed that the primary source of this change came from the ROE. Businesses must complete and submit an ROE to the government every time an employee leaves his or her job.10 Between 2008 and 2011, the number of ROE forms submitted by medium-sized businesses declined from six per month, on average, to four per month, or 24 fewer ROE submissions per business per year. One major factor likely explains this change. Like most employment-related regulations, employee change is sensitive to the business cycle. Better and more stable company performance in 2011 compared with 2008 may have resulted in less employee movement.
Findings presented in Table 3 are consistent with those in Table 1. Firms that considered regulatory compliance to be a serious obstacle to business success, i.e., firms with 5–99 employees and medium-sized firms, and SMEs in the Atlantic provinces and Quebec, also had to submit a greater quantity of paperwork, on average, than businesses that considered regulatory compliance to be less of an obstacle. From a sector perspective, retail trade, which considered regulatory compliance to be a more serious obstacle to business success than accommodation and food services, submitted the same amount of paperwork on average.
3.3 Internal Time CostsThe analysis now turns to an assessment of the time spent by SMEs to comply with government regulations. Time measurements were calculated at the micro level, i.e., respondents were asked to report the average amount of time spent by staff and management to prepare and submit individual claims or forms to regulators. This was done for each business and for each regulation. Aggregate estimates of internal hours spent on regulatory compliance per business per month were then produced. The amount of time spent on regulatory compliance per month by firm type for 2005, 2008 and 2011 is presented in Table 4.
Results show that the average amount of time spent on regulatory compliance by Canadian SMEs in 2011 was about 3 hours per month, or less than an hour per week. The greatest amount of time spent in 2011 was 12 hours per month, by medium-sized businesses, and the least was one hour per month by non-employer businesses. There is a positive relationship between business size and time spent on regulatory compliance. Some variation also exists across sectors, with manufacturing spending about 1.5 times as much time on regulatory compliance as the national average. Accommodation and food services spent 4 hours per month on regulatory compliance, or an hour per week. Professional, scientific and technical services spent only 2 hours per month on regulatory compliance on average.
For many firms, the time they reported spending on regulatory compliance increased over the 2005–2011 period. For example, almost all employer businesses reported spending about twice as much time on regulatory compliance in 2011 as in 2005. A similar trend was observed across sectors. To what extent the increased time spent on regulatory compliance translated into additional costs will be looked at later in this report.
10 An ROE describes how long the employee worked at the firm and how much income he/she earned while employed. Employment and Social Development Canada uses this information to determine whether or not the employee qualifies for Employment Insurance (EI) benefits, the benefit rate and the duration of the benefit.

12
SME Regulatory Compliance Cost Report—September 2013
Table 4: Average time spent on regulatory compliance per business per month (hours) by size of business, region and sector
Source: Statistics Canada, Survey of Regulatory Compliance Costs, 2005, 2008 and 2011; and author’s calculations.
With the quantity of regulatory paperwork submitted remaining about the same over the 2005–2011 period (as shown in Table 3), there are four possible causes for the increase in time spent on regulatory compliance:• Regulators have made changes to claims and forms that require businesses to take time to relearn how to comply
with the regulations.• Claims and forms have become more complex.• Improvements to the 2011 SRCC questionnaire, including the more prominent display of more complete definitions,
have contributed to more complete or improved reporting.• Businesses underestimated the time spent on regulatory compliance in 2005 and 2008, and are now paying
more attention to time spent complying with regulations and are reporting more accurately.When looking at the average amount of time spent on regulatory compliance per firm by region, we can analyze whether companies that dealt with the greatest quantity of paperwork also spent the most time on that paperwork.
On the basis of average submissions per business per month, SMEs in Quebec and the Atlantic provinces dealt with the greatest quantity of paperwork. Interestingly, businesses in Quebec were not found to spend more time on regulatory compliance than businesses in other regions. However, businesses in the Atlantic provinces spent more time on regulatory compliance. One possible explanation for this might be Statistics Canada surveys. It was found
2005 2008 2011Size of Business (number of employees)
0 1 1 1
1–4 1 1 2
5–19 2 2 4
20–99 3 4 7
100–499 6 7 12
Region
Atlantic Provinces 2 2 4
Quebec 2 2 3
Ontario 2 1 3
Prairie Provinces 2 2 3
British Columbia 2 1 3
Sector
Manufacturing 3 2 5
Retail Trade 2 2 3
Professional, Scientific and Technical Services 1 1 2
Accommodation and Food Services 2 2 4
Other Services 2 2 3
Canada 2 1 3

13
SME Regulatory Compliance Cost Report—September 2013
that the amount of time spent on Statistics Canada surveys differed among regions, with businesses in the Atlantic provinces spending more time on Statistics Canada surveys than anywhere else in the country (3 hours more per year, on average, on the surveys than businesses in other regions).11
3.4 Compliance ProcessBusiness owners have stated that there are two key methods that SMEs adopt to help them comply with regulations: (1) outsourcing compliance work to third-party service providers; and (2) using computer applications to streamline record keeping and processing functions.
Outsourcing Compliance WorkCanadian businesses rely heavily on external service providers to assist them with regulatory compliance. Using an external service provider can be motivated by various factors, including the following:• Business owners, managers and staff are unable to understand the regulations and reporting requirements;• Business owners are concerned that something might be reported incorrectly and that the firm might be penalized
or have a licence revoked; and• Business owners believe that their time and staff time would be better spent dealing with other business activities.Figure 5 compares the percentage of businesses that prepared the majority of claims/forms in-house versus the percentage that relied on assistance from external service providers to comply with the 11 regulations covered in the SRCC questionnaire.
Figure 5: Percentage of companies that prepare the majority of government claims/forms internally versus relying on assistance from external service providers by regulation, 2011
Source: Statistics Canada, Survey of Regulatory Compliance Costs, 2011.
0 10 20 30 40 50 60 70 80 90 100
InternalExternal
Municipal and Provincial Operating Licences and Permits
Mandatory Statistics Canada Surveys
Corporate Registration
Corporate Tax Instalments
Federal/Provincial Sales Taxes
Federal/Provincial Business Income Tax Filing
Workers' Compensation Claims
Workers' Compensation RemittancesT4 Summary / Individual T4s (including RL forms in Quebec)
Record of Employment
Payroll Remittances
%
39.1
57.3
26.8
12.8
79.4
29.6
40.9
55.1
11.7 88.3
9.9
33.9 66.1
60.9
42.7
90.1
44.9
73.2
87.2
70.4
59.1
20.6
11 Analysis of the survey results by Statistics Canada suggests that the response burden of complying with mandatory Statistics Canada surveys could be overstated due to respondents including other government surveys in the category.

14
SME Regulatory Compliance Cost Report—September 2013
Nearly 80 percent of businesses rely on external service providers to help with federal/provincial business income tax filing. It is generally in the area of income tax filing that the greatest complexities are encountered. This compares with 57 percent of SMEs that use external service providers for T4 summary / individual T4 reporting requirements, 55 percent for corporate registration, 41 percent for corporate tax instalments, 39 percent for ROE submissions and 34 percent for payroll remittances.
The shift from preparing claims/forms in-house to with the assistance of external service providers can be seen when 2011 results are compared with 2008 results:• Payroll remittances prepared in-house fell from 78 percent in 2008 to 66 percent in 2011.• ROE forms prepared in-house fell from 74 percent in 2008 to 61 percent in 2011.• T4 summary / individual T4 forms prepared in-house fell from 64 percent in 2008 to 43 percent in 2011.There was a major shift from using in-house sources to using external service providers to comply with tax regulations as well. Taken together, the shift to using external service providers to assist with regulatory compliance suggests that many business owners value their time and staff time to run the business and believe that the benefits of using external service providers outweigh the costs.
The SRCC measures the types of service providers used to assist with regulatory compliance as the complexity of the regulations is associated with the type of service provider used, with regulations requiring the assistance of accountants tending to be the most complex (Table 5).
Table 5: Types of service providers used (percent) to assist with regulatory compliance by regulation, 2011*
Source: Statistics Canada, Survey of Regulatory Compliance Costs, 2011. *Among businesses that use external service providers. Note: Numbers may total more than 100 percent as some businesses used multiple service providers.
Regulations for which businesses required the most assistance from accountants were associated with federal/provincial business income tax filing, corporate tax instalments and federal/provincial sales taxes. Regulations for which businesses required the least assistance from accountants were associated with ROE forms, payroll remittances, and municipal and provincial operating licences and permits. Regulations in these areas are more routine and can be cost effectively handled by bookkeepers and payroll services providers, and other service providers.
Regulation Accountant
Bookkeeping and Payroll Services
Provider
Tax Preparation
Services
Other Service
ProvidersPayroll Remittances 39.2 56.2 3.1 9.5
Record of Employment 35.3 58.3 1.8 9.4
T4 Summary / Individual T4s (including RL forms in Quebec) 58.9 38.3 4.5 5.6
Workers’ Compensation Remittances 42.5 51.1 1.2 9.6
Workers’ Compensation Claims 49.1 35.7 — 17.3
Federal/Provincial Business Income Tax Filing 89.8 9.8 6.7 1.9
Federal/Provincial Sales Taxes 70.8 32.3 7.1 3.2
Corporate Tax Instalments 84.3 17.6 5.8 3.2
Corporate Registration 63.3 6.8 3.2 33.2
Mandatory Statistics Canada Surveys 68.9 29.4 2.5 5.8
Municipal and Provincial Operating Licences and Permits 42.2 26.7 3.5 33.5
15
SME Regulatory Compliance Cost Report—September 2013
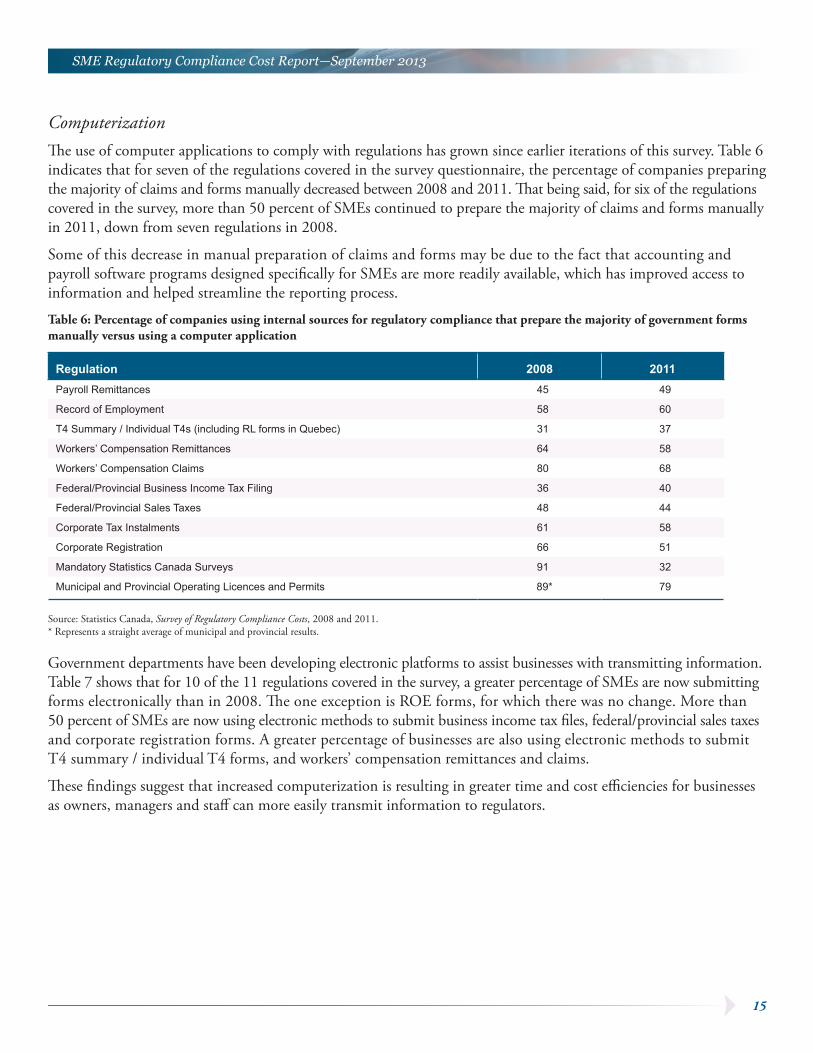
ComputerizationThe use of computer applications to comply with regulations has grown since earlier iterations of this survey. Table 6 indicates that for seven of the regulations covered in the survey questionnaire, the percentage of companies preparing the majority of claims and forms manually decreased between 2008 and 2011. That being said, for six of the regulations covered in the survey, more than 50 percent of SMEs continued to prepare the majority of claims and forms manually in 2011, down from seven regulations in 2008.
Some of this decrease in manual preparation of claims and forms may be due to the fact that accounting and payroll software programs designed specifically for SMEs are more readily available, which has improved access to information and helped streamline the reporting process.
Table 6: Percentage of companies using internal sources for regulatory compliance that prepare the majority of government forms manually versus using a computer application
Source: Statistics Canada, Survey of Regulatory Compliance Costs, 2008 and 2011. * Represents a straight average of municipal and provincial results.
Government departments have been developing electronic platforms to assist businesses with transmitting information. Table 7 shows that for 10 of the 11 regulations covered in the survey, a greater percentage of SMEs are now submitting forms electronically than in 2008. The one exception is ROE forms, for which there was no change. More than 50 percent of SMEs are now using electronic methods to submit business income tax files, federal/provincial sales taxes and corporate registration forms. A greater percentage of businesses are also using electronic methods to submit T4 summary / individual T4 forms, and workers’ compensation remittances and claims.
These findings suggest that increased computerization is resulting in greater time and cost efficiencies for businesses as owners, managers and staff can more easily transmit information to regulators.
Regulation 2008 2011Payroll Remittances 45 49
Record of Employment 58 60
T4 Summary / Individual T4s (including RL forms in Quebec) 31 37
Workers’ Compensation Remittances 64 58
Workers’ Compensation Claims 80 68
Federal/Provincial Business Income Tax Filing 36 40
Federal/Provincial Sales Taxes 48 44
Corporate Tax Instalments 61 58
Corporate Registration 66 51
Mandatory Statistics Canada Surveys 91 32
Municipal and Provincial Operating Licences and Permits 89* 79

16
SME Regulatory Compliance Cost Report—September 2013
Table 7: Percentage of companies using internal sources for regulatory compliance that submit the majority of forms electronically
Source: Statistics Canada, Survey of Regulatory Compliance Costs, 2008 and 2011. * Represents a straight average of municipal and provincial results.
3.5 Cost of Regulatory ComplianceThis section presents estimates of the cost of regulatory compliance to SMEs in the Canadian economy as a whole and breaks down the cost by region, sector and size of business.
Total CostThe 2005, 2008 and 2011 iterations of the SRCC measured the total cost for the survey population to comply with the 11 key government regulations (covered in the questionnaire).
The data indicate that, since 2008, nominal costs of regulatory compliance have grown by about 1.4 percent per year, reaching $1.22 billion in 2011. This was less than the 2.4 percent per year growth rate observed between 2005 and 2008, suggesting that nominal costs are growing at a decreasing rate.
The total real cost of regulatory compliance (after adjusting for inflation), however, reveals a decrease of almost one percent from $1.23 billion in 2008 to $1.22 billion in 2011, or about 0.23 percent on an annualized basis (Figure 6). This brings the total cost of complying with the 11 regulations back in line with the cost observed in 2005.
Federal/provincial business income tax filing represented the most costly regulatory compliance activity in 2011 (Table 8), with an average annual cost of $888 per business. Payroll remittances was second in terms of average annual cost per business ($839), having increased substantially since 2005. Complying with federal/provincial sales taxes was third in terms of average annual cost per business at $454. Complying with municipal and provincial operating licence and permit requirements was the least costly in terms of average annual cost per business ($107), having decreased steadily since 2005.
Regulation 2008 2011Payroll Remittances 36 41
Record of Employment 33 33
T4 Summary / Individual T4s (including RL forms in Quebec) 21 48
Workers’ Compensation Remittances 25 39
Workers’ Compensation Claims 10 23
Federal/Provincial Business Income Tax Filing 40 53
Federal/Provincial Sales Taxes 31 54
Corporate Tax Instalments 30 39
Corporate Registration 35 52
Mandatory Statistics Canada Surveys 5 66
Municipal and Provincial Operating Licences and Permits 14* 18

17
SME Regulatory Compliance Cost Report—September 2013
Figure 6: Total cost of regulatory compliance
Source: Statistics Canada, Survey of Regulatory Compliance Costs, 2005, 2008 and 2011; and author’s calculations.
Table 8: Average annual cost of compliance per business (real cost, 2011 dollars) by regulation
Source: Statistics Canada, Survey of Regulatory Compliance Costs, 2005, 2008 and 2011; and author’s calculations. * Municipal and provincial operating licences and permits combined.
The 2011 iteration of the SRCC was broadened to include the cost of regulatory compliance related to all “other” federal, provincial and municipal regulations. The logic was that these other regulations could have a sizeable impact on SMEs and their inclusion would provide a more complete picture of total costs.
Furthermore, the 2005 and 2008 iterations of the SRCC did not measure the cost of capital equipment purchased by SMEs to comply with regulations. These costs were also included in the 2011 SRCC.
Consequently, to facilitate comparisons with the 2011 data, Industry Canada adjusted the 2005 and 2008 data to include estimates of the cost of other regulations not originally included in the surveys and the cost of capital
Regulation 2005 2008 2011Payroll Remittances 505 505 839
Record of Employment 185 147 339
T4 Summary / Individual T4s (including RL forms in Quebec) 263 257 436
Workers’ Compensation Remittances 102 95 197
Workers’ Compensation Claims 104 89 211
Federal/Provincial Business Income Tax Filing 883 894 888
Federal/Provincial Sales Taxes 325 304 454
Corporate Tax Instalments 157 144 315
Corporate Registration 215 190 300
Mandatory Statistics Canada Surveys 149 118 173
Municipal Operating Licences and Permits 112 54107*
Provincial Operating Licences and Permits 78 71
Other Federal, Provincial and Municipal Regulations –— –— 115
1.22 1.23 1.22
0.00
0.25
0.50
0.75
1.00
1.25
1.50
1.75
2.00
2005 2008 2011
($ billions, real 2011 dollars)

18
SME Regulatory Compliance Cost Report—September 2013
equipment purchased to comply with the regulations. The assumption was that 2011 capital costs as a share of total costs and the compliance costs of “other regulations” as a share of total costs would be appropriate proxies to apply to data from the previous surveys. Adjustments for capital purchases raised cost estimates by about $670 per business and adjustments for the cost of complying with other regulations raised the original estimates by about $115 per business. Original 2011 and revised 2005 and 2008 numbers are presented in Figure 7.
In summary, the real cost of regulatory compliance has decreased by about 0.23 percent per year since 2008 and is now back at 2005 levels.
Figure 7: Adjusted total cost of regulatory compliance
Source: Statistics Canada, Survey of Regulatory Compliance Costs, 2005, 2008 and 2011; and author’s calculations.
Average Cost per BusinessThe next step was to break down the adjusted total cost of regulatory compliance into the average cost per business by size of business, region and sector. As shown in Table 9, taking into consideration all federal, provincial and municipal regulations, the cost of regulatory compliance per SME in 2011 was nearly $3,500 per year.
Among the different business size categories, the cost of regulatory compliance for the smallest businesses (non-employers) was approximately $1,000 per year. Businesses with 1–4 employees spent $2,250 per year, businesses with 5–19 employees spent $4,400 per year and businesses with 20–99 employees spent $10,600 per year. The cost for medium-sized businesses (100–499 employees) was about $25,000 per year. Consistent with the findings presented in Tables 1 and 4, businesses that spent more time on regulatory compliance and viewed it as a serious obstacle to success, i.e., medium-sized businesses, incurred the highest average costs.
Table 9 shows that regulatory compliance costs are distributed relatively evenly across regions. The average cost per business in British Columbia is about 7 percent lower than the national average. The average cost per business in the Prairie provinces, on the other hand, is about 8 percent higher than the national average. Considering the degree of variation across firm type, differences in the average cost per business across regions are not significantly different in a statistical sense. It is worth noting, however, that although there is relatively greater negativity towards regulations on the part of SMEs in Quebec and the Atlantic provinces, a greater burden is not apparent in the cost estimates.
1.52 1.53 1.52
0.00
0.25
0.50
0.75
1.00
1.25
1.50
1.75
2.00
2005 2008 2011
($ billions, real 2011 dollars)

19
SME Regulatory Compliance Cost Report—September 2013
Table 9: Average cost of regulatory compliance per business (real cost, 2011 dollars)
Source: Statistics Canada, Survey of Regulatory Compliance Costs, 2005, 2008 and 2011; and author’s calculations.
Regulatory compliance is most costly in the manufacturing sector, followed by the accommodation and food services sector. The differences in the average cost per business in these sectors compared with the other sectors can likely be explained by the fact that these sectors are more labour intensive, i.e., studies have shown that there is a positive relationship between regulatory compliance costs and the number of employees a business has.12 This can be explained by the number of employment-related regulations businesses must comply with as the number of employees increases.
Although the average real cost of regulatory compliance per business decreased between 2005 and 2008, it grew between 2008 and 2011, and that growth is statistically significant. These findings are consistent with those reported in Table 4, which show an increase in the average amount of time spent on regulatory compliance per business. Using estimates reported in Table 9, the average cost per business was $632 higher in 2011 than in 2005. This translates into an annual increase of 3.4 percent in the average cost per business from 2005 to 2011. The increase in average cost was observed across all regions and sectors.
However, not all business size categories experienced an increase in the average cost of compliance. For instance, non-employer businesses have experienced a continual decrease in the average cost of about 3 percent per year since 2005, from $1,217 per business to $1,034 per business in 2011. Medium-sized businesses have experienced some
2005 2008 2011Size of Business (number of employees)
0 1,217 1,204 1,034
1–4 1,950 1,820 2,252
5–19 3,276 3,577 4,406
20–99 6,644 7,615 10,595
100–499 27,173 20,830 24,960
Region
Atlantic Provinces 2,625 2,228 3,311
Quebec 2,558 2,814 3,351
Ontario 2,902 2,489 3,491
Prairie Provinces 3,091 2,964 3,703
British Columbia 2,658 2,321 3,195
Sector
Manufacturing 4,326 3,939 5,458
Retail Trade 3,013 3,001 3,773
Professional, Scientific and Technical Services 2,427 2,200 2,699
Accommodation and Food Services 3,745 2,873 4,559
Other Services 2,024 2,085 3,261
Canada 2,812 2,603 3,444
12 Europe Economics, Study on the Cost of Compliance with Selected FSAP Measures, 2009.

20
SME Regulatory Compliance Cost Report—September 2013
fluctuations in the average cost, decreasing in 2008 only to rise again in 2011. Considering the full period, medium-sized businesses experienced a decrease in the average cost from $27,173 in 2005 to $24,960 in 2011. This translates into an annual decline of 1.4 percent per year. All small employer business categories, however, experienced an increase in average annual cost.
Three possible factors may help explain why the overall average cost per business has increased since 2005:• Growth in the number of employer businesses: There are now almost 7 percent more employer businesses in the
five sectors surveyed than there were in 2005. In addition, businesses that were once exempt from employment-related regulations must now comply with these regulations. Naturally, this results in higher average costs.
• Growth in the number of businesses using service providers: With more small employer businesses now relying on professional service providers to meet compliance regulations (see Section 3.4), and because using a service provider costs, on average, 2.5 times more than using in-house sources to meet compliance regulations ($2,336 versus $900, excluding capital costs and implicit opportunity costs), it is not surprising to see the average cost per business rising.
• Rising cost of service providers: The average cost of using a service provider, adjusted for inflation, has increased by almost 9 percent, or $185 per business, since 2005.
Average Cost per Employee and as a Percentage of Revenue (“Burden Rate”)In measuring the impact of regulatory compliance on businesses, it is not enough to know only the total cost or average cost per business. These costs must be put into a larger context. The most effective way to do this is to measure the cost of regulatory compliance in relation to businesses’ capacity to handle the cost. Business size is frequently used as a proxy of capacity and, hence, cost per employee is commonly used to benchmark regulatory “burden” and track changes over time. A second and more exact measure is to look at cost in relation to business revenues. Much like an average tax rate, cost as a share of business revenue produces an average “burden rate.”
Considering the 2011 national results presented in Table 10, compliance with federal, provincial and municipal regulations costs SMEs approximately $370 per employee per year. The cost of regulatory compliance for the average Canadian SME equals 0.28 percent of business revenues (i.e., “overall burden rate”). This implies that less than one cent of every dollar earned by Canadian businesses goes towards covering the cost of regulatory compliance.
The cost of regulatory compliance for firms with 1–4 employees is estimated to be $1,029 per employee per year, or 0.59 percent of revenues. The cost for firms with 5–19 employees is $476 per employee, or 0.30 percent of revenues. Businesses with 20–99 employees spend $264 per employee, or 0.18 percent of annual revenues, and medium-sized businesses (100–499 employees) spend $149 per employee, or 0.18 percent of revenues. Across all sectors, the per-employee cost of regulatory compliance falls heaviest on small businesses when compared with medium-sized businesses.
The cost disadvantage faced by small businesses can be largely explained by economies of scale in terms of compliance13 as the fixed costs of regulatory compliance of larger firms can be spread over a larger employee and revenue base. Regression analysis was used to estimate this effect. The analysis involved regressing cost per employee against the median number of employees in each business size category. Results suggest that a 1-percent increase in business size translates into a 0.36-percent decrease in compliance cost per employee.
13 Organisation for Economic Co-operation and Development, Business Views on Red Tape: Administrative and Regulatory Burdens on Small and Medium-Sized Enterprises, 2001.

21
SME Regulatory Compliance Cost Report—September 2013
Table 10: Average cost of regulatory compliance per employee (real cost, 2011 dollars) and burden rate (cost as a share of business revenue) by size of business, region and sector
Source: Statistics Canada, Survey of Regulatory Compliance Costs, 2005, 2008 and 2011; and author’s calculations.
Another factor that may help explain the cost disadvantage faced by small businesses is learning by doing, i.e., medium-sized firms, which also tend to be older firms, have generally been able to lower compliance costs over time as owners, managers and staff gain greater knowledge of, and familiarity with, regulations and how to comply with them. This helps explain why many medium-sized firms are reluctant to see changes made to regulations that they have become familiar with14 as any changes could result in significant cost increases in the short term as owners, managers and staff adjust to the changes and relearn how to comply with the regulations in the most efficient manner.
It is also worth noting that the burden rate does not fall most heavily on the smallest of businesses, non-employer businesses. Table 10 shows that the burden rate for non-employer businesses is 0.49 percent, whereas the burden rate for businesses with 1–4 employees is 0.59 percent. This supports the hypothesis that as a business grows, the regulatory compliance burden increases before decreasing. This is a critical finding that is generally not captured in the cost per employee measures used in most studies. The main explanation for the lower burden rate of non-employer businesses is that such businesses are exempt from employment-related regulations, such as payroll remittances, and workers’ compensation claims and remittances. Once the non-employer business owner decides to grow the business and hire staff,
Cost per Employee ($) Burden Rate (%)
2005 2008 2011 2011Size of Business (number of employees)
0 1,217 1,204 1,034 0.49
1–4 888 872 1,029 0.59
5–19 360 399 476 0.30
20–99 165 194 264 0.18
100–499 158 129 149 0.18
Region
Atlantic Provinces 253 294 330 0.24
Quebec 246 367 303 0.26
Ontario 331 379 377 0.27
Prairie Provinces 349 424 445 0.31
British Columbia 316 324 411 0.30
Sector
Manufacturing 225 275 323 0.19
Retail Trade 294 342 316 0.16
Professional, Scientific and Technical Services 502 658 550 0.47
Accommodation and Food Services 212 183 229 0.36
Other Services 293 424 444 0.44
Canada 305 370 370 0.28
14 Industry Canada, Analysis of Regulatory Compliance Costs: Part II—Paperwork Time Burden, Costs of Paperwork Compliance and Paperwork Simplification, 2010.

22
SME Regulatory Compliance Cost Report—September 2013
however, the burden rate increases as the business must now comply with employment-related regulations. To what extent these additional costs discourage early-stage growth could be addressed in another study.15
Looking at the regional data, the cost of regulatory compliance per employee is about 20 percent higher in the Prairie provinces and 11 percent higher in British Columbia than the national average. Burden rates are also highest in these two regions. Cost per employee and burden rates are lowest in Quebec and the Atlantic provinces. Most of these regional differences are not statistically significant, however. This suggests that region is not a key contributor to differences in regulatory compliance costs.
The cost of regulatory compliance per employee and burden rates vary across sectors. Table 10 shows that businesses in the professional, scientific and technical services sector had the highest compliance cost per employee ($550) and burden rate (0.47 percent), followed by $444 for businesses in the other services sector and $323 for businesses in the manufacturing sector. The burden rate was lowest for businesses in the retail sector at 0.16 percent.
It is also worth comparing the cost of regulatory compliance per employee over time. Overall, the cost per employee increased from $305 in 2005 to $370 in 2008, but since then has remained unchanged. The cost per employee fell for businesses in Quebec and Ontario between 2008 and 2011, but increased in the other regions.
Since 2008, businesses in the retail sector observed a $26 decrease in the cost of compliance per employee and the professional, scientific and technical services sector has seen a $108 decrease. However, the cost per employee increased for businesses in the accommodation and food services, other services and manufacturing sectors. The main explanation for the increase in the cost per employee in the manufacturing sector was the decrease in the number of manufacturing jobs. More specifically, SMEs in the manufacturing sector shed over 130,000 jobs over the period, so even without an increase in the cost of compliance, the cost per employee would still be higher.16
The most challenging regulation continues to be federal/provincial business income tax filing (Table 11). Since 2005, however, it is in this area that there have been the most notable reductions in the cost of compliance per employee. After adjusting for inflation, the per-employee cost fell from $96 in 2005 to $88 in 2011, representing an 8 percent decline over the period, with a temporary increase observed in 2008. Except for mandatory Statistics Canada surveys, the per-employee cost of most other regulations increased over the period.17
Changes in the composition of the labour force are another factor that must be taken into consideration when analyzing these data, i.e., the average number of workers employed per firm has declined from 12 in 2005 to 11 in 2008.18 The rise in the average cost of compliance per business over the period (see Table 9), combined with fewer workers per firm, means the cost per worker is higher. This trend would reverse if employment were to rise.
15 Data from the 2007 Survey on Financing of Small and Medium Enterprises revealed that about 27 percent of non-employer businesses consider the cost of government regulation to be a serious obstacle to growth.
16 Statistics Canada, Survey of Employment, Payroll and Hours (SEPH), 2013; and author’s calculations.
17 Whereas municipal operating licences and permits and provincial operating licences and permits were reported separately in 2005 and 2008, they were reported together in 2011. Hence, it is unclear whether the per-employee cost for this regulation increased over the 2005–2011 period.
18 Statistics Canada, Business Register, 2005, 2008 and 2011; Statistics Canada, Survey of Employment, Payrolls and Hours (SEPH), 2005, 2008 and 2011; and author’s calculations.

23
SME Regulatory Compliance Cost Report—September 2013
Table 11: Average cost of regulatory compliance per employee (real cost, 2011 dollars) by regulation
Source: Statistics Canada, Survey of Regulatory Compliance Costs, 2005, 2008 and 2011; and author’s calculations. * Municipal and provincial operating licences and permits combined.
Regulation 2005 2008 2011Payroll Remittances 39 47 72
Record of Employment 11 11 20
T4 Summary / Individual T4s (including RL forms in Quebec) 20 25 37
Workers’ Compensation Remittances 7 7 13
Workers’ Compensation Claims 3 4 6
Federal/Provincial Business Income Tax Filing 96 126 88
Federal/Provincial Sales Taxes 35 42 45
Corporate Tax Instalments 13 16 24
Corporate Registration 20 23 27
Mandatory Statistics Canada Surveys 11 11 11
Municipal Operating Licences and Permits 9 68*
Provincial Operating Licences and Permits 1 8
Other Federal, Provincial and Municipal Regulations — — 6
Economy-Wide Total CostThis analysis attempts to include in the calculation of regulatory compliance cost the cost for those businesses not captured in the survey population, including businesses in the agriculture, construction and transportation sectors. Cost estimates for these sectors were built based on the assumption that their regulatory experiences were similar, on average, to those of similarly sized businesses that were captured in the survey population. As such, estimates of the average cost per business, by business size, were extrapolated to businesses not captured in the survey to supplement the baseline Statistics Canada numbers and build economy-wide estimates.
The economy-wide nominal cost of compliance grew from $4.3 billion to $5.2 billion between 2005 and 2011. After adjusting for inflation and growth in the size of the business sector, the real cost of compliance fell from $4.86 billion to $4.76 billion, a 2-percent decline (Figure 8). Measured as a share of economic resources, the data indicate that the cost of regulatory compliance for SMEs fell from 0.81 percent of SME GDP in 2005 to 0.75 percent of SME GDP in 2011.19
19 Based on survey data, it is estimated that the value of economic resources devoted to regulatory compliance is less than 0.5 percent of total business sector GDP.

24
SME Regulatory Compliance Cost Report—September 2013
Figure 8: Economy-wide estimates of the total cost of regulatory compliance
Source: Statistics Canada, Survey of Regulatory Compliance Costs, 2005, 2008 and 2011; and author’s calculations.
3.6 Business Opinions Regarding the Cost of Regulatory ComplianceStudies, stakeholder discussions and much of what is in the literature have left policy-makers seeking answers to one big question: how much regulatory compliance is too much? The SRCC has attempted, for the first time, to gather objective information to help answer this question.
Recognizing that the government will always need to gather information and collect taxes, and, as a result, that there will always be regulations, companies were asked to assess the extent to which the cost of regulatory compliance is at an acceptable level, a slightly higher than acceptable level or a much higher than acceptable level.
Aggregate data suggest that most SMEs view the cost of compliance to be at an acceptable level (65 percent), with only 9 percent reporting that the cost is at a much higher than acceptable level (Figure 9). This percentage was higher for medium-sized businesses than small businesses. This is consistent with the findings in Table 1, which indicate that medium-sized businesses are more inclined to view regulatory compliance as a serious obstacle to success. About 26 percent of respondents reported that the cost of compliance is slightly higher than acceptable.
These findings suggest that the majority of Canadian SMEs do not consider spending, on average, three hours per month on regulatory compliance, preparing, on average, two government forms per month and incurring costs of about $3,500 per year to be unacceptably high.
0.0
0.5
1.0
1.5
2.0
2.5
3.0
3.5
4.0
4.5
5.0
5.5
2005 2008 2011
($ billions)
4.86 4.84 4.76

25
SME Regulatory Compliance Cost Report—September 2013
Figure 9: SME opinions regarding the cost of regulatory compliance
Source: Statistics Canada, Survey of Regulatory Compliance Costs, 2011.
3.7 Prioritizing Regulatory Compliance Cost ReductionThe federal government has been developing policies and undertaking projects to reduce regulatory compliance costs for SMEs by reducing the number of forms required, simplifying the design and complexity of forms, and developing new and/or improved electronic processing methods.20 This work is aimed at helping the government achieve important public policy objectives, such as improved regulatory effectiveness and increased business productivity. Studies have shown that additional improvements can be made to the regulatory system in Canada,21 and that businesses, in general, would like the government to continue efforts to reduce the cost of regulatory compliance.
Data gathered from the SRCC confirm that SMEs support the federal government making regulatory compliance cost reduction a priority, i.e., more SMEs support regulatory compliance cost reduction to be a moderate to high priority than a low priority. Only a small percentage of SMEs (11.4 percent) believe that regulatory compliance cost reduction should not be a priority at all and that the government should focus its efforts on other activities (Figure 10). The opinion that regulatory compliance cost reduction should be a moderate to high priority for government was strongly held across all sectors, regions and business size categories.
Figure 10: SME opinions regarding prioritizing regulatory compliance cost reduction
Source: Statistics Canada, Survey of Regulatory Compliance Costs, 2011.
26.2%
8.5%
65.3%
Acceptable Slightly higherthan acceptable
Much higherthan acceptable
15.8%
43.1%
29.7%
11.4%
Not a priority Low priority Moderate priority High priority
20 Visit Industry Canada’s Paperwork Burden Reduction Initiative (PBRI) website at www.reducingpaperburden.gc.ca for details.
21 Visit the Red Tape Reduction Commission website at www.reduceredtape.gc.ca for details.

26
SME Regulatory Compliance Cost Report—September 2013
4. Conclusions
This report presents data on the cost of regulatory compliance to Canadian businesses. Data were drawn from the 2011 Statistics Canada Survey of Regulatory Compliance Costs. Almost 9,000 firms took part in the main survey questionnaire and more than 1,500 service providers took part in the supplementary survey questionnaire, providing a sample size sufficient to produce results with a high degree of confidence.
After adjusting for inflation and growth in the size of the business sector, the total real cost of regulatory compliance to Canadian SMEs was $4.76 billion in 2011. This translates into approximately $3,500 per business or $370 per employee, and a decrease of 0.3 percent per year since 2005. Measured as a percentage of SME GDP, the cost of compliance fell from 0.81 percent in 2005 to 0.75 percent in 2011.
A notable finding from the data is that although 6 percent of businesses considered regulatory compliance costs, and in particular federal regulatory compliance costs, to be a serious obstacle to their success, this was not the opinion of the majority of businesses (72 percent).
One explanation for this result is that many business owners do not find government regulatory compliance to be overly time consuming. A second explanation is that although business owners might find regulatory compliance to be tedious at times, they have generally accepted it as part of doing business. Another explanation is that business owners realize some benefits from compliance and that the net cost of regulatory compliance is less than the gross cost.
Consistent with the 2005 and 2008 data, Canadian SMEs submit, on average, two forms per month to comply with federal, provincial and municipal regulations. Firms reporting that regulatory compliance is a more serious obstacle to success, i.e., small firms with 5–99 employees and medium-sized firms, and SMEs in Quebec and the Atlantic provinces, also had to deal with a greater quantity of paperwork, on average, than businesses reporting that regulatory compliance is less of an obstacle.
The data also confirm that, out of a 160-hour work month, the average amount of time spent on regulatory compliance by Canadian SMEs in 2011 was three hours per month, or less than one hour per week. For some business owners, spending any time on regulatory compliance is too much if it distracts them in any way from running their business. Other business owners recognize the need for government regulations and accept that the time they spend on paperwork is reasonable given the benefits that accrue to society.22 To others, it is not the total amount of time spent on compliance that is the problem; rather, it is the fact that the work has to be done at different times, which is more distracting than doing it all at once.23 To some businesses, dealing with a few hours of regulatory paperwork is acceptable as long as it is done during downtimes when there is not much other work to do.24 Also, for many businesses, spending time on similar activities would be required even in the absence of regulations as many businesses would find it necessary to do similar work because such work could lead to operating efficiencies.25 For instance, even if businesses were no longer required to file income tax returns, most would still prepare annual accounts and financial statements.
22 Community of Federal Regulators Annual National Workshop, 2011.
23 Alexander, Robert, John Bell, and Stephen Knowles, Quantifying Compliance Costs of Small Businesses in New Zealand. New Zealand Institute for the Study of Competition and Regulation Inc., 2004.
24 Community of Federal Regulators Annual National Workshop, 2011.
25 McKerchar, Margaret, Helen Hodgson, and Michael Walpole. Scoping Study on the Costs of Compliance of Small Business. Atax, University of New South Wales, 2006.

27
SME Regulatory Compliance Cost Report—September 2013
These data are consistent with results from other studies that found that small businesses bear a disproportionate share of the national burden of regulatory compliance. Building on this analysis, the SRCC data indicate that the burden of compliance, measured by the “burden rate,” does not fall most heavily on the smallest of businesses. This finding supports the hypothesis that the regulatory compliance burden initially increases as firms grow and hire employees before decreasing once certain economies of scale are reached.
The survey results also confirmed that businesses are increasingly hiring professional service providers to assist with regulatory compliance. Businesses that continue to use internal sources to comply are actively adopting electronic processing methods.
About 65 percent of companies indicated that the cost of regulatory compliance is at an acceptable level, with only 8.5 percent reporting that the cost is at a much higher than acceptable level. That being said, Canadian businesses still want action taken to reduce regulatory compliance costs, with the majority of firms stating that “red tape reduction” should be a moderate to high priority for the federal government.

28
SME Regulatory Compliance Cost Report—September 2013
Annex A: Regulations Covered in the Survey
The 11 regulations considered to have the greatest impact on the largest number of SMEs across Canada are discussed below.
Payroll remittances: Employer businesses are responsible for deducting Canada Pension Plan contributions, Employment Insurance premiums and income taxes from their employees’ incomes and remitting them, along with a remittance voucher, to the Government of Canada.
Record of Employment (ROE): When an employee leaves a job, the employer must submit an official Government of Canada Record of Employment that describes how long the employee worked at the firm and how much income he/she earned while employed. Employment and Social Development Canada then uses this information to determine whether or not the employee qualifies for Employment Insurance benefits, the benefit rate and the duration of the benefit.
T4 and RL forms: A T4 (RL in Quebec) is an information slip that employer businesses send to their employees at the end of the tax year. It reports the employee’s earnings and the total amount of income taxes, Canada (Quebec) Pension Plan contributions, Employment Insurance premiums, and union dues deducted and remitted to the government during the year. A T4 summary (RLZ-1 in Quebec) is an information slip that employer businesses send to the Canada Revenue Agency (Revenu Québec) at the end of the tax year. It reports the totals of the amounts reported on all individual T4 (RL) slips.
Workers’ compensation remittances: A workers’ compensation remittance is a payment made by a business to one of the Canadian Workers’ Compensation Boards in exchange for workplace insurance coverage. This insurance coverage provides employees who become ill or are injured while on the job with medical coverage and income replacement. It also protects businesses from being sued by employees for workplace conditions that potentially caused the illness or injury. An employer business must file a workers’ compensation remittance form each time it makes a payment to its regional workers’ compensation board.
Workers’ compensation claims: When an employee becomes ill or is injured while on the job, the employer must complete an incident and injury report and send it to the workers’ compensation board within the region in which the business operates. The workers’ compensation board then reviews the report, along with both an employee report and a doctor’s report on the injury, to determine whether or not the illness or injury was caused while on the job and whether it had something to do with the employee’s job.
Federal/provincial business income tax filing: All businesses that operate in Canada or earn an income in Canada must pay income taxes and file an annual income tax return with the federal government. Unincorporated businesses must file a T1 income tax return. Incorporated businesses must file a T2 income tax return. Also, depending on the region, businesses might have to file a provincial income tax return in addition to their federal return. These returns are used by businesses to report the income that was earned during the year, from all sources; to calculate any deductions and/or tax credits received during the year; and to determine, according to federal and provincial tax laws, whether there is any tax liability owed to the government, or any tax refund owed from the government.

29
SME Regulatory Compliance Cost Report—September 2013
Federal/provincial sales taxes: Almost everything that is bought is taxed. Federal and provincial sales taxes (goods and services tax (GST) / provincial sales tax (PST) / harmonized sales tax (HST)) are types of consumption taxes that are added to the purchase price of goods or services at the time of purchase, and are usually set as a percentage of the selling price. Most goods are subject to federal/provincial sales taxes, although some are exempt. Consumers are responsible for paying the taxes; businesses are responsible for collecting the taxes and remitting them to the government. Generally, businesses must remit taxes and file sales tax returns on a regular basis.
Corporate tax instalments: Generally, corporations must pay their federal, provincial or harmonized federal–provincial income taxes in instalments, which means that they must make regular payments of a portion of the total amount of income taxes that would be due at the end of the tax year. Federal and provincial/territorial income tax acts require corporations to make these instalment payments so that businesses are treated in the same way as taxpayers who have tax deducted automatically from their paycheques during the year. Each time a business makes an instalment payment, it is generally required to file a remittance voucher.
Corporate registration: In Canada, the process of registering a business as a corporation is called “incorporation.” Incorporation involves the creation of a legal entity that is recognized by law as a fictitious person. The legal rights and obligations of this entity include (a) the right to sue or be sued, (b) the right to own and dispose of assets, (c) the right to hire workers, (d) the right to enter into contracts and (e) the right to manage its own internal affairs. In Canada, businesses have two options for incorporation: provincially or federally, and thus may be subject to federal or provincial corporate law. The act of incorporation involves completion and submission of articles of incorporation, and any other supporting documentation, with the registering authority, and submission of a registration fee.
Mandatory Statistics Canada surveys: Recipients of a mandatory Statistics Canada survey are legally required to answer the questions and return the survey to Statistics Canada within the allotted period of time.
Municipal and provincial operating licences and permits: Municipal and provincial operating licences and permits are legal documents and agreements awarded by government bodies to businesses granting them the legal right to manage and/or undertake certain work in a specific region and/or industry. Applying for licences requires completion and submission of various government forms.
Other regulations: This catch-all category includes all other possible federal, provincial and municipal regulations, including environmental and health and safety regulations, that could have an impact on businesses.

30
SME Regulatory Compliance Cost Report—September 2013
Annex B: Estimation Formulas and Concepts
Notationwi = Weight for establishment i adjusted for non-response
ti = Time spent on regulation(s) of interest by establishment i
ci = Cost generated by regulation(s) of interest for establishment i
ei = Number of employees for establishment i
Ii = 1 if regulation(s) of interest applies to establishment i and has been prepared internally for internal costing or externally for external costing. Internal work for a regulation is identified using the presence of a time value and external work is identified using the external service provider tick box.
Cell is the set of all sampled establishments in the table cell of interest. For instance, a cell could be “Ontario, 1–4 employees” or any other such category.
DefinitionsCost
The internal cost generated by a regulation for an establishment is defined as:
Cost = Minutes per submission × Number of submissions or claims ×
where the number of minutes worked in a year equals 115,200 (assuming a workday of 8 hours and 240 days worked per year).
The external cost generated by a regulation for an establishment is derived from the service providers’ component of the survey.
The combined cost is defined as the sum of the internal and external costs.
When looking at all regulations combined, the cost is the sum of the individual cost for each regulation. It is assumed that there has been internal (external) work for all regulations combined if at least one regulation had some work done internally (externally).
Total Annual Time for All Establishments
The total annual time for all establishments is the weighted sum of the time spent on a regulation (or all regulations) over all sampled establishments in the cell. The total annual time for all establishments is derived only for internal estimates.
Total annual time =
Average Annual Time per Establishment
The average annual time per establishment is the weighted sum of the time spent on a regulation (or all regulations) over all sampled establishments in the cell divided by the weighted number of establishments in the cell. The average annual time per establishment is derived only for internal estimates.
Annual Salary Minutes worked in a year
∑ Iiwiti
i∈cell

31
SME Regulatory Compliance Cost Report—September 2013
Average annual time per establishment =
Total Annual Cost for All Establishments
The total annual cost for all establishments is the weighted sum of the cost generated by a regulation (or all regulations) over all sampled establishments in the cell.
Total annual cost =
Average Annual Cost per Establishment
The average annual cost per establishment is the weighted sum of the cost generated by a regulation (or all regulations) over all sampled establishments in the cell divided by the weighted number of establishments in the cell.
Average annual cost per establishment =
Average Cost per Employee
The average cost per employee is the weighted sum of the cost generated by a regulation (or all regulations) over all sampled establishments in the cell divided by the weighted sum of the number of employees in each sampled establishment in the cell.
Average cost per employee =
Proportions and Counts
Tables that are not related to costing contain either proportions or counts of establishments.
Proportions are estimated as the weighted sum of an indicator variable Y taking a value of one only if the establishment is part of the domain of interest over all sampled establishments in the cell divided by the weighted number of establishments in the cell.
Proportion =
Counts are defined as the weighted sum of an indicator variable Y taking a value of one only if the establishment is part of the domain of interest over all sampled establishments in the cell.
Count =
∑ Iiwiti
i∈cell
∑ Iiwi
i∈cell
∑ Iiwici
i∈cell
∑ Iiwi
i∈cell
∑ Iiwici
i∈cell
∑ Iiwiei
i∈cell
∑ wiYi
i∈cell
∑ wi
i∈cell
∑ Iiwici
i∈cell
∑ wiYi
i∈cell