SmartSock: A Wearable Platform for Context-Aware...
5
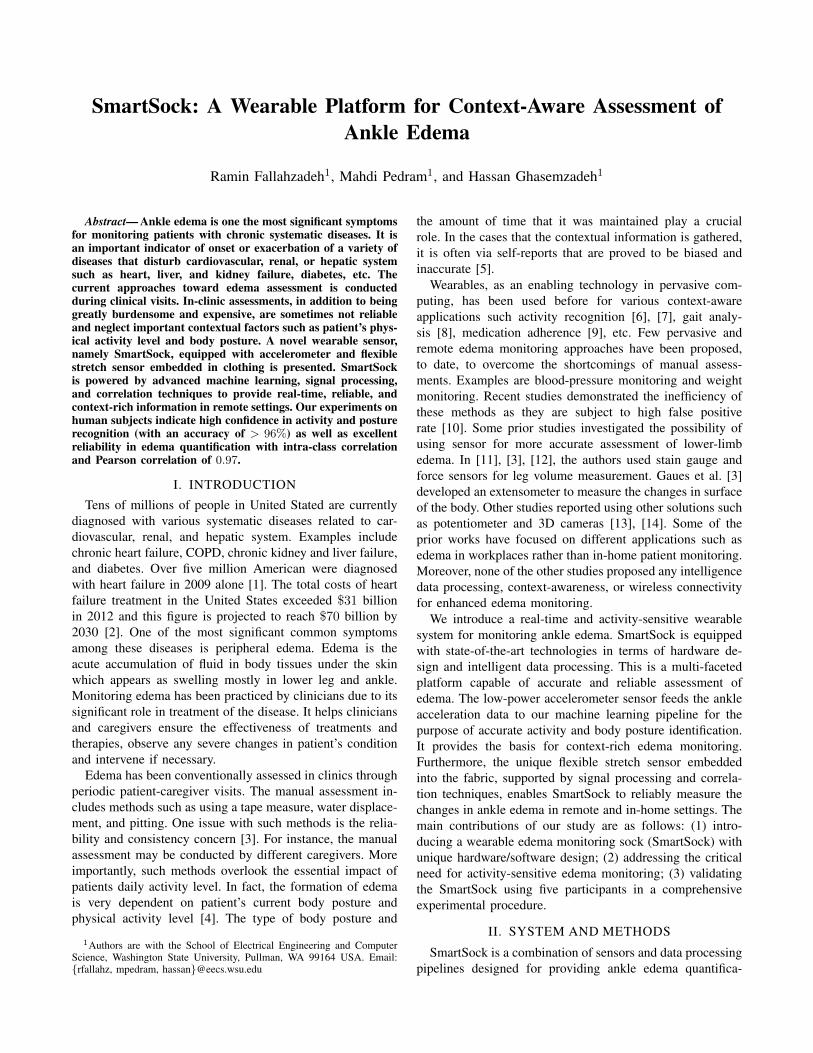
SmartSock: A Wearable Platform for Context-Aware Assessment of Ankle Edema Ramin Fallahzadeh 1 , Mahdi Pedram 1 , and Hassan Ghasemzadeh 1 Abstract— Ankle edema is one the most significant symptoms for monitoring patients with chronic systematic diseases. It is an important indicator of onset or exacerbation of a variety of diseases that disturb cardiovascular, renal, or hepatic system such as heart, liver, and kidney failure, diabetes, etc. The current approaches toward edema assessment is conducted during clinical visits. In-clinic assessments, in addition to being greatly burdensome and expensive, are sometimes not reliable and neglect important contextual factors such as patient’s phys- ical activity level and body posture. A novel wearable sensor, namely SmartSock, equipped with accelerometer and flexible stretch sensor embedded in clothing is presented. SmartSock is powered by advanced machine learning, signal processing, and correlation techniques to provide real-time, reliable, and context-rich information in remote settings. Our experiments on human subjects indicate high confidence in activity and posture recognition (with an accuracy of > 96%) as well as excellent reliability in edema quantification with intra-class correlation and Pearson correlation of 0.97. I. INTRODUCTION Tens of millions of people in United Stated are currently diagnosed with various systematic diseases related to car- diovascular, renal, and hepatic system. Examples include chronic heart failure, COPD, chronic kidney and liver failure, and diabetes. Over five million American were diagnosed with heart failure in 2009 alone [1]. The total costs of heart failure treatment in the United States exceeded $31 billion in 2012 and this figure is projected to reach $70 billion by 2030 [2]. One of the most significant common symptoms among these diseases is peripheral edema. Edema is the acute accumulation of fluid in body tissues under the skin which appears as swelling mostly in lower leg and ankle. Monitoring edema has been practiced by clinicians due to its significant role in treatment of the disease. It helps clinicians and caregivers ensure the effectiveness of treatments and therapies, observe any severe changes in patient’s condition and intervene if necessary. Edema has been conventionally assessed in clinics through periodic patient-caregiver visits. The manual assessment in- cludes methods such as using a tape measure, water displace- ment, and pitting. One issue with such methods is the relia- bility and consistency concern [3]. For instance, the manual assessment may be conducted by different caregivers. More importantly, such methods overlook the essential impact of patients daily activity level. In fact, the formation of edema is very dependent on patient’s current body posture and physical activity level [4]. The type of body posture and 1 Authors are with the School of Electrical Engineering and Computer Science, Washington State University, Pullman, WA 99164 USA. Email: {rfallahz, mpedram, hassan}@eecs.wsu.edu the amount of time that it was maintained play a crucial role. In the cases that the contextual information is gathered, it is often via self-reports that are proved to be biased and inaccurate [5]. Wearables, as an enabling technology in pervasive com- puting, has been used before for various context-aware applications such activity recognition [6], [7], gait analy- sis [8], medication adherence [9], etc. Few pervasive and remote edema monitoring approaches have been proposed, to date, to overcome the shortcomings of manual assess- ments. Examples are blood-pressure monitoring and weight monitoring. Recent studies demonstrated the inefficiency of these methods as they are subject to high false positive rate [10]. Some prior studies investigated the possibility of using sensor for more accurate assessment of lower-limb edema. In [11], [3], [12], the authors used stain gauge and force sensors for leg volume measurement. Gaues et al. [3] developed an extensometer to measure the changes in surface of the body. Other studies reported using other solutions such as potentiometer and 3D cameras [13], [14]. Some of the prior works have focused on different applications such as edema in workplaces rather than in-home patient monitoring. Moreover, none of the other studies proposed any intelligence data processing, context-awareness, or wireless connectivity for enhanced edema monitoring. We introduce a real-time and activity-sensitive wearable system for monitoring ankle edema. SmartSock is equipped with state-of-the-art technologies in terms of hardware de- sign and intelligent data processing. This is a multi-faceted platform capable of accurate and reliable assessment of edema. The low-power accelerometer sensor feeds the ankle acceleration data to our machine learning pipeline for the purpose of accurate activity and body posture identification. It provides the basis for context-rich edema monitoring. Furthermore, the unique flexible stretch sensor embedded into the fabric, supported by signal processing and correla- tion techniques, enables SmartSock to reliably measure the changes in ankle edema in remote and in-home settings. The main contributions of our study are as follows: (1) intro- ducing a wearable edema monitoring sock (SmartSock) with unique hardware/software design; (2) addressing the critical need for activity-sensitive edema monitoring; (3) validating the SmartSock using five participants in a comprehensive experimental procedure. II. SYSTEM AND METHODS SmartSock is a combination of sensors and data processing pipelines designed for providing ankle edema quantifica-
Transcript of SmartSock: A Wearable Platform for Context-Aware...
SmartSock: A Wearable Platform for Context-Aware Assessment ofAnkle Edema
Ramin Fallahzadeh1, Mahdi Pedram1, and Hassan Ghasemzadeh1
Abstract— Ankle edema is one the most significant symptomsfor monitoring patients with chronic systematic diseases. It isan important indicator of onset or exacerbation of a variety ofdiseases that disturb cardiovascular, renal, or hepatic systemsuch as heart, liver, and kidney failure, diabetes, etc. Thecurrent approaches toward edema assessment is conductedduring clinical visits. In-clinic assessments, in addition to beinggreatly burdensome and expensive, are sometimes not reliableand neglect important contextual factors such as patient’s phys-ical activity level and body posture. A novel wearable sensor,namely SmartSock, equipped with accelerometer and flexiblestretch sensor embedded in clothing is presented. SmartSockis powered by advanced machine learning, signal processing,and correlation techniques to provide real-time, reliable, andcontext-rich information in remote settings. Our experiments onhuman subjects indicate high confidence in activity and posturerecognition (with an accuracy of > 96%) as well as excellentreliability in edema quantification with intra-class correlationand Pearson correlation of 0.97.
I. INTRODUCTION
Tens of millions of people in United Stated are currentlydiagnosed with various systematic diseases related to car-diovascular, renal, and hepatic system. Examples includechronic heart failure, COPD, chronic kidney and liver failure,and diabetes. Over five million American were diagnosedwith heart failure in 2009 alone [1]. The total costs of heartfailure treatment in the United States exceeded $31 billionin 2012 and this figure is projected to reach $70 billion by2030 [2]. One of the most significant common symptomsamong these diseases is peripheral edema. Edema is theacute accumulation of fluid in body tissues under the skinwhich appears as swelling mostly in lower leg and ankle.Monitoring edema has been practiced by clinicians due to itssignificant role in treatment of the disease. It helps cliniciansand caregivers ensure the effectiveness of treatments andtherapies, observe any severe changes in patient’s conditionand intervene if necessary.
Edema has been conventionally assessed in clinics throughperiodic patient-caregiver visits. The manual assessment in-cludes methods such as using a tape measure, water displace-ment, and pitting. One issue with such methods is the relia-bility and consistency concern [3]. For instance, the manualassessment may be conducted by different caregivers. Moreimportantly, such methods overlook the essential impact ofpatients daily activity level. In fact, the formation of edemais very dependent on patient’s current body posture andphysical activity level [4]. The type of body posture and
1Authors are with the School of Electrical Engineering and ComputerScience, Washington State University, Pullman, WA 99164 USA. Email:{rfallahz, mpedram, hassan}@eecs.wsu.edu
the amount of time that it was maintained play a crucialrole. In the cases that the contextual information is gathered,it is often via self-reports that are proved to be biased andinaccurate [5].
Wearables, as an enabling technology in pervasive com-puting, has been used before for various context-awareapplications such activity recognition [6], [7], gait analy-sis [8], medication adherence [9], etc. Few pervasive andremote edema monitoring approaches have been proposed,to date, to overcome the shortcomings of manual assess-ments. Examples are blood-pressure monitoring and weightmonitoring. Recent studies demonstrated the inefficiency ofthese methods as they are subject to high false positiverate [10]. Some prior studies investigated the possibility ofusing sensor for more accurate assessment of lower-limbedema. In [11], [3], [12], the authors used stain gauge andforce sensors for leg volume measurement. Gaues et al. [3]developed an extensometer to measure the changes in surfaceof the body. Other studies reported using other solutions suchas potentiometer and 3D cameras [13], [14]. Some of theprior works have focused on different applications such asedema in workplaces rather than in-home patient monitoring.Moreover, none of the other studies proposed any intelligencedata processing, context-awareness, or wireless connectivityfor enhanced edema monitoring.
We introduce a real-time and activity-sensitive wearablesystem for monitoring ankle edema. SmartSock is equippedwith state-of-the-art technologies in terms of hardware de-sign and intelligent data processing. This is a multi-facetedplatform capable of accurate and reliable assessment ofedema. The low-power accelerometer sensor feeds the ankleacceleration data to our machine learning pipeline for thepurpose of accurate activity and body posture identification.It provides the basis for context-rich edema monitoring.Furthermore, the unique flexible stretch sensor embeddedinto the fabric, supported by signal processing and correla-tion techniques, enables SmartSock to reliably measure thechanges in ankle edema in remote and in-home settings. Themain contributions of our study are as follows: (1) intro-ducing a wearable edema monitoring sock (SmartSock) withunique hardware/software design; (2) addressing the criticalneed for activity-sensitive edema monitoring; (3) validatingthe SmartSock using five participants in a comprehensiveexperimental procedure.
II. SYSTEM AND METHODS
SmartSock is a combination of sensors and data processingpipelines designed for providing ankle edema quantifica-
(a)
(A)
(B)
(b)
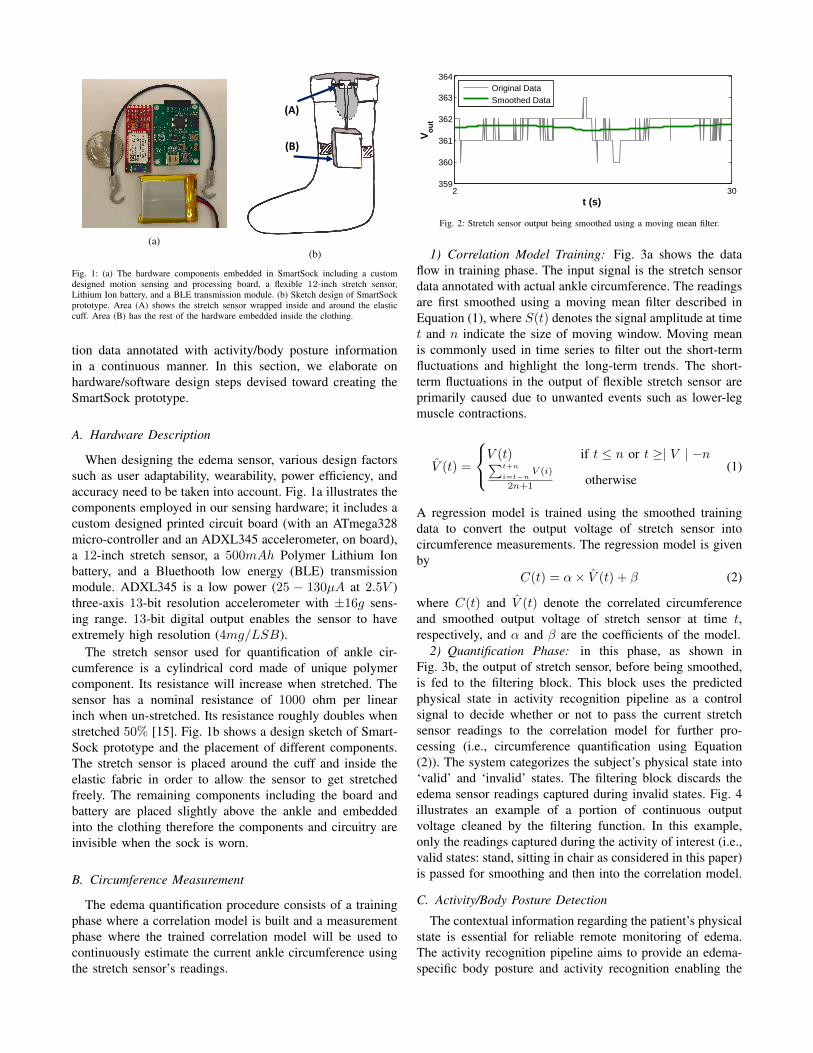
Fig. 1: (a) The hardware components embedded in SmartSock including a customdesigned motion sensing and processing board, a flexible 12-inch stretch sensor,Lithium Ion battery, and a BLE transmission module. (b) Sketch design of SmartSockprototype. Area (A) shows the stretch sensor wrapped inside and around the elasticcuff. Area (B) has the rest of the hardware embedded inside the clothing.
tion data annotated with activity/body posture informationin a continuous manner. In this section, we elaborate onhardware/software design steps devised toward creating theSmartSock prototype.
A. Hardware Description
When designing the edema sensor, various design factorssuch as user adaptability, wearability, power efficiency, andaccuracy need to be taken into account. Fig. 1a illustrates thecomponents employed in our sensing hardware; it includes acustom designed printed circuit board (with an ATmega328micro-controller and an ADXL345 accelerometer, on board),a 12-inch stretch sensor, a 500mAh Polymer Lithium Ionbattery, and a Bluethooth low energy (BLE) transmissionmodule. ADXL345 is a low power (25 − 130µA at 2.5V )three-axis 13-bit resolution accelerometer with ±16g sens-ing range. 13-bit digital output enables the sensor to haveextremely high resolution (4mg/LSB).
The stretch sensor used for quantification of ankle cir-cumference is a cylindrical cord made of unique polymercomponent. Its resistance will increase when stretched. Thesensor has a nominal resistance of 1000 ohm per linearinch when un-stretched. Its resistance roughly doubles whenstretched 50% [15]. Fig. 1b shows a design sketch of Smart-Sock prototype and the placement of different components.The stretch sensor is placed around the cuff and inside theelastic fabric in order to allow the sensor to get stretchedfreely. The remaining components including the board andbattery are placed slightly above the ankle and embeddedinto the clothing therefore the components and circuitry areinvisible when the sock is worn.
B. Circumference Measurement
The edema quantification procedure consists of a trainingphase where a correlation model is built and a measurementphase where the trained correlation model will be used tocontinuously estimate the current ankle circumference usingthe stretch sensor’s readings.
2 30359
360
361
362
363
364
t (s)
Vo
ut
Original DataSmoothed Data
Fig. 2: Stretch sensor output being smoothed using a moving mean filter.
1) Correlation Model Training: Fig. 3a shows the dataflow in training phase. The input signal is the stretch sensordata annotated with actual ankle circumference. The readingsare first smoothed using a moving mean filter described inEquation (1), where S(t) denotes the signal amplitude at timet and n indicate the size of moving window. Moving meanis commonly used in time series to filter out the short-termfluctuations and highlight the long-term trends. The short-term fluctuations in the output of flexible stretch sensor areprimarily caused due to unwanted events such as lower-legmuscle contractions.
V̂ (t) =
V (t) if t ≤ n or t ≥| V | −n∑t+n
i=t−nV (i)
2n+1 otherwise(1)
A regression model is trained using the smoothed trainingdata to convert the output voltage of stretch sensor intocircumference measurements. The regression model is givenby
C(t) = α× V̂ (t) + β (2)
where C(t) and V̂ (t) denote the correlated circumferenceand smoothed output voltage of stretch sensor at time t,respectively, and α and β are the coefficients of the model.
2) Quantification Phase: in this phase, as shown inFig. 3b, the output of stretch sensor, before being smoothed,is fed to the filtering block. This block uses the predictedphysical state in activity recognition pipeline as a controlsignal to decide whether or not to pass the current stretchsensor readings to the correlation model for further pro-cessing (i.e., circumference quantification using Equation(2)). The system categorizes the subject’s physical state into‘valid’ and ‘invalid’ states. The filtering block discards theedema sensor readings captured during invalid states. Fig. 4illustrates an example of a portion of continuous outputvoltage cleaned by the filtering function. In this example,only the readings captured during the activity of interest (i.e.,valid states: stand, sitting in chair as considered in this paper)is passed for smoothing and then into the correlation model.
C. Activity/Body Posture Detection
The contextual information regarding the patient’s physicalstate is essential for reliable remote monitoring of edema.The activity recognition pipeline aims to provide an edema-specific body posture and activity recognition enabling the

SmoothingLinear
Regression
Labeled
Data
Correlation
Model
SmoothingCorrelation
Model
Un-labeled
Data
Estimated
CircumferenceFiltering
Predicted Activity/Posture
(a) Training phase.
SmoothingLinear
Regression
Labeled
Data
Correlation
Model
SmoothingCorrelation
Model
Un-labeled
Data
Estimated
CircumferenceFiltering
Predicted Activity/Posture
Segmentation Classification*Un-labeled
Data
Predicted
Activity/Posture
Feature
Extraction
(b) Measurement phase.
Fig. 3: Data flow in training and measurement phases.
1 30335
340
345
350
355
360
365
t (s)
Vo
ut
walking
walkingstanding
walking standing
Fig. 4: Filtering block validates the circumference sensor readings by discarding thedata captured during invalid physical states (e.g., walking, laying down, etc.). Thesegments highlighted in red will be discarded.
system to validate the edema sensor readings (taking placefiltering block in Fig. 3b) and annotate the valid reading bytheir corresponding body posture. Fig. 5 illustrates a high-level description of our activity recognition model. Similarto circumference measurement procedure, it encompasses atraining phase and measurement phase.
1) Training Activity Learner: This task is carried outusing the three-axis acceleration data which are manuallyannotated with their actual physical state. The labeled dataare first segmented into short windows of activity. Usingthe sliding window method, segments of 54 data instances(i.e., 3 seconds of activity at 18Hz sampling frequency) areextracted. The sliding window allows for 80% of overlapbetween successive segments. 10 statistical temporal features(i.e., amplitude, median, mean, maximum, minimum, peak topeak, standard deviation, variance, root mean square power,and start to end value) are extracted from each segment.These features provide an optimal trade-off between com-putational complexity and activity recognition accuracy [16]and, as a result, make the the data processing more adaptablefor use in a wearable system which is constrained by limitedenergy source and computational capability. The extractedfeatures and their corresponding activity labels are then usedto train a standard machine learning algorithm (e.g., decisiontree, nearest neighbor, etc.).
2) Continuous Activity Recognition: Once an activitylearner is built, we use the trained model to predict the corre-sponding physical activity label of unlabeled data (i.e., 3-axisaccelerometer readings). The unlabeled data (also referredto as test data) will go through the same segmentation andfeature extraction process. The extracted features will be fedinto the activity learner that ultimately outputs the predictedactivity/ body posture.
SmoothingLinear
Regression
Labeled
Data
Correlation
Model
SmoothingCorrelation
Model
Un-labeled
Data
Estimated
CircumferenceFiltering
Predicted Activity/Posture
Segmentation Classification*Un-labeled
Data
Predicted
Activity/Posture
Feature
Extraction
Fig. 5: Data processing flow in physical activity detection. *In training phase, aclassifier will be trained in this block. Also, the input data in training phase is labeleddata.
TABLE I: The details of the movements performed in our experiment including lightactivities, transitional movements and body postures.
No. Physical Movement Details Length
1 stand standing naturally 60s
2 sit in chair feet planted to floor 60s
3 sit on floor legs parallel to floor 60s
4 lay on floor back and leg parallel to floor 60s
5 sit to stand from chair to upright stance 10x
6 bending at knees pick up coin from floor 10x
7 bending at waist pick up coin from floor 10x
8 jump jump vertically 10x
9 climb stairs one step per stride 6 flights
10 descend stairs one step per stride 6 flights
11 walk at normal pace 60s
III. VALIDATION
In this section, we first describe the experimental setup andthen present the activity/ body posture classification accuracyand correlation results using various measures of reliabilityand repeatability.
A. Experimental Setup
The experiment aims to provide proof of functionality ofSmartSock system in terms of accuracy of activity detectionand ankle circumference quantification. Five healthy individ-uals aged between 23 and 31 were recruited on WashingtonState University (WSU) campus. Participants were informedof the experiment procedure and goals and were requiredto sign a consent form approved by WSU IRB (]14522-001). We asked each participant to perform 11 differentphysical tasks while wearing the SmartSock prototype onthe right foot. These tasks (detailed in Table I) include threecategories: transitional movements, physical activities, andmaintained body postures. These tasks are selected such thatthey cover main physical states in their categories with mostimpact on activity aware edema assessment. Fig. 6 shows apicture of a participant wearing the prototype. SmartSockwas paired with a password protected Microsoft Surfacedevice through Bluetooth connectivity and the collecteddata were stored on the device during the experiment at18.7Hz frequency. At the end of the experiment, the actualcircumference on the exact location of stretch sensor wasmanually measures using a tape measure.
B. Activity Recognition Results
The collected acceleration data were segmented into win-dows of 54 instances (i.e., 3 seconds of activity). Tenstatistical features were extracted from each data segmentresulting in a total of 174× 10 annotated features. A Matlabtool was developed to perform off-line segmentation and

Fig. 6: A participant wearing the SmartSock prototype.
feature extraction. The annotated feature set was then fedinto various machine learning algorithms. We used Wekamachine learning toolkit for training and evaluation of ourclassification models. We chose Decision Tree algorithm(DT), Nearest Neighbor (NN), and Naive Bayes learner (NB)which offer computationally simple (therefore more suitable)solutions for activity identification in wearable systems.
In order to evaluate the performance of our classificationmodels, we ran two tests using 10-fold cross-validation and66%-test split methods. 10-fold cross-validation uses onetenth of data as the supplied test in each iteration and reportsthe average performance. Test split method trains the modelusing a portion of data and tests the model using the rest.Fig. 7 shows the performance of the activity recognitionmodels in terms of precision and recall accuracy and the areaunder ROC curve. Precision metric measures the fraction ofidentified labels that are relevant where recall measures theproportion of labels that are correctly identified as such. ROCis true positive rate vs false positive rate plot. ROC areais an indication of the probability that the current modelis making an informed decision. As it can be observed inFig. 7, decision tree and nearest neighbor models showedsufficiently high performance (≥ 0.95) outperforming naiveBayes model. The reason is that probabilistic models suchas naive Bayes often fail to offer significant performance onsmaller data sets. Cross-validation method slightly outper-forms the 66%-test split due to its advantage in using theentire data set.
Table II reveals more details of activity recognition results.It shows the confusion matrix and the precision and recallaccuracy of the decision tree model for each movementevaluated using 10-fold cross-validation evaluation method.While the overall accuracy of the model is high (withweighted average accuracy of 0.97), some instances ofmovements 9 and 10 (i.e., climbing and descending stairs)were misclassified by the activity recognition model.
C. Circumference Measurement Results
Using the stretch sensor data collected during the experi-ments, we developed a regression model to correlate the val-idated smoothed output with actual ankle circumference. Asdiscussed in Section II-B, we first exclude the stretch sensorreadings captured during invalid physical states. Similar toin-clinic edema assessment, we consider movements 1 and2 (i.e., standing and sitting in chair) as the only medicallyrelevant inputs (i.e., valid states) to our edema quantificationmodule. The valid voltage output is then smoothed using thewindow size of n = 10s to discard the unwanted fluctuations
DT NN NB DT NN NB0.5
0.55
0.6
0.65
0.7
0.75
0.8
0.85
0.9
0.95
1
Acc
urec
y R
ate
Precision
Recall
ROC Area
Cross−Validation Test Split
Fig. 7: Performance of different classifiers using 10-fold cross-correlation and 66%-test split evaluation methods.
TABLE II: Confusion matrix and precision and recall accuracy of each movementusing DT classifier and 10-fold cross-validation method.
Classified as → (1) (2) (3) (4) (5) (6) (7) (8) (9) (10) (10) Precision (%)
(1) 388 0 0 0 0 0 0 0 0 0 0 1(2) 3 385 0 0 0 0 0 0 0 0 0 99(3) 0 2 385 1 0 0 0 0 0 0 0 99(4) 0 0 4 384 0 0 0 0 0 0 0 99(5) 0 0 0 0 44 0 2 0 0 2 0 91(6) 0 0 0 0 1 47 0 0 0 0 0 97(7) 0 0 0 0 1 0 47 0 0 0 0 97(8) 0 0 0 0 0 0 0 43 1 4 0 89(9) 0 0 0 0 0 0 0 1 241 15 3 92
(10) 1 0 0 0 0 0 0 3 18 231 7 89(11) 0 0 0 0 0 0 0 0 3 2 283 98
Recall (%) 99 99 99 99 95 100 95 91 91 90 97 -
TABLE III: Details of regression models and their corresponding R-squared value.
Included Physical States Regression Model R2
”stand” C(t) = −14.2× V̂ (t) + 818 0.94
”sit in chair” C(t) = −15.2× V̂ (t) + 859 0.90
”stand” & ”sit in chair” C(t) = −14.7× V̂ (t) + 838.5 0.91
caused by irrelevant sources such as muscle contractions.In the next step, the preprocessed data collected from eachparticipant (i.e., 60s of standing and 60s of sitting in chair)were split into three 20-second segments of continuousdata. We refer to each data segment as one trial. Trailsare annotated with participants’ actual ankle circumferencemeasured at the time of experiment. We used these trailsto (1) build the linear regression model and (2) calculate thereliability and repeatability measures to evaluate the usabilityof flexible stretch sensor.
Using the median value of each trial and its correspondingcircumference label, we developed a linear regression modelas described in Equation (2). Three regression models werebuilt using instances of movement (1), movement (2), andcombinational of those two. Table III presents the detailsof constructed models and their corresponding R2 values. Ahigh correlation of sensor output and actual circumference (>0.90) was reported. However, data instances captured during”stand” state, shows comparatively higher correlation. Oneexplanation could be the higher chance of deviation fromupright position in lower leg, when sitting in chair that could

TABLE IV: Reliability measures for each pair of trials
Subjects 1 2 3 4 5
Trial pairs 1-2 2-3 1-2 2-3 1-2 2-3 1-2 2-3 1-2 2-3
Typical Error 0.18 0.11 0.14 0.12 0.15 0.09 0.08 0.14 0.14 0.18
Pearson Correlation 0.96 0.97 0.96 0.99 0.97 0.98 0.96 0.96 0.97 0.98
Intraclass Correlation 0.98 0.96 0.97 0.97 0.96 0.97 0.99 0.96 0.98 0.96
cause possible inconsistencies in stretch sensor readings.In order to further explore the usability of the stretch
sensor in terms of reliability and repeatability in readings, wecalculated the Pearson correlation and intraclass correlation(ICC) measures. Table IV shows the metrics calculatedfor each subject collected from stance posture. Pearsoncorrelation measures the level of consistency between eachtrial where any value greater than 0.9 is considered ex-cellent reliability. The intraclass correlation measures theabsolute agreement between output of different trials. Theaverage reported number for ICC is 0.97. Similar to Pearsoncorrelation, any ICC value above 0.9 indicates excellentrepeatability. This result suggests that the proposed sensingdevice is capable of reproducing the same output in differenttrials with excellent reliability. The minor difference in eachtrial can be explained by human errors or irrelevant sourcesof distortion (Standard error of measurement a.k.a typicalerror). Typical error of around 0.1 results in 95% confidenceinterval of [V ±2.65∗SEM ] = [V ±0.26] which is sufficientfor detecting meaningful changes in ankle circumference(i.e., it lies outside the margin of error) for the purpose ofedema monitoring.
IV. CONCLUSION
An activity-aware remote edema monitoring platform,namely SmartSock, was presented in this paper. SmartSockis a fully wearable sensing system that takes advantage ofadvanced techniques in machine learning and signal process-ing. As mentioned, ankle edema is an important symptomof several chronic and systematic diseases such as heartfailure, kidney and liver failure, diabetes, etc. Conventionalin-clinic assessment of edema has several disadvantages: (1)it is burdensome for edema patients (especially older adults);(2) it is very costly for health-care system, patients, andinsurance companies; (3) it offers incomplete and often un-reliable information in terms of contextual information suchas daily physical activity level; (4) it is prone to human errorand fails to provide accurate, comprehensive, and continuousassessment. SmartSock is a remote monitoring solution todisadvantages of in-clinic assessments. It provides a meansfor context-rich, accurate, and reliable edema monitoring inremote settings which makes it a better, more affordable, andmore convenient alternative to current methods.
Our experimental results demonstrate that SmartSock iscapable of identifying a wide range of physical activities withan accuracy of 97%. Furthermore, the unique flexible stretchsensor employed in our device is capable of measuringankle circumference with high correlation (R2 = 0.94) andexcellent test-retest repeatability (ICC = 0.97).
REFERENCES
[1] D. Lloyd-Jones, R. Adams, M. Carnethon, G. De Simone, T. B.Ferguson, K. Flegal, E. Ford, K. Furie, A. Go, K. Greenlund et al.,“Heart disease and stroke statistics2009 update a report from theamerican heart association statistics committee and stroke statisticssubcommittee,” Circulation, vol. 119, no. 3, pp. e21–e181, 2009.
[2] P. A. Heidenreich, N. M. Albert, L. A. Allen, D. A. Bluemke, J. Butler,G. C. Fonarow, J. S. Ikonomidis, O. Khavjou, M. A. Konstam,T. M. Maddox et al., “Forecasting the impact of heart failure in theunited states a policy statement from the american heart association,”Circulation: Heart Failure, vol. 6, no. 3, pp. 606–619, 2013.
[3] T. Kawano, S. Nishida, and M. Hashimoto, “Development of mea-suring device for lower leg swelling using a strain gauge,” JSMEInternational Journal Series C, vol. 48, no. 4, pp. 592–597, 2005.
[4] I. O. Man, K. Glover, P. Nixon, R. Poyton, R. Terre, and M. C.Morrissey, “Effect of body position on foot and ankle volume inhealthy subjects,” Clinical physiology and functional imaging, vol. 24,no. 6, pp. 323–326, 2004.
[5] R. Holland, B. Rechel, K. Stepien, I. Harvey, and I. Brooksby,“Patients’ self-assessed functional status in heart failure by new yorkheart association class: a prognostic predictor of hospitalizations,quality of life and death,” Journal of cardiac failure, vol. 16, no. 2,pp. 150–156, 2010.
[6] H. Ghasemzadeh, R. Fallahzadeh, and R. Jafari, “A hardware-assistedenergy-efficient processing model for activity recognition using wear-ables,” ACM Transactions on Design Automation of Electronic Systems(TODAES), vol. 21, 2016.
[7] R. Saeedi, R. Fallahzadeh, P. Alinia, and H. Ghasemzadeh, “Anenergy-efficient computational model for uncertainty management indynamically changing networked wearables,” in International Sympo-sium on Low Power Electronics and Design (ISLPED). IEEE/ACM,2016.
[8] Y. Ma, R. Fallahzadeh, and H. Ghasemzadeh, “Toward robust andplatform-agnostic gait analysis,” in Wearable and Implantable BodySensor Networks (BSN), 2015 IEEE 12th International Conferenceon. IEEE, 2015, pp. 1–6.
[9] N. Hezarjaribi, R. Fallahzadeh, and H. Ghasemzadeh, “A machinelearning approach for medication adherence monitoring using body-worn sensors,” IEEE/ACM Design, Automation and Test in Europe(DATE), 2016.
[10] A. S. Desai and M. A. Konstam, “Home monitoring heart failure caredoes not improve patient outcomes looking beyond telephone-baseddisease management,” Circulation, vol. 125, no. 6, pp. 828–836, 2012.
[11] J. A. Healey, “Method and apparatus for measuring lower extremityvolume,” Feb. 3 2009, uS Patent 7,484,408.
[12] R. Fallahzadeh, M. Pedram, R. Saeedi, B. Sadeghi, M. Ong, andH. Ghasemzadeh, “Smart-cuff: A wearable bio-sensing platform withactivity-sensitive information quality assessment for monitoring an-kle edema,” in Pervasive Computing and Communication Workshops(PerCom Workshops), 2015 IEEE International Conference on. IEEE,2015, pp. 57–62.
[13] J. A. Anderson, “Method for detecting edema,” Apr. 6 1999, uS Patent5,891,059.
[14] D. Hayn, F. Fruhwald, A. Riedel, M. Falgenhauer, and G. Schreier,“Leg edema quantification for heart failure patients via 3d imaging,”Sensors, vol. 13, no. 8, pp. 10 584–10 598, 2013.
[15] (2016, Feb.) Flexible stretch sensor. [Online]. Available:http://www.imagesco.com/sensors/stretch.pdf
[16] H. Ghasemzadeh, N. Amini, R. Saeedi, and M. Sarrafzadeh, “Power-aware computing in wearable sensor networks: an optimal featureselection,” Mobile Computing, IEEE Transactions on, vol. 14, no. 4,pp. 800–812, 2015.