Smartphone Repair Study 2019
16
In cooperation with Smartphone Repair Study 2019
Transcript of Smartphone Repair Study 2019

In cooperation with
Smartphone Repair Study 2019

DEAR READERS,For consumers it is important to have a functioning and reliable smartphone. At the same time, there are growing social demands for sustainability. More than a third of all smartphones suffer a defect in the course of their service life. In this study, we found that only 15.4 per cent of owners have the damage to their smartphone repaired. If we compare these two figures, the proportion of smartphone repairs is far too low.
clickrepair, WERTGARANTIE’s repair marketplace with its Repair Check and corresponding Repair Study,* provides comprehensive information on the susceptibility to damage of selected smartphones and brands. Moreover, we present user-based findings on damage prevention, repurchase probability and the user behaviour of different age groups.
We hope you enjoy reading this study!
Contents and introduction 2
Repair Check 3
Damage facts 5
Damage & protection 7
Repair behaviour 9
Repurchase probability & 11users’ views
In the spotlight: 13Smartphone users
Further 15 WERTGARANTIE studies
Publisher 16
Marco BrandtDivision Manager Digital Business
* The basis of this study is a representative survey of 5,126 participants aged 18 years and over conducted in cooperation with Statista. The survey period was between 18 April - 14 May 2019. The results of the survey and the smartphones insured by WERTGARANTIE provided the data on which the Repair Check is based.

Apple
2.6
Sony
1.2
Huawei
1.8
Samsung
1.8
HTC
1.8
Sony
1.9
Huawei
1.9
Samsung
2.0
Apple
2.4
HTC
2.3
Repair Check:
The smartphone ranking
Sony comes top of the class in all the assessment criteria – the particular strength of their smartphones is the low need for repairs. The young smartphone manufacturer Huawei is neck and neck with the established manufacturer Samsung in the overall evaluation.
Apple’s very high repair costs pull the overall grade of the Repair Check down. Particularly the iPhone X stands out, taking last place in the repair cost rating and showing a very high repair frequency in the Repair Check for the month of October. The iPhone XR, on the other hand, proves to be especially robust and takes first place regarding repair frequency.
clickrepair’s Repair Check assesses the susceptibility to damage of various technical devices and the repair costs that have arisen in the case of damage. For this smartphone ranking, scores from 1.0 (best) to 4.0 (worst) are awarded monthly. This is based on the devices insured by WERTGARANTIE and a recent survey among more than 5,000 users aged 18 years and over. The ranking is updated each month, so the figures online always represent the latest ones.
1 2 4
Sony | 1.6Huawei | 1.8Samsung | 1.9
HTC | 2.1Apple | 2.5
3
Overall score of selected manufacturers
Sony in pole position
Repair costs of selected manufacturers
Sony absolute front runnerRepair frequency of selected manufacturers
HTC and Apple bring up the rear
With an overall score of 1.6, Sony leaves its competitors well behind – the average score of all manufacturers is 2.0. Bitter result: Apple has to settle for 2.5.
Also in this criterion, Sony is clearly a step ahead; for Apple models, by contrast, premium prices are charged.
Sony scores points again: their smartphones are particularly robust, while Apple and HTC prove to be significantly more susceptible to damage.
as per: 10/2019
smartphones from 2016 to 2018
Overall score on average:
Ø 2.0
4
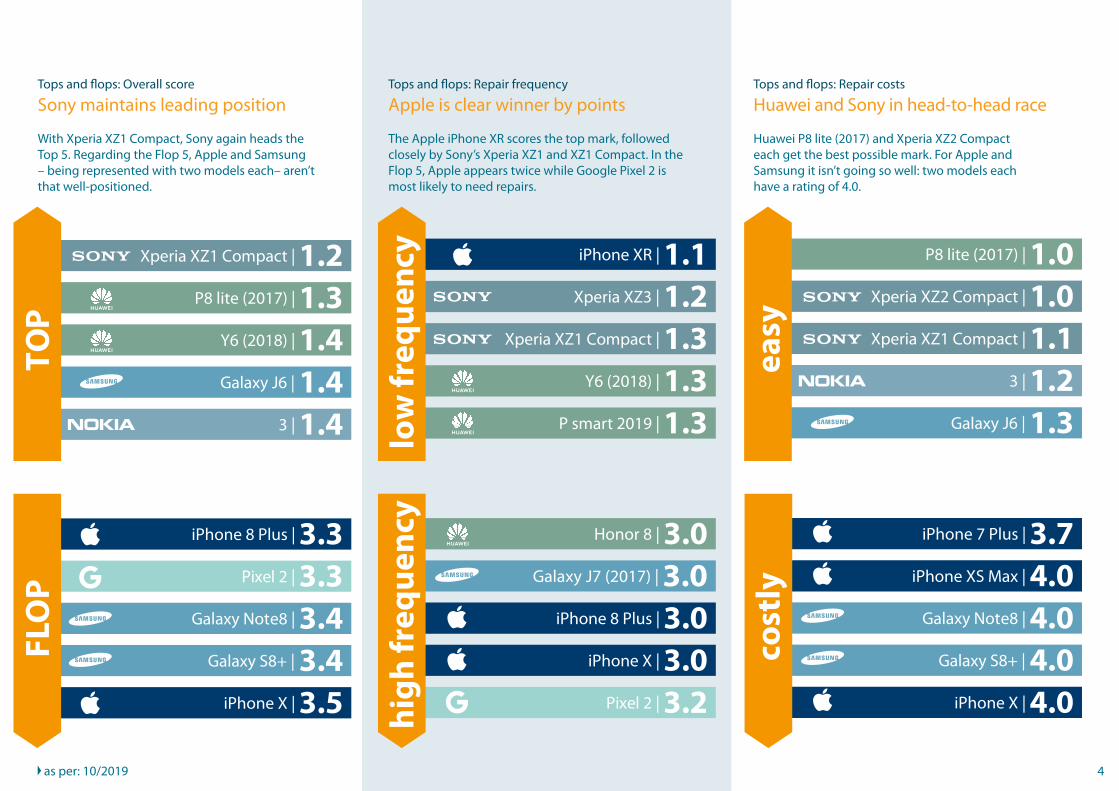
Tops and flops: Overall score
Sony maintains leading positionTops and flops: Repair frequency
Apple is clear winner by pointsTops and flops: Repair costs
Huawei and Sony in head-to-head race
With Xperia XZ1 Compact, Sony again heads the Top 5. Regarding the Flop 5, Apple and Samsung – being represented with two models each– aren’t that well-positioned.
The Apple iPhone XR scores the top mark, followed closely by Sony’s Xperia XZ1 and XZ1 Compact. In the Flop 5, Apple appears twice while Google Pixel 2 is most likely to need repairs.
Huawei P8 lite (2017) and Xperia XZ2 Compact each get the best possible mark. For Apple and Samsung it isn’t going so well: two models each have a rating of 4.0.
Xperia XZ1 Compact | 1.2P8 lite (2017) | 1.3
Galaxy J6 | 1.4
Y6 (2018) | 1.4
3 | 1.4
TOP
iPhone 8 Plus | 3.3Pixel 2 | 3.3
Galaxy S8+ | 3.4
Galaxy Note8 | 3.4
iPhone X | 3.5
FLO
P
Honor 8 | 3.0Galaxy J7 (2017) | 3.0
iPhone X | 3.0
iPhone 8 Plus | 3.0
Pixel 2 | 3.2hig
h fr
equ
ency
iPhone XR | 1.1Xperia XZ3 | 1.2
Y6 (2018) | 1.3
Xperia XZ1 Compact | 1.3
P smart 2019 | 1.3low
freq
uen
cy P8 lite (2017) | 1.0Xperia XZ2 Compact | 1.0
3 | 1.2
Xperia XZ1 Compact | 1.1
Galaxy J6 | 1.3
easy
iPhone 7 Plus | 3.7iPhone XS Max | 4.0
Galaxy S8+ | 4.0
Galaxy Note8 | 4.0
iPhone X | 4.0
cost
ly as per: 10/2019

Damage facts:
The most frequent causes of damage
If a smartphone has a defect, it is usually the display that is affected. This includes not only scratches and cracks but also technical failures. For almost 70 per cent of smartphone users, the display is thus the greatest weak point. Somewhat fewer, but still 50 per cent of all smartphones, have damage to the casing. The most robust parts, on the other hand, are the phones‘ built-in cameras, with a damage rate of 7.9 per cent.
The Samsung Galaxy S6 edge experiences drop damage at an above average frequency. When it comes to technical problems, another Samsung smartphone also takes the worst place: the Galaxy S3 mini exhibits a particularly high number of defects. Among all the technical defects, users complain most often of a weak battery, irrespective of the device.
31.9%
Galaxy S6 edge
23.8%
Galaxy S7 edge
23.7%
iPhone6
22.6%
Galaxy A3 (2016)
20.8%
iPhone5
Flop 5 for technical problemens
Samsung Galaxy S3 mini most affectedFlop 5 for fall damage
Samsung and Apple most at risk
The questionable honour of being among the 5 biggest flops for technical problems is also shared here by Samsung and Apple. The reason for the defect in all devices: a weak battery.
Users of the Galaxy S6 edge have drop damage in almost a third of devices, while with iPhone 6 users it is just under a quarter.
Ø
Galaxy S3 Mini
iPhone4s
Galaxy S5
Galaxy S4
Galaxy S4 Mini
40.7%33.8% 33.7% 33.7% 33.3%
Ø
Multiple answers possible
67.4%Display damage
50.0%Casing damage
33.9%Battery defect
16.1%Damage to ports and connections
7.9%Camera defect
5
Broken components in smartphones
Displays break most often
More than two thirds of all damaged smartphones have display damage. Damage to the casing is also found in one in two smartphones.
Smartphone models from 2010 onwards
6
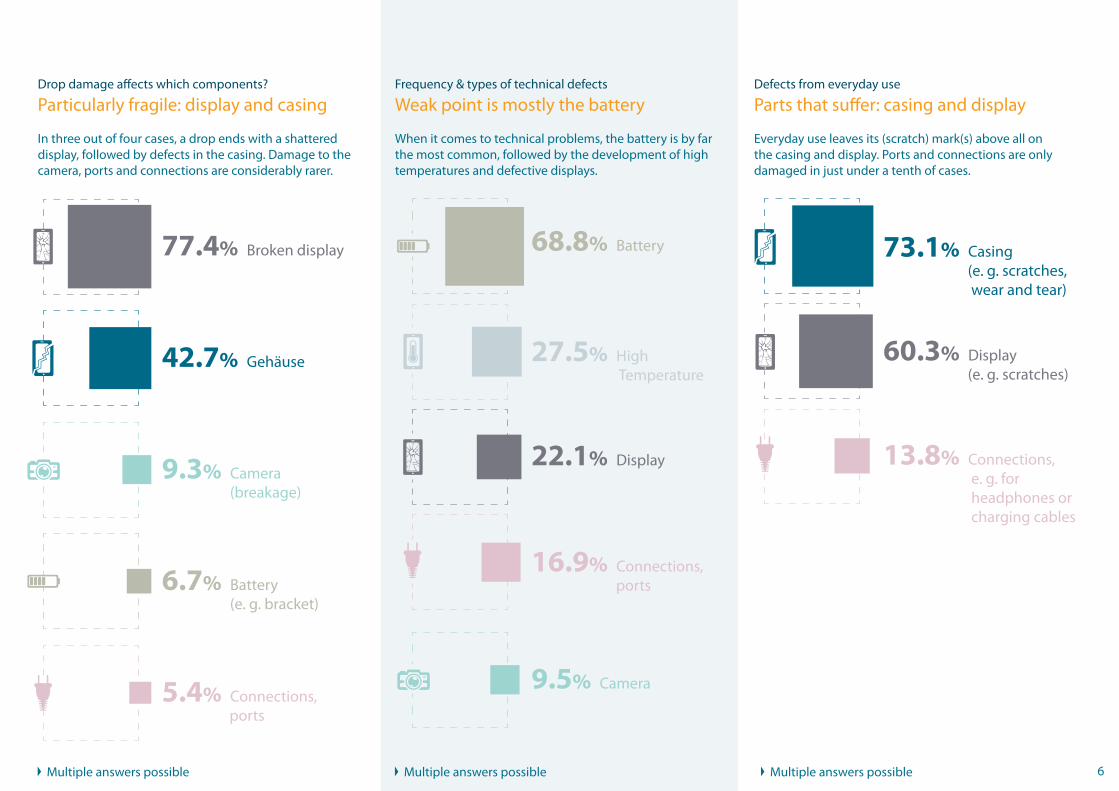
Drop damage affects which components?
Particularly fragile: display and casingFrequency & types of technical defects
Weak point is mostly the batteryDefects from everyday use
Parts that suffer: casing and display
In three out of four cases, a drop ends with a shattered display, followed by defects in the casing. Damage to the camera, ports and connections are considerably rarer.
When it comes to technical problems, the battery is by far the most common, followed by the development of high temperatures and defective displays.
Everyday use leaves its (scratch) mark(s) above all on the casing and display. Ports and connections are only damaged in just under a tenth of cases.
77.4% Broken display
42.7% Gehäuse
9.3% Camera (breakage)
6.7% Battery (e. g. bracket)
5.4% Connections, ports
68.8% Battery
16.9% Connections, ports
22.1% Display
9.5% Camera
27.5% High Temperature
73.1% Casing (e. g. scratches, wear and tear)
60.3% Display (e. g. scratches)
13.8% Connections, e. g. for headphones or charging cables
Multiple answers possible
Multiple answers possible
Multiple answers possible

Frequency of drop damage with and without protective measures*
Protective effect varies by manufacturer
With Xiaomi, drop damage is considerably less frequent with protective cases and screen protectors than without. With HTC, drop damage with and without protective measures is equally frequent.
* This analysis is based on all the smartphones of the individual manufacturers.
Damage & protection:
Comparison of protective measures
with
pro
tect
ive c
ase / screen protector
with
out p
rote
ctive case / screen protector
brand
20.2% 23.3%
14.5% 22.0%
13.3% 19.9%
13.2% 18.5%
11.1% 19.0%
10.5% 18.4%
9.1% 10.6%
6.3% 28.6%
Xiaomi
In this section we examine the damage frequency of smartphones with and without protective measures. Users who have either a screen protector or a protective case report less drop damage to their mobiles than users without any physical protection. The biggest difference is seen with the manufacturer Xiaomi. With users who had not taken any protective measures, drop damage occurred five times more frequently. With the manufacturers HTC and Nokia, there is hardly any difference in the proportion of drop damage between users with a screen protector or case and those without.
While with Nokia, only about 70 per cent of users choose a protective case and merely a third use a screen protector, with the manufacturer with the most frequently protected smartphones (Apple) more than half of all users make use of a screen protector. More than 86 per cent of iPhones are actually protected with a case. Also for the devices manufactured by Xiaomi, importance is particularly often placed on cases, at 82.1 per cent. Similar levels are seen among the smartphones of manufacturers Samsung (83.1%) and Huawei (83.7%). Screen protectors are actually used most frequently by Xiaomi users at 57.1 per cent.
7

Xiaomi
86.1%
50.8%
83.7%
49.1%
83.1%
40.6%
with screen protector
with protective case
82.1%
57.1%
80.2%
45.4%
76.8%
43.3%
70.1%
31.3%
78.3%
35.7%
Explanation:
86.1%
50.8%
Smartphones withscreen protector by brand
Smartphones withprotective case by brand brand
8
Protective measures according to brand
Nokia most often unprotected
The trend is towards protective cases, especially among Apple users. Screen protectors are commonly used with Xiaomi.

Repair behaviour:
The reasons for a repair
Apple users decide to get a repair in the case of damage more often than users of the competitors’ smartphones: one in five iPhones are repaired. Smartphones of the manufacturer Huawei are only repaired in 1 in 10 cases of damage. Striking is the stark difference between the desire to get a repair in the case of damage and the significantly lower number of smartphones that are actually repaired.
Across all manufacturers, the financial aspect is mentioned most often (49.1%), closely followed by ecological reasons (42.5%).
More than one in ten Apple and Huawei smartphone users state emotional attachment as a reason for repair – with Samsung this only applies to one in a hundred users.
Reasons for smartphone repair
Financial aspect as main motive
Almost half of all smartphone owners have had their device repaired for reasons of cost, but many also think of the environment in the process.
Apple
19.5%
HTC
15.1%
LG
12.8%
Samsung
12.7%
Sony
12.1%
Nokia
10.9%
Huawei
10.2%
all manufacturers
Smartphone models from 2010 onwards
100 %
would have their devicerepaired in the case of damage.
19.5% have had their devicerepaired in the case of damage.
49.1%
Repair is cheaper than new purchase
42.5%
Repair makes ecological sense
35.7%
Serves asspare telephone
9
Desire for repair
Apple users count on repairs
More than half of all Apple users would like to have their smartphone fixed, just under a fifth actually does get it fixed. Huawei owners are the least inclined to get a repair.
Explanation:

10
Reasons for repair by brand
Huawei users see savings potential
More than half of all Huawei owners refrain from making a new purchase for financial reasons. With Apple users, ecology also plays a big role.
Multiple answers possible Smartphone models from 2010 onwards
to be able to sell
cheaper than new purchase
other
36.2%39.3%33.7%
27.2%19.7%13.3%
42.9%37.7%41.3%
15.7%27.9%27.0%
11.8%1.6%
11.2%
47.2%42.6%52.6%
1.2%1.6%2.0%
emotional attachment
changing phones is complicated
spare telephone
makes ecological sense
Repurchase probability
and users’ views:
The loyalty of users
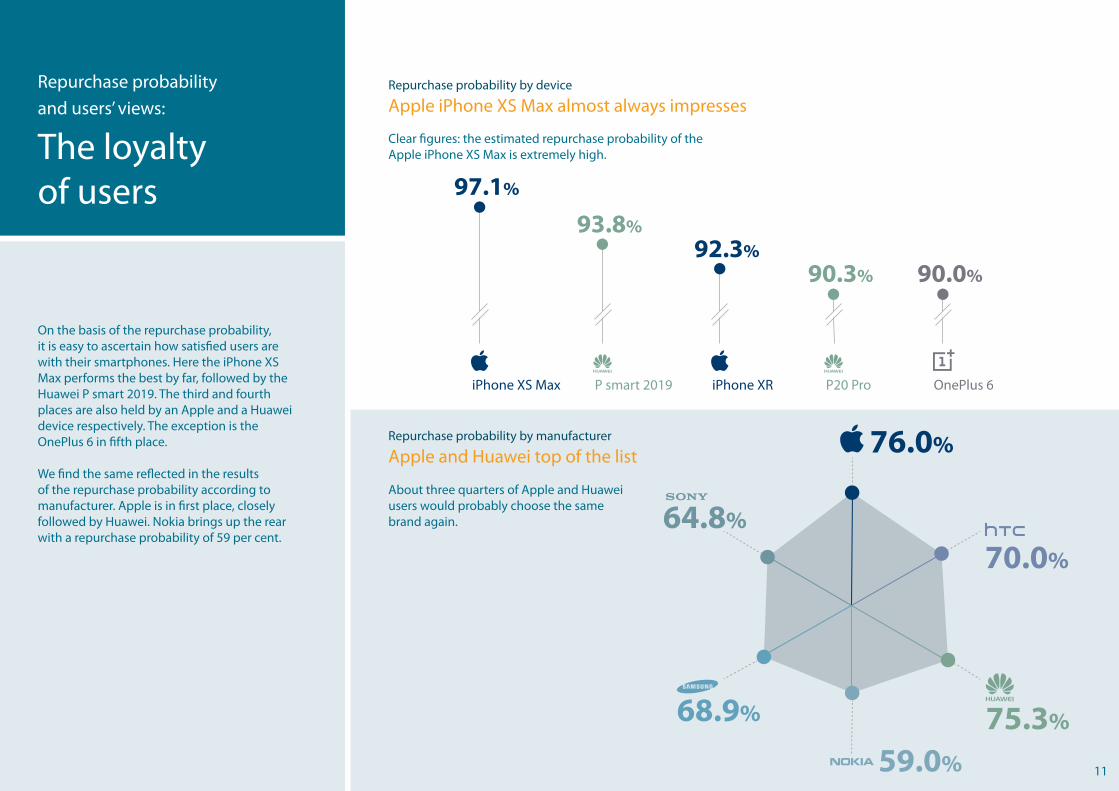
On the basis of the repurchase probability, it is easy to ascertain how satisfied users are with their smartphones. Here the iPhone XS Max performs the best by far, followed by the Huawei P smart 2019. The third and fourth places are also held by an Apple and a Huawei device respectively. The exception is the OnePlus 6 in fifth place.
We find the same reflected in the results of the repurchase probability according to manufacturer. Apple is in first place, closely followed by Huawei. Nokia brings up the rear with a repurchase probability of 59 per cent.
Repurchase probability by manufacturer
Apple and Huawei top of the list
About three quarters of Apple and Huawei users would probably choose the same brand again.
75.3%
76.0%
70.0%
59.0%
68.9%
64.8%
11
Repurchase probability by device
Apple iPhone XS Max almost always impresses
Clear figures: the estimated repurchase probability of the Apple iPhone XS Max is extremely high.
iPhone XS Max
97.1%
P smart 2019
93.8%
iPhone XR
92.3%
P20 Pro
90.3%
OnePlus 6
90.0%

12
69.7%
65.0%
67.5%
70.7%
67.3%
66.1%
Quality of workmanship by device
Apple of exceedingly high quality
Susceptibility to damage by device
OnePlus 6 particularly sturdy
Quality of workmanship by manufacturer
Apple closely followed by Huawei
Susceptibility to damage by manufacturer
Nokia at the top, Apple beaten
Apple users consider their devices to be of particularly high quality; the highest quality is almost unanimously ascribed to the iPhone XS Max.
The Top 5 smartphones perceived to be especially robust are not subject to any physical damage in eight out of ten cases.
The Apple brand is most frequently considered a guarantee of quality; Huawei is in second place when it comes to consumers’ favour.
Here Finland takes the first place: Nokia is considered to be decidedly durable. Sony and Apple merely lag behind in this case.
iPhone XS Max
98.5%
iPhone 8 Plus
91.1%
Galaxy Note 9
94.0%
iPhone XR
90.9%
iPhone XS
90.4%
80.1%
84.0%
78.7%
71.0%
76.0%
77.1%
82.5%
3
80.9%81.8%
Galaxy A8+(2018)
80.0%
XiaomiRedmi 4 (4X)
78.8%
OnePlus 6
Y6(2018)

In the spotlight:
The smartphone users
Looking at demographic aspects gives interesting insights into smartphone owners. These cover age, gender and place of residence.According to their age group, users choose a manufacturer that best covers their needs. Younger users have a distinct preference for Xiaomi, whereas older consumers currently prefer Nokia and LG.
Although almost all smartphone owners use protective measures, the number of protected devices is slightly higher among women. The opposite is true when it comes to repair orders: here it is men who are more likely to hand their mobile over to a repair shop in the case of damage.
Hamburg’s residents seem to handle their smartphones more carefully, since their devices have a damage frequency of 45 per cent, whereas the German state of Hesse displays the most cases of damage at 59 per cent.
up to29 years
30 - 39years
40 - 49years
50 - 59years
60 yearsand older
19.6% 26.8% 24.4% 18.1% 11.1%
19.3% 29.6% 20.6% 17.2% 13.3%
14.8% 19.4% 24.6% 23.5% 17.6%
13.3% 24.1% 17.8% 29.7% 15.0%
6.1% 19.4% 22.4% 29.9% 22.1%
11.2% 23.1% 24.1% 26.1% 15.5%
15.4% 24.7% 26.8% 21.1% 12.0%
28.6% 22.3% 13.4% 22.3% 13.4%
Xiaomi
13
Age-specific preferences
Xiaomi for younger and Nokia for older consumers
Almost a third of Xiaomi owners are under 30. Apple, HTC and Sony are in the middle, while older generations like to go for Nokia.
The darker the box, the more survey respondents in the stated age group own a smartphone of that brand.
100% 0%
14
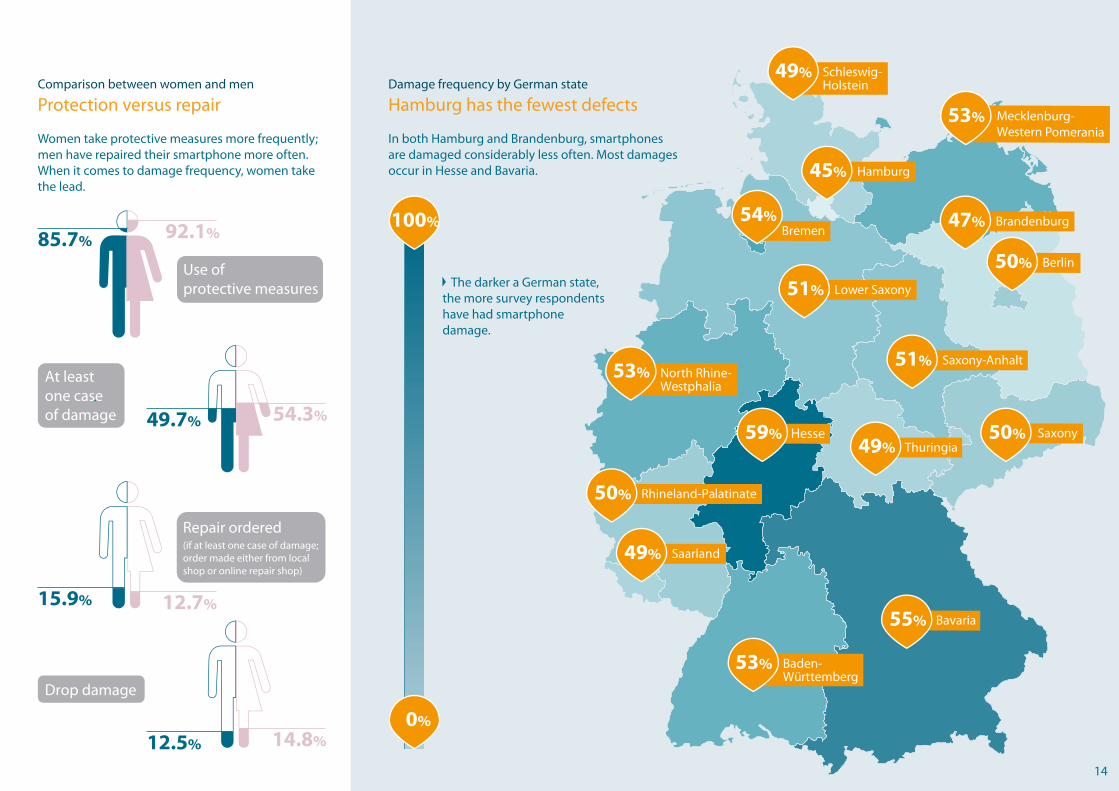
Comparison between women and men
Protection versus repairDamage frequency by German state
Hamburg has the fewest defects
Women take protective measures more frequently; men have repaired their smartphone more often. When it comes to damage frequency, women take the lead.
In both Hamburg and Brandenburg, smartphones are damaged considerably less often. Most damages occur in Hesse and Bavaria.
92.1%85.7%
Use of protective measures
54.3%49.7%
At least one case of damage
12.7%15.9%
14.8%12.5%
Drop damage
Repair ordered (if at least one case of damage; order made either from local shop or online repair shop)
The darker a German state, the more survey respondents have had smartphone damage.
100%
0%
55%
54%Bremen
53% Baden-Württemberg
50% Berlin
49% Schleswig-Holstein
49% Saarland
47% Brandenburg
45% Hamburg
Mecklenburg-Western Pomerania
53%
Lower Saxony51%
North Rhine-Westphalia
53%Saxony-Anhalt51%
Saxony50%Thuringia49%
59% Hesse
Rhineland-Palatinate50%
Bavaria
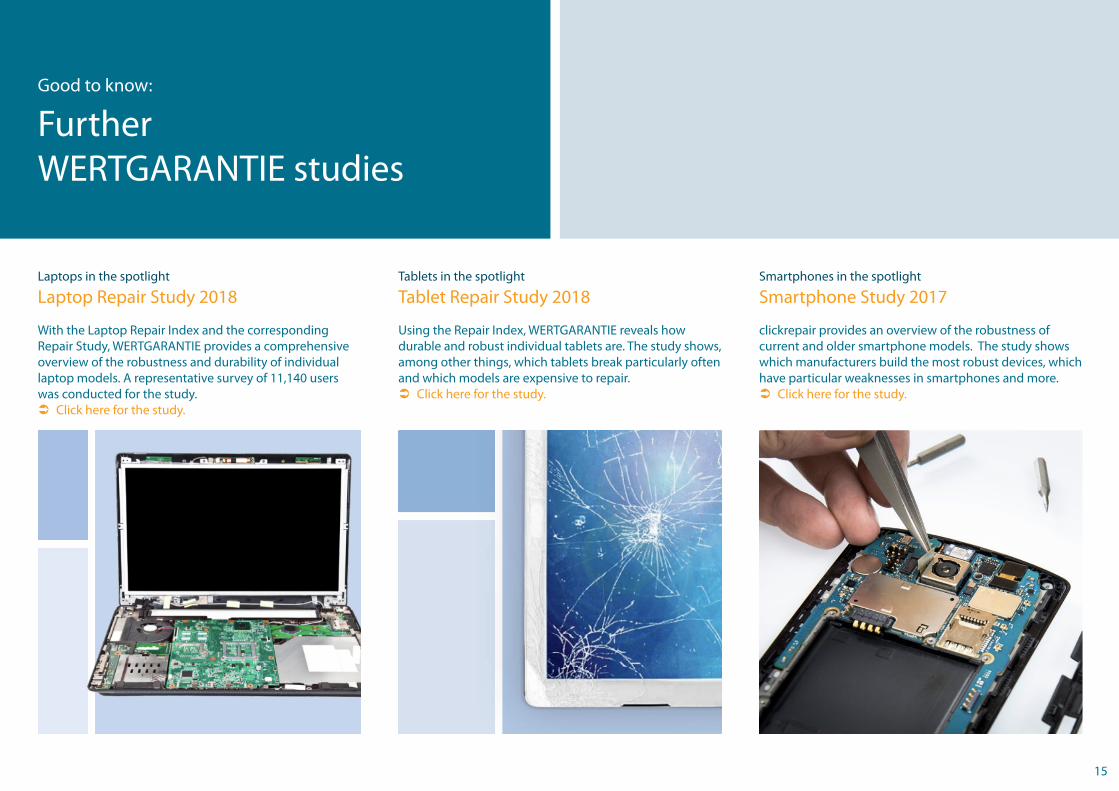
Tablets in the spotlight
Tablet Repair Study 2018Laptops in the spotlight
Laptop Repair Study 2018Smartphones in the spotlight
Smartphone Study 2017
Using the Repair Index, WERTGARANTIE reveals how durable and robust individual tablets are. The study shows, among other things, which tablets break particularly often and which models are expensive to repair. Click here for the study.
With the Laptop Repair Index and the corresponding Repair Study, WERTGARANTIE provides a comprehensive overview of the robustness and durability of individual laptop models. A representative survey of 11,140 users was conducted for the study. Click here for the study.
clickrepair provides an overview of the robustness of current and older smartphone models. The study shows which manufacturers build the most robust devices, which have particular weaknesses in smartphones and more. Click here for the study.
15
Good to know:
Further WERTGARANTIE studies

In cooperation with
Publisher
WERTGARANTIE Beteiligungen GmbH
Breite Straße 6 30159 HannoverGermany
Photo credits: WERTGARANTIE
Infographics: HCG corporate designs
Contact
Gina Schneider Public Relations & Marketing Manager
+49 511 71280-648 [email protected]
Mathias Thiemann Repair Studies Project Manager
+49 511 71280-651 [email protected]
This study provides just a selection of the results that were collected and analyzed. Do not hesitate to get in touch with us if you would like to have more detailed information!