SmartMarket Report - Autodesk | 3D Design, Engineering
72
SmartMarket Report The Business Value of BIM in North America Multi-Year Trend Analysis and User Ratings (2007–2012) Contributing Partners Premier Corporate Partner Corporate Partner
Transcript of SmartMarket Report - Autodesk | 3D Design, Engineering
SmartMarket Report
The Business Value of BIM in North AmericaMulti-Year Trend Analysis and User Ratings (2007–2012)
Contributing PartnersPremier Corporate Partner
Corporate Partner
■ Design and Construction Intelligence
SmartMarket Report
McGraw-Hill Construction
PresidentKeith Fox
Vice President, Product DevelopmentKathryn E. Cassino
McGraw-Hill Construction Research & Analytics/ Industry Insights & Alliances
Vice President, Industry Insights & Alliances Harvey M. Bernstein, F.ASCE, LEED AP
Senior Director, Research & AnalyticsBurleigh Morton
Director, Green Content & Research CommunicationsMichele A. Russo, LEED AP
Reproduction or dissemination of any information contained herein is granted only by contract or prior written permission from McGraw-Hill Construction.
Copyright © 2012, McGraw-Hill Construction, ALL RIGHTS RESERVED
The Business Value of BIM in North America: Multi-Year Trend Analysis and User Ratings (2007–2012) SmartMarket Report
Executive EditorHarvey M. Bernstein, F.ASCE, LEED AP
Editorial Advisor and Contributor—BIMStephen A. Jones
Editorial DirectorMichele A. Russo, LEED AP
Managing EditorDonna Laquidara-Carr, LEED AP
Director, Design & ProductionWilliam Taylor
Manager, Content OperationsJuan Ramos
Art DirectorsAlison LorenzJonathan Winn
Contributing Art DirectorAD-BOUTIQUE, INC.Hisako Fujishima
EditorEnver Fitch, LEED Green Associate
ContributorBruce Buckley
Research Project ManagerDana Gilmore, MRA, PRC
For further information on this SmartMarket Report or for any in the series, please contact:
McGraw-Hill Construction Research & Analytics 34 Crosby Drive, Suite 201 Bedford, MA 01730
1-800-591-4462
■ Design and Construction Intelligence
SmartMarket Report
About McGraw-Hill ConstructionMcGraw-Hill Construction (MHC), part of McGraw-Hill, connects people, projects and products across the design and construction industry, serving owners, architects, engineers, general contractors, subcontractors, building product manufacturers, suppliers, dealers, distributors, and adjacent markets.
A reliable and trusted source for more than a century, MHC has remained North America’s leading provider of construction project and product information, plans and specifications, industry news, market research, and industry trends and forecasts. In recent years, MHC has emerged as an industry leader in the critical areas of sustainability and interoperability as well.
In print, online, and through events, MHC offers a variety of tools, applications, and resources that embed in the workflow of our customers, providing them with the information and intelligence they need to be more productive, successful, and competitive.
Backed by the power of Dodge, Sweets, Architectural Record, Engineering News-Record (ENR), GreenSource and SNAP, McGraw-Hill Construction serves more than one million customers within the global construction community. To learn more, visit us at www.construction.com.

Introduction
Th
e B
us
ine
ss
Va
lue
of
BiM
in n
or
Th
aM
er
ica
: Mu
lTi-
Ye
ar
Tr
en
d a
na
lYs
is a
nd
us
er
ra
Tin
gs
(20
07–2
012)
SmartMarket report
McGraw-HillConstruction 1 www.construction.com SmartMarket Report
In 2007, because of the devoted fol-lowing building information modeling (BiM) had gained in a relatively short time, Mcgraw-hill construction pre-
dicted that BiM would reach a tipping point in north america in 2008, even though industry-wide adoption at the time was only 28%. Now, in 2012, 71% of architects, engineers, contractors and owners report they have become engaged with BIM on their projects, a 75% growth surge over five years.
in 2009, seeing the dramatic adop-tion underway by contractors, especially among trades leveraging BiM for virtual coordination and prefabrication, Mcgraw-hill construction predicted that 2010 would be “The Year of the contractor” in BiM. Trailing architects at the time (49% compared to 58% for architects), contrac-tors now lead all firm types with a 74% adoption rate, four percentage points ahead of architects.
engineers, who had seemed the least convinced of BiM’s value in 2009, with only one-in-four involved, still struggle with issues of content and technical analysis. however, they have closed the adoption gap significantly, with 67% now reporting participation, especially among mechanical, electrical, plumbing and structural disciplines.
all of this points to one thing: BIM, an innovative approach to design and construction for pioneering early adopters
just a few years ago, is now taking its place firmly in the mainstream of the North American construction industry. and it is maturing, much like other major technol-ogy-oriented processes. Today, BiM has emerging standards and best practices, growing attention from professional orga-nizations and an increasingly skilled user base incorporating its functionality into daily workflows. BiM also helps drive inno-vation by expanding its use to new tasks and integrating its rich data with many other vital technology tools.
in addition to updating our previous research on BiM adoption, implementation and value in north america, Mcgraw-hill construction has for the first time:
■■ Included user ratings on over fifty BIM activities and processes.
■■ Developed four indexes (Engagement, Frequency, Value and Difficulty) that will provide a baseline of the current status of BIM in greater detail, help track its future growth, and better isolate and under-stand the unique dynamics of individual BIM users, activities and processes.
We want to acknowledge the support of our sponsors who enabled Mcgraw-hill construction to conduct this research and make it available to the global construction industry.
Stephen A. Jones leads McGraw-Hill Construction’s (MHC) initiatives in BIM and integrated project delivery, as well as developing alliance relationships for technology and content. Active in numerous industry organizations, he frequently speaks at events around the world about the business impact of emerging technologies and trends. Before joining MHC, Jones was a vice president with Primavera Systems (now Oracle), a leading provider of project management software. Prior to that, he spent 19 years in creative, marketing
and management roles with design firms, most recently as a Principal and Board of Directors member with Burt Hill (now Stantec), a large, global architectural and engineering firm. Jones holds an M.B.A. from Wharton and a B.A. from Johns Hopkins.
Harvey M. Bernstein, F.ASCE, LEED AP has been a leader in the engineering and construction industry for over 30 years. Currently, he has lead responsibilities for MHC’s market research group, including MHC’s
thought leadership initiatives in areas such as green building, BIM, innovation and global construction markets. Bernstein was one of the team members involved in launching MHC’s GreenSource magazine. Previously, Bernstein served as President and CEO of the Civil Engineering Research Foundation. He has written numerous papers covering innovation and sustainability and currently serves as a member of the Princeton University Civil and Environmental Engineering Advisory
Council and as co-chair of the National Building Museum’s Industry Council for the Built Environment. He is a visiting professor with the University of Reading’s School of Construction Management and Engineering in England, where he also serves on their Innovative Construction Research Centre Advisory Board. Bernstein has an M.B.A. from Loyola College, an M.S. in engineering from Princeton University and a B.S. in civil engineering from the New Jersey Institute of Technology.
Harvey M. BernsteinF.ASCE, LEED APVice PresidentIndustry Insights & AlliancesMcGraw-Hill Construction
Stephen A. JonesSenior DirectorMcGraw-Hill Construction

04Executive Summary 04 Executive Summary
06 Recommendations
07Data Section: BIM Adoption and Value 08 TheBIMEngagementIndex
09 BIMAdoptionandValue:Adoption 09 BIM Adoption
11 Importance of BIM Capability for Project Team Selection
12 BIM Implementation Levels
14 BIM Expertise Level
14 Years of Experience Using BIM
16 sidebar MetricsMeasuretheValueGainedfromBIM
18 BIMAdoptionandValue:Benefits 18 Short- and Long-Term BIM Benefits
20 Top Business Benefits by Player
22 Factors That Impact BIM Benefits
24 BIMAdoptionandValue:ROI 24 Perceived ROI for BIM
26 Elements That Would Improve ROI for BIM Users
27 Formal Measurement of ROI
31 BIMAdoptionandValue:Investments
37 BIMAdoptionandValue:Non-Users 37 Level of Interest in BIM by Non-Users
38 Reasons for Not Adopting BIM
39 AEC Perception: Competitor and Client Use of BIM
40 Top BIM Benefits That Would Convince Non-Users to Consider Adopting BIM
41 Data Section: User Ratings for Design and Construction 42 UserRatings:Design 42 Base Building Design Activities
43 Interior Planning and Construction Activities
44 Technical Analysis Activities
46 sidebar BIMStandardsEvolvewithGreaterBIMUse
table of
contents
SmartMarketReportThEBUSINESSVAlUEOfBIMINNORThAMERIcA:MUlTI-YEARTRENDANAlYSISANDUSERRATINGS(2007–2012)
SmartMarket Report McGraw-Hill Construction 2 www.construction.com
Front cover BIM: Image courtesy of HOK, PLP Architecture, AKT II, and Arup; Front cover screen: Image courtesy Photography © Kiyoshi Togashi; Top: Image courtesy of Suffolk Construction Company; Right: Image courtesy of JE Dunn Construction Company and SmithGroupJJR
cO
NT
EN
TS
48 UserRatings:construction 48 Team Preconstruction Activites
49 Contractor Activities
50 Model-Driven Fabrication
51 Digital Construction at the Job Site
52 sidebar ModularizationontheRise
55 UserRatings:Processes 55 BIM Team Use of Integrated Project Delivery
55 Authoring Models
56 Model Sharing Processes between Architects, Engineers, Contractors and Owners
57 How Model Files Are Shared
62 Rating Specific Aspects of Models Created by Others
63 Use of BIM-Generated Visualization for Specific Processes
63 Using BIM for Project Close-Out Processes
64 Operations and Maintenance/Facilities Management Staff Involvement with Design
64 Use of Models for Operations and Maintenance and Facilities Management Processes
65 sidebar VoiceoftheIndustry:BIMUsersforecastItsImpactOvertheNextTenYears
Case Studies 28 AvertingProblemsonacomplexProject:Pantex HEPF, Amarillo, Texas
34 IntegratedDesignhelpsDeliverProject:Sutter Medical Center Castro Valley, Castro Valley, California
58 GuaranteedEnergyPerformanceThroughModelingandcoordination:Energy Systems Integration Facility, National Renewable Energy Laboratory, Golden, Colorado
60ProductivityandGreenImprovementsThroughBIM:Terminal Renewal and Improvement Program, DFW International Airport, Fort Worth, Texas
66 UsingBIMinPost-constructionfacilityManagement:Albert Sherman Center, University of Massachu-setts Medical Center, Worcester, Massachusetts
Thought Leader Perspectives 15 Patrick MacLeamy, HOK and buildingSMART International
30 Phillip G. Bernstein, Autodesk, Inc.
36 John Cross, American Institute of Steel Construction
45 Charles Eastman, Digital Building Laboratory, Georgia Institute of Technology
54 Dana Kennish “Deke” Smith, Building Seismic Safety Council and buildingSMART alliance, National Insti-tute of Building Sciences
68Methodology
69Resources
McGraw-Hill Construction 3 www.construction.com SmartMarket Report
Front Cover:The Francis Crick Institute
This page:Left: Albert Sherman Center, University of Massachusetts Medical School
Below: NREL

Th
e B
us
ine
ss
Va
lue
of
BiM
in n
or
Th
aM
er
ica
: Mu
lTi-
Ye
ar
Tr
en
d a
na
lYs
is a
nd
us
er
ra
Tin
gs
(20
07–2
012) Overall BIM adoption and implementation levels have increased
significantly, with the more deeply engaged users enjoying greater benefits and stepping up their plans for future investments.
BIM Adoption
BIM Users Industry-wide adoption of BIM surged from 28% in 2007 to 71% in 2012. contractors (74%) have surpassed archi-tects (70%) and engineers (67%) are close to parity with the two other groups.
regional differences also narrowed, and though the Western u.s. still leads at 77%, the formerly lagging northeastern u.s. jumped from 38% in 2009 to 66% in 2012. other u.s. regions and canada remain close to the growing national average.
size matters in BiM adoption: About 90% of large and medium-to-large organizations are engaged with BIM, compared to less than half (49%) of small ones.
BIM NoN-Usersalthough there are fewer non-users, more of them are hardening their resistance, especially among non-using architects where 38% say they will not use BiM.
Growth in Implementation and Expertiseall BiM users report that more of their projects involve BiM, and they are forecasting even greater implemen-tation of it over the next two years: 58% of current users plan to deploy BIM on most of their projects by 2014, more than doubling the 2009 level.
BIM expertise increased from 2009 to 2012, with the ranks of advanced and expert users growing 33% and 20% respectively. The 41% drop in beginners is likely a combination of economic constraints on hiring new users and recent adopters developing skills more quickly.
There are also more highly experienced BiM users in the industry: Half (49%) of 2012 BIM users have five or more years’ experience, twice the proportion of 2009.
BIM Benefits, ROI and Investments
BeNefItsThe following BiM benefits that grew most between 2009 and 2012 are ones that take longer to validate as credible and repeatable, indicating a greater maturity of BiM as a
Executive Summary
Commitment to BIM in North America Surgesfrom 2007 to 2012 despite the Challenging Economy
SmartMarket Report McGraw-Hill Construction 4 www.construction.com
driver of sustainable business benefits: ■■ Increased profits increased more than any other BIM benefit.
■■ Maintaining repeat business with past clients, which requires completed projects, outpaced marketing new business to new clients, a benefit that can be done right after adopting.
■■ The most engaged users enjoyed far larger increases in BIM benefits.
roIAlmost two thirds (62%) of all BIM users’ perceive positive ROI, although not evenly across firm types or BiM engagement levels (a weighted metric of implementation, skill and experience levels developed for this SmartMarket Report).
■■ 74% of the contractors report a positive ROI compared to only 37% of engineers.
■■ ROI correlates strongly with BIM engagement level, rewarding companies with higher skill, experience and implementation levels.
BIM INvestMeNtsusers are favoring BiM investments that improve collab-orative processes over ones in technology, especially among contractors, aligning well with their increasingly integrated role on BiM projects.
highly engaged firms are most committed to BiM investments, demonstrating that despite their already significant levels of skill, experience and implementation, they see more value available.
Source: McGraw-Hill Construction, 2012
Levels of BIM Adoption in North America
28%
2007
49%
2009
71%
2012

Th
e B
us
ine
ss
Va
lue
of
BiM
in n
or
Th
aM
er
ica
: Mu
lTi-
Ye
ar
Tr
en
d a
na
lYs
is a
nd
us
er
ra
Tin
gs
(20
07–2
012)
Executive Summary continued
McGraw-Hill Construction 5 www.construction.com SmartMarket Report
User Ratings of BIM Activities and Processesin the 2012 research, BiM users rated the frequency, value and difficulty of over 50 BiM activities and processes. By applying weighted indexes to each parameter, the resulting indexes reveal where users are finding the greatest value and challenges with BiM. The activities were grouped into three areas: design, construction and Processes. Below are key findings from those areas.
DesIgN Design is the longest-standing application of BIM. There-fore, users report relatively high frequency and value with low difficulty for design-related BIM activities. The exception are its use for some emerging areas of technical analysis, especially related to engineered systems.
■■ Modeling the building envelope by architects is the most frequently used BIM design activity and has a very high value index with only moderate difficulty.
■■ Analyzing mechanical system performance by mechan-ical engineers rates as the most difficult design activity, with a resulting low frequency.
■■ Structural analysis rates among the most difficult activities, but also has very high frequency and value indexes, indicating a critical need for the industry to address ways to make it easier.
CoNstrUCtIoN construction-related activities are more recent applica-tions of BiM. Therefore, in general they are less mature.
■■ Spatial coordination tops value and frequency ratings for preconstruction activities, benefiting all members of the project team.
■■ Constructability analysis and job site planning/logis-tics are contractors’ top uses, demonstrating their innovation in applying BIM.
■■ All users report struggling with 4D and 5D.
ProCessesBiM processes are the ways companies and teams lever-age BiM to bring value to projects, including collaborative modeling and model-sharing, integrated Project deliv-ery, BiM-generated visualization to expedite review and approval cycles, and using BiM for close-out and facilities management processes.
■■ The highest level of model-sharing activity is taking place among contractors and fabricators, further indi-cating the growing BIM leadership from this sector.
■■ Most owners, architects and engineers give good ratings to accuracy, completeness and quality of models they receive from others. contractors are less positive.
BIM ROI for Users by Level of EngagementSource: McGraw-Hill Construction, 2012
Negative or Break-EvenModerately Positive (Up to 25%)
Very Positive (Over 25%)
64%
33%
20%
37% 36%27%
6%
37%
67%
All BIM Users Very High Engagement Low Engagement

Th
e B
us
ine
ss
Va
lue
of
BiM
in n
or
Th
aM
er
ica
: Mu
lTi-
Ye
ar
Tr
en
d a
na
lYs
is a
nd
us
er
ra
Tin
gs
(20
07–2
012)
BIM Maturityas a technology matures, its adoption reaches a plateau. The research shows this is happening with BiM, especially among architects, its oldest user segment, where 38% of current non-users state they intend never to use BiM. We believe adoption will stabilize at about 90% of the north american market, with the remainder seeing BiM as not relevant to their role, specialty or project type.
BIM-Engaged Contractors Poised for Industry Leadershipcontractors lead adoption and roi, show high levels of BiM engagement, invest the most in training and actively share models. They are also innovating construction-related applications of modeling far beyond design representation. We believe this trend will continue, and, with the rise of integrated project delivery models and the aggregation of multiple skill sets in larger organizations, contractors that are highly engaged with BiM could rise to the central leadership role on major projects in our industry.
Recommendations
Conclusions and Recommendations
SmartMarket Report McGraw-Hill Construction 6 www.construction.com
Recommendations
Architects ■■ Embrace the Level of Development initiative and project contracting methods that define consistent inter-party deliverables and protect their liability. This will enable them to more fully engage and respond to the industry need for increased model sharing, something architects do least frequently today.
■■ Focus on longer term benefits that are increasingly being validated, such as productivity and repeat business. This will help architects improve roi, which is a benefit this research indicates architects do not receive at the same level in the short term compared to contractors.
engineers■■ Drive deeper engagement in BIM, which correlates directly with better ROI. This will help engineers close the gap in roi benefits that architects and contractors are enjoying.
■■ Demand content from manufacturers that is more searchable and able to be indexed. This will help engineers improve their productivity and reduce investment costs.
■■ Support and expand use of BIM for technical analysis. engineers rate using BiM for these activities to be highly valuable, but it is difficult, which is contributing to low use of BiM for this analysis by engineers today. however, as more routine analysis continues to be automated, these skills are critical for engineers to maintain relevance.
contrActors■■ Increase awareness among non-users, one-in-five of whom still do not understand BIM.
■■ Deepen engagement with BIM. contractors have slightly higher adoption of BiM, but only half the engagement level of architects.
owners ■■ Prepare a BIM execution plan with the project team. Templates are readily available online and will provide critical guidance for a successful BIM project.
■■ More actively involve facilities management staff in BIM design and drive the BIM deliverable for turnover.
technology Providers
■■ Examine the user ratings of Frequency/Value/Difficulty for BIM processes and activities to guide future development activities, especially where users rate high value, yet show low frequency because of difficulty, such as: • Contractors: Using
BIM for labor and cost estimating, and integration of BIM with project management, cost management and accounting applications
• Engineers: Conducting certain technical analyses
• Architects: Leveraging BIM for sustainable design.
non-users■■ Use the research findings to set appropriate expectations for getting started with BIM.
■■ Look to BIM users at higher levels to help establish goals for the path forward.

Section Hed1Data:
McGraw-HillConstruction 7 www.construction.com� SmartMarket Report
Section Hed1Data:T
he
�Bu
sin
es
s�V
alu
e�o
f�B
iM�in
�no
rT
h�a
Me
ric
a:�M
ulT
i-Y
ea
r�T
re
nd
�an
alY
sis
�an
d�u
se
r�r
aT
ing
s�(
2007
–201
2)��d
ata
IntroductiontoBIMAdoptionandValueDataSections
New�technologies�gain�traction�when�their�benefits�are�meaningful�and�sustainable�for�users.�This�is�especially�true�with�business�solutions,�which�usually�require�process�
change,�often�involving�multiple�value�chain�members.in�2007�Mcgraw-hill�construction�identified�Building�
information�Modeling�(BiM)�as�a�potentially�transformational�approach�to�design�and�construction,�requiring�technology�adoption�and�implementation,�as�well�as�encouraging�substantial�changes�to�the�project�delivery�process.�although�the�adoption�rate�was�relatively�low�(28%),�all�users�planned�to�increase�their�level�of�implementation.�This�led�us�to�predict�BiM�would�reach�its�tipping�point�in�2008;�not�that�all�projects�would�be�modeled,�but�that�we�were�not�going�back.�BiM�was�here�to�stay.
since�that�time�we�have�been�tracking�the�global�progress�of�BiM�through�research,�with�a�particular�focus�on�the�business�value�of�its�benefits�and�the�reasons�for�resistance�among�non-users.�in�2009�we�published�the�The Business Value of BIM: Getting Building Information Modeling to the Bottom Line SmartMarket Report,�the�first�comprehensive�study�of�BiM�in�north�america.�it�showed�adoption�had�grown�to�49%�and�provided�detailed�analysis�of�a�number�of�important�trends,�including:
■■ the degree to which various company types were receiving specific business benefits from BIM
■■ Which project and business factors influenced the value of BIM■■ How broadly users were implementing BIM, what investments they were making in their BIM programs and their predictions for future expansion of both
■■ Non-users’ perceptions of BIM activity by others in their markets, their reasons for resisting and what they needed to drive serious consideration of adoption
subsequent�SmartMarket Reports�examined�the�use�of�BiM�for�sustainable�design�and�construction�(Green BIM,�2010);�its�adoption,�implementation�and�value�overseas�(BIM in Europe�in�2010,�BIM in Korea�in�2012);�and�segment-specific�usage�(BIM for Infrastructure,�2012).�
This�study,�The Business Value of BIM in North America: Multi-Year Trend Analysis and User Ratings:�
■■ Updates the research on adoption, implementation, business drivers and non-user attitudes from the 2009 study, and looks ahead with two-year forecasts.
■■ Provides new data on user ratings of BIM activities and processes, giving a first-hand view of the challenges and successes users are experiencing with day-to-day use of BIM in their organizations.
BIM Adoption and ValueData:
KeyFindingsintheBIMAdoptionandValueDataSection
Adoption And implementAtion■■ Industry adoption has surged from 28% in 2007, 49% in 2009 and 71% in 2012.
■■ Contractors’ BIM adoption rate of 74% surpasses the formerly dominant architects who are now at 70%.
■■ 91% of large companies are engaged with BIM versus only 49% of small organizations.
Benefits■■ Increased profits was the BIM benefit that increased most in value to users from 2009 to 2012.
■■ Leveraging BIM for business development shifted as a top benefit in 2012 and maintain-ing repeat business became more critical than pursuing new clients.
■■ Improved interoperability and functionality of BIM software are the top two BIM improve-ments all users believe would improve their BIM value, both in 2009 and 2012.
Roi■■ 62% of BIM users perceive positive ROI in 2012.■■ ROI correlates strongly with BIM engagement level, rewarding companies with higher skill, experience and implementation levels.
■■ Improved productivity ranks as the top metric users believe would improve their BIM ROI.
investments■■ developing collaborative BIM processes is predicted to be the most important area of BIM investment in 2014.
■■ Communications infrastructure to improve model sharing is an important emerging need for 2014 investment.
non-useRs■■ although non-users dropped from 51% of the industry in 2009 to only 29% in 2012, more of them are hardening their resistance, espe-cially among non-using architects where 38% say they will not use BIM.

SmartMarket Report McGraw-Hill Construction 8 www.construction.com
Th
e B
us
ine
ss
Va
lue
of
BiM
in n
or
Th
aM
er
ica
: Mu
lTi-
Ye
ar
Tr
en
d a
na
lYs
is a
nd
us
er
ra
Tin
gs
(20
07–2
012)
da
ta each user is engaged with BiM in a unique way. The BiM engagement index quantifies that with a numerical score for each respondent. The score is derived from the fol-lowing data:
■■ Experience: the number of years the respondent has been using BIM
■■ Expertise: the level each respondent selected as best representing their personal skill with BIM
■■ Implementation: the percentage of projects being done in BIM by the respondent’s firm.
These responses are weighted to reflect the increasing influence of more experience, skill or implementation. for more information on the weighting used for each category, please see the table at top right.
The range of resulting BiM engagement index scores (from 1 to 27 points) is divided into four tiers that reflect increasing levels of BiM engagement (“e-level”). see the table at the bottom of the page for a description of the four tiers.
■■ the very high E-Level users are those at the top of all three categories (over 5 years’ experience, expert skill level and over 60% BIM implementation). they repre-sent 13% of all respondents.
■■ the remaining BIM Engagement Index scores are divided evenly to create the three other E-Levels.
How BIM Engagement is Used to Analyze Data in this Reportin addition to presenting the data by firm type, responses are also frequently filtered by very high and low e-lev-els, providing valuable perspectives from highly engaged BiM users and those still in early stages of engagement.
■■ the current attitudes and behavior of very high E-Level users often indicate the BIM trends that the rest of the industry will be following in the near future.
■■ the experiences of low E-Level users represent reasonable expectations for non-users who choose to adopt BIM.
The BIM Engagement Index
BIM Adoption and Value: Adoption continued
Beginner
Moderate
Advanced
Expert
1 point
3 points
6 points
10 points
1 point
3 points
5 points
8 points
Light(Under 15%)
Very Heavy(Over 60%)
Moderate(15% to 30%)
Heavy(31% to 60%)
1 year
2 years
3 years
4 years
5 years
Over 5 years
5 points
9 points
1 point
2 points
3 points
4 points
Experience Expertise Implementation
Source: McGraw-Hill Construction, 2012
Points Used to Calculate Engagement Index
Tiers of BIM Engagement(E-Level)
Range of Scoresfor EachE-Level
Low
Medium
High
Very High
3 to 10
11 to 18
19 to 26
27
31%
32%
24%
13%
Percent of AllRespondents inEach E-Level
Source: McGraw-Hill Construction, 2012
Classi cation of Firmsinto Engagement Levels

Th
e B
us
ine
ss
Va
lue
of
BiM
in n
or
Th
aM
er
ica
: Mu
lTi-
Ye
ar
Tr
en
d a
na
lYs
is a
nd
us
er
ra
Tin
gs
(20
07–2
012)
da
ta The results of Mcgraw-hill construction research on BiM from 2007, 2009 and 2012 clearly show the dramatic expansion of BiM adoption in north america over that period.
■■ adoption between 2007 and 2009 expanded by 75%.■■ despite the severe economic downturn between 2009 and 2012, the number of firms reporting engagement with BIM grew by 45%.
This trend tangibly demonstrates the powerful value proposition of BiM to a broad range of companies across the construction industry. counteracting the instinct to cut back during a recession, a quarter of the indus-try invested in a more efficient and productive future by embracing the technologies and processes of BiM.
Variation by RegionThe differences between major regions found in 2009 research have lessened dramatically in 2012.
■■ the West still leads led all regions with an overall BIM adoption rate of 77%, up from 56% in 2009 and well above the national average.
■■ 2009 Northeast regional adoption (38%) was signifi-cantly lower than the national average of 49%. though still lagging in 2012, at 66%, the region grew the most from 2009 to 2012.
■■ the Midwest and South are still slightly above and slightly below average respectively, and Canada remains essentially at average.
The range between the highest and lowest adopting regions dropped from a gap of eighteen percentage points in 2009 to only a differential of eleven in 2012, and it is likely to continue to reduce in the future. however, this difference may be affected by regional dynamics of economic recovery. overall, this narrowing demon-strates that BiM adoption is becoming more widespread industry-wide.
Much of the growth across regions is likely spurred by the relatively large amount of health care work going on nationally, a project type particularly well suited to BiM because of its benefits of collaboration; spatial coor-dination; mechanical, electrical and plumbing (MeP) prefabrication; constructability review; and visualization that more effectively engage a wide variety of stakehold-ers. (for an example, refer to the case study on sutter Medical center on page 34).
BIM Adoption and Value: Adoption continued
McGraw-Hill Construction 9 www.construction.com SmartMarket Report
BIM Adoption
Source: McGraw-Hill Construction, 2012
Levels of BIM Adoption in North America
28%
2007
49%
2009
71%
2012
Source: McGraw-Hill Construction, 2012
BIM Use in North America
Canada:
2012 72%2009 49%
West:
2012 77%2009 56%
South:
2012 68%2009 45%
Midwest:
2012 73%2009 52% Northeast:
2012 66%2009 38%

Th
e B
us
ine
ss
Va
lue
of
BiM
in n
or
Th
aM
er
ica
: Mu
lTi-
Ye
ar
Tr
en
d a
na
lYs
is a
nd
us
er
ra
Tin
gs
(20
07–2
012)
da
taBIM Adoption and Value: AdoptionBIM adoption continued
SmartMarket Report McGraw-Hill Construction 10 www.construction.com
Variation by Playerarchitects, engineers and contractors are close to reach-ing equal levels of adoption in 2012.
■■ Contractors (74%) surpassed architects (70%) to lead adoption by firm type in 2012.
■■ Engineers, the lowest adopters in 2009, had the great-est increase, rising from 42% in 2009 to 67% in 2012. Mechanical engineers lead their peers with 83% report-ing engagement with BiM, followed by electrical at 77%.
The tangibility of BiM’s benefits to contractors is driving their lead in adoption. The recent surge by engineers will help encourage software companies to expand and improve the technical analysis capabilities of their tools. (see page 44 for more information.)
BIM Adoption by Type and Size of Firm (2009 and 2012)Source: McGraw-Hill Construction, 2012
2009 2012
SmallEngineers ContractorsArchitects Medium toLarge
LargeSmall to Medium
49%
25%
67%
42%
74%
50%
70%
58%
86%91%
74%76%
41%
2012 Average(71%)
2009 Average(49%)
65%
Variation by Firm SizeThe size of an organization has the biggest influence on the likelihood that it has adopted BiM.
■■ 91% of large companies are engaged with BIM in 2012, up from 74% in 2009. In both years, this group was significantly higher than average.
■■ Medium-to-large firms, also consistent above-average adopters, grew from 65% in 2009 to 86% in 2012.
■■ the small-to-medium group soared from a below-aver-age of 41% in 2009 to 76% in 2012.
■■ Only 49% of small organizations report 2012 BIM involvement, in spite of doubling their adoption since 2009. This puts smaller organizations at a competitive disadvantage in serving the needs of increasingly BiM-aware clients.
larger organizations generally benefit from greater resources and experience in implementing new technologies and standardizing business processes to optimize them. as a result, they are better positioned to be proactive about adopting BiM, evaluating its effectiveness, and rolling it out across their organizations in a managed program.

Th
e B
us
ine
ss
Va
lue
of
BiM
in n
or
Th
aM
er
ica
: Mu
lTi-
Ye
ar
Tr
en
d a
na
lYs
is a
nd
us
er
ra
Tin
gs
(20
07–2
012)
da
ta BiM capability is beginning to exert a greater influence on the process of evaluating companies for project teams. a significant 81% take it into account at some level when making project team selections.
a majority (52%) of BiM users encourage BiM capa-bility from the companies they consider for their teams, and about a quarter (28%) requires other companies to be BiM-capable. This is expected to increase as the benefits of BiM continue to be recognized and the reduc-tion in team productivity from non-compliant members becomes more visible.
BIM Adoption and Value: Adoption continued
McGraw-Hill Construction 11 www.construction.com SmartMarket Report
Importance of BIM Capability for Project team Selection
Source: McGraw-Hill Construction, 2012
Importance of BIM Capability for Project Team Selection
BIM Expertise Does Not Affect Our Decisions.
We Encourage BIM Expertise, But Do Not Require It.
We Require Companies be Experienced in BIM.
Importance of BIM Capability for Project Team Selection
19%
52%
28%
All BIM Users

Th
e B
us
ine
ss
Va
lue
of
BiM
in n
or
Th
aM
er
ica
: Mu
lTi-
Ye
ar
Tr
en
d a
na
lYs
is a
nd
us
er
ra
Tin
gs
(20
07–2
012)
da
ta BiM implementation levels demonstrate the evolution of BiM use from 2009 to 2012. in 2009, the highest concen-trations were at the two extreme levels:
■■ the largest group (35%) was light users, experimenting with BIM to determine if they could generate meaning-ful value from it.
■■ the next largest group (27%) was the very heavy users, already convinced of its value and committing to BIM use.
in 2012, the two extremes are still the most populated tiers, but their positions are reversed.
■■ Very heavy users are now by far the largest group (39%), demonstrating the growing commitment to BIM by firms that have adopted it.
■■ Light users are the next largest (24%), representing the large number of firms that adopted BIM between 2009 and 2012, many of whom are still in the early stages of implementation.
BIM Adoption and Value: Adoption continued
The forecast for 2014 implementation shows growing commitment.
■■ By 2014, 58% of firms predict they will be at a very heavy level of BIM implementation, increasing from 39% in 2012 and 27% in 2009.
■■ Conversely, the percentage remaining at light usage dwindles to 6%, meaning 94% of current users intend to make a serious commitment to BIM.
SmartMarket Report McGraw-Hill Construction 12 www.construction.com
BIM Implementation Levels
BIM Implementation Levels (2009–2014)Source: McGraw-Hill Construction, 2012
MEDIUM: 15% to 30% of ProjectsLIGHT: Less Than 15% of Projects
HEAVY: 31% to 60% of ProjectsVERY HEAVY: More Than 60% of Projects
39%
20%17%
24%
2012
27%
18%21%
35%
2009
58%
21%
14%
6%
2014
Th
e B
us
ine
ss
Va
lue
of
BiM
in n
or
Th
aM
er
ica
: Mu
lTi-
Ye
ar
Tr
en
d a
na
lYs
is a
nd
us
er
ra
Tin
gs
(20
07–2
012)
da
ta Variation by Player
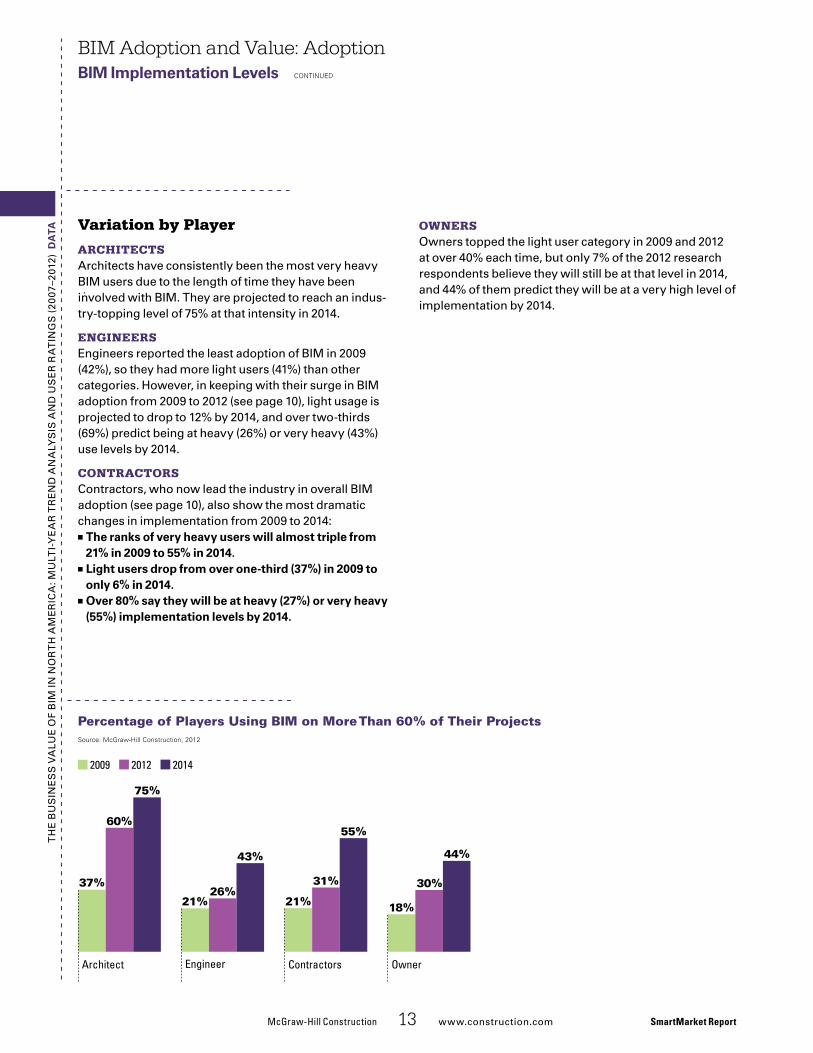
Architectsarchitects have consistently been the most very heavy BiM users due to the length of time they have been involved with BiM. They are projected to reach an indus-try-topping level of 75% at that intensity in 2014.
engineersengineers reported the least adoption of BiM in 2009 (42%), so they had more light users (41%) than other categories. however, in keeping with their surge in BiM adoption from 2009 to 2012 (see page 10), light usage is projected to drop to 12% by 2014, and over two-thirds (69%) predict being at heavy (26%) or very heavy (43%) use levels by 2014.
contrActorscontractors, who now lead the industry in overall BiM adoption (see page 10), also show the most dramatic changes in implementation from 2009 to 2014:
■■ the ranks of very heavy users will almost triple from 21% in 2009 to 55% in 2014.
■■ Light users drop from over one-third (37%) in 2009 to only 6% in 2014.
■■ Over 80% say they will be at heavy (27%) or very heavy (55%) implementation levels by 2014.
BIM Adoption and Value: AdoptionBIM Implementation Levels continued
ownersowners topped the light user category in 2009 and 2012 at over 40% each time, but only 7% of the 2012 research respondents believe they will still be at that level in 2014, and 44% of them predict they will be at a very high level of implementation by 2014.
McGraw-HillConstruction 13 www.construction.com SmartMarket Report
Percentage of Players Using BIM on More Than 60% of Their ProjectsSource: McGraw-Hill Construction, 2012
2009 2012 2014
Engineer Contractors OwnerArchitect
75%
60%
37%
43%
26%21%
55%
31%
21%
44%
30%
18%
Th
e B
us
ine
ss
Va
lue
of
BiM
in n
or
Th
aM
er
ica
: Mu
lTi-
Ye
ar
Tr
en
d a
na
lYs
is a
nd
us
er
ra
Tin
gs
(20
07–2
012)
da
ta
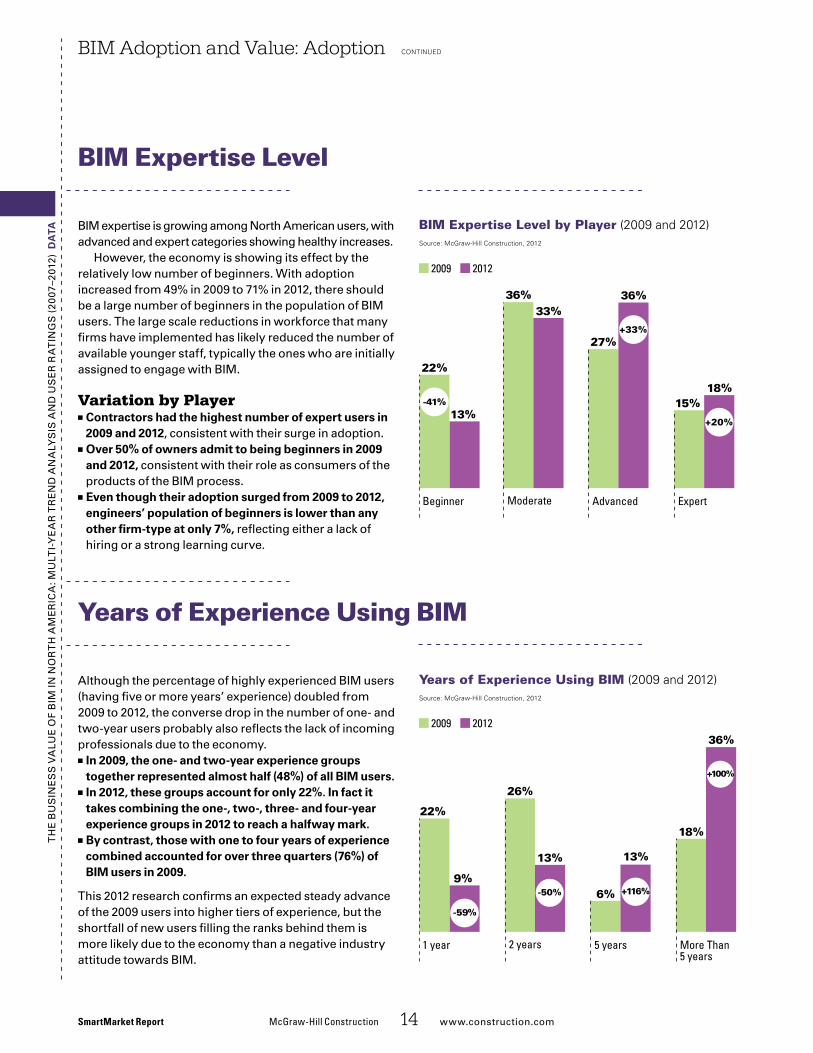
although the percentage of highly experienced BiM users (having five or more years’ experience) doubled from 2009 to 2012, the converse drop in the number of one- and two-year users probably also reflects the lack of incoming professionals due to the economy.
■■ In 2009, the one- and two-year experience groups together represented almost half (48%) of all BIM users.
■■ In 2012, these groups account for only 22%. In fact it takes combining the one-, two-, three- and four-year experience groups in 2012 to reach a halfway mark.
■■ By contrast, those with one to four years of experience combined accounted for over three quarters (76%) of BIM users in 2009.
This 2012 research confirms an expected steady advance of the 2009 users into higher tiers of experience, but the shortfall of new users filling the ranks behind them is more likely due to the economy than a negative industry attitude towards BiM.
BIM Adoption and Value: Adoption continued
SmartMarket Report McGraw-Hill Construction 14 www.construction.com
Years of Experience Using BIM
BiM expertise is growing among north american users, with advanced and expert categories showing healthy increases.
however, the economy is showing its effect by the relatively low number of beginners. With adoption increased from 49% in 2009 to 71% in 2012, there should be a large number of beginners in the population of BiM users. The large scale reductions in workforce that many firms have implemented has likely reduced the number of available younger staff, typically the ones who are initially assigned to engage with BiM.
Variation by Player■■ Contractors had the highest number of expert users in 2009 and 2012, consistent with their surge in adoption.
■■ Over 50% of owners admit to being beginners in 2009 and 2012, consistent with their role as consumers of the products of the BiM process.
■■ Even though their adoption surged from 2009 to 2012, engineers’ population of beginners is lower than any other firm-type at only 7%, reflecting either a lack of hiring or a strong learning curve.
BIM Expertise Level
BIM Expertise Level by Player (2009 and 2012)Source: McGraw-Hill Construction, 2012
2009 2012
Moderate
33%36%
Beginner
13%
22%
-41%
27%
Advanced
36%
+33%
Expert
18%15%
+20%
Years of Experience Using BIM (2009 and 2012)Source: McGraw-Hill Construction, 2012
2009 2012
More Than5 years
36%
18%
+100%
5 years
13%
6% +116%
2 years
13%
26%
-50%
1 year
9%
22%
-59%

Th
e B
us
ine
ss
Va
lue
of
BiM
in n
or
Th
aM
er
ica
: Mu
lTi-
Ye
ar
Tr
en
d a
na
lYs
is a
nd
us
er
ra
Tin
gs
(20
07–2
012)
Chairman and Chief Executive Officer, HOKChairman, buildingSMART International
Interview:Thought Leader
McGraw-HillConstruction 15 www.construction.com SmartMarket Report
HowdidyougetinvolvedwithBIM?MacLeaMy: in 1995 a group of 12 companies in the u.s. got together. That was before the term “BiM” had come along. We just wanted a con-tractor to be able to take our data and use it instead of only having draw-ings. i went around europe and east asia soliciting more people’s interest in this, and we formed the international alliance for interoper-ability (iai) as a little united nations just for the building industry. We later changed our name to build-ingsMarT international and we now have chapters in 20-odd countries and a very robust technical group. We created the ifc [industry founda-tion classes], an international stan-dard for open data exchange in the building industry, which we later suc-ceeded in getting formally adopted by iso. and good things have contin-ued to happen.
HowhasBIMimpactedthecon-structionindustry?MacLeaMy: [it has] cleared away a lot of the bureaucracy of getting a building built and replacing it with processes that are saving real time and money. for instance, instead of going all the way through work-ing drawings, engineers are giving contractors a BiM model much ear-lier, which they can use for fabrica-tion. We’re also seeing fewer rfis [requests for information], which means more efficiency, more sure-ness, more speed of construction.
Whatarethemostimportantcur-rentBIMneedstomosteffec-tivelyadvancetheindustry?MacLeaMy: getting owners and manufacturers involved. only a few owners understand the value propo-sition that they can get better build-ings that operate better and give them more value over time through BiM. We turn really good buildings over to even sophisticated owners, who are not yet geared and soft-ware isn’t quite available yet, to oper-ate a building optimally. People who make the products that we put into our buildings are becoming quite interested in highly filtered searches online that identify the right prod-uct for the right use in a model with all the technical details. We’re at the beginnings of that, but it could really take off.
HowdoyouthinkBIMwillchangetheindustryoverthenexttenyears?MacLeaMy: i think there’s going to be a huge shake-out. Those who practice the old way are soon going to find themselves without work. either change, get with this program, or go out of business.
also, having full exchange of infor-mation is only part of the story. We
need a fundamental realignment of how architects, contractors, engi-neers and owners interact. architects are going to have to develop new working relationships with contrac-tors based on respect for what each brings to the project.
WhatarebuildingSMARTInternational’sfutureplansrelatedtoBIM?MacLeaMy: i want buildingsMarT international to transform the world of buildings. The uK government wants to transform its building indus-try and is adopting our iso standard for their 2016 plan. The french prod-uct manufacturer’s association has approached us to help create a dig-ital filter that allows anyone in the world to find any product in the build-ing industry. This is a revolutionary time for us. instead of being just pio-neering and having to do it all by our-selves, other people are starting to take the initiative. n
Patrick MacLeamy, FAIA, LEED AP
“I think there’s going to be a huge shake-out. Those who practice the old way are soon going to find
themselves without work. Either change, get with this program, or go out of business.”

Th
e B
us
ine
ss
Va
lue
of
BiM
in n
or
Th
aM
er
ica
: Mu
lTi-
Ye
ar
Tr
en
d a
na
lYs
is a
nd
us
er
ra
Tin
gs
(20
07–2
012)
G iven the potential investments and cultural shifts associated with BiM adoption, users
have leaned on metrics to help them identify the technology’s value. initially, metrics were hard to come by, as users could only work from limited data. But over time, users have gained a wealth of information about the costs and benefits associated with BiM, helping users expand and refine the use of metrics.
Collaborationas an earlier adopter of BiM, executives at J.c. cannistraro, an MeP contractor based in Watertown, Mass., could sense that greater collaboration yielded better results but couldn’t quantify it, says Michael cannistraro, vice president of service
Metrics Measure the Value Gained from BIM
As they get more BIM projects completed, companies are now developing their own metrics to understand the benefits gained from BIM. Also, researchers are working on a bimSCORE to be applied industry-wide.
SmartMarket Report McGraw-Hill Construction 16 www.construction.com
Sidebar: Metrics
and engineering at J.c. cannistraro. “We wanted to show owners the value in bringing the mechanical contractors early to help design our work to the budget,” he says.
The company looked at change order costs on 408 projects completed between 2003 and 2009 with a total project value of $558,858,574. To help drive its message, the company broke its projects into three groups:
■■ 2D projects [no BIM use]■■ Lonely BIM [siloed use of BIM]■■ Collaborative BIM [multi-party BIM use]
The results showed how, in the big picture, BiM saves money as the team gets more collaborative. on its 2d projects, the firm saw 18.42% in additional change order costs from
its base contracts. on projects where J.c. cannistraro used BiM in-house but did not collaborate, change order costs dropped to 11.7%. on its collab-orative BiM projects, where they exchanged models and data with multiple parties, change order costs dropped significantly to 2.68%.
cannistraro, who serves as on the BiM committee for the Mechanical contractors association of america, says he hopes the findings resonate with others in the industry. “i try to explain to other mechanical contractors out there that once you get the immediate benefits of using BiM yourself, then you move to this collaborative approach and the benefits become more significant,” he adds. “everyone starts sharing, and everything starts to fire on all cylinders. That’s what we wanted to show.”
Targeted Measurementanother early adopter, Mortenson construction, has seen a steady evolution in its use of metrics. as the company has continually gathered data from projects over time, it has built a significant database that has allowed it to dig deeper into investigating the value proposition of BiM, says derek cunz, vice president and general manager at Mortenson construction.
cunz says that from 2000 to 2003, the company was focused on mea-suring the roi for its initial invest-ments in BiM. “We were trying to justify the spend,” he recalls. “We
LOW
LOW
HIGH
HIGHBIM USE
2-D PROJECTS
3-D LONELY BIM
COLLABORATIVE BIM
GOALCH
AN
GE O
RD
ER
S
BASE CONTRACT: $143,969,283CHANGE ORDERS: $26,512,448
BASE CONTRACT: $300,146,875CHANGE ORDERS: $33,532,497
BASE CONTRACT: $53,268,301CHANGE ORDERS: $1,427,170
CHANGEORDERS: $0
18.42%
11.17%
2.68%
A study by J.C. Cannistraro of 408 projects Valued at $559 million shows how, in the big picture, BIM saves money as the team gets more collaborative.
Cou
rtes
y of
J.C
. Can
nist
raro

Overall
79
Planning
93
Adoption
80
Technology
63
Performance
82
Condence Level
65
ConventionalPractice
TypicalPractice
AdvancedPractice
BestPractice
InnovativePractice
Th
e B
us
ine
ss
Va
lue
of
BiM
in n
or
Th
aM
er
ica
: Mu
lTi-
Ye
ar
Tr
en
d a
na
lYs
is a
nd
us
er
ra
Tin
gs
(20
07–2
012)
McGraw-Hill Construction 17 www.construction.com SmartMarket Report
Sidebar: Metrics Continued
believed it would be positive for our business, but we had to prove it.”
since 2007, cunz says the company has refined its efforts, benchmarking similar projects, expanding the range of metrics it measures and targeting more specific uses of BiM.
“all of the low-hanging fruit that we justified in the past is now all standard operating procedure,” he says. “Things like modeling, clash detection, planning enclosure mock-ups are all a given [on projects]. now we can use metrics to guide deci-sions about specific BiM uses on cer-tain projects. so, on a project with a complex steel frame, we could look at how much we would save if we did a BiM-to-fabrication scenario and decide that it would be worth it.”
While Mortenson construction can measure effectively against itself, cunz says he looks forward to expanded and open sharing of metrics among other companies in the coming years, so it can gauge its performance on an industry level.
Industry EffortTo help add more industry perspective, researchers with the center for integrated facility engineering at stanford university developed a metrics system called bimscore. The system benchmarks innovative practices and scores projects by rating their practices against those benchmarks.
each project’s Virtual design and construction (Vdc) scorecard is broken into four main areas: plan-ning, adoption, technology and per-formance. each of those areas is subdivided into two or three addi-tional “dimensions” such as quality or objectives. another 20 measures feed into those dimensions.
Through its benchmarking, the team can score different practice areas based on a sophistication scale that starts at conventional [not lever-aging Vdc] and move up to typical [standard BiM use] then advanced [leveraging uses that a majority may not be doing] then best practice [among the best uses] and topping out at innovative [one of a kind].
calvin Kam, ceo and founder of bimscore, says that by breaking the scoring into multiple pieces, a team gets a more complete picture of a project and can show projects where their BiM use may have excelled or been lacking.
“it’s a great tool for showing an owner that maybe they had the right technology on a project but the wrong team,” he says. “or maybe the planning was great, but then you didn’t follow through with perfor-mance. We provide the vocabulary to discuss this.”
Kam notes that one of the bene-fits of the system is that scores are dynamic, so they are not simply snapshots in time. as new innova-tions are introduced, benchmarks are adjusted. in theory, scored projects will see their scores drop over time as BiM use advances.
as of october 2012, the team had scored 57 projects in roughly two years. over time, Kam predicts that the system could create an ample database of projects for comparing scores at multiple levels.
“This is something that can scale from individual projects to companies to regions to industries and even to countries,” he says. n
Sutter Medical Center Castro Valley (see page 34) earned an overall bimSCORE of 79, registering high marks (93%) in the planning area for its innovative 11-party IPD method, while showing room for improvement in the technology area (63%).

Th
e B
us
ine
ss
Va
lue
of
BiM
in n
or
Th
aM
er
ica
: Mu
lTi-
Ye
ar
Tr
en
d a
na
lYs
is a
nd
us
er
ra
Tin
gs
(20
07–2
012)
da
ta some benefits of BiM can be experienced on a user’s first few projects, such as reduced errors and omis-sions, rework and cycle time of workflows. others require longer time frames to demonstrate their value, such as reduced cost, schedule and claims, or maintaining repeat business and increasing profits.
this 2012 research shows higher levels of impor-tance for ten of the eleven BIM benefits rated compared to the 2009 results. interestingly, the largest percentage increases occur with benefits that take longer to validate, reflecting the increasing length of time BiM has been in the market and the increasing maturity of BiM users in evaluating its benefits.
The top percentage gainers include: ■■ Increased Profits: this rating expanded by 70%—from 21% and the next-to-last position in 2009 to 36% in 2012. This could drive use of BiM in the future—as BiM processes become more standardized and the
BIM Adoption and Value: Benefits
SmartMarket Report McGraw-Hill Construction 18 www.construction.com
Short- and Long-Term BIM Benefits
initial costs of adoption and implementation are amor-tized, firms using BiM have the ability to see a sustained impact on profitability.
■■ Fewer Claims and Litigation: although still ranking low overall, this benefit grew by 40% from 2009, growing from 20% in 2009 to 28% in 2012. relatively few BiM projects have reached completion (when the majority of claims and litigation appear), so evidence is still scant. however, this strong percentage increase indicates a growing belief that as more problems are avoided during construction and claims measurably diminish, this will be a reliable benefit.
■■ Reducing Overall Project duration: This metric also requires a substantial number of completed projects in order to be validated, but if the trend of increased impor-tance continues—growing from 27% in 2009 to 37% in 2012—reduced project duration will become a powerful ingredient of a quantifiable BiM benefit calculation.
36% 47%
Short-Term BIM Bene�ts (2009 and 2012)Source: McGraw-Hill Construction, 2012
20092012
52%
49%
51%
45%
48%
47%
46%
31%
39%
21%
23%
Reduced Document Errors and Omissions
Market New Business
Reduced Rework
Offer New Services
Reduced Cycle Time of Speci�c Work�ows
Staff Recruitment and Retention
Long-Term BIM Bene�ts (2009 and 2012)Source: McGraw-Hill Construction, 2012
20092012
49%
27%
37%
21%
36%
25%
32%
20%
28%
Maintain Repeat Business
Reduced Project Duration
Increased Pro�ts
Reduced Construction Cost
Fewer Claims/Litigation

Th
e B
us
ine
ss
Va
lue
of
BiM
in n
or
Th
aM
er
ica
: Mu
lTi-
Ye
ar
Tr
en
d a
na
lYs
is a
nd
us
er
ra
Tin
gs
(20
07–2
012)
da
taBIM Adoption and Value: BenefitsShort- and Long-term BIM Benefits continued
McGraw-Hill Construction 19 www.construction.com SmartMarket Report
■■ Maintaining Repeat Business with Past Clients: among the three highest-rated benefits related to business development, measuring BiMs impact on repeat business takes longer than leveraging BiM for marketing to new clients or offering new services. its 36% growth from 2009—increasing from 36% in 2009 to 49% in 2012—confirms clients’ increasing awareness of BiM value and its contribution to deepening client relationships.
Variation by E-Level The accelerating importance of these long-term benefits is reinforced by their ratings from very high e-level BiM users. This group’s 2012 ratings more than double the industry-wide 2009 levels, and significantly outpace the overall 2012 numbers.
among the other seven benefits rated:■■ Six of the seven benefits trended positively, and they should continue to do so as BIM use continues to mature and the benefits become more reliable and widespread.
■■ Leveraging BIM to offer new services had a very small decline, but not enough to be meaningful, especially considering that it earned a 56% rating with very high E-Level users.
Source: McGraw-Hill Construction, 2012
Percentage of BIM Users Who Consider Benets of High/Very High Value (2009 to 2012)
2009 Rating byAll BIM Users
2012 Rating byAll BIM Users
2012 Rating by Very HighE-Level BIM Users
Maintaining Repeat Business
Reducing Overall Project Duration
Fewer Claims and Litigation
Increased Pro�ts
36%
27%
20%
21%
49%
37%
28%
36%
58%
60%
50%
52%

Th
e B
us
ine
ss
Va
lue
of
BiM
in n
or
Th
aM
er
ica
: Mu
lTi-
Ye
ar
Tr
en
d a
na
lYs
is a
nd
us
er
ra
Tin
gs
(20
07–2
012)
da
ta although BiM is creating an increasing level of integra-tion and sharing of common project objectives among the players, there are still distinct differences in how each player experiences BiM value.
Architectsarchitects sharply increased the ratings of their top BiM benefits between 2009 and 2012:
■■ the consistent leading benefit for architects in both 2009 and 2012 is reduced errors and omissions in documents because it affects both risk and productiv-ity related to their key project deliverable. The sharp growth shows that more architects are convinced of BiM’s contribution to this mission-critical objective.
■■ the second and third most important benefits fall in the business development category, with each showing about a 20% increase over 2009 levels, demon-strating the increasing competitive advantage achieved from using BiM.
■■ Reducing rework is a tangible outcome of the top-ranked benefit of reduced errors and omissions in documents, again reducing risk and enhancing productivity.
■■ Reducing Cycle time of Specific Workflows improves productivity, a focus for architects.
Engineersengineers were more reserved than architects in rating their top benefits, with the lead benefit only garnering a 50% response rate, and the others running significantly lower compared to the number of architect respondents. This probably reflects the generally lower roi being experienced by engineers. (see page 24 for more infor-mation on BiM roi reported by engineers.)
■■ the three top benefits are directly related to business development, led by maintaining repeat business with clients, which grew by 43% between 2009 and 2012—rising from only 35% in 2009 to 50% in 2012. since engineers are often retained by other professionals as consultants, this focus on repeat client development is critical to ongoing business health.
■■ the higher percentage of engineers citing reduced errors and omissions in documents and reducing rework, although showing slight decreases from 2009 levels, reflects the impact of these factors on risk and productivity, similar to the architects surveyed.
BIM Adoption and Value: Benefits continued
SmartMarket Report McGraw-Hill Construction 20 www.construction.com
Top Business Benefits by Player
Top BIM Bene�ts for Architects (2009 and 2012)Source: McGraw-Hill Construction, 2012
20092012
Reduced Document Errors and Omissions
43%
57%
Market New Business
41%
49%
41%
48%
Offer New Services
Reduced Rework
38%
45%
34%
44%
Reduced Cycle Time of Speci�c Work�ows
Top BIM Bene�ts for Engineers (2009 and 2012)Source: McGraw-Hill Construction, 2012
20092012
Maintain Repeat Business
35%
50%
Market New Business
43%
43%
38%
43%
Offer New Services
Reduced Document Errors and Omissions
38%
34%
28%
26%
Reduced Rework

ContractorsBecause contractors focus heavily on their progress at the job site, any new process or technology will be judged in that light. Thus, it is no surprise that BiM benefits that directly impact job site productivity represent four of the top five most valuable for contractors.
■■ Reducing rework is selected by the highest percentage of contractors, indicating that most are seeing this benefit on their projects. rework is a leading cause of cost and schedule overruns, which have a negative impact on repeat business and may even generate claims. The wide recognition of BiM’s ability to reduce rework contributes strongly to its value proposition with contractors.
■■ Reducing overall project duration had the highest percentage increase in importance from 2009, jumping from 32% in 2009 to 53% in 2012—a growth of 66%. The strong increase suggests that contractors are getting this benefit consistently on projects.
■■ Reduced errors and omissions in documents remains the third most important benefit, presumably because of its direct connection to the issue of reducing rework.
■■ the power of BIM for business development remains strongly represented in contractors’ top benefits. Main-taining repeat business with clients increased from 42% in 2009 to 54% in 2012. it is a very tangible metric given that contractors are brought back by satisfied clients to perform more BiM projects. and even though market-ing new business to new clients slid from first to second place among all benefits, it is still important to 56%.
Ownersowners focus on the ultimate success of the project, so their most important BiM benefits match those needs. architects, engineers and contractors should consider the voice of the owner about the BiM benefits that provide them the greatest value.
■■ the largest percentage of owners consider reduced errors and omissions in documents a key BIM benefit because it can prevent numerous problems from occur-ring on their projects. in fact, the percentage of owners who consider this benefit important increased from 43% in 2009 to 61% in 2012. it was also selected by more owners than any other player as an important benefit.
■■ BIM’s ability to reduce in rework, cost, schedule and claims finish out the list of the top benefits for owners, each of which directly impacts the successof the project.
Th
e B
us
ine
ss
Va
lue
of
BiM
in n
or
Th
aM
er
ica
: Mu
lTi-
Ye
ar
Tr
en
d a
na
lYs
is a
nd
us
er
ra
Tin
gs
(20
07–2
012)
da
taBIM Adoption and Value: Benefitstop Business Benefits by Player continued
McGraw-Hill Construction 21 www.construction.com SmartMarket Report
Top BIM Bene�ts for Contractors (2009 and 2012)Source: McGraw-Hill Construction, 2012
20092012
Reduced Rework
57%
65%
Market New Business
58%
56%
54%
55%
Reduced Dccument Errors and Omissions
Maintain Repeat Business
42%
54%
32%
53%
Reduced Project Duration
Top BIM Bene�ts for Owners (2009 and 2012)Source: McGraw-Hill Construction, 2012
20092012
Reduced Document Errors and Omissions
43%
61%
Reduced Rework
41%
36%
30%
30%
Reduced Construction Cost
Reduced Project Duration
25%
22%
25%
17%
Fewer Claims/Litigation
Th
e B
us
ine
ss
Va
lue
of
BiM
in n
or
Th
aM
er
ica
: Mu
lTi-
Ye
ar
Tr
en
d a
na
lYs
is a
nd
us
er
ra
Tin
gs
(20
07–2
012)
da
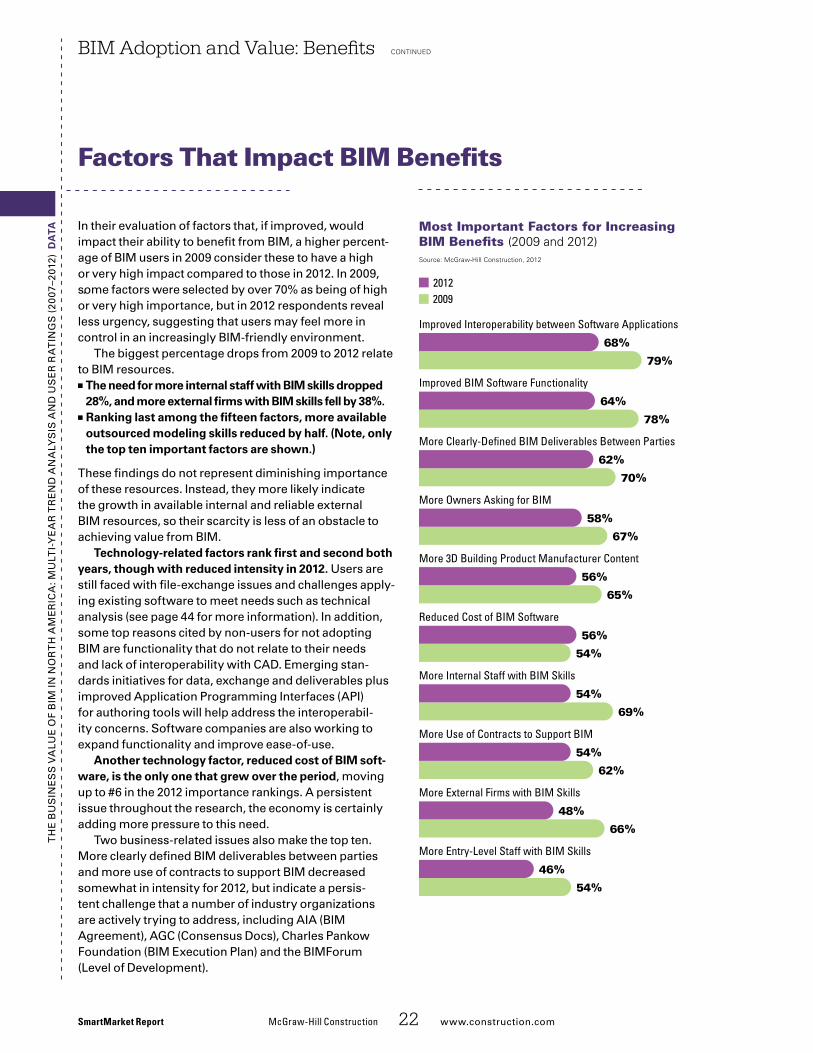
ta in their evaluation of factors that, if improved, would impact their ability to benefit from BiM, a higher percent-age of BiM users in 2009 consider these to have a high or very high impact compared to those in 2012. in 2009, some factors were selected by over 70% as being of high or very high importance, but in 2012 respondents reveal less urgency, suggesting that users may feel more in control in an increasingly BiM-friendly environment.
The biggest percentage drops from 2009 to 2012 relate to BiM resources.
■■ the need for more internal staff with BIM skills dropped 28%, and more external firms with BIM skills fell by 38%.
■■ Ranking last among the fifteen factors, more available outsourced modeling skills reduced by half. (Note, only the top ten important factors are shown.)
These findings do not represent diminishing importance of these resources. instead, they more likely indicate the growth in available internal and reliable external BiM resources, so their scarcity is less of an obstacle to achieving value from BiM.
technology-related factors rank first and second both years, though with reduced intensity in 2012. users are still faced with file-exchange issues and challenges apply-ing existing software to meet needs such as technical analysis (see page 44 for more information). in addition, some top reasons cited by non-users for not adopting BiM are functionality that do not relate to their needs and lack of interoperability with cad. emerging stan-dards initiatives for data, exchange and deliverables plus improved application Programming interfaces (aPi) for authoring tools will help address the interoperabil-ity concerns. software companies are also working to expand functionality and improve ease-of-use.
another technology factor, reduced cost of BIM soft-ware, is the only one that grew over the period, moving up to #6 in the 2012 importance rankings. a persistent issue throughout the research, the economy is certainly adding more pressure to this need.
Two business-related issues also make the top ten. More clearly defined BiM deliverables between parties and more use of contracts to support BiM decreased somewhat in intensity for 2012, but indicate a persis-tent challenge that a number of industry organizations are actively trying to address, including aia (BiM agreement), agc (consensus docs), charles Pankow foundation (BiM execution Plan) and the BiMforum (level of development).
BIM Adoption and Value: Benefits continued
SmartMarket Report McGraw-Hill Construction 22 www.construction.com
Factors That Impact BIM Benefits
Most Important Factors for IncreasingBIM Bene ts (2009 and 2012)Source: McGraw-Hill Construction, 2012
20092012
79%
68%
78%
64%
70%
62%
67%
58%
65%
56%
54%
56%
69%
54%
62%
54%
66%
48%
54%
46%
Improved Interoperability between Software Applications
Improved BIM Software Functionality
More Clearly-De�ned BIM Deliverables Between Parties
More Owners Asking for BIM
More 3D Building Product Manufacturer Content
Reduced Cost of BIM Software
More Internal Staff with BIM Skills
More Use of Contracts to Support BIM
More External Firms with BIM Skills
More Entry-Level Staff with BIM Skills

More 3d building product manufacturer-specific content, ranking fifth in 2012, may owe its reduced intensity to greater activity by manufacturers to have content created and distributed, and more sites from which it is available.
Variation by Player of the Most Important FactorWhen asked to identify the single most important factor, users’ selections crystallize the drivers of BiM business value for each group.
Architectstheir top response is more owners asking for BIM. architects already have high levels of adoption, implementation and expertise; what they need is demand.
engineerstheir top response is improved functionality of BIM software. engineers have had to adapt to software that was primarily developed for architectural design, so they are eager for tools, processes and content more tailored to their needs.
contrActorstheir top response is more clearly defined BIM deliverables between partners. contractors—downstream from BiM design processes and increasingly adding to or creating new models, especially among the trades—need clarity between those who author and those who receive models.
ownerstheir top response is more clearly defined BIM deliver-ables between partners. owners also need well-defined deliverables between parties, not only because that will reduce risk and improve outcomes on their projects, but because they are also increasingly responsible for devel-oping contracts and BiM execution plans that rely on clear definitions linked to established standards.
Th
e B
us
ine
ss
Va
lue
of
BiM
in n
or
Th
aM
er
ica
: Mu
lTi-
Ye
ar
Tr
en
d a
na
lYs
is a
nd
us
er
ra
Tin
gs
(20
07–2
012)
da
taBIM Adoption and Value: BenefitsFactors that Impact BIM Benefits continued
McGraw-Hill Construction 23 www.construction.com SmartMarket Report

Th
e B
us
ine
ss
Va
lue
of
BiM
in n
or
Th
aM
er
ica
: Mu
lTi-
Ye
ar
Tr
en
d a
na
lYs
is a
nd
us
er
ra
Tin
gs
(20
07–2
012)
da
ta although there is no industry-standard method to calcu-late the return on investment (roi) for BiM, most users have a perception of the degree to which they are receiv-ing value for the time, money and effort they have invested. These research results suggest that the appar-ent similarity between the 2009 and 2012 findings about the perceived roi of BiM mask interesting forces at work.
existing users naturally improve their roi over time as their skills and experience increase, and they amortize the initial costs over more projects. however, the percentage of total users reporting over 50% roi appears flat from 2009 to 2012.
Meanwhile, the total pool of BiM users has expanded from 49% of the industry to 71% between 2009 and 2012, raising the percentage of newer users whose roi is typi-cally negative or quite low in their early years. however, the lower portions of the roi spectrum also appear flat.
Thus, it is possible that these two forces are offsetting each other, so while the actual number of users expe-riencing higher roi is growing, the overall size of the population is also increasing, keeping their percentage of the total essentially flat. likewise, the positions in the lower tiers that are being vacated by the advancing users are being back-filled by just enough new entrants to keep all the proportions roughly equivalent.
BIM Adoption and Value: ROI
Variation by Engagement (E-Level)dividing the total user population into three basic tiers of roi, a very clear picture emerges by comparing the results of those with low and very high BiM engagement levels:
■■ about a third of each group is receiving moderately positive ROI (up to 25%).
■■ the very high engagement users dominate the very positive range, with 67% reporting of ROI over 25%, compared to only 20% of low E-Level users.
■■ Nearly two thirds (64%) of low engagement users are in the negative or break-even range, compared to only 6% of high E-Level users rating their ROI at these levels.
This analysis demonstrates the powerful relationship between roi and a company’s level of BiM engagement, quantifying the rewards of greater BiM experience, skill and implementation levels.
SmartMarket Report McGraw-Hill Construction 24 www.construction.com
Perceived ROI for BIM
BIM ROI (2009 to 2012)Source: McGraw-Hill Construction, 2012
2009 2012
10% to 25%Break-Even Less Than 10%Negative 51% to 100% Over 100%26% to 50%
17%18%
20% 20%
16%14%
21%22%
11%12%
7%9%
8%
5%
BIM ROI for Users by Level of EngagementSource: McGraw-Hill Construction, 2012
Negative or Break-EvenModerately Positive (Up to 25%)
Very Positive (Over 25%)
64%
33%
20%
37% 36%27%
6%
37%
67%
All BIM Users Very High Engagement Low Engagement

Th
e B
us
ine
ss
Va
lue
of
BiM
in n
or
Th
aM
er
ica
: Mu
lTi-
Ye
ar
Tr
en
d a
na
lYs
is a
nd
us
er
ra
Tin
gs
(20
07–2
012)
da
taBIM Adoption and Value: ROIPerceived ROI for BIM continued
McGraw-Hill Construction 25 www.construction.com SmartMarket Report
BIM ROI by Player (2009 and 2012)Source: McGraw-Hill Construction, 2012
Negative or Break-Even Moderately Positive (Up to 25%) Very Positive (Over 25%)
2012 Contractors2009 Contractors2012 Engineers2009 Engineers2012 Architects2009 Architects
42%
32%
26%
35%
29%
36%
54%
33%
12%
63%
22%
15%
29%
44%
29%26%
47%
27%
Variation by Player
Architectsarchitects are the most mature group of BiM users, and their BiM roi reflects their experience. The percentage getting very positive roi has risen:
■■ the number claiming negative or break-even has dropped.
■■ a consistent proportion (about 30%) report moderately positive ROI in both periods.
This makes sense because the existing users are advanc-ing, and the influx of new adopters between 2009 and 2012 have been able to take advantage of the relatively advanced state of architectural BiM and get to break-even (or beyond) fairly quickly.
engineersThe sharp increase of engineers with negative or break-even roi is clearly the impact of their very large influx of new adopters (25% have one or two years experience).
The drop in moderately positive roi users is also likely due to the large number of new adopters, most of whom are in the lowest tier. as such, growth in the number of mid-tier users is outweighed as a percentage of the much larger 2012 total.
engineers’ struggle to take advantage of BiM to the same degree as the top level architects and contractors.
contrActorscontractors display the most classic bell curve distribu-tion, with nearly half in the moderately positive range both years. The similarity between the periods is likely due to the same offsetting effect that is at work in the overall industry, where new users’ lower roi counteracts the increasing roi of the more experienced users.

Th
e B
us
ine
ss
Va
lue
of
BiM
in n
or
Th
aM
er
ica
: Mu
lTi-
Ye
ar
Tr
en
d a
na
lYs
is a
nd
us
er
ra
Tin
gs
(20
07–2
012)
da
ta The value of BiM is realized in different ways by the variety of firm types in the industry. The specific elements recognized by the largest share of the respondents as improving the potential roi of BiM users reveals very different perspectives by player type among BiM users.
■■ Better project process outcomes is given the greatest weight by contractors and owners, although it scores fairly well with all player types. contractors and owners may find this particularly compelling because they are closer to the finished building compared to other players.
■■ Increased prefabrication is rated high by 81% of contractors, but only resonates with 19% of architects and 22% of engineers. as more integrated whole-proj-ect-process thinking is facilitated by the growing use of BiM, more design team members will become engaged in designing specifically for activities like prefabrica-tion and modularization, and their understanding of its contribution to the roi of BiM should increase.
BIM Adoption and Value: ROI continued
SmartMarket Report McGraw-Hill Construction 26 www.construction.com
Elements That Would Improve ROI for BIM Users
Source: McGraw-Hill Construction, 2012
Elements That Improve ROI for BIM Users by Player
13% 47% 46% 35% 19% 62% 68% 74% 74% 79%
13% 20% 28% 28% 22% 41% 50% 65% 59% 59%
57% 36% 37% 48% 81% 78% 79% 71% 81% 85%
33% 67% 17% 50% 50% 83% 50% 100% 100% 50%
33% 37% 37% 40% 48% 65% 68% 71% 74% 77%TOTAL
Owner
Contractor
Engineer
Architect
ImprovedPersonnelProductivity
ImprovedProject ProcessOutcomes
BetterMulti-PartyCommunication
Reduced CycleTime for ProjectActivities andDelivery
Lower ProjectCost
IncreasedPrefabrication
Faster PlanApproval andPermits
Positive Impacton StaffRecruitmentand Retention
PositiveImpact onSustainability
ImprovedJob-SiteSafety
More than 75% 51% to 75% 26% to 50% 25% or Less
■■ Lower project cost is considered important by 83% of owners and 78% of contractors, but only by 41% of engineers. engineers may not experience the poten-tial cost impact of BiM yet because of their relatively low level of BiM maturity. in addition, engineers may be driven less by total project cost compared to the cost of their portion of a project, which may keep this factor from having as strong of an impact on their BiM roi as other players.
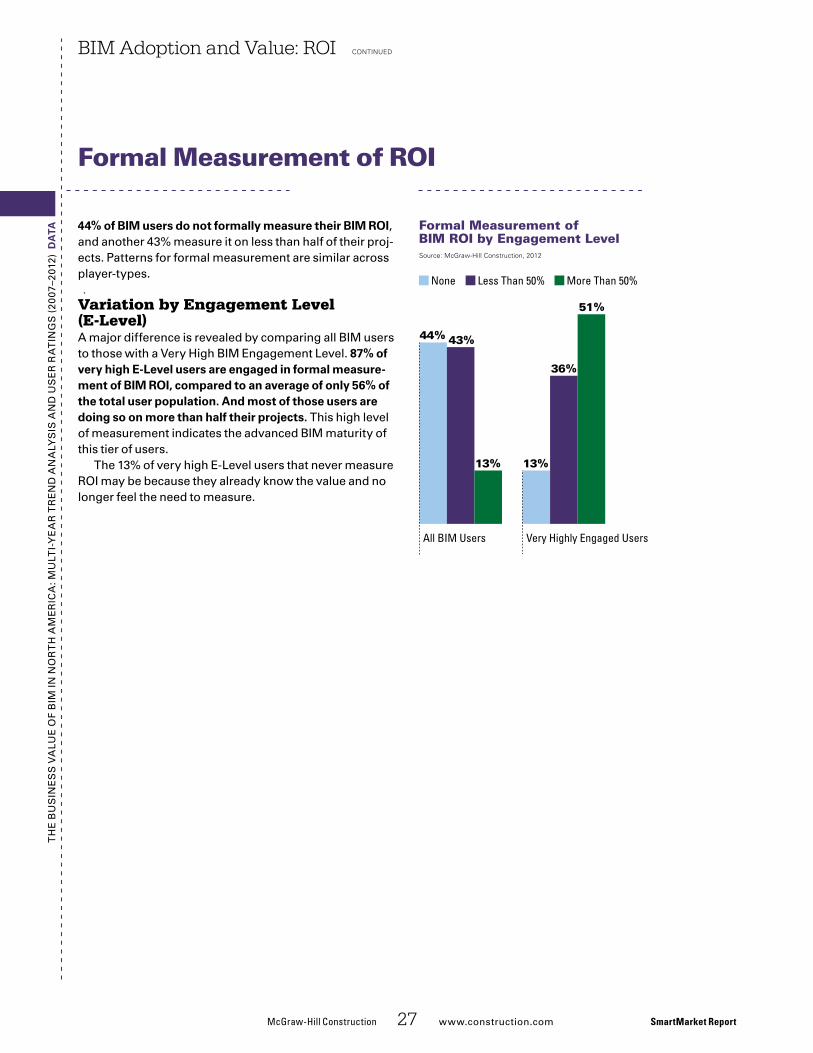
Th
e B
us
ine
ss
Va
lue
of
BiM
in n
or
Th
aM
er
ica
: Mu
lTi-
Ye
ar
Tr
en
d a
na
lYs
is a
nd
us
er
ra
Tin
gs
(20
07–2
012)
da
ta 44% of BIM users do not formally measure their BIM ROI, and another 43% measure it on less than half of their proj-ects. Patterns for formal measurement are similar across player-types.
Variation by Engagement Level (E-Level)a major difference is revealed by comparing all BiM users to those with a Very high BiM engagement level. 87% of very high E-Level users are engaged in formal measure-ment of BIM ROI, compared to an average of only 56% of the total user population. and most of those users are doing so on more than half their projects. This high level of measurement indicates the advanced BiM maturity of this tier of users.
The 13% of very high e-level users that never measure roi may be because they already know the value and no longer feel the need to measure.
BIM Adoption and Value: ROI continued
McGraw-Hill Construction 27 www.construction.com SmartMarket Report
Formal Measurement of ROI
Formal Measurement of BIM ROI by Engagement LevelSource: McGraw-Hill Construction, 2012
None Less Than 50% More Than 50%
44% 43%
13% 13%
36%
51%
Very Highly Engaged UsersAll BIM Users

Th
e B
us
ine
ss
Va
lue
of
BiM
in n
or
Th
aM
er
ica
: Mu
lTi-
Ye
ar
Tr
en
d a
na
lYs
is a
nd
us
er
ra
Tin
gs
(20
07–2
012) The design and construction
team of a processing facil-ity in Texas learned that it is never too late to start mod-
eling a project. The new $100 million hePf at B&W Pantex’s facility in amarillo is being developed as a test-ing facility for the u.s. department of energy (doe). When federal fund-ing issues forced the project to be put on hold in 2006, project managers decided it was a good opportunity to give the facility a second look.
although it had reached 95% cad construction documents, B&W Pantex hired ch2M hill in 2007 to model the project in BiM. B&W proj-ect engineer stephen forman says that BiM was an emerging technol-ogy when design originated, but by the time it neared design com-pletion, he recognized that model-ing was already proving its value on other projects. “We were aware of some lessons learned at other doe sites and saw the potential benefits,” he said. “We had been burned in the past by issues in the field and didn’t want to relive those. it was worth trying it.”
david fouché, senior technolo-gist at ch2M hill, notes that it is common in complex and spatially challenging buildings, especially pro-cessing type facilities, to encounter problems with installation and oper-ations that could have been caught in a 3d model. “it’s simply not possible to piece all the 2d drawings together to create a realistic mental picture of everything that’s going on,” he says.
Putting ROI to the TestB&W Pantex invested $1 million to have ch2M hill spend four months modeling the design down to the level of ¾-in conduit. The payback
was realized quickly. Models revealed more than 500 significant clashes, including ten “big ticket” items that independent auditors estimated could have cost up to $10 million to rework in the field. The team was then able to redesign problem areas to bring the project back on budget.
since the start of construction, which is scheduled to complete in 2014, the team has continued to leverage the model. When the project was resurrected in 2010, the Tulsa district of the u.s. army corps of engineers (usace) was brought in as construction manager. in 2011, Kiewit construction was awarded the contract as general contractor under the corps.
Meanwhile, ch2M hill was retained by B&W for BiM services, maintaining a continuously up-to-date record of the state of design and
CH2M HILL was brought in to model the B&W Pantex project in BIM after it had reached 95% CAD construction documents. The $1 million investment revealed more than 500 significant clashes, including ten “big ticket” items that independent auditors estimated could have cost up to $10 million to rework in the field.
case st
udy
Averting Problems on a Complex ProjectPantex HEPFAmArillo, TexAs
SmartMarket Report McGraw-Hill Construction 28 www.construction.com
continuedimag
es c
ourt
esy
of B
&W
Pan
tex,
cH
2M H
ill, d
oe
nn
SA
construction. although ch2M hill does not work directly for usace or Kiewit, it regularly exchanges information with the construction team to keep models accurate. fouché says that the construction team is not using its own construction model, but is feeding information back into the original design model, ultimately helping to create an accurate ongoing as-built model. “We’re helping to ensure transparency and better quality,” he says.
Working from the single model, designers and contractors can conduct 3d graphical navigation and database queries, including review and exploration of design options and proposed changes. ch2M hill also runs quantities, with special designation for items installed to date.

case st
udyT
he
Bu
sin
es
s V
alu
e o
f B
iM in
no
rT
h a
Me
ric
a: M
ulT
i-Y
ea
r T
re
nd
an
alY
sis
an
d u
se
r r
aT
ing
s (
2007
–201
2)
McGraw-Hill Construction 29 www.construction.com SmartMarket Report
imag
es c
ourt
esy
of B
&W
Pan
tex,
cH
2M H
ill, d
oe
nn
SA
Valuable Validationin february 2012, ch2M hill was engaged to assist in multiple vali-dation efforts on the project. The team checked all utility stub-ups that had been installed prior to installa-tion of the facility’s thick mat slab. fouché says B&W wanted to iden-tify missing stub-ups or stub-ups in the wrong locations before the slab was poured and it was too late to fix. The BiM team was able to identify 23 issues that needed to be resolved prior to installation of rebar and pour-ing concrete. fouché says that, while some of the issues were minor, some would have been major concerns if not caught at this stage.
The BiM team was also asked to assist in checking the steel rebar sub-mittal. The BiM team modeled all of the rebar in the mat slab and all of the concrete walls. The team found that the rebar design, as documented in the shop drawings, did not work cor-rectly, especially in complex areas such as the joints between two walls and the slab. during its checks, ch2M hill discovered missing rebar or pieces of rebar that were the wrong size. it also created 3d visuals of the modeled rebar to help with planning and installation in the field. fouché says that in many cases, the team
found that the rebar design was less complicated than previously thought.
The BiM team can also review schedule and sequencing from the model, allowing the team to better monitor construction progress including past progress and look-aheads. in July 2012, the BiM team was directed to produce a schedule simulation showing the baseline schedule against the actual schedule in a side-by-side comparison. fouché says that the actual schedule showed a slight deviance from the baseline schedule, but that B&W was
Pantex HEPFAmArillo, TexAs
continued
By continuing to keep an accurate design model updated with construction information, the model could have future uses, such as helping with facility start-up, training of staff and other post-occupancy tasks.
concerned that these numbers were hard to interpret and the significance hard to grasp. The team was tasked to create a movie of the schedule to provide a compelling visual that would help drive the point home. fouché says B&W also wanted to stress that while there was a current deviation that needed to be reported up the chain of command, that the current schedule showed significant periods of make-up resulting in construction ending on time. The BiM team was able to produce a movie showing the schedule in just a few hours, delivering the desired graphic to B&W on time for their reporting needs.
By continuing to keep an accurate design model updated with construction information, fouché says the model could have future uses, such as helping with facility start-up, training of staff and other post-occupancy tasks. n
Project Facts and Figures
ClientB&W Pantex
Construction Managerus army corps of engineers
ContractorKiewit construction
BIM Servicesch2M hill
Type of ProjectTesting facility
Construction Start2011
Occupancy2014
Cost$100 million
stats
Although not inte-grated contractually, the team exchanges information in BIM.

Th
e B
us
ine
ss
Va
lue
of
BiM
in n
or
Th
aM
er
ica
: Mu
lTi-
Ye
ar
Tr
en
d a
na
lYs
is a
nd
us
er
ra
Tin
gs
(20
07–2
012)
How did Autodesk become involved with BIM?bernstein: The idea now called building information modeling has been discussed for three decades. autodesk decided in 2001 to look at it in greater depth. There was a lot of dialog going on about productivity, refactoring project delivery; sustain-ability was coming to the fore; and computers were getting powerful enough to actually do it. in 2002 we acquired revit Technologies, which we thought was the kernel of the right idea. We created the term building information modeling to distinguish it from 3d graphics packages.
How has BIM impacted the industry?bernstein: it’s dramatic. Pre-BiM design technology was about representation. Thinking and analysis happened elsewhere. now it is all becoming integrated. You can apply analytical algorithms to models and really begin to reason about the design. Project teams can try to accomplish measurable outcomes as opposed to siloing everyone into their lowest first cost, defensive risk management positions. it’s a way of changing your business model, because you are more efficient, effective, and the value you’re able to deliver to the process is much greater.
What are the most important cur-rent BIM needs to most effec-tively advance the industry?
Phillip G. Bernstein, FAIA, RIBA, LEED AP
Vice President, Strategic Industry Relations, Autodesk, Inc.
Interview: Thought Leader
SmartMarket Report McGraw-Hill Construction 30 www.construction.com
bernstein: The approach to stan-dards has to change. a global inter-galactic interoperability super standard that all data somehow adheres to will never work. google is successful because they index every-thing. We need to make big piles of discontinuous data infinitely accessi-ble and indexable and searchable.
education also has to change. Technology is not just another imple-ment, like a belt sander in the wood-shop. our teaching methods have to take a different stance about the rela-tionship between technology and pedagogy because the means of representation is now shifting from drawing to something else. This is not a training issue.
and in technology, giving instan-taneous feedback on simulation analysis to a designer or builder by leveraging the cloud so they’re unconstrained by computation or storage problems starts to get really, really interesting.
How do you think BIM will change the industry over the next ten years?bernstein: Most traditional iconic project delivery models will still exist, but strongly influenced by integrative strategies. in cM-at-risk, for example,
a gMP will be much more robust because of the predictive qualities of BiM. Plus there will be stable, repeatable integrated project delivery models.
You’ll also see aec players in long-term, repeatable relationships, having reduced levels of friction through integrated strategies. and you are going to see some hyper-integrated delivery businesses, where [firms like] aecoM and Bal-four Beatty will have built their con-struction and design muscles such that it will no longer be possible to distinctly identify them as either designers or builders or, in some cases, operators. a lot of projects will be delivered through super one-stop shopping for complete end-to-end delivery, like what already exists in oil, gas and mining.
What are Autodesk’s future plans related to BIM?bernstein: We like our technologies to be just slightly ahead of our customers. The next five years will be about cloud, social and mobile technologies. aec professionals will need a wide variety of tools in a flexible and adaptive environment, and that’s very much what we are working on. n
“Pre-BIM design technology was about representation. Thinking and analysis happened
elsewhere. Now it is all becoming integrated. You can apply analytical algorithms to models
and really begin to reason about the design.”

Th
e B
us
ine
ss
Va
lue
of
BiM
in n
or
Th
aM
er
ica
: Mu
lTi-
Ye
ar
Tr
en
d a
na
lYs
is a
nd
us
er
ra
Tin
gs
(20
07–2
012)
da
ta BiM users’ investments in software, hardware, training and other requirements for a successful BiM program will vary depending on their level of BiM sophistication as well as their need to accommodate other competing demands for time and expense.
Technology InvestmentsCommunications infrastructure to improve model sharing—added to the survey in 2012—is the top target for 2014 investments. reflecting the need for collabor-ative teams to exchange large files fluidly and manage access rights to them among many firms, this is expected to grow substantially as mainstream technology firms try to adapt their platforms for use in the construction indus-try and BiM technology firms expand, refine or add this capability to their offerings.
■■ BIM training makes a big jump in the forecast as firms scramble to make their staff BiM-capable. Training is important for several reasons:• There is a direct relationship between skill level and ROI
(see pages 24–25). • Once firms have invested in software licenses and
hardware upgrades, training their BIM staff is critical to leverage those investments.
• Training is also vital for the influx of new users who need to get established with BIM.
as software becomes more complex, BiM training will probably increase as an investment priority with more specialized applications launched to use BiM data.
■■ BIM software and new/upgraded hardware are consis-tent priorities, although software shows steady decline over the three periods, perhaps because the bulk of initial license costs have been invested and ongoing maintenance requires less annual expenditure. hard-ware stays steady, a direct function of new hires and replacement of older equipment, but should decrease over time as new hardware becomes more powerful and less expensive. and, of course, both of these cate-gories are subject to economic conditions and firms’ backlog of projects.
■■ Software customization/interoperability solutions and developing custom 3d libraries both show large increases for 2014, after having both pulled back between 2009 and 2012. This makes sense because both improved interoperability between software applications and more 3d building product manufac-turer-specific content are top factors that users believe will improve their ability to benefit from BiM (see page 22 for more information).
BIM Adoption and Value: Investments
McGraw-HillConstruction 31 www.construction.com SmartMarket Report
BIM Investments
BIM Technology Investments (2009 – 2014)Source: McGraw-Hill Construction, 2012
31%
N/A
48%
Communications Infrastructure to Improve Model Sharing
BIM Training
39%
35%
43%
48%
43%
40%
37%
36%
39%
27%
25%
38%
29%
25%
32%
BIM Software
New or Upgraded Hardware
Software Customization/Interoperability Solutions
Develop Custom 3D Libraries
20122014
2009
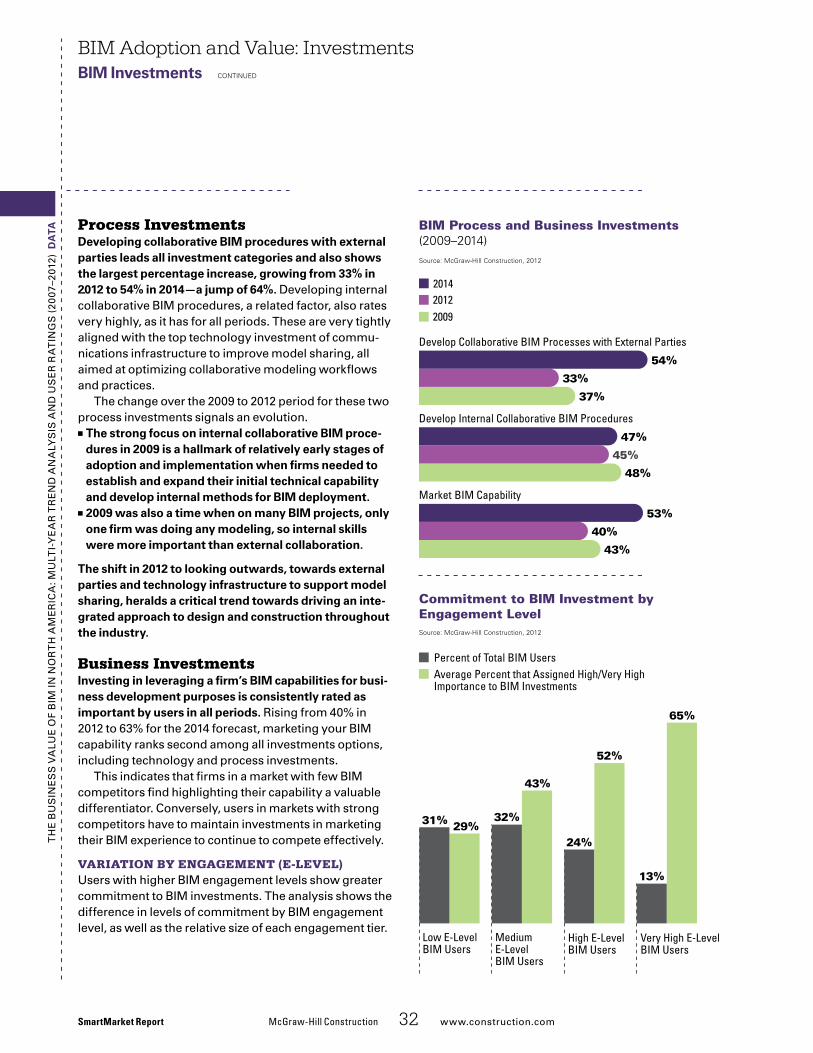
Th
e B
us
ine
ss
Va
lue
of
BiM
in n
or
Th
aM
er
ica
: Mu
lTi-
Ye
ar
Tr
en
d a
na
lYs
is a
nd
us
er
ra
Tin
gs
(20
07–2
012)
da
ta Process Investmentsdeveloping collaborative BIM procedures with external parties leads all investment categories and also shows the largest percentage increase, growing from 33% in 2012 to 54% in 2014—a jump of 64%. developing internal collaborative BiM procedures, a related factor, also rates very highly, as it has for all periods. These are very tightly aligned with the top technology investment of commu-nications infrastructure to improve model sharing, all aimed at optimizing collaborative modeling workflows and practices.
The change over the 2009 to 2012 period for these two process investments signals an evolution.
■■ the strong focus on internal collaborative BIM proce-dures in 2009 is a hallmark of relatively early stages of adoption and implementation when firms needed to establish and expand their initial technical capability and develop internal methods for BIM deployment.
■■ 2009 was also a time when on many BIM projects, only one firm was doing any modeling, so internal skills were more important than external collaboration.
the shift in 2012 to looking outwards, towards external parties and technology infrastructure to support model sharing, heralds a critical trend towards driving an inte-grated approach to design and construction throughout the industry.
Business InvestmentsInvesting in leveraging a firm’s BIM capabilities for busi-ness development purposes is consistently rated as important by users in all periods. rising from 40% in 2012 to 63% for the 2014 forecast, marketing your BiM capability ranks second among all investments options, including technology and process investments.
This indicates that firms in a market with few BiM competitors find highlighting their capability a valuable differentiator. conversely, users in markets with strong competitors have to maintain investments in marketing their BiM experience to continue to compete effectively.
Variation by EngagEmEnt (E-LEVEL)users with higher BiM engagement levels show greater commitment to BiM investments. The analysis shows the difference in levels of commitment by BiM engagement level, as well as the relative size of each engagement tier.
BIM Adoption and Value: InvestmentsBIM Investments cOnTInued
SmartMarket Report McGraw-HillConstruction 32 www.construction.com
BIM Process and Business Investments (2009–2014)Source: McGraw-Hill Construction, 2012
37%
33%
54%
48%
45%
47%
43%
40%
53%
20122014
2009
Develop Collaborative BIM Processes with External Parties
Develop Internal Collaborative BIM Procedures
Market BIM Capability
Very High E-LevelBIM Users
MediumE-LevelBIM Users
High E-Level BIM Users
Low E-LevelBIM Users
65%
13%
43%
32%
52%
24%29%31%
Commitment to BIM Investment byEngagement LevelSource: McGraw-Hill Construction, 2012
Percent of Total BIM UsersAverage Percent that Assigned High/Very High Importance to BIM Investments

Th
e B
us
ine
ss
Va
lue
of
BiM
in n
or
Th
aM
er
ica
: Mu
lTi-
Ye
ar
Tr
en
d a
na
lYs
is a
nd
us
er
ra
Tin
gs
(20
07–2
012)
da
ta On average, 65% of respondents in the top engage-ment tier assigned high/very high importance to the rated BIM investments, more than twice as many as the low engagement group (29%). This high level of BiM investment by the most engaged leaders is a tangible demonstration of the industry’s deepening commitment to BiM.
Variation by PLayEranalyzing the top investment predictions by firm type highlights both the common and unique perspectives between them.
■■ Marketing BIM Capability: ranked first or second across all player types, the importance of this invest-ment reflects the growing degree of competitive BiM capability across many markets, which raises the pres-sure on firms to find ways to make their BiM experience meaningful to prospective clients.
■■ Internal and External Collaboration Skills: collabora-tion skills are also considered important by all player types. architects and contractors are focused more on external processes, while engineers still prioritize internal skills, appropriate for their lower level of BiM maturity and the large number of recent adopters.
BIM Adoption and Value: InvestmentsBIM Investments cOnTInued
McGraw-HillConstruction 33 www.construction.com SmartMarket Report
Source: McGraw-Hill Construction, 2012
Architects Engineers Contractors
5. BIM Software 5. Software Customization/ Interoperability Solutions
5. Developing Internal Collaborative BIM Procedures
4. Developing Internal Collaborative BIM Procedures
4. Developing Collaborative Processes with External Parties
4. Communications Infrastructure to Improve Model Sharing
3. Developing Collaborative Processes with External Parties
3. Developing Internal Collaborative BIM Procedures
3. BIM Training
2. Communications Infrastructure to Improve Model Sharing
2. New or Upgraded Hardware 2. Marketing Your BIM Capability
1. Marketing Your BIM capability 1. Marketing Your BIM capability 1. Developing Collaborative Processes with External Parties
Top Forecasted 2014 BIM Investments by Player
■■ Communications Infrastructure to Improve Model Sharing: This investment is considered important by a higher percentage of architects and contractors, reflecting their relatively advanced BiM maturity and growing need for a robust collaborative platform.
■■ BIM training: Top factor for contractors only, which is consistent with contractors’ general commitment to training as a standard part of overhead.
■■ BIM Software and BIM Hardware: engineers, as newer adopters are still in the cycle of hardware upgrades. architects rate BiM software as fifth, prob-ably because, having been adopters for the longest time, they are focusing more on process improve-ments that leverage their technology investment.
■■ Software customization/interoperability solutions: This is a top factor for engineers only, again reflect-ing their state of BiM maturity where these issues require investment.

Th
e B
us
ine
ss
Va
lue
of
BiM
in n
or
Th
aM
er
ica
: Mu
lTi-
Ye
ar
Tr
en
d a
na
lYs
is a
nd
us
er
ra
Tin
gs
(20
07–2
012)
The best-laid plans often go awry in construction, but sacramento, ca-based sutter health was not will-
ing to accept that risk when building the new sutter Medical center castro Valley. The owner was under a strict state-mandated deadline to build a seismic-code-compliant replace-ment for its 55-year-old eden Medical center in castro Valley, ca. That forced the team to put the project on an accelerated schedule. To further complicate matters, sutter health had to work within a tight $320 mil-lion budget.
digby christian, senior project manager with sutter health’s facility planning and development depart-ment, determined that the project would not be possible under tradi-tional delivery methods. Baseline projections showed that traditional delivery would require at least seven years to design, permit and construct the facility. however, the project
had to open within five years. com-pared to similar facilities built in the san francisco Bay area, the pri-vately financed project’s budget was near the low end of what would be required to deliver such a project.
at the centerpiece of its develop-ment strategy, the owner opted for an innovative 11-party integrated project delivery (iPd) agreement to help ensure that it would get the quality facility it demanded, on time and on budget. To support its inte-grated approach, the team used building information modeling (BiM) extensively, bringing in designers, engineers, contractors and major subcontractors early to create coor-dinated models that would help track schedules, keep costs in check and drive precision fabrication.
The strategy paid off. With sutter Medical center castro Valley set to accept its first patients this winter, the team met its aggressive goals, delivering on budget and within its
five-year time frame—30% faster than forecast under traditional methods.
“integrated project delivery was the foundational concept that allowed us to pull this off,” christian says. “it would be very difficult to take as many big steps forward as we did unless you created an agreement where the team is collectively at risk for failure or reward.”
Early IntegrationBy bringing in team members early, christian says the team created better models and reduced its risks. “We were able to push the definition of what it means to finalize design. We put massive amounts of deci-sions into the design phase by using enhanced ways to model.”
The architect—Phoenix-based devenney group—and the general contractor—dPr construction of redwood city, ca—worked along-side key MeP engineers and trade contractors, fire protection ser-vices, and a lean/BiM project integra-tor, ghafari associates of dearborn, Mi, that was brought in to finalize a design that was fully coordinated and could be used for fabrication of criti-cal components.
leveraging its ability to gain early input from team members, a seven-week $350,000 validation study was conducted to better predict that the project could come in at cost and on budget. design started in october 2007, and the team had submitted construction documents for permit-ting by december 2008—a 15-month process. samir emdanat, manager of advanced technologies at gha-fari, estimates that, in california, proj-ects of this magnitude take two and a half to three years from beginning of
An innovative 11-party integrated project delivery team used BIM to help envision the $320-million Sutter Health Eden Medical Center in Castro Valley, California.
case st
udy
Integrated Design Helps Deliver Project with Tight Schedule and Budget
Sutter Medical Center Castro ValleyCastro Valley, California
SmartMarket Report McGraw-Hill Construction 34 www.construction.com
continuedimag
e co
urte
sy o
f Sut
ter H
ealth

case st
udyT
he
Bu
sin
es
s V
alu
e o
f B
iM in
no
rT
h a
Me
ric
a: M
ulT
i-Y
ea
r T
re
nd
an
alY
sis
an
d u
se
r r
aT
ing
s (
2007
–201
2)
McGraw-Hill Construction 35 www.construction.com SmartMarket Report
imag
e co
urte
sy o
f Sut
ter H
ealth
design to completed design, followed by two years in permitting. Permits for construction were received in six months for this project.
When the project broke ground in June 2009, the team had produced in excess of 25,000 electronic design documents using primarily BiM and BiM-related tools. More than 50 com-panies were able to access real-time data from any location.
after design was complete, the team continued to heavily lever-age the model through construc-tion. emdanat says early input from contractors and key trades led to high levels of detail in designs that allowed for accurate coordination. he estimates that a project of this scope would typically see in excess of 2,000 requests for information (rfi) under traditional delivery meth-ods. at completion, the project had 555 rfi, roughly 70% below tradi-tional baseline. By using modeling in
an iPd environment, christian says 55% of rfi were closed the same day that they were opened. another 20% were closed within a few days. “The designers were fully incentivized to follow this process through construc-tion,” he says.
compared to traditional baseline, christian says MeP and framing work saw a 60% reduction in rework and an 8% boost in productivity.
Prefabrication and PreassemblyThe team also pushed to maximize fabrication driven from the model. emdanat says structural steel, rebar, sheet metal, piping and major elec-trical conduit were all fabricated directly from the model. “shop draw-ings were created from the models after coordination,” he adds.
as a result, many trade contrac-tors and suppliers were able to pre-assemble systems before bringing them to the site. “construction waste was extremely low,” christian says. “There was virtually no cutting on site and very little welding.”
Because the medical center needed to accommodate critical technology with the facility, the team also added fabrication-level installa-tion models for major medical equip-ment. “That’s unusual on a hospital project, but when you talk to the team about the risk of not doing it, it becomes clear that should be the default,” christian says.
While BiM enhanced the team’s abil-ity to work together, christian says the iPd agreement prompted members to communicate better and seek solu-tions. Throughout construction, the team continued to validate its work against the model, helping it stay on top of any schedule or cost concerns.
although the project hit its budget and completion goals, christian says the project did see occasional slips in schedule. unlike in traditional delivery, christian says that if a trade contractor’s work started to fall behind, the team’s reaction was to find a collective solution to help regain schedule.
“That’s when a agreement like this [iPd] proves its value,” he says. “You can get by with a napkin agreement if things go well, but you need an agreement that really requires the team to stick together if things get challenging.”
in the end, the iPd team reaped the rewards, claiming 80% of possible incentives on the project. “This proved to be a much healthier environment for people to work in,” christian says. “setting up a project this way is incredibly rewarding, and it creates good morale around the project. it was a hard and challenging project, but that’s because the work was hard and challenging, not because a [traditional] contract encourages you to fight all the time.” n
Sutter Medical Center Castro ValleyCastro Valley, California
Project Facts and Figures
General ContractordPr construction
Architectdevenney group
Type of Projecthospital
Procurement Methodintegrated Project delivery
Construction StartJune 2009
Occupancyearly 2013
Size230,000 sq. ft.
Cost$320 million
stats
continued
At completion, the project had 555 RFI, roughly 70% below traditional baseline. By using modeling in an IPD environ-ment, 55% of RFI were closed the same day that they were opened. Another 20% were closed within a few days.

Th
e B
us
ine
ss
Va
lue
of
BiM
in n
or
Th
aM
er
ica
: Mu
lTi-
Ye
ar
Tr
en
d a
na
lYs
is a
nd
us
er
ra
Tin
gs
(20
07–2
012)
How did AISC get involved with BIM?cross: aisc was involved with BiM before BiM was BiM. in the 1990s we took a hard look at the entire struc-tural steel fabrication process. The emerging use of modeling and the exchange of data between dissimilar software packages came out as two factors that could certainly improve overall productivity, particularly if the information contained more than just dimensional data. We researched available standards and adopted cis/2, a very robust data-rich stan-dard specific to structural steel. We worked with software vendors for structural design and fabrication process control, and with the auto-mated equipment manufacturers on the shop floor, to encourage them all to implement cis/2. Most of them stepped up and did that. it was a very cooperative effort and certainly we need to give a lot of credit to those original pioneers that took that risk and moved our industry forward.
How has BIM impacted the structural steel industry?cross: [i see] an upward spiral where attention moves from mod-eling software to data exchanges to legal issues to business model issues and then back to software. and each time we’ve gone around that cycle, the design and construction indus-try together moves higher in terms of productivity through the use of BiM.
John Cross
Vice President, American Institute of Steel Construction (AISC)
Interview: Thought Leader
SmartMarket Report McGraw-Hill Construction 36 www.construction.com
What are the most important current BIM needs to most effectively advance the industry?cross: The business model portion of the cycle is what we need to focus on right now. We need to define the relationships and the compensation levels of the different disciplines that are involved to make sure that the economic gains from BiM are prop-erly allocated, both on the design and construction side, to those that have had expanded roles and responsibili-ties and are assuming additional risks because of being involved in BiM.
What do you see as the future for BIM over the next ten years?cross: certainly a higher level of automation where model informa-tion will flow directly to the shop floor, probably involving a greater use of robotic technology. equipment will start talking to other equipment on the shop floor and tracking things through the process. We’ll also see more modularization where larger components are prefabricated. struc-tural steel fabricators are uniquely positioned to be able to do that, and BiM will be critical in their process.
What are the AISC’s future plans related to BIM?cross: We’ve strengthened our commitment to BiM and model interoperability. We’re developing comprehensive data maps defin-ing the exchange of information both within the structural steel supply chain and the external links to other disciplines. We’re also developing a methodology that will allow con-formance to the ifc standard while still allowing and encouraging indi-vidual software developers to push that envelope with new extensions and new applications. We’re strongly committed to maintaining our involvement with buildingsMarT and the national BiM standard (nBiMs) to drive the overall process of BiM throughout the construction supply chain. chris Moor from aisc now chairs the nBiMs development committee. and we will continue to educate our members about the advantages of BiM and the practical aspects of implementing BiM in their individual operations. n
“[I see] an upward spiral where attention moves from modeling software to data exchanges to legal issues to business model issues and then back to software. And each time we’ve gone
around that cycle, the design and construction industry together moves higher in terms of
productivity through the use of BIM.”
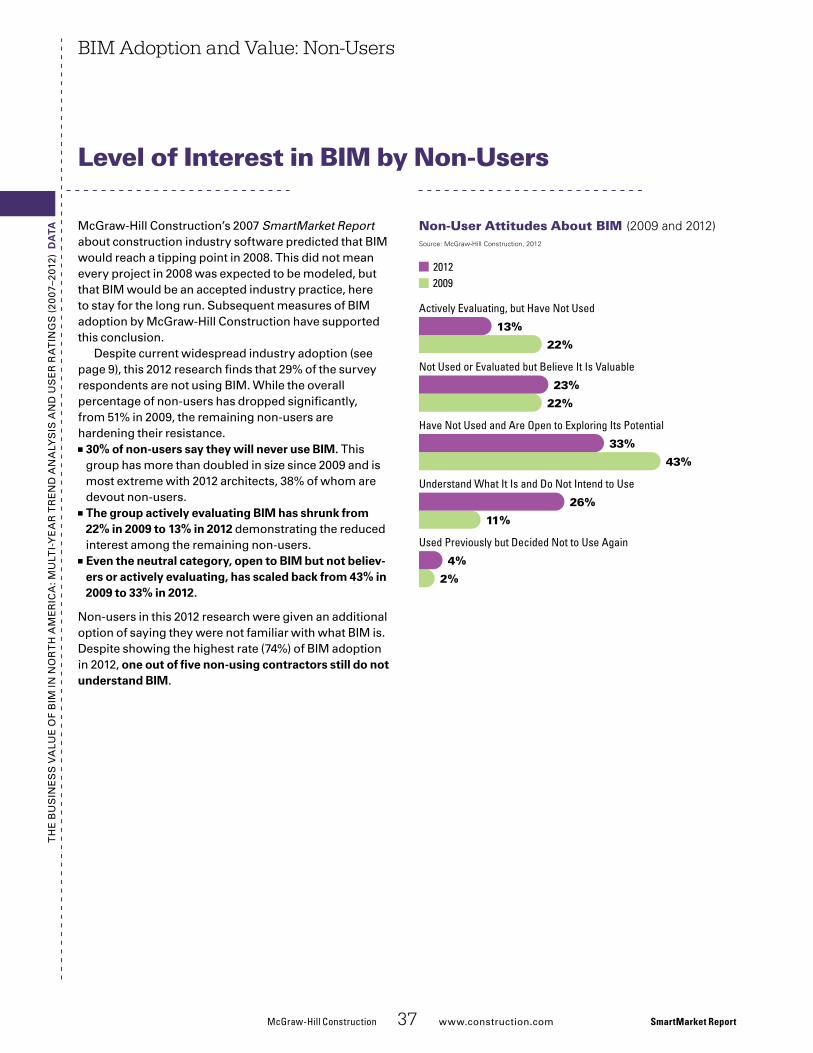
McGraw-HillConstruction 37 www.construction.com� SmartMarket Report
McGraw-Hill�Construction’s�2007�SmartMarket Report about�construction�industry�software�predicted�that�BIM�would�reach�a�tipping�point�in�2008.�This�did�not�mean�every�project�in�2008�was�expected�to�be�modeled,�but�that�BIM�would�be�an�accepted�industry�practice,�here�to�stay�for�the�long�run.�Subsequent�measures�of�BIM�adoption�by�McGraw-Hill�Construction�have�supported�this�conclusion.
Despite�current�widespread�industry�adoption�(see�page�9),�this�2012�research�finds�that�29%�of�the�survey�respondents�are�not�using�BIM.�While�the�overall�percentage�of�non-users�has�dropped�significantly,��from�51%�in�2009,�the�remaining�non-users�are��hardening�their�resistance.�
■■ 30% of non-users say they will never use BIM. This�group�has�more�than�doubled�in�size�since�2009�and�is�most�extreme�with�2012�architects,�38%�of�whom�are�devout�non-users.
■■ The group actively evaluating BIM has shrunk from 22% in 2009 to 13% in 2012 demonstrating�the�reduced�interest�among�the�remaining�non-users.�
■■ Even the neutral category, open to BIM but not believ-ers or actively evaluating, has scaled back from 43% in 2009 to 33% in 2012.
Non-users�in�this�2012�research�were�given�an�additional�option�of�saying�they�were�not�familiar�with�what�BIM�is.�Despite�showing�the�highest�rate�(74%)�of�BIM�adoption�in�2012, one out of five non-using contractors still do not understand BIM.
Level of Interest in BIM by Non-Users
TH
e�B
uS
INe
SS
�Va
lue
�of�
BIM
�IN�N
or
TH
�aM
er
ICa
:�Mu
lTI-
Ye
ar
�Tr
eN
D�a
Na
lYS
IS�a
ND
�uS
er
�ra
TIN
GS
�(20
07–2
012)
��da
TaBIM Adoption and Value: Non-Users
Non-User Attitudes About BIM (2009 and 2012)
AV-NU-ATTITUDES
Source: McGraw-Hill Construction, 2012
20092012
22%
13%
22%
23%
43%
33%
11%
26%
2%
4%
Not Used or Evaluated but Believe It Is Valuable
Actively Evaluating, but Have Not Used
Have Not Used and Are Open to Exploring Its Potential
Understand What It Is and Do Not Intend to Use
Used Previously but Decided Not to Use Again

TH
e�B
uS
INe
SS
�Va
lue
�of�
BIM
�IN�N
or
TH
�aM
er
ICa
:�Mu
lTI-
Ye
ar
�Tr
eN
D�a
Na
lYS
IS�a
ND
�uS
er
�ra
TIN
GS
�(20
07–2
012)
��da
Ta When�asked�to�rate�the�importance�of�reasons�for�not�adopting�BIM,�respondents�in�2012�gave�higher�ratings�to�ten�out�of�eleven�of�the�reasons�provided�as�options.This�strong�response�indicates�the�stiffening�resistance�among�the�remaining�non-adopters�to�BIM.
Lack of demand is the top reason in 2012, as it was in 2009.�although�demand�is�certainly�not�consistent�across�all�markets,�this�perception�may�also�mean�that�many�BIM�owners�are�only�dealing�with�BIM-knowledgeable�design-ers�and�contractors.�remaining�relevant�is�an�issue�for�non-users�as�more�owners�adopt.
other�trends�include:�■■ Software and hardware expense both increased significantly as reasons, probably�exacerbated�by�the�economy.�
■■ Belief that current methods are better and that BIM functionality is not relevant both increased. Though�understandable�for�certain�specialties,�it�is�a�weakening�argument�for�mainstream�design�and�construction�firms.
■■ Reasons related to training, content, interoperability with Cad, ease-of-use and liability all increased slightly but were selected by only one third of respondents.
■■ The only reason that became less of a challenge between 2009 and 2012 is not having sufficient time to evaluate BIM, perhaps�an�unintended�consequence�of�the�economy.�The�reduced�interest�in�this�reason�could�also�be�another�measure�of�the�increased�entrenchment�of�those�who�have�still�not�adopted�BIM,�with�a�greater�emphasis�on�active�reasons�rather�than�lack�of�action.
Variation by Playerarchitects�were�early�BIM�adopters.�as�such,��greater�familiarity�with�BIM�in�that�profession�may��also�lead�to�greater�resistance�among�those�who��have�still�not�adopted.
■■ architects express more concern than others about interoperability with Cad, software and hardware expense, difficulty of software use, insufficient train-ing available, inapplicable functionality and believing current methods are better.
■■ Engineers are most outspoken about lack of demand, and not having sufficient time to evaluate BIM.
■■ Owners object most to insufficient BIM-compatible content. ■■ Contractors report less challenges compared to other players, though they report lack of BIM content at the second highest level.
BIM Adoption and Value: Non-Users continued
SmartMarket Report McGraw-HillConstruction 38 www.construction.com
Reasons for Not Adopting BIM
Reasons for Not Adopting BIM According toNon-Users (2009 and 2012)Source: McGraw-Hill Construction, 2012
20092012
67%
78%
41%
57%
33%
47%
35%
42%
49%
40%
17%
34%
24%
34%
32%
33%
Not Enough Demand from Clients and/or Other Firms
Software Too Expensive
Required Hardware Upgrades Too Expensive
Functionality Not Suf�ciently Applicable to Job
Have Not Had Suf�cient Time to Evaluate It
Believe Current Methods Are Better
Insuf�cient Training Available
Insuf�cient BIM-Compatible Content Available
AV_NU_REASONS

TH
e�B
uS
INe
SS
�Va
lue
�of�
BIM
�IN�N
or
TH
�aM
er
ICa
:�Mu
lTI-
Ye
ar
�Tr
eN
D�a
Na
lYS
IS�a
ND
�uS
er
�ra
TIN
GS
�(20
07–2
012)
��da
Ta Competitor Use of BIM Non-users’�perception�of�the�extent�of�BIM�use�by�their�competitors�has�increased.�Over three quarters (76%) expressed awareness of competitors using BIM, up from 70% 2009.
Perception�of�how�much�BIM�their�competitors�are�doing�also�increased,�with�25%�now�seeing�moderate�to�very�high�competitive�usage,�up�significantly�from�15%�in�2009.�This�increased�sense�of�competitive�pressure�may�ultimately�counteract�the�hardening�resistance�found�among�2012�non-users�(see�page�37).��
Variation by Playerlooking�at�the�non-user�responses�by�firm-type�reveals�interesting�differences�in�their�perceptions.�
■■ Engineers have the strongest perception of compet-itors’ BIM activity, with almost two-thirds (63%) reporting at least light usage in their market.
■■ Engineers are also the only group among non-users perceiving any competitive activity at very high levels of implementation (more than 60% of projects).
■■ By contrast, non-using contractors are almost three times as likely to be totally unaware of competitive BIM activity compared to engineers—35% for contractors compared to 13% for engineers.
The�engineers’�heightened�awareness�of�BIM�use�in�the�industry�may�be�the�result�of�their�work�as�consultants�to�other�prime�design�firms�on�teams.�Through�their�contact�with�other�firms,�they�may�be�directly�exposed�to�the�BIM�activity,�though�not�participating�themselves.
Client Use of BIM architects,�engineers�and�contractors�also�perceive�higher�levels�of�BIM�use�by�current�and�prospective�clients:�
■■ 73% of 2012 non-users are aware of clients using BIM, up from 66% in 2009.
■■ The group perceiving high or very high levels of imple-mentation by clients (i.e., more than 30% of the client’s projects) almost doubled from 2009 to 2012, from 13% to 22%.
BIM Adoption and Value: Non-Users continued
McGraw-HillConstruction 39 www.construction.com� SmartMarket Report
AEC Perception: Competitor and Client Use of BIM
AV_NU_COMPETITOR
Source: McGraw-Hill Construction, 2012
20092012
1%
8%
14%
17%
55%
50%
30%
24%
30% or More of Projects
15% to 30% of Projects
Less Than 15% of Projects
Not at All
Perception of Competitors' Use ofBIM According to Non-Users (2009 and 2012)
Perceptions of Client Use of BIM According toNon-Users (2009 and 2012)Source: McGraw-Hill Construction, 2012
20092012
1%
2%
12%
20%
53%
52%
34%
27%
30% or More of Projects
15% to 30% of Projects
Less Than 15% of Projects
Not at All
AV_NU_CLIENT

TH
e�B
uS
INe
SS
�Va
lue
�of�
BIM
�IN�N
or
TH
�aM
er
ICa
:�Mu
lTI-
Ye
ar
�Tr
eN
D�a
Na
lYS
IS�a
ND
�uS
er
�ra
TIN
GS
�(20
07–2
012)
��da
Ta Non-BIM�users�rated�21�BIM�benefits�for�their�rela-tive�influence�on�potentially�convincing�them�to�adopt.�Divided�into�two�categories�(reducing�problems�and�increasing�beneficial�outcomes),�the�top�findings�from�each�indicate�what�non-users�are�looking�for�as�compel-ling�reasons�to�adopt�BIM.
Reducing Problems Reduced number of field coordination problems ranks first among all influential benefits,�and�aligns�closely�in�practice�with�two�other�top�ten�drivers—reduced�number�and�need�for�information�requests�and�improved�accu-racy�of�construction�documents.�There�are�enough�credible�metrics�available�from�a�variety�of�BIM�projects�to�demonstrate�that�these�BIM�benefits�can�reliably�be�achieved�by�a�new�adopter.�
Reduced construction costs and reduced construc-tion schedule were both reported by BIM users in this research study to have increased benefit levels between 2009 and 2012.�
Increasing Beneficial OutcomesMore�owners�demanding�BIM�on�their�projects�and�the�ability�to�win�new�business�or�maintain�repeat�business�are�two�sides�of�the�business�development�benefit�of�BIM.�Non-users�first�want�to�be�invited�to�adopt�BIM,�but�then�they�want�other�clients�to�hire�them�because�of�their�new�BIM�capabilities.�
other�beneficial�outcomes�include:■■ Improved communications between parties is a consistent theme throughout all aspects of the 2012 research. Though�difficult�to�measure�quantitatively,�its�beneficial�impacts�are�increasingly�appreciated,�and�case�studies�could�be�leveraged�to�demonstrate�BIM’s�value�in�this�area.
■■ Improved budgeting and cost estimating capabilities are being aggressively addressed by technology firms and�will�benefit�from�modeling�standards�that�define�data�in�deliverables.�Because�these�activities�are�so�criti-cal�to�contractors’�businesses,�however,�definitive�proof�of�reliability�is�necessary�before�a�non-user�would�adopt�BIM�for�this�reason.
■■ Reducing litigation and insurance claims is a highly tangible benefit, but will be difficult to demonstrate convincingly until many BIM projects are completed without problems.
BIM Adoption and Value: Non-Users continued
SmartMarket Report McGraw-HillConstruction 40 www.construction.com
Top BIM Benefits That Would Convince Non-Users to Consider adopting BIM
Top Bene�ts That Would In�uence Non-Users toConsider Adopting BIM (2009 and 2012)Source: McGraw-Hill Construction, 2012
20092012
68%
72%
70%
65%
55%
65%
71%
64%
59%
63%
66%
63%
53%
60%
61%
53%
44%
52%
50%
49%
Reduced Field Coordination Problems
Improved Communication Between All Parties
Shorter Time Drafting and More Time Designing
Improved Accuracy of Construction Documents
Reduced Construction Costs
More Owner Demand
Reduced Number and Need for Information Requests
Improved Budget and Cost Estimating Capabilities
Reduced Litigation and Insurance Claims
Reduced Construction Schedule

Section Hed1Data:
McGraw-HillConstruction 41 www.construction.com� SmartMarket Report
Section Hed1Data:T
he
�Bu
sin
es
s�V
alu
e�o
f�B
iM�in
�no
rT
h�a
Me
ric
a:�M
ulT
i-Y
ea
r�T
re
nd
�an
alY
sis
�an
d�u
se
r�r
aT
ing
s�(
2007
–201
2)��d
ata
IntroductiontoUserRatingsDataSection
M cgraw-hill�construction’s�2012�BiM�research�features�an�important�new�set�of�BiM�user�ratings�of�the�frequency,�value,�difficulty�and/or�impact�of�several�dozen�specific�BiM�activ-
ities�and�processes.�The�resulting�user�ratings�are:■■ User Ratings of BIM activities■■ User Ratings of BIM Processes
Indexes Used to Analyze the User Ratings ResearchMcgraw-hill�construction�developed�weighted�indexes�on�a�1–10�scale�for�each�BiM�activity�and�process�reflecting�users’�relative�attitudes.
■■ Frequency Index represents how often BIM users engage in the activity or BIM is used for a process.
■■ Value Index represents the relative level of value that BIM users receive from the activity or the use of BIM for the process.
■■ difficulty Index represents the relative degree of difficulty that BIM users face in achieving value from that activity or to use BIM for that process.
■■ Impact Index represents the beneficial impact that using BIM has on a process.
Value/Difficulty RatioThis�ratio�divides�the�value�index�by�the�difficulty�index�for�certain�BiM�activities�in�order�to�show�how�valuable�they�are�relative�to�how�hard�they�are�to�do.�The ratio is based on a scale where zero means the value and difficulty are equal. The ratio score for each activity is the percentage above or below that zero equilibrium point.
■■ a positive value/difficulty ratio means an activity creates a lot of value and is relatively easy to do.
■■ a negative ratio means an activity is harder to do than the value it generates.
Implications of the Indexes and Ratioa�BiM�activity�with�a�low�value/difficulty�ratio�ought�to�have�a�low�frequency�index�because�users�would�avoid�activities�harder�to�do�compared�to�the�value�they�gener-ate.�But�interestingly,�exceptions�occur,�and�these�indi-cate�a�strong�enough�commitment�to�the�value�of�the�BiM�activity�to�engage�in�it�frequently�in�spite�of�its�difficulty.�These�are�activities�requiring�industry�attention�to�improve�ease-of-use.��
conversely,�some�activities�with�a�very�positive�value/difficulty�ratio�are�still�not�widely�done,�indicating�a�poten-tial�for�rapid�growth�once�awareness�increases.�
User Ratings for Design and Construction
Data:
KeyFindingsintheUserRatingsDataSection
BIM ActIvItIes for DesIgn■■ Modeling the building envelope by architects is the most frequent BIM design activity and has the highest frequency index of any activity rated in this research.
■■ Interior space calculations and analysis has the most positive ratio between high value and low difficulty among design activities—and of all activities rated in this research.
■■ analyzing mechanical system performance by mechanical engineers is rated as the most difficult design activity.
■■ Structural analysis rates is among the most difficult activities, but very high frequency and value ratings indicate a critical need to make it easier to perform.
BIM ActIvItIes for constructIon■■ Spatial coordination dominates both the value and frequency ratings among team-oriented preconstruction activities.
■■ Quantity take-off is a fast-growing activity that will be accelerated by better modeling standards.
■■ Constructability analysis and job site logistics are contractors’ top-rated uses of BIM for their scope of work.
■■ Mechanical and structural are the leading uses of BIM for model-driven fabrication.
BIM Processes■■ On three quarters of the projects where archi-tects produce models, they are the only team member doing so.
■■ the highest level of model-sharing activ-ity is taking place between contractors and fabricators.
■■ Most owners, architects and engineers give strong ratings to accuracy, completeness and quality of models they receive from others.
■■ although the use of BIM for operations and maintenance/facility management processes is still emerging, its use to involve those staff in design review is an important trend.

SmartMarket Report McGraw-Hill Construction 42 www.construction.com
Th
e B
us
ine
ss
Va
lue
of
BiM
in n
or
Th
aM
er
ica
: Mu
lTi-
Ye
ar
Tr
en
d a
na
lYs
is a
nd
us
er
ra
Tin
gs
(20
07–2
012)
da
ta design-related activities with BiM are the most widespread and mature, with many practitioners at high experience and skill levels. These user ratings demonstrate the advanced state of certain activities and point towards more development to come in some emerging uses.
Modeling the Building EnvelopeBecause it is such a mature activity, it is not surprising that using BiM to model the building envelope receives an 8.2 frequency index, highest among all BiM activities rated in this research. it is especially popular with very high e-level users (9.6). it also features one of the most positive value/difficulty ratios (21%).
asked to identify the factors that impact the difficulty, the following percentages of architects rated the impor-tance of these specific challenges as high or very high:
■■ Software too hard to use: 67%■■ Hardware insufficient: 21%■■ available content insufficient: 65%■■ Internal skills insufficient: 52%
Base Building Design Activities
Position a Project on Its SiteThis use of BiM for this is also popular, with a frequency index of 5.9. its lower value/difficulty ratio (13%) may reflect the findings about the difficulty of getting modeled site information to use as a starting point.
Sustainability Rating and Life Safety/Code Analysisalthough many respondents see value in using BiM for these activities, few are doing them, even among the top e-level group. The high ratings by all users on the diffi-culty index explain the challenge. This clearly represents an opportunity for the industry to improve the usability of these tools and encourage more users to perform these valuable activities.
User Ratings: Design
BIM User Ratings for Base Building Design ActivitiesSource: McGraw-Hill Construction, 2012
21%
13%
-5%
-5%
8.2
5.9
2.1
1.8
Model the Building Envelope
Position a Project on Its Site
Sustainability Rating
Life Safety and CodeAnalysis/Validation
Frequency IndexValue/Dif�culty Ratio

Th
e B
us
ine
ss
Va
lue
of
BiM
in n
or
Th
aM
er
ica
: Mu
lTi-
Ye
ar
Tr
en
d a
na
lYs
is a
nd
us
er
ra
Tin
gs
(20
07–2
012)
da
ta as BiM use for base building design continues to advance, applying it to design and construction of inte-rior spaces is a natural extension. the interiors category is unusual because all the activities show very positive value/difficulty ratios, far exceeding the average 6% for all 25 rated activities. This suggests users are getting great value with relatively low effort for these activities.
Modeling Interior ConstructionThe frequency indexes for interior work also score well above the total research average of 3.6. use of BiM to model interior construction is particularly widely adopted with a frequency index of 7.2, not far behind modeling the building envelope (see page 42). This is logical because the activities are often conducted by the same staff, leveraging architectural training and detailing skills. The greatest challenge reported by architects is a lack of BiM content to support this type of work.
difficulty Index for architects Using BIM to Model Interior Construction
■■ Software too hard to use: 46%■■ Hardware insufficient: 14%■■ available content insufficient: 75%■■ Internal skills insufficient: 14%
User Ratings: Design continued
Interior Space Calculations and Analysis and Layouts and Space PlansThough performed slightly less frequently, these are still quite common activities and have strong value/difficulty ratios. layout and space planning rates especially well with top e-level users, reaching an 8.4 frequency index with that group. This suggests a learning curve for less experienced users that is holding back the overall scores, but as experience increases, use of these features should increase.
McGraw-Hill Construction 43 www.construction.com SmartMarket Report
Interior Planning and Construction Activities
BIM User Rating for Interior Planning and Construction ActivitiesSource: McGraw-Hill Construction, 2012
57%
52%
42%
40%
4.7
6.4
7.2
5.0
Interior Space Calculationsand Analysis
Layouts and Space Plans
Model Interior Construction
Validate Space Program
Frequency IndexValue/Dif�culty Ratio

Th
e B
us
ine
ss
Va
lue
of
BiM
in n
or
Th
aM
er
ica
: Mu
lTi-
Ye
ar
Tr
en
d a
na
lYs
is a
nd
us
er
ra
Tin
gs
(20
07–2
012)
da
ta Technical analysis remains a challenging aspect of BiM use, but will certainly gain importance as the data in models become more reliably consistent and the tools to conduct analysis become easier to use and more comprehensive.
Structural AnalysisThe use of modeled data for structural analysis has a healthy frequency index of 5.0, well over the 3.6 average, but it is one of the worst performers in the value/difficulty ratio (-19%). looking more closely at the data by respondents’ e-level shows that their assessment of difficulty increases with skill and experience, an opposite finding from almost every other BiM activity. The highest e-level users are very active (8.0 frequency index) and ascribe a very high value (9.0), but give structural analysis with BiM the most extreme difficulty index (9.5) of any rated activity.
Mechanical Systems Performancealthough mechanical engineers are active modelers for spatial coordination and fabrication, their use of BiM for analysis of mechanical systems performance shows the most negative value/difficulty ratio (-29%) of all 25 rated activities.
User Ratings: Design continued
SmartMarket Report McGraw-Hill Construction 44 www.construction.com
Technical Analysis Activities
Source: McGraw-Hill Construction, 2012
Dif�culty Index (1–10)
Value Index (1–10)
Frequency Index (1–10)
6.7
4.2
5
7.9
6.4
5.2
9.5
9
8
Very High E-Level AllLow E-Level
Structural Analysis Indexes According to Structural Engineers
BIM User Ratings for Technical Analysis ActivitiesSource: McGraw-Hill Construction, 2012
5%
3%
2%
-19%
-19%
-29%
6%
5.0
2.5
3.6
1.9
1.2
1.8
0.6
Frequency IndexValue/Dif�culty Ratio
Energy Use/Performance
Thermal Comfort Analysis
Lighting/Daylighting Analysis
Air�ow Analysis
Structural Analysis
Mechanical SystemPerformance Analysis
Average for All 25 Rated Activities
Other Technical Analysis■■ Energy use/performance by architects and engineers, lighting/daylighting analysis by electrical engineers and thermal comfort analysis by mechanical engineers all show slightly positive value/difficulty ratios, but are still well below average (3.6) in usage.
■■ airflow analysis (computational fluid dynamics) is least used by architects and engineers and is very difficult for the value received. This is definitely an emerging BiM activity, where further awareness and development of technology, processes and best practices is needed.

Th
e B
us
ine
ss
Va
lue
of
BiM
in n
or
Th
aM
er
ica
: Mu
lTi-
Ye
ar
Tr
en
d a
na
lYs
is a
nd
us
er
ra
Tin
gs
(20
07–2
012)
Professor in the Colleges of Architecture and Computer ScienceDirector, Digital Building Laboratory (DBL), Georgia Institute of Technology
Interview:Thought Leader
McGraw-HillConstruction 45 www.construction.com SmartMarket Report
HowdidyougetinvolvedwithBIM?Eastman: in 1970, i got a [national science foundation] contract at carnegie Mellon university to develop building model representation. Before BiM was invented as a term, we just called it 3d parametric modeling of buildings. The construction industry didn’t pick it up back then so i consulted to general Motors and Boeing on 3d solid modeling, but i was at the very beginning.
HowhasBIMimpactedtheconstructionindustry?Eastman Technology now is an important player in success or failure in architecture firms, in construction firms, in fabrication companies. it is very synergistic with lean construction methods for reducing costs and reducing errors.
i think it’s also attractive to young, smart people who see this is really exciting, not the old-fashioned industry it was a few years ago. When we were using construction documents, how many people on a whole construction team could really read those documents and interpret them at a level needed to build the building? not very many. now everything is visual—the 3d clash detection meetings in the irooms, the owner walkthrough of the details of a project. communication has been fundamentally changed. i think architectural drawings are like medieval, archival documents that
nobody can understand. They won’t need to understand them ten years from now.
WhatarethemostimportantcurrentBIMneedstomosteffectivelyadvancetheindustry?Eastman: There are two big needs. one is model checking to validate the information in a model that we’re relying on for estimation, scheduling and other critical functions. The second is better interoperability.
HowdoyouthinkBIMwillchangetheindustryoverthenexttenyears?Eastman: We’re going to see a big growth of offsite fabrication, even of custom, highly varied systems. That will impact scheduling, where it’s not three days or here’s the schedule for the week; we’ll have day-by-day scheduling or even less than that. deliveries will be just-in-time.
another thing will be heavy use of laser scanning for quality control and placement, not only in retrofit operations but in new ones. Tolerancing in reinforced concrete structures is an example. if you want a waterproof building, today’s one inch tolerances are not acceptable. With lasers we should be able to pin that down to 1/16 of an inch
or less. also, we’ll see a lot more design optimization with parametric modeling. now it’s viewed as a kind of research, but i think that’ll be really common.
WhataretheDigitalBuildingLab’sfutureplansrelatedtoBIM?Eastman: dBl is focused on developing new applications and uses of BiM, such as augmented reality to view a model through an iPad to see maintenance information about the mechanical equipment. or simulating the 4d construction process for better schedules and safer working conditions among multiple crews. We’re also improving [u.s. department of energy] energy analysis software to include an uncertainty factor when you do an energy simulation. and one of our core areas will continue to be interoperability using the ifc iso standards, particularly for structural steel, reinforced concrete and precast concrete. i think we’re in line for some revolutionary changes. n
Charles Eastman
“I think architectural drawings are like medieval, archival documents that nobody
can understand. They won’t need to understand them ten years from now.”

Th
e B
us
ine
ss
Va
lue
of
BiM
in n
or
Th
aM
er
ica
: Mu
lTi-
Ye
ar
Tr
en
d a
na
lYs
is a
nd
us
er
ra
Tin
gs
(20
07–2
012)
W ith the emergence of BiM as a tool for shar-ing intelligent models among team mem-
bers, several industry initiatives were launched in 2007 and 2008 to help better define the collaborative process.
given that many firms were just beginning to add BiM and BiM-related tools to their workflow, those initiatives generally established high-level standards and guidelines, allowing flexibility as technology and techniques evolved.
as BiM has become standard practice among a growing segment of the industry, teams have developed best practices and ventured into new applications of the technology, prompting several industry groups to update their BiM business standards and make them more comprehensive.
Contractsin august 2012, the aia produced a draft to update its digital practice docu-ments. Markku allison, resource archi-tect at aia, says that aia recognized by 2010 that it would need to look into updating its BiM-related documents.
“our typical drafting schedule is on a 10-year cycle, but that doesn’t work with something as new and transformative as BiM,” he says.
as part of its scope, allison says he expects the documents will better address various delivery methods. he notes that in a linear process, like design-bid-build, not all parties are typically working on a project when
BIM Standards Evolve with Greater BIM Use
Even when BIM was just emerging in the construction industry five years ago, practitioners already realized its potential for transformation and recognized the need for new contracts and standards. As BIM adoption becomes prevalent, greater efforts are being made on this front.
SmartMarket Report McGraw-Hill Construction 46 www.construction.com
Sidebar: Standards
agreements are first drafted.“You aren’t at a stage in the
project where it’s easy to delve into the detailed protocols,” he says. “The [proposed e203 draft] allows you to set the framework with regard to expectations with digital data and BiM, so that you can negotiate the scope of services based on assumptions of how you will use digital data and BiM on the project. When it makes the most sense, you sit down and set up the detailed protocols.”
allison says he expects the documents will better address emerging uses as well, such as post-construction purposes.
agc started a working group in 2012 focused on updating its consen-susdocs 301 BiM addendum, which was originally released in June 2008.
“The challenge at this point is to define what is the state of the art and how are people using it,” says Brian Perlberg, senior counsel at agc.
one critical area that is being considered for update is “level of reliance.” The current BiM addendum allows a party to choose between three levels of reliance:
■■ Each contributor represents that the dimensions in its contribution to a model are accurate and take precedence over the dimensions called out in the drawings or inferred from the drawing. Details and components that are not represented in a contribution to a model must be retrieved from the drawings.
■■ Each contributor represents that the dimensions in its contribu-tion to a model are accurate to the extent that the BIM execution plan specifies dimensions to be accu-rate, and all other dimensions must be retrieved from the drawings.
■■ Contributors make no repre-sentations with respect to the dimensional accuracy of their contribution to a model. A model can be used for reference only, and all dimensions must therefore be retrieved from the drawings.
Levels of DevelopmentThe agc BiMforum also has a work-ing group looking into expanding and refining the definitions of levels of development (lod) to help teams working in a BiM environment better understand expectations. The basic lod framework was established per the aia e202 document in 2008. since then, the five levels of lod have served as high-level guidelines for how to model.
Generally, users understand the different levels of development as:
■■ LOD 100 = Conceptual Design■■ LOD 200 = Schematic Design/Design Development
■■ LOD 300 = Construction Documents
■■ LOD 400 = Fabrication■■ LOD 500 = As-Built
But James Vandezande, principal at hoK and a member of the lod work-group, says those kinds of broad definition often cause confusion.
Th
e B
us
ine
ss
Va
lue
of
BiM
in n
or
Th
aM
er
ica
: Mu
lTi-
Ye
ar
Tr
en
d a
na
lYs
is a
nd
us
er
ra
Tin
gs
(20
07–2
012)
McGraw-Hill Construction 47 www.construction.com SmartMarket Report
Sidebar: Standards continued
“if anyone is using lod today in the context of sharing and collaborating on models, it’s problematic,” he says. “You can’t have any kind of contrac-tual or legal reliance on the data without more definition.”
The workgroup aims to further define what different levels of development mean for different disciplines. Vandezande expects the group to deliver a detailed lod specification that can be used by any team member to define individual expectations.
currently, Vandezande notes that some stakeholders are creating their own refined definitions. for example, the u.s. army corps of engineers (usace) released its Minimum Mod-eling Matrix (M3) in september 2012.
under usace’s M3, for example, lod 300 is defined as: “Model elements are modeled as specific assemblies accurate in terms of quantity, size, shape, location and orientation. non-geometric information may also be attached to model elements, accurate to the degree dimensioned or indicated on contract documents (i.e., a pump would be a generic pump of accurate size complete with connections and clearances for a complete system).”
Within each lod, M3 then uses a grading system where “a” means 3d and facility data; “B” means 2d and facility data; and “c” means 2d only.
While those definitions are helpful when working with a specific client, Vandezande says a universal specification is needed to have a broad impact. he expects that users will be able to include recognized industry-wide lod specifications within contracts to better define risk and improve model sharing.
The workgroup, which started in 2011, hopes to wrap up the lod project in 2013.
Implementation PlansThe computer integrated construction (cic) research Program at Penn state helped establish the need for teams to focus early on the end-product when it released its BiM Project execution Planning guide in 2007. The guide focuses on creating a BiM project execution plan to provide a structured procedure for planning and communication among the project team members.
in 2012, cic expanded its efforts to focus on the emerging needs of owners with its BiM Planning guide for facility owners. “The goal of the guide is to help an owner organization with planning an overall implementation strategy for BiM on an organizational level,” says John Messner, associate professor of architectural engineering at Penn state.
The new guide helps owners create a high-level strategy planning road map that would include BiM and a detailed implementation plan that can be developed by BiM implementers within the organization. another section of the guide focused on contracting strategies to enable owners to hire additional support for their BiM efforts.
Messner says the guide takes on what is arguably the most challenging aspect of BiM planning. “it’s difficult to change the way people execute facilities management. for BiM to be successful within an owner organization, that organization needs to look at the fundamental processes
they are performing and consider new ways to gain efficiencies. But it takes a culture shift and a process shift for organizations, which is not easy. There are legacy systems within owner organizations that have been in operations for decades. With an owner, you’re moving into a functioning organization and you need to convince them to alter that.” n

Th
e B
us
ine
ss
Va
lue
of
BiM
in n
or
Th
aM
er
ica
: Mu
lTi-
Ye
ar
Tr
en
d a
na
lYs
is a
nd
us
er
ra
Tin
gs
(20
07–2
012)
da
ta The user ratings for applying BiM to preconstruction activities that focus on team integration demonstrate the clear, practical relationship between value, difficulty and frequency for each activity.
Spatial Coordination This ranked as a top activity in Mcgraw-hill construc-tion’s 2009 BiM research, and the strong 2012 user ratings in both frequency and value-for-effort demonstrate its value to BiM users. Only 5% of respondents classify spatial coordination as very difficult and all users (100%) believe it has value, which gives it the second most posi-tive value/difficulty ratio (53%) among all activities rated.
already being used to some degree by 91% of respon-dents, spatial coordination is expected to see nearly universal use over the next few years as it is adopted as standard practice.
Quantity Take-Offa fast growing use of BiM, quantity take-off leverages the underlying database of information in a model, eliminating hours of manual counting work from printed plans. The quality of the model presents the largest challenge because the data need to be complete and accurate. as standards for level of development gain traction in the industry, this practice should become routine. (see page 46 for more information on level of development standards.)
User Ratings: Construction
Preliminary Design Phase BudgetingThe ability to bring more cost certainty in the early design stage may prove to be one of the most important ways that BiM will impact the design and construction industry. The current challenge is that BiM users find this budget-ing hard to do, driving a negative value/difficulty ratio. These challenges may reflect issues with the quality and quantity of information in early stage models.
4D Models for Relocations/Moves4d models, which are 3d models linked to schedule, are seeing relatively low frequency of use to plan phased sequences and occupancy in renovation, retrofit, additions or multi-project programs. Yet again, this is an example of strong perceived value outweighed by difficulty, thereby discouraging frequency. improving BiM skills and interoperability with scheduling tools will help this activity become standard, especially if demanded by owners.
5D Models with Costuniversally viewed as difficult, the integration of BiM models with schedule and cost data is one of the great promises of BiM. But at this point, even the very high e-level users are cautious, with only 8% believing it is easy or very easy. however, the seamless integration of geometry with schedule and cost data has the potential to be a fundamental value proposition of BiM in the future if its difficulty can be surmounted.
SmartMarket Report McGraw-Hill Construction 48 www.construction.com
Team Preconstruction Activities
BIM User Ratings for Team Preconstruction ActivitiesSource: McGraw-Hill Construction, 2012
53%
11%
-9%
-14%
-23% 1.2
6.8
3.5
3.1
1.8
Frequency IndexValue/Dif�culty Ratio
Spatial Coordination
Quantity Take-Off
Preliminary Design Phase Budgeting
4D Models for Relocations/Moves
5D Models with Cost
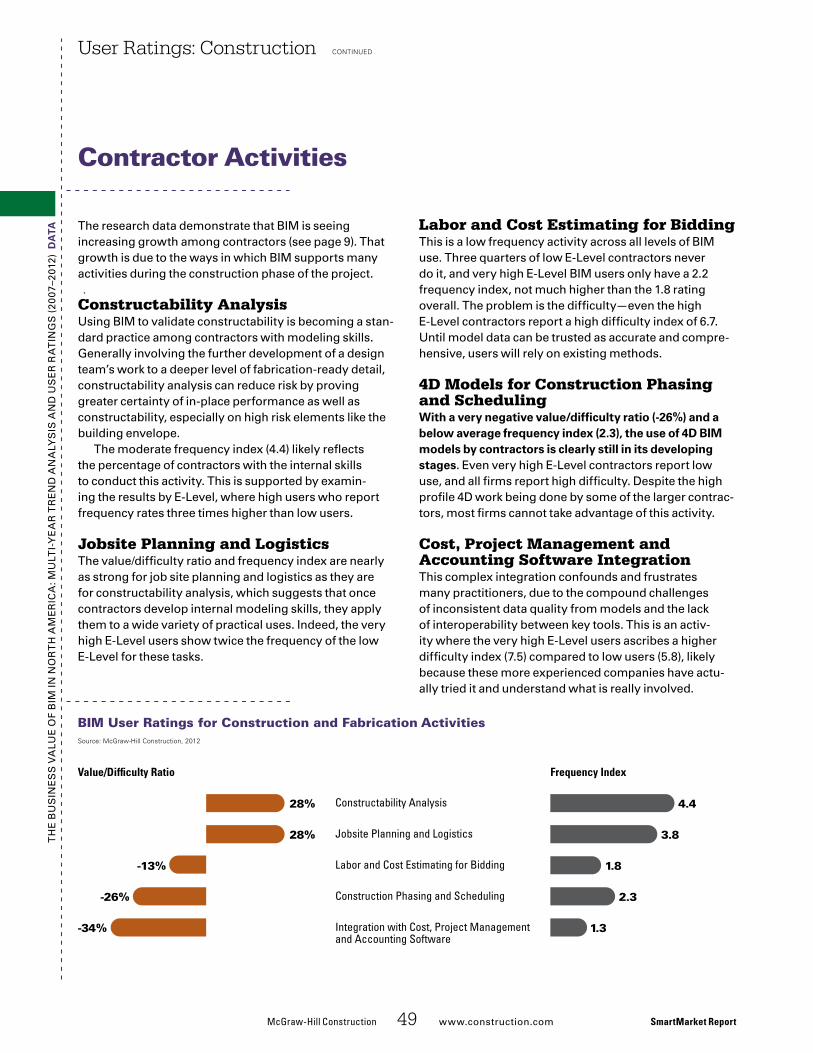
Th
e B
us
ine
ss
Va
lue
of
BiM
in n
or
Th
aM
er
ica
: Mu
lTi-
Ye
ar
Tr
en
d a
na
lYs
is a
nd
us
er
ra
Tin
gs
(20
07–2
012)
da
ta The research data demonstrate that BiM is seeing increasing growth among contractors (see page 9). That growth is due to the ways in which BiM supports many activities during the construction phase of the project.
Constructability Analysisusing BiM to validate constructability is becoming a stan-dard practice among contractors with modeling skills. generally involving the further development of a design team’s work to a deeper level of fabrication-ready detail, constructability analysis can reduce risk by proving greater certainty of in-place performance as well as constructability, especially on high risk elements like the building envelope.
The moderate frequency index (4.4) likely reflects the percentage of contractors with the internal skills to conduct this activity. This is supported by examin-ing the results by e-level, where high users who report frequency rates three times higher than low users.
Jobsite Planning and LogisticsThe value/difficulty ratio and frequency index are nearly as strong for job site planning and logistics as they are for constructability analysis, which suggests that once contractors develop internal modeling skills, they apply them to a wide variety of practical uses. indeed, the very high e-level users show twice the frequency of the low e-level for these tasks.
User Ratings: Construction continued
Labor and Cost Estimating for BiddingThis is a low frequency activity across all levels of BiM use. Three quarters of low e-level contractors never do it, and very high e-level BiM users only have a 2.2 frequency index, not much higher than the 1.8 rating overall. The problem is the difficulty—even the high e-level contractors report a high difficulty index of 6.7. until model data can be trusted as accurate and compre-hensive, users will rely on existing methods.
4D Models for Construction Phasing and SchedulingWith a very negative value/difficulty ratio (-26%) and a below average frequency index (2.3), the use of 4d BIM models by contractors is clearly still in its developing stages. even very high e-level contractors report low use, and all firms report high difficulty. despite the high profile 4d work being done by some of the larger contrac-tors, most firms cannot take advantage of this activity.
Cost, Project Management and Accounting Software IntegrationThis complex integration confounds and frustrates many practitioners, due to the compound challenges of inconsistent data quality from models and the lack of interoperability between key tools. This is an activ-ity where the very high e-level users ascribes a higher difficulty index (7.5) compared to low users (5.8), likely because these more experienced companies have actu-ally tried it and understand what is really involved.
McGraw-Hill Construction 49 www.construction.com SmartMarket Report
Contractor Activities
BIM User Ratings for Construction and Fabrication ActivitiesSource: McGraw-Hill Construction, 2012
28%
28%
-13%
-26%
-34% 1.3
4.4
3.8
1.8
2.3
Frequency IndexValue/Dif�culty Ratio
Constructability Analysis
Jobsite Planning and Logistics
Labor and Cost Estimating for Bidding
Construction Phasing and Scheduling
Integration with Cost, Project Managementand Accounting Software

Th
e B
us
ine
ss
Va
lue
of
BiM
in n
or
Th
aM
er
ica
: Mu
lTi-
Ye
ar
Tr
en
d a
na
lYs
is a
nd
us
er
ra
Tin
gs
(20
07–2
012)
da
ta one of the most exciting areas of BiM is the use of models for fabrication at a high degree of accuracy, often in off-site facilities where labor is less expensive and quality control can be enhanced. research published in the 2011 Prefabrication and Modular Construction SmartMar-ket Report demonstrates that prefabrication can lead to significant reductions in the project budget and schedule.
Model-Driven Fabrication by Trade■■ Mechanical contractors lead with mechanical systems and hangers in the top three most popular building elements for BIM-driven fabrication.
■■ Structural steel fabricators have a long and successful history with model-driven fabrication. (see page 36 to for more information on using BiM to support steel fabrication.)
using prefabricated toilet rooms has become more common recently, and it may be a precursor to use of BiM for prefabrication of larger and more sophisticated room-types, with buildings ultimately being assembled on site rather than constructed there. This emerging trend will have profound business impact for everyone. (see page 52 for more information on the potential benefits of wider use of modularization through BiM.)
User Ratings: Construction continued
SmartMarket Report McGraw-Hill Construction 50 www.construction.com
Model-Driven Fabrication
Contractors' Use of Models forDigital FabricationSource: McGraw-Hill Construction, 2012
78%
60%
60%
43%
36%
29%
26%
Mechanical, Plumbing, Fire Suppression Systems
Structural Steel
Hangers
Electrical, Data and Communications Systems
Toilet Rooms
Building Envelope Elements
Structural Concrete
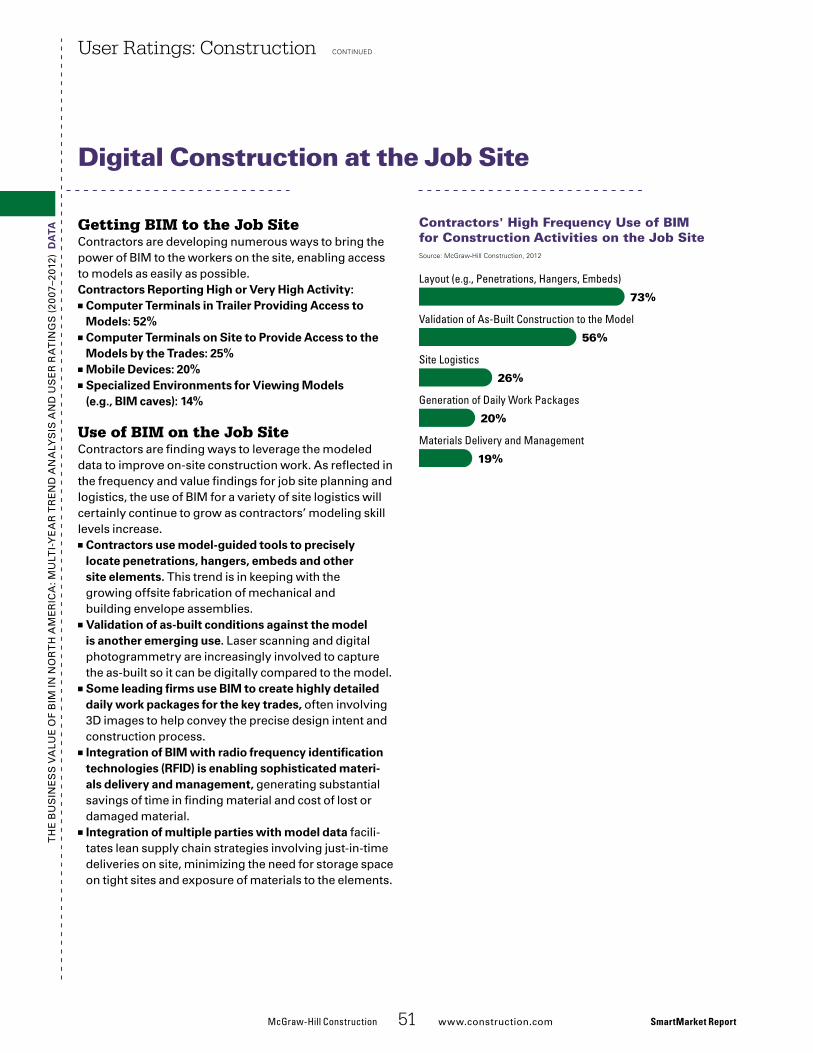
Th
e B
us
ine
ss
Va
lue
of
BiM
in n
or
Th
aM
er
ica
: Mu
lTi-
Ye
ar
Tr
en
d a
na
lYs
is a
nd
us
er
ra
Tin
gs
(20
07–2
012)
da
ta Getting BIM to the Job Sitecontractors are developing numerous ways to bring the power of BiM to the workers on the site, enabling access to models as easily as possible.Contractors Reporting High or Very High activity:
■■ Computer terminals in trailer Providing access to Models: 52%
■■ Computer terminals on Site to Provide access to the Models by the trades: 25%
■■ Mobile devices: 20%■■ Specialized Environments for Viewing Models (e.g., BIM caves): 14%
Use of BIM on the Job Sitecontractors are finding ways to leverage the modeled data to improve on-site construction work. as reflected in the frequency and value findings for job site planning and logistics, the use of BiM for a variety of site logistics will certainly continue to grow as contractors’ modeling skill levels increase.
■■ Contractors use model-guided tools to precisely locate penetrations, hangers, embeds and other site elements. This trend is in keeping with the growing offsite fabrication of mechanical and building envelope assemblies.
■■ Validation of as-built conditions against the model is another emerging use. laser scanning and digital photogrammetry are increasingly involved to capture the as-built so it can be digitally compared to the model.
■■ Some leading firms use BIM to create highly detailed daily work packages for the key trades, often involving 3d images to help convey the precise design intent and construction process.
■■ Integration of BIM with radio frequency identification technologies (RFId) is enabling sophisticated materi-als delivery and management, generating substantial savings of time in finding material and cost of lost or damaged material.
■■ Integration of multiple parties with model data facili-tates lean supply chain strategies involving just-in-time deliveries on site, minimizing the need for storage space on tight sites and exposure of materials to the elements.
User Ratings: Construction continued
McGraw-Hill Construction 51 www.construction.com SmartMarket Report
Digital Construction at the Job Site
Contractors' High Frequency Use of BIMfor Construction Activities on the Job SiteSource: McGraw-Hill Construction, 2012
Layout (e.g., Penetrations, Hangers, Embeds)
Validation of As-Built Construction to the Model
Site Logistics
Generation of Daily Work Packages
Materials Delivery and Management
73%
56%
26%
20%
19%

Th
e B
us
ine
ss
Va
lue
of
BiM
in n
or
Th
aM
er
ica
: Mu
lTi-
Ye
ar
Tr
en
d a
na
lYs
is a
nd
us
er
ra
Tin
gs
(20
07–2
012)
G reater team integration, more emphasis on lean techniques and increased use of 3d modeling
have helped support a surge in prefabrication and modularization. The 2011 Mcgraw-hill construction Prefabrication and Modularization: Increasing Productivity in the Construction Industry SmartMarket Report found that nearly all survey respondents (98%) expected to be doing prefabrication/modularization on projects by 2013. although the report showed that only a third of respondents were using it on a majority of projects, 45% expected to be using it at that level in 2013.
While many firms are perfect-ing preassembly, expanding into modularization can prove challeng-ing. Many trade contractors have been able to work from coordinated models to prefabricate portions of their own work, such as racks of pipes. however, modules typically incorporate elements from several trades and sometimes can be difficult to coordinate, depending on which trades take the lead.
Learning CurveBarry Brunet, virtual construction manager at Metairie, la-based Mcc group, says the company soon saw challenges after it put its first modular plan into action on a project in december 2011. Brunet says the lead designer and general contractor on the project did not incorporate modules into the initial design. instead, Mcc suggested
Modularization on the Rise
Modularization is still emerging as a practice, but firms with experience report better results when projects are planned from the beginning with modularization in mind.
SmartMarket Report McGraw-Hill Construction 52 www.construction.com
Sidebar: Modularization
the use of modules after it was brought onboard. “We probably over designed it,” he says. “at the time we didn’t have a lot of structural advice to go by, so we ended up wasting time and money on the front end that had to be redone.”
on its next four projects, the modular concept was part of the original design. “Those have gone much better,” he says. “everything is headed in the right direction because of the commitment we have from the entire team.”
Brunet says that when his team takes the lead, modular construction
can work regardless of how involved the design team is in the process, but the earlier it is incorporated into the design, the more cost-effective it will be for the client. “if the owner knows he wants modules before he even picks an architect, that would be ideal,” he says. “it gets less ideal as each day passes. after a job is coor-dinated, it’s way too late.”
Owning the Processscott Pittman, cad Manager at rK Mechanical in denver, co, says his company prefabricates nearly every-thing that comes out of its shop, and the firm is pushing toward greater use of modularization. currently, the company is able to fabricate mod-ules ranging from bathrooms to full “e-buildings.”
Pittman says the company sees high potential in modular solutions because it has significant in-house services, so it coordinates with fewer parties on modules. for example, the company has a subsidiary dedicated to fabricating and installing structural steel and miscellaneous metals. as a result, the company has been able to fabricate entire small modular build-ings, including water injection skids of up to 32ft. long by 16ft. wide that are used for oil extraction.
“We’re doing these skids for work that’s happening in the dakotas,” he says. “We can build them here in our shop [in colorado] with our own steel and have the electricians come here and install their equipment. it’s a con-trolled environment where we don’t have to work out in the snow and
Aditazz developed floor decks as com-ponents for use in its modular strategy.
Imag
e co
urte
sy o
f Adi
tazz

Th
e B
us
ine
ss
Va
lue
of
BiM
in n
or
Th
aM
er
ica
: Mu
lTi-
Ye
ar
Tr
en
d a
na
lYs
is a
nd
us
er
ra
Tin
gs
(20
07–2
012)
McGraw-Hill Construction 53 www.construction.com SmartMarket Report
Sidebar: Modularization contInued
the wind. Plus the labor rate in the oil fields is outrageous, so it’s more affordable.”
in general, Pittman says rK Mechanical likes to take the lead on modules, but it pushes to integrate and coordinate with the entire team. “We’ve gotten to the point where we are trying to get our people in with the mechanical engineers while they are drawing,” he says. “if we sit with them and they tell us what they want, we draw it once and we draw it right. if they do it, we end up redrawing, which is a waste of time with the time crunches we are under these days.”
One Model, Many Componentsaditazz of san Bruno, ca, sees mod-ularization as a critical component to its unique design and construction
strategy. The company is develop-ing a system based on computer chip design that would allow build-ing owners to simulate and virtually operate facilities during early design. This would help guide the design to ensure that a building meets owner demands, says Zig rubel, founder of aditazz. “architects are good at building the building right, but not always good at building the right building,” he adds.
To help keep costs down and improve reliability, aditazz is designing modular components as part of its system. Just as computer chip designers can add and subtract “logic gates” to virtually assemble their products before fabrication, aditazz aims to incorporate modular components early in its designs, knowing how those pieces will
function in the completed building. The company has focused on major repeatable pieces first, patenting a modular floor deck. rubel says the trick to making reliable decks is ensuring that they will be flat by pouring concrete in a controlled environment. The company also has a patent pending on a fire-rated wall assembly. “We realized that once you know you can make floors flat, you can treat walls like furniture,” he says.
The key difference with the adi-tazz approach is that it isn’t looking to sell its components to others. Just as with chip companies, aditazz aims to design buildings and drive fabri-cation of its own proprietary compo-nents. That way, rubel says a project team can work efficiently from one model. “at our company, we believe there should only be one model, and we want to own the data for our model. if we don’t, then we’ll con-stantly say it’s not our problem.”
That said, rubel recognizes that aditazz is not providing a fully inte-grated in-house solution and will partner with others who can help deliver its designs. rubel also says he is open to incorporating mod-ular components created by other companies, as long as they are stan-dardized and reliable. “The typical problem is [firms] come up with the design and then try to wrap the mod-ular concept around it.”
“We’re saying come up with the design with the modular solution in mind. it’s a kit of parts that need to be thought about at the beginning.” n
Aditazz claims that by developing flat decks, walls can be treated “like furniture.”
Imag
e co
urte
sy o
f Adi
tazz

Th
e B
us
ine
ss
Va
lue
of
BiM
in n
or
Th
aM
er
ica
: Mu
lTi-
Ye
ar
Tr
en
d a
na
lYs
is a
nd
us
er
ra
Tin
gs
(20
07–2
012)
How did NIBS get involved with BIM?smith: The institute started with the construction criteria Base, which then expanded into the Whole Build-ing design guide. These contained cad details, so the next obvious step was to develop the national cad standard. The international alliance for interoperability, north ameri-can chapter became part of the insti-tute, which was then combined with the facility information coun-cil and eventually became the build-ingsMarT alliance. it has been a natural succession from cad to BiM.
How has BIM impacted the industry?smith: The biggest thing about BiM is that it changes relationships. People look at this as a much more collaborative process. as a result, they need a greater level of trust in the information they get from other people. it’s a different relationship, truly a partnership type of environment.
What are the most important cur-rent BIM needs to most effec-tively advance the industry?smith: Most people are still prac-ticing “lonely BiM,” and they’re not necessarily communicating or inter-acting through models with other companies yet. some of that resis-tance has to do with liability and intellectual property concerns. con-sistent application of metadata to models will allow the intellectual
Dana Kennish “Deke” Smith, FAIA
Executive Director, Building Seismic Safety Council and buildingSMART alliance, National Institute of Building Sciences (NIBS)
Interview: Thought Leader
SmartMarket Report McGraw-Hill Construction 54 www.construction.com
property that somebody provides to the model to be continually attrib-uted to them. That’s really key to get to a higher level of trust between companies around models.
i think project delivery contracts have to change, whether we do more design-build, or even private-pub-lic partnerships where the builders actually run the building for some number of years.
The changes that have started in place with integrated project deliv-ery are very positive, but i think that we need to make sure that expands past the hand over stage to the facil-ity manager. so we’re doing a lot of work with [the international facility Management association] and [inter-national institute for sustainable lab-oratories] to get facility managers ready to accept BiM information.
How do you think BIM will change the industry over the next ten years?smith: The construction industry institute and lean construction insti-tute back in 2004 calculated there’s about 57% waste or non-value-added effort in the industry. i think we should be able to capture at least 30% of that, and potentially more.
What are NIBS’ future plans related to BIM?smith: our biggest initiative over the next five or ten years is the national BiM standard, which is only about 2% to 5% complete as of ver-sion 2. We’re also putting in place agreements with other countries for content and expertise we can draw on. Therefore, it won’t be just a u.s.-only solution. since many companies are multinational, we need interna-tional standards. a good example of that, of course, is ifc (industry foun-dation class—iso 16739).
There are 150 professional asso-ciations that play different roles in the development of a facility or infra-structure and we’re trying to build the alliances between the different organizations that will be the subject matter experts for the change. We see BiM expanding into infrastruc-ture quite rapidly right now, so we will be looking at tying into gis, too. another big area is manufactured products and how we’re going to work with the 250 or so manufactur-er’s associations.
i know we haven’t really seen the full impact of what BiM is going to do to the industry yet. once we can get all the currently disconnected suc-cesses linked together we will see profound change. n
“There’s about 57% waste or non-value-added effort in the industry. I think [by using BIM] we should be able to capture at least 30% of that—and potentially more.”

Th
e B
us
ine
ss
Va
lue
of
BiM
in n
or
Th
aM
er
ica
: Mu
lTi-
Ye
ar
Tr
en
d a
na
lYs
is a
nd
us
er
ra
Tin
gs
(20
07–2
012)
da
ta BiM users report very low frequency of use of formal inte-grated project delivery (iPd), which involves using an iPd agreement such as aia e202, consensus docs BiM amendment, or some other other sanctioned agreement.
however, many more BiM users are engaging in less formally structured integrated design processes, defined in the research as “establishing an openly discussed and mutually acknowledged understanding from the start of the project among key players that all parties will collabo-rate as much as possible to the benefit of the project.”
in practice, project teams are currently incorporating aspects of structured collaborative processes and shared goal-setting, but without the use of one of the standard agreements. some key differences among respondents:
■■ Variation by Player: engineers are among the players most frequently using a formal iPd. This may reflect the fact that there are several types of engineers engaged on a typical iPd project, resulting in a large number of respondents citing involvement.
■■ Variation by Engagement (E-Level): Very high e-level users demonstrate significant leadership in the use of an integrated design process, highlighting their willing-ness to innovate with contracting arrangements.
User Ratings: Processes
McGraw-HillConstruction 55 www.construction.com SmartMarket Report
BIM Team Use of Integrated Project Delivery
although an increasing number of BiM projects feature multiple firms generating models, there are still many BiM projects where only one firm is creating them. This practice is especially frequent with low e-level users, who show almost equal proportions of BiM authoring and solo BiM authoring. They may be venturing into BiM as a pioneer on a project where the rest of the team is still doing traditional cad. This type of team arrangement is sometimes referred to as “lonely BiM.”
Very high e-level companies, who author models on almost all of their projects, show a 4.7 frequency index for being the only ones modeling.
architects most frequently model compared to other players, but when they produce models on a project, they are the only one doing it three quarters of the time.
Authoring Models
BIM Team Use of Integrated Project Delivery Frequency Index (1–10)Source: McGraw-Hill Construction, 2012
Integrated Design ProcessIntegrated Project Delivery
2.8
0.9
2.1
0.7
2.0
0.9
2.4
0.7
1.8
0.5
Very High E-Level BIM Users
All Architects
All Engineers
All Contractors
Low E-Level BIM Users
Source: McGraw-Hill Construction, 2012
Only Firm Modeling on a ProjectAuthoring Models on Projects
4.7
8.8
6.2
8.4
3.2
6.9
3.9
5.2
3.7
3.8
Frequency of Authoring Models and Being the Only Team Member Modeling: Frequency Index (1–10)
Very High E-Level BIM Users
All Architects
All Engineers
All Contractors
Low E-Level BIM Users

Th
e B
us
ine
ss
Va
lue
of
BiM
in n
or
Th
aM
er
ica
: Mu
lTi-
Ye
ar
Tr
en
d a
na
lYs
is a
nd
us
er
ra
Tin
gs
(20
07–2
012)
da
ta Contractors share models more frequently than architects and engineers, especially between other contractors and fabricators. The lower value index (5.5) for sharing with other contractors and fabricators may be due to the need for even more of their peers to adopt BiM so that model-sharing can be universal. 26% of contractors do not currently use BiM, and of those, one in five still do not even know what BiM is. (see page 37 for more information.)
architects and engineers are the least likely to share their models, a common complaint by contrac-tors because it causes them additional work to recreate models from 2d deliverables that were originally authored in BiM. design firms have strong intellectual property concerns when it comes to project documents, including those created using BiM.
The least frequent process, architects/engineers sharing with trade contractors is the only category where the perceived value exceeds the frequency, indicating a possible trend towards increased collaborative activity directly between design firms and trades.
Variation by Engagement (E-Level)frequency index levels for model sharing with general contractors or construction managers vary strongly by engagement level:
■■ High E-Level architects/engineers: 5.8 compared to 4.3 on average
■■ all architects/engineers: 4.3 (average)■■ Low E-Level architects/engineers: 3.8
design firms with higher e-level ratings would be expected to collaborate more actively, thus accounting for their strong engagement level in this category. in addi-tion, the very high e-level design firms, whose behavior often predicts trends, are exchanging models with trade contractors at twice the frequency of their low e-level peers, while also reporting significantly more value.
User Ratings: Processes continued
SmartMarket Report McGraw-HillConstruction 56 www.construction.com
Model Sharing Processes between architects, Engineers, Contractors and Owners
Frequency and Value of Model SharingProcesses Between Architects, Engineers,Contractors and OwnersSource: McGraw-Hill Construction, 2012
Value Index (0–10)Frequency Index (0–10)
5.5
8.0
4.5
7.2
4.9
5.7
3.8
4.3
3.7
4.3
4.3
3.0
Contractors Sharing with Other Contractors/Fabricators
All Companies Sharing with All Other Companies
Contractors Receiving from Design Firms
Architects/Engineers Sharing with Owners
Architects/Engineers Sharing with CM or GC
Architects/Engineers Sharing with Trade Contractors
UR_PLAYERSHARING

Th
e B
us
ine
ss
Va
lue
of
BiM
in n
or
Th
aM
er
ica
: Mu
lTi-
Ye
ar
Tr
en
d a
na
lYs
is a
nd
us
er
ra
Tin
gs
(20
07–2
012)
da
ta The model-sharing infrastructure in the construction industry is still developing.
■■ Most firms are using ftp sites to exchange models, especially contractors.
■■ Commercial project and document management tools with web capability is next most frequently used method of sharing, especially by owners, a major target of the technology companies that produce project collaboration tools.
■■ Email attachments are used only by a small portion of respondents—the largest share is by contractors at only 25%. They are the least popular with owners, whose corporate iT departments usually limit large attachments.
■■ though tiny by comparison today, the emerging field of mobile devices will gain share as devices become more robust, connectivity is more reliable and functionality matures. as an indicator of this trend, very high e-level BiM users lead in their use.
User Ratings: Processes continued
McGraw-HillConstruction 57 www.construction.com SmartMarket Report
How Model Files Are Shared
Mobile Devices
Email Attachments
Project/DocumentManagement Software
ftp Sites
Source: McGraw-Hill Construction, 2012
Methods Frequently Used to Share Model Files Between Architects, Engineers, Contractors and Owners
Very High E-LevelBIM UsersAll OwnersAll ContractorsAll EngineersAll ArchitectsLow E-Level
BIM Users
48%
22%
5%
52%
32%
3%
55%
27%
13%
5%
35%
25%
9%
33%
8%
6%
57%
38%
15%19% 19%
66%
52%
11%

Th
e B
us
ine
ss
Va
lue
of
BiM
in n
or
Th
aM
er
ica
: Mu
lTi-
Ye
ar
Tr
en
d a
na
lYs
is a
nd
us
er
ra
Tin
gs
(20
07–2
012) When an owner runs the
premiere research lab-oratory for renewable energy in the u.s., it
seems only fitting that energy effi-ciency would be the top priority when delivering a new facility. With devel-opment of the $135-million energy systems integration facility (esif) on the u.s. department of energy’s national renewable energy labora-tory (nrel) campus in golden, co, the design-build team faced a daunt-ing energy-performance-based guarantee that compelled the team to prove its work against energy models on an ongoing basis.
Throughout design and construc-tion, the team, led by contractor Je dunn construction with smith-groupJrr as lead designer, lever-aged its extensive BiM modeling data to prove the 182,500-sq.ft. facility could meet nrel’s strict standards.
under terms of its firm fixed-price contract, the team faces seven per-formance validation milestones throughout the project lifecycle, beginning at the end of preliminary design and ending at 12 months post-occupancy. The project is scheduled for occupancy in early 2013.
“This is one of the most complex and detailed energy models that one would ever build to validate a design,” says rodd Merchant, senior vice president at Je dunn. “We had to prove everything at every step along the way. it required volumes of information, and the energy model had to be directly extracted from the BiM model.”
One-of-a-Kind Facilitiesadding to the challenge, the team had to build one-of-a-kind facilities and accommodate
high-performance equipment with large-scale energy demands. The facility includes a high-bay electri-cal research lab, which will be used to conduct megawatt-scale testing of electrical grids. When completed, it will be the first facility of its kind in the u.s.
The esif will also house a high-performance data center. at ini-tial build out, it will demand 1.5MW of power, but it is capable of up to 10MW. The data center is designed to be among the most energy efficient in the world.
energy-efficient office spaces are also being built.
■■ Energy conservation strategies include:• Reuse of data center and high-
bay laboratory waste energy to maximize building/campus heating.
• Transfer of electrical energy from experiments between laboratories for simultaneous use/reuse.
• Underfloor air distribution for interior cooling and ventilation; outside air economizer
• Active radiant beams providing perimeter cooling and heating
• Evaporative-based central cooling that meets ASHRAE 55 thermal comfort range
• Natural ventilation mode with operable windows and ventilation shafts
• Daylighting with high efficiency lighting (daylighting only from 10 AM to 2 PM)
• Energy Star-rated equipment
Tight Coordination and a Clear PlanMerchant says the team’s goals could only be achieved through tight inte-gration and a clear BiM execution plan. nrel chose to select its design-build team through a competition, so the design sub-consultants along with electrical and mechanical sub-contractors were brought in “from
The $135-million Energy Systems Integration Facility project required high standards for sustainability. The design-build team, led by contractor JE Dunn construction with SmithGroupJRR as lead designer, leveraged its extensive BIM modeling data to build a highly-complex energy model, proving its work on an ongoing basis.
case st
udy
Guaranteed Energy Performance Through Modeling and Coordination
Energy Systems Integration Facility, National Renewable Energy LaboratoryGoldEn, Colorado
SmartMarket Report McGraw-Hill Construction 58 www.construction.com
coNTiNUEDimag
es c
ourt
esy
of J
E D
unn
con
stru
ctio
n c
ompa
ny
and
Sm
ithG
roup
JJR
.
Th
e B
us
ine
ss
Va
lue
of
BiM
in n
or
Th
aM
er
ica
: Mu
lTi-
Ye
ar
Tr
en
d a
na
lYs
is a
nd
us
er
ra
Tin
gs
(20
07–2
012)
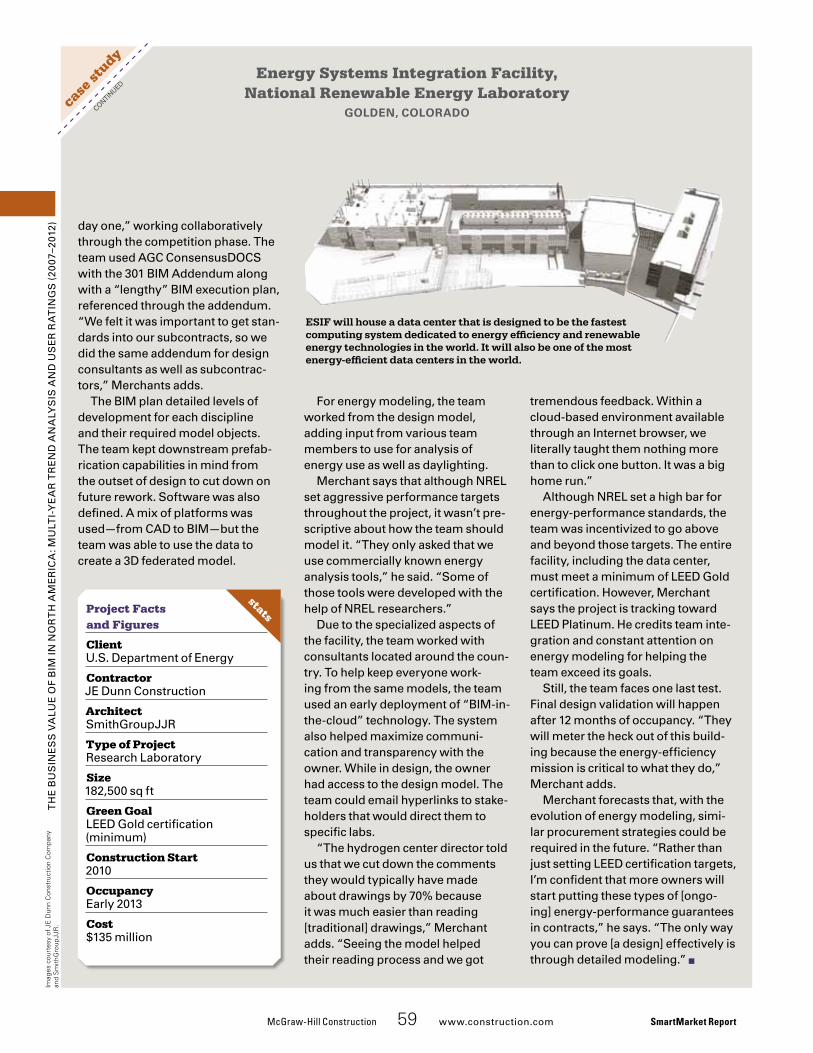
case st
udyT
he
Bu
sin
es
s V
alu
e o
f B
iM in
no
rT
h a
Me
ric
a: M
ulT
i-Y
ea
r T
re
nd
an
alY
sis
an
d u
se
r r
aT
ing
s (
2007
–201
2)
McGraw-Hill Construction 59 www.construction.com SmartMarket Report
imag
es c
ourt
esy
of J
E D
unn
con
stru
ctio
n c
ompa
ny
and
Sm
ithG
roup
JJR
.
day one,” working collaboratively through the competition phase. The team used agc consensusdocs with the 301 BiM addendum along with a “lengthy” BiM execution plan, referenced through the addendum. “We felt it was important to get stan-dards into our subcontracts, so we did the same addendum for design consultants as well as subcontrac-tors,” Merchants adds.
The BiM plan detailed levels of development for each discipline and their required model objects. The team kept downstream prefab-rication capabilities in mind from the outset of design to cut down on future rework. software was also defined. a mix of platforms was used—from cad to BiM—but the team was able to use the data to create a 3d federated model.
for energy modeling, the team worked from the design model, adding input from various team members to use for analysis of energy use as well as daylighting.
Merchant says that although nrel set aggressive performance targets throughout the project, it wasn’t pre-scriptive about how the team should model it. “They only asked that we use commercially known energy analysis tools,” he said. “some of those tools were developed with the help of nrel researchers.”
due to the specialized aspects of the facility, the team worked with consultants located around the coun-try. To help keep everyone work-ing from the same models, the team used an early deployment of “BiM-in-the-cloud” technology. The system also helped maximize communi-cation and transparency with the owner. While in design, the owner had access to the design model. The team could email hyperlinks to stake-holders that would direct them to specific labs.
“The hydrogen center director told us that we cut down the comments they would typically have made about drawings by 70% because it was much easier than reading [traditional] drawings,” Merchant adds. “seeing the model helped their reading process and we got
tremendous feedback. Within a cloud-based environment available through an internet browser, we literally taught them nothing more than to click one button. it was a big home run.”
although nrel set a high bar for energy-performance standards, the team was incentivized to go above and beyond those targets. The entire facility, including the data center, must meet a minimum of leed gold certification. however, Merchant says the project is tracking toward leed Platinum. he credits team inte-gration and constant attention on energy modeling for helping the team exceed its goals.
still, the team faces one last test. final design validation will happen after 12 months of occupancy. “They will meter the heck out of this build-ing because the energy-efficiency mission is critical to what they do,” Merchant adds.
Merchant forecasts that, with the evolution of energy modeling, simi-lar procurement strategies could be required in the future. “rather than just setting leed certification targets, i’m confident that more owners will start putting these types of [ongo-ing] energy-performance guarantees in contracts,” he says. “The only way you can prove [a design] effectively is through detailed modeling.” n
Energy Systems Integration Facility, National Renewable Energy Laboratory
GoldEn, ColoradocoNTiNUED
ESIF will house a data center that is designed to be the fastest computing system dedicated to energy efficiency and renewable energy technologies in the world. It will also be one of the most energy-efficient data centers in the world.
Project Facts and Figures
Clientu.s. department of energy
Contractor Je dunn construction
ArchitectsmithgroupJJr
Type of Projectresearch laboratory
Size182,500 sq ft
Green Goalleed gold certification (minimum)
Construction Start2010
Occupancyearly 2013
Cost$135 million
stats
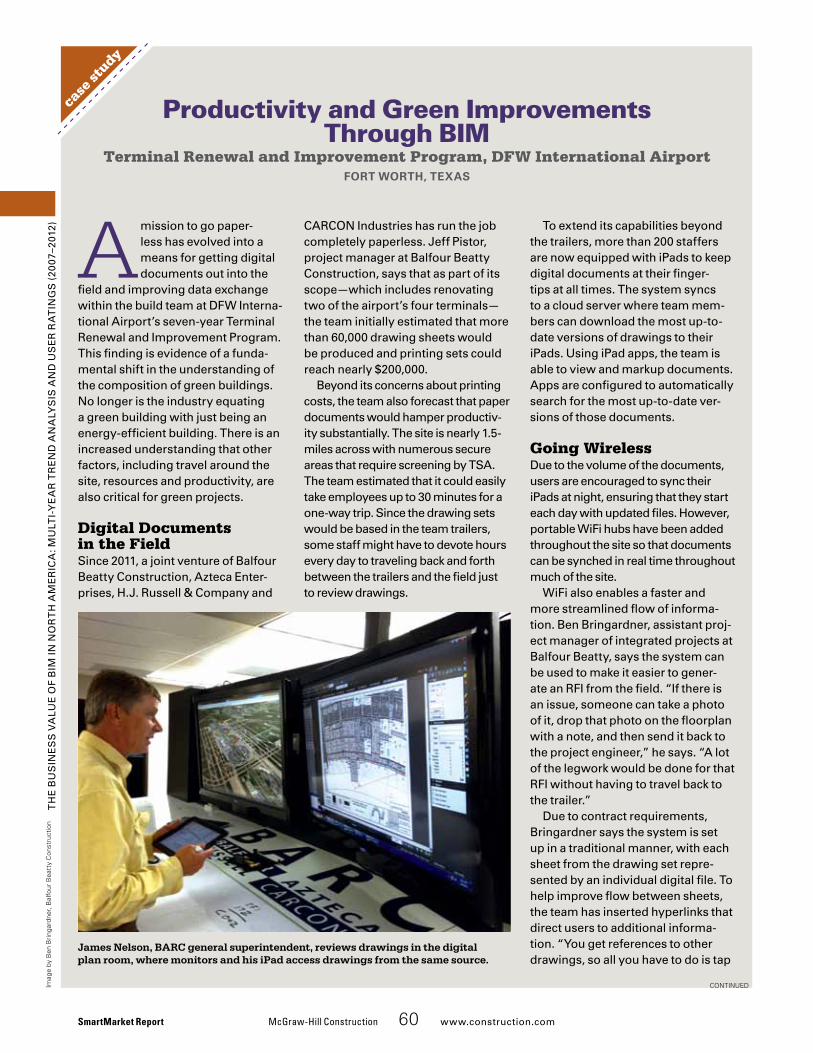
Th
e B
us
ine
ss
Va
lue
of
BiM
in n
or
Th
aM
er
ica
: Mu
lTi-
Ye
ar
Tr
en
d a
na
lYs
is a
nd
us
er
ra
Tin
gs
(20
07–2
012) A mission to go paper-
less has evolved into a means for getting digital documents out into the
field and improving data exchange within the build team at dfW interna-tional airport’s seven-year Terminal renewal and improvement Program. This finding is evidence of a funda-mental shift in the understanding of the composition of green buildings. no longer is the industry equating a green building with just being an energy-efficient building. There is an increased understanding that other factors, including travel around the site, resources and productivity, are also critical for green projects.
Digital Documents in the Fieldsince 2011, a joint venture of Balfour Beatty construction, azteca enter-prises, h.J. russell & company and
carcon industries has run the job completely paperless. Jeff Pistor, project manager at Balfour Beatty construction, says that as part of its scope—which includes renovating two of the airport’s four terminals—the team initially estimated that more than 60,000 drawing sheets would be produced and printing sets could reach nearly $200,000.
Beyond its concerns about printing costs, the team also forecast that paper documents would hamper productiv-ity substantially. The site is nearly 1.5-miles across with numerous secure areas that require screening by Tsa. The team estimated that it could easily take employees up to 30 minutes for a one-way trip. since the drawing sets would be based in the team trailers, some staff might have to devote hours every day to traveling back and forth between the trailers and the field just to review drawings.
To extend its capabilities beyond the trailers, more than 200 staffers are now equipped with iPads to keep digital documents at their finger-tips at all times. The system syncs to a cloud server where team mem-bers can download the most up-to-date versions of drawings to their iPads. using iPad apps, the team is able to view and markup documents. apps are configured to automatically search for the most up-to-date ver-sions of those documents.
Going Wirelessdue to the volume of the documents, users are encouraged to sync their iPads at night, ensuring that they start each day with updated files. however, portable Wifi hubs have been added throughout the site so that documents can be synched in real time throughout much of the site.
Wifi also enables a faster and more streamlined flow of informa-tion. Ben Bringardner, assistant proj-ect manager of integrated projects at Balfour Beatty, says the system can be used to make it easier to gener-ate an rfi from the field. “if there is an issue, someone can take a photo of it, drop that photo on the floorplan with a note, and then send it back to the project engineer,” he says. “a lot of the legwork would be done for that rfi without having to travel back to the trailer.”
due to contract requirements, Bringardner says the system is set up in a traditional manner, with each sheet from the drawing set repre-sented by an individual digital file. To help improve flow between sheets, the team has inserted hyperlinks that direct users to additional informa-tion. “You get references to other drawings, so all you have to do is tap
James Nelson, BARC general superintendent, reviews drawings in the digital plan room, where monitors and his iPad access drawings from the same source.
case st
udy
Productivity and Green Improvements Through BIM
Terminal Renewal and Improvement Program, DFW International AirportFort Worth, texas
SmartMarket Report McGraw-Hill Construction 60 www.construction.com
continuedimag
e by
Ben
Brin
gard
ner,
Bal
four
Bea
tty
con
stru
ctio
n

case st
udyT
he
Bu
sin
es
s V
alu
e o
f B
iM in
no
rT
h a
Me
ric
a: M
ulT
i-Y
ea
r T
re
nd
an
alY
sis
an
d u
se
r r
aT
ing
s (
2007
–201
2)
McGraw-Hill Construction 61 www.construction.com SmartMarket Report
imag
e by
Ben
Brin
gard
ner,
Bal
four
Bea
tty
con
stru
ctio
n
the link and it will take you there,” he says. “if you need a section cut, just tap the link. it’s a spider web of information.”
User Friendlyin developing the mobile system, the primary consideration was speed and user experience. Bringardner says it uses a time-based standard to determine maximum file sizes. “if a superintendent has to wait more than ten seconds for a file to open, they will lose patience with it,” he says.
as a result, the team uses primarily Pdf files among the team, which can be kept relatively compact and are easy to use. still, the team is experimenting with emerging mobile apps for sharing BiM models, but Bringardner says the team faces a perception barrier. “Models can be complex, so it’s assumed that it’s difficult to navigate through one,” he says. “But that’s not true. almost everyone could learn to do basic navigation, but they are resistant.”
given that Pdfs seem more approachable to users, Bringard-ner says that 3d Pdf would be ideal. however he notes that apps haven’t been developed to read the files yet.
The strategy quickly reaped significant savings in both time and money. To date, more than 200 iPads have been purchased for the team. Bringardner estimates that by not keeping two full sets of printed drawings—representing around 780,000 pages—during the life of the project, Balfour Beatty saved around $180,000. That estimate does not take into account potential savings for subcontractors, owner representatives, designers and other parties that use iPads.
The time-savings is even more sig-nificant. given the amount of time it can take to drive around the site, Brin-gardner says workers can save hours by not having to return to the trailers to review plans. for example, qual-ity control staff save up to two hours per day in travel time that they can instead use to address issues in the field, he says.
as part of an roi study of the system, Balfour Beatty estimated the maximum time required to payback the cost of an iPad. if a user saved two hours in travel time per week, used the most expensive server and took advantage of full iT support, the most expensive iPad available would be paid off in six months.
“That doesn’t even account for reduction of errors in the field and improved communications,” Brin-gardner adds. “We know these pay off much faster on average if you consider all the factors.” n
Terminal Renewal and Improvement Program, DFW International Airport
Fort Worth, texascontinued
Making images like these available on the iPad facilitates communication with the field. In this shot from above the airline ticket office, the team was working out a particular power path and needed to communicate its intent clearly to the installer.
Project Facts and Figures
ProjectdfW international airport Terminal renewal and improvement Program, Terminal a and c renovations, new rail station
Joint VentureBarc- Balfour Beatty con-struction, azteca enterprises, h.J. russell & company and carcon
Program Managerfreese and nichols
Type of Projectairport
Construction Start2011
Contract Value$900 million
stats

Th
e B
us
ine
ss
Va
lue
of
BiM
in n
or
Th
aM
er
ica
: Mu
lTi-
Ye
ar
Tr
en
d a
na
lYs
is a
nd
us
er
ra
Tin
gs
(20
07–2
012)
da
ta architects, engineers and especially owners give good marks to the accuracy, completeness and quality of models they receive from others. This is consistent across all e-levels. some notable differences in ratings:
■■ Engineers and contractors are less enthusiastic on rating the overall usefulness of others’ models to their business processes. This may reflect poor coordina-tion around expectations and requirements for levels of development (lod) of the incoming models.
■■ Receiving a model with a designated LOd is not rated very highly, with 20% or fewer aEC firms rating it high or very high. engineers report the lowest at 13%. The exception to this is owners, where 30% rate it highly.
■■ Contractors frequently are required to sign restrictions or limitations of liability as a condition of receiving models from others, whereas it is rare for designers. This explains why 43% of contractors rated this aspect highly.
as more firms exchange model files and rely on them for incremental work, the quality of the files and the way they are constructed becomes increasingly critical. for more information on industry initiatives to address model quality, see page 16 and the resources section on page 69.
User Ratings: Process continued
SmartMarket Report McGraw-Hill Construction 62 www.construction.com
Rating Specific Aspects of Models Created by Others
Source: McGraw-Hill Construction, 2012
EngineerArchitect Contractor Owner
41%
53%
81%
54%
38%
51%
77%
52%
40%
51%
69%
51%
42%
40%
58%
52%
38%
37%
35%
37%
48%
11%
14%
11%
20%
13%
30%
18%
Accuracy
Completeness
Quality
Overall Usefulness to Your Business Process
Proprietary Data Format Versus Interoperable Format
Required to Sign a Restrictions of Limitation or of Liability Document
Level of Development (LOD) Assigned to the Model
Highly Rated Aspects of Models Created by Others(High or Very High Rating)

Th
e B
us
ine
ss
Va
lue
of
BiM
in n
or
Th
aM
er
ica
: Mu
lTi-
Ye
ar
Tr
en
d a
na
lYs
is a
nd
us
er
ra
Tin
gs
(20
07–2
012)
da
ta contractors and design firms frequently leverage the powerful visualization capabilities of BiM for business purposes, but they mostly report receiving below-aver-age levels of value. analyzing the ratio between their frequency and value ratings for specific activities reveals some interesting trends.
■■ though the frequencies are similar, architect and engineer respondents find far greater value using BIM-generated visuals for conveying design intent than they do for expediting the design approval process, which would be a more tangible business-related impact.
■■ the lowest frequency for contractors is using BIM visuals to communicate construction process/prog-ress to owners, yet it has the only positive frequency/value ratio. This suggests that use of this activity can be expected to grow because of its effectiveness in keeping project teams coordinated and helping owners make better, more-informed decisions.
User Ratings: Process continued
McGraw-Hill Construction 63 www.construction.com SmartMarket Report
Use of BIM-Generated Visualization for Specific Processes
contractors, with the assistance of architects and engi-neers, are responsible for several close-out processes and many are finding ways to leverage models to increase efficiency.
■■ BIM is least actively used for punch list creation and management. however, as tablet compatibility with BiM increases, this process will certainly show growth.
■■ Using BIM for close-out submittals is three to four times more popular than punch lists. linking product
Using BIM for Project Close-Out Processes
Frequency/Value Ratios for SpecicUses of BIM-Generated VisualizationSource: McGraw-Hill Construction, 2012
10%
-10%
-30%
-10%
CONTRACTORS:Communicate Construction Process/Progress to Owners
CONTRACTORS:Communicate with Other Contractors/Fabricators
ARCHITECTS/ENGINEERS:Expediting Design Approvals
ARCHITECTS/ENGINEERS:Conveying Design Intent
High Frequency Use of BIM or Project Close-Out (by Firm Type)Source: McGraw-Hill Construction, 2012
As-Built Record Model Close-Out SubmittalsPunch-List
7%
4%
9%
22%
16%
17%
45%
34%
60%
46%
11% 34%
Owner
Contractor
Engineer
Architect
and material information to the objects in a model is a fundamental value proposition of BiM for operations & Maintenance (o&M)/facility Management (fM).
■■ as-built record models are increasingly required by owners. In fact, only 7% of BIM contractors report never being asked for one. This is the most-used BiM close-out process, and it is likely to become a fixture of BiM projects, especially as model standards for o&M/fM, such as coBie, are more fully deployed.

Th
e B
us
ine
ss
Va
lue
of
BiM
in n
or
Th
aM
er
ica
: Mu
lTi-
Ye
ar
Tr
en
d a
na
lYs
is a
nd
us
er
ra
Tin
gs
(20
07–2
012)
da
ta in general, far more money is spent operating, maintain-ing and managing a constructed asset over its lifecycle than is invested in its design and construction, which has made BiM for operations and maintenance (o&M) and facilities management (fM) a critical goal of virtual design and construction. increasingly, owners and project teams are embracing the view that design and construction is just the first part of the overall asset lifecycle, and that the people who will ultimately be responsible for the later phases should have input earlier.
however, at this point the activity level is still very low. The user ratings in this section and those that follow may be significant as a baseline against which to measure future progress in this needed area.
Perspectives from each firm type reveal that this factor matters most to owners:
■■ Owners perceive that O&M/FM staff are more involved in BIM compared to perceptions from the design and construction teams. This may result from internal brief-ings that the rest of the team does not attend.
■■ although everyone sees great value from O&M/FM staff involvement and believes it creates positive impact, owners are significantly more emphatic.
given the strong support by owners for their involve-ment, it is likely that o&M/fM participation will eventually become a standard feature of project process.
User Ratings: Process continued
SmartMarket Report McGraw-Hill Construction 64 www.construction.com
Operations and Maintenance/Facilities Management Staff Involvement with design
Use of Models for Operations and Maintenanceand Facilities Management Processes
the use of BIM for operations and maintenance (O&M) and facility management (FM) is an emerging prac-tice, with relatively few BIM owners engaged at high levels. as o&M/fM technology tools become better able
Frequency, Value and Impact ofMaintenance and Operations Staff Involved inDesign Review on BIM Projects Source: McGraw-Hill Construction, 2012
Value Index (0–10)Frequency Index (0–10)
Impact Index (1–10)
UR_DESIGNREVIEW_O&M
5.0
5.7
3.7
4.4
5.1
3.3
Architect
Engineer
4.7
5.6
3.1
Contractor
6.1
6.8
4.9
Owner
Percentage of Owners Frequently Using BIM for Operations and Maintenance (O&M) andFacilities Management (FM) Processes Source: McGraw-Hill Construction, 2012
18% 24% 24% 24% 32%Owner
Building SystemOperating Analysis
Space Managementand Tracking
Asset ManagementMaintenanceScheduling
Building PerformanceAgainst Speci�ed Design
to integrate with BiM data, and standards for turnover models become established, these are likely to become regular practices because the long term benefit to owners is so great.

Th
e B
us
ine
ss
Va
lue
of
BiM
in n
or
Th
aM
er
ica
: Mu
lTi-
Ye
ar
Tr
en
d a
na
lYs
is a
nd
us
er
ra
Tin
gs
(20
07–2
012)
Voice of the Industry: BIM Users Forecast Its Impact Over the Next Ten Years
BIM users forecasted the most influential impacts of BIM over the next ten years. Responses ranged across a variety of value propositions.
McGraw-HillConstruction 65 www.construction.com SmartMarket Report
Sidebar: Voice of the Industry
There was broad consensus around the positive impact of greater collaboration and integration on the entire
project delivery process, making it “more transparent and better, faster, safer, cheaper” for everyone, in the words of george Pontikes, president of satterfield & Pontikes construc-tion. Joseph Binning from MePcor foresees that “iPd will become the norm in our industry.”
analogies to other industries were also plentiful. according to Ben May, of May construction services, “We will take advantage of what the man-ufacturing sector has been enjoying for decades. That is...virtual design and troubleshooting, prefabrication and excellent onsite delivery, fit and finish for a better way to build!”
a number of users anticipate important changes in current project responsibilities. for example, chris-topher Wilkins, director of engineer-ing for hallam-ics and chairman of the ashrae BiM steering commit-tee predicts that BiM will “enable a/e firms or teams to take back respon-sibility for developing detailed coor-dinated designs instead of ceding coordination to contractors.”
Leveraging BIMleveraging BiM for green design was on many users’ minds. “Quantifica-tion of carbon footprint will begin to drive design decision making,” according to Tom nelson aia, prin-cipal with Mithun. he hopes BiM will produce “immediate quantification of the energy performance character-istics and material lifecycle impacts
of a building project as you design it”.cool technologies adapted for con-
struction were cited by several users, including Krupesh Kakkente, BiM Phoenix engineer at dPr construc-tion who identified “cheap interactive hologram technology” for the job-site, allowing trades to get “dimen-sions, connection details, etc. by interacting with the design model hologram in the field.”
Business ImpactBusiness impact on efficiency is widely anticipated. darren lewis, aia, director of design technology for lionakis is excited about “new heights of efficiency and agility from tying BiM data into business information systems. [it is] like having modeling activities automatically fill out time cards or the model knowing its own project schedule to provide progress reports that inform billing and staffing decisions.” Viktor Bullain, regional manager, Virtual design and construction for Turner construction company sees the entire industry becoming more productive through “the convergence of BiM and lean construction methodologies.”
Owners Critical RolePatrick Macleamy, ceo of hoK and chairman of buildingsMarT interna-tional predicted, “over the next ten years, building owners will demand ever-increasing usage of BiM as a precondition, ushering in a new era of accuracy, quality and sophistica-tion for the building industry.”
The importance of building
operations will also become paramount. Thomas strong, director of virtual construction for ellisdon believes “BiM will increase the owner’s return on investment by simulating the construction and subsequent operation of facilities virtually during design, to optimize and deliver predictable operations, reduce risk, provide cost certainty and reduce financial lending costs.” charles Matta, faia, deputy cio of gsa Public Buildings service goes even further, stating that “effectively employing BiM in the lifecycle management of a facility and real Property Portfolio will transform the industry in ways not seen since the introduction of elevators multiplied the number of floors in buildings.” n

Th
e B
us
ine
ss
Va
lue
of
BiM
in n
or
Th
aM
er
ica
: Mu
lTi-
Ye
ar
Tr
en
d a
na
lYs
is a
nd
us
er
ra
Tin
gs
(20
07–2
012) In 2009, much of the design and
construction community was still exploring the possible ben-efits of building information
modeling (BiM), but few had tackled its potential post-occupancy uses for operations and maintenance. That didn’t deter the university of Mas-sachusetts (uMass) Medical school when it set out to develop the albert sherman center, a new 516,000 sq.ft. research and education facility at its Worcester campus.
Through its ongoing construc-tion program, the school had begun to reap the benefits of BiM on recent projects through improved visual-ization, coordination and productiv-ity, but officials saw greater potential. John Baker, associate vice chancellor of facilities management at uMass Medical school, says the school had been operating on a computerized maintenance management system for nearly a decade when plans for the albert sherman center began
to take shape. he was interested in working with the build team to figure out how it could leverage data from digital as-built models to augment its facilities management (fM) capabili-ties. “i didn’t have the solutions, but i had the vision of the end product,” he adds.
The project team, which included architect arc/architectural resources cambridge and general contractor suffolk construction, had extensive knowledge of BiM, but neither had experience with providing data-rich models for facilities management.
Mark dolny, senior associate at arc, says that starting with the rfP process, Baker made it clear that he wanted to see digital integration of BiM data and facilities management data, rather than having rolls of draw-ings and binders of documents.
“early on, John was saying, ‘We want to be able to visualize the proj-ect by doing fly-throughs [during
design and construction], and we’re hoping this will be something we can use ourselves someday,’” he recalls. “We didn’t know what that meant at that time. it took a while after we were [awarded the contract] to understand that and figure out what they wanted from BiM.”
Owner-Driven Initiativeerik servies, assistant project man-ager with PMa consultants, the own-er’s representative, says that while there was a top-down directive to use BiM, it was not prescriptive. The team developed a BiM execution plan using consensusdocs 301 to make sure key players were working in BiM and BiM-related tools, but it kept the road map flexible. “We had a gen-eral vision of what we wanted and all agreed to work together as a team to define that as we went,” he says.
even though the fM model mis-sion wasn’t well defined at first, Tom Watson, BiM/Vdc director at suffolk construction, says the team aimed to “begin with the end in mind.” Watson says it was understood that any deliv-erable would need to be heavily coor-dinated and highly detailed.
Working closely with its major con-sultants, arc brought together 11 different models. in order to reduce rework, Watson says that suffolk took design models at roughly 80% completion to start producing its construction model. from there, the team began to populate the model with fabrication-level data. “as the approved shop drawings were val-idated, we enhanced the model to lod 400 or 500,” he adds.
Watson says finalizing the deliverable for facilities management was a nearly two-year process. ultimately, suffolk’s construction
While building the Albert Sherman Center, a new 516,000 sq.ft. research and education facility at The University of Massachusetts Medical School’s Worcester campus, the team developed a plan to leverage BIM data for facilities operation and maintenance.
case st
udy
Using BIM In Post-Construction Facility Management
Albert Sherman Center, University of Massachusetts Medical SchoolWorcester, MAssAchusetts
SmartMarket Report McGraw-Hill Construction 66 www.construction.com
continuedimag
e co
urte
sy o
f Suf
folk
con
stru
ctio
n c
ompa
ny

case st
udyT
he
Bu
sin
es
s V
alu
e o
f B
iM in
no
rT
h a
Me
ric
a: M
ulT
i-Y
ea
r T
re
nd
an
alY
sis
an
d u
se
r r
aT
ing
s (
2007
–201
2)
McGraw-Hill Construction 67 www.construction.com SmartMarket Report
imag
es c
ourt
esy
of S
uffo
lk c
onst
ruct
ion
com
pany
model serves as the basis for the digital as-built models handed over to the client. The build team decided that a full-BiM model was too complex of a database for facility use, so a simpler model will be provided with appropriate fM-data, he says. “it’s a much more lightweight environment,” he adds.
Facilities Management Capabilitiesoperations and maintenance staff will be able to use 3d models to visu-alize all major aspects of the facil-ity for planning, asset management, scheduling and analysis. users can type in a room number, then isolate everything attached to that room. users can then select objects and bring up a control panel with infor-mation about that object. “We came up with about ten essential pieces of information that objects should have and wrote a script to pull that from the model,” Watson says.
Because the model has intelligent volumes, users will be able to sched-ule and track everything.
The model is also able to aid in system analysis. The model con-tains balanced airflow and water-flow data, and users can run capacity testing. “if they need to do a renova-tion in the future, they could look at this model and see that they need an additional 10,000 [cubic feet/minute] in a particular spot,” he says.
in the electrical systems, users could conduct circuit scheduling, lighting schedules by circuit and access facilities information by lighting type.
although the build team has worked closely with the facilities manage-ment staff to make the model as intui-tive as possible, uMass staff will need to be trained to use it. Baker is confi-dent it will become a commonly used tool over time. “When we first installed our computerized maintenance man-agement system over ten years ago, people said they wouldn’t use it,” he recalls. “We changed that mentality within a few years and now that’s how we do all work orders. i see this the same way. When our guys see the ben-efits, they will use it.”
While the basic deliverables have been determined, forward-look-ing questions remain. The model shows as-built conditions, so the fM staff will need to decide how to keep the model up to date as the build-ing undergoes any system modifi-cations or renovations. The model is also not currently linked to the exist-ing building automation system, but the department may look into that in the future.
“This is the first step in an evolution,” Baker says. “We’ll get there.” n
Albert Sherman Center, University of Massachusetts Medical School
Worcester, MAssAchusetts
Project Facts and Figures
Construction Managersuffolk construction
Architectarc/architectural resources cambridge
Owner’s RepresentativePMa consultants
Construction Startseptember 2009
Occupancyspring 2013
Type of Projectresearch and education facility
Size516,000 sq.ft.
Green Goalleed silver certification
Cost$400 million
stats
continued
Facilities management will be able to refer-ence models (left) as well as the properties of its elements (above).

Th
e B
us
ine
ss
Va
lue
of
BiM
in n
or
Th
aM
er
ica
: Mu
lTi-
Ye
ar
Tr
en
d a
na
lYs
is a
nd
us
er
ra
Tin
gs
(20
07–2
012)
SmartMarket Report McGraw-Hill Construction 68 www.construction.com
This study builds and expands upon the Building information Model-ing study conducted in 2009 by Mcgraw-hill construction to assess adoption of BiM across the con-struction industry and to gauge the perception of value that firms are receiving by implementing BiM. The research in this report was con-ducted through an internet survey of industry professionals between august 2 and september 18, 2012. The survey was open to construction industry professionals who classified as either BiM users or BiM non-users based on how they responded to a question about BiM engagement. The total sample size (582) used in this sample benchmarks at a 95% confidence interval with a margin of error of less than 5% for categoriz-ing respondents as BiM users or BiM non-users.
BIM Definitionfor the purpose of the survey BiM was defined as the creation and use of digital models and related collaborative processes between companies to leverage the value of the models.
Practitioners or users are individuals who are authoring and/or using models or deriving direct benefit from the use of models by others (e.g., owners).
Survey SampleThe survey sample was drawn from the following:
■■ Player data from the Dodge data-base of construction projects
■■ Participation by ten associations who sent the survey link to their members, including AGC, AIA, ASA, ASCE, CMAA, COAA, DBIA, NIBS, SMACNA and SMPS.
BIM in North America Study Research
Methodology:
Respondents by PlayerThe survey had 582 complete responses. for comparison to 2009 data, the player categories are defined as follows:
■■ 179 architects (30.8%)■■ 111 engineers (19.1%)■■ 208 contractors (35.7%)■■ 36 owners (6.2%)■■ 48 other (8.2%) industry respondents
Respondents by Size of FirmThe distribution by size of firms was 33% small firms, 31% small to medium firms, 15% medium to large firms and 21% large firms, with the following definitions of firm size:
■■ Architect and Engineer: 2011 Billings• Small firms: Less than $500,00• Small to medium firms: $500,000
to less than $5 million• Medium to large firms: $5 million
to less than $10 million• Large firms: $10 million or more
■■ Contractors and Owners: 2011 Revenue• Small firms: Less than $25 million• Small to medium firms: $25 million
to less than $100 million• Medium to large firms: $100
million to less than $500 million• Large firms: $500 million or more
Respondents by RegionThe respondents’ offices were distributed across the four u.s. census regions as follows:
■■ Northeast: 16%■■ Midwest: 25%■■ South: 30%■■ West: 24%
5% of the respondents were from outside the u.s.
Indexes Used for Analysis
EngagEmEnt IndExfor the purpose of analysis a new engagement index was created for this report. Please see page 8 for information on how the new index was calculated.
IndExEs UsEd to analyzE thE UsEr ratIngs rEsEarchMcgraw-hill construction developed weighted indexes on a 1–10 scale for each BiM activity and process.
■■ Frequency Index: How often BIM users use BIM for an activity or a process
■■ Value Index: The level of value that the user received from use of BIM for an activity or process
■■ Difficulty Index: The degree of diffi-culty in achieving value from the use of BIM for an activity or process
■■ Impact Index: The beneficial impact that using BIM has on a process
ValUE/dIffIcUlty ratIoThe ratio is created by dividing the Value index by the difficulty index, and demonstrates how valuable certain BiM activities are relative to how hard they are to do. The ratio is based on a scale where zero means the value and difficulty are equal. The ratio score for each activity is the percentage above or below that zero equilibrium point.
a positive Value/difficulty ratio means an activity is relatively easy to do and creates a lot of value. some activities such as spatial coordination have positive ratios as high as 60%.
a negative ratio means an activity is harder to do than the value it generates. some of the most challenging activities have negative ratios as low as -30%. n

SmartMarket Report
Produced with support from
ResourcesOrganizations, websites and publications that can help you get smarter about building information modeling.
ACKNOWLEDGEMENTS:
The authors wish to thank our premier partner Autodesk and corporate partner Parsons for helping us bring this information to the market. We also thank our contributing partners for supporting this effort.
We would also like to thank John Cross of American Institute of Steel Construc-tion; Deke Smith of the buildingSMART alliance; Charles Eastman of Georgia Institute of Technology; Patrick MacLeamy of HOK; and Phil Bernstein of Autodesk for their willingness to be interviewed for this report. We would also like to thank all of our association research partners who helped us dissemi-nate the survey to their members. Finally, we would like to thank the hundreds of firms that responded to the survey and those that provided information about their projects and experiences with BIM for our case studies as well as for their assistance in helping us secure images to supplement their project information.
Premier PartnerAutodesk: autodesk.com
Corporate PartnerParsons: parsons.com
Contributing PartnersBarton Malow: bartonmalow.comBIMForum: bimforum.orgbuildingSMART alliance: buildingsmartalliance.orgCADsoft Consulting: cadsoft-consult.comCharles Pankow Foundation: pankowfoundation.orgClark Construction: clarkconstruction.comHensel Phelps: henselphelps.comHOK: hok.comMortenson Construction: mortenson.comPinnacle Infotech: pinnaclecad.comSatterfield & Pontikes Construction, Inc.: satpon.comtechsuite: willscot.com/techsuite
Research PartnersThe American Institute of Architects: aia.orgAmerican Institute of Steel Construction: aisc.orgAmerican Subcontractors Association: asaonline.comAmerican Society of Civil Engineers: asce.orgAmerican Society of Professional
Estimators: www.aspenational.orgConstruction Management Association
of America: cmaanet.orgConstruction Owners Association of America: coaa.orgConstruction Specifiers Institute: csinet.orgConstruction Users Round Table: curt.orgDesign-Build Institute of America: dbia.orgSheet Metal and Air Conditioning Contractors’
National Association: smacna.orgSociety for Marketing Professional Services: smps.org
McGraw Hill Construction
Main Website: construction.comDodge: construction.com/dodgeResearch & Analytics: construction.com/dodge/dodge-market-researchAchitectural Record: archrecord.comEngineering News-Record: enr.comGreenSource: greensourcemag.comSweets: sweets.comSmartMarket/Industry Insights Reports: construction.com/market_research
Autodesk
www.autodesk.comParsons
www.parsons.com

McGraw-Hill Construction SmartMarket Reports™
Get smart about the latest industry trends.For more information on these reports and others, visit
www.construction.com ⁄market_research
www.construction.com
■ Design and Construction Intelligence
SmartMarket Report
Association Research Partners: